III . WaSTE maNagEmENT - United · PDF fileIII . WaSTE maNagEmENT. ... Pakistan, and India,...
10
WASTE MANAGEMENT << 26 >> III WASTE MANAGEMENT Economic growth, urbanisation and industrialisation result in increasing volumes and varieties of both solid and hazardous wastes. Globalisation can aggravate waste problems through grow- ing international waste trade, with developing countries often at the receiving end. Besides negative impacts on health as well as increased pollution of air, land and water, ineffective and inefficient waste management results in greenhouse gas and toxic emissions, and the loss of precious materials and resources. An integrated waste management approach is a crucial part of interna- tional and national sustainable development strategies. In a life-cycle per- spective, waste prevention and minimization generally have priority. The remaining solid and hazardous wastes need to be managed with effective and efficient measures, including improved reuse, recycling and recovery of useful materials and energy. The 3R concept (Reduce, Reuse, Recycle) encapsulates well this life-cycle approach to waste. Pollution is nothing but the resources we are not harvesting. We allow them to disperse because we’ve been ignorant of their value. — R. Buckminster Fuller Scientist (1895–1983)
Transcript of III . WaSTE maNagEmENT - United · PDF fileIII . WaSTE maNagEmENT. ... Pakistan, and India,...
WaSTE maNagEmENT << 26 >>
III . WaSTE maNagEmENT
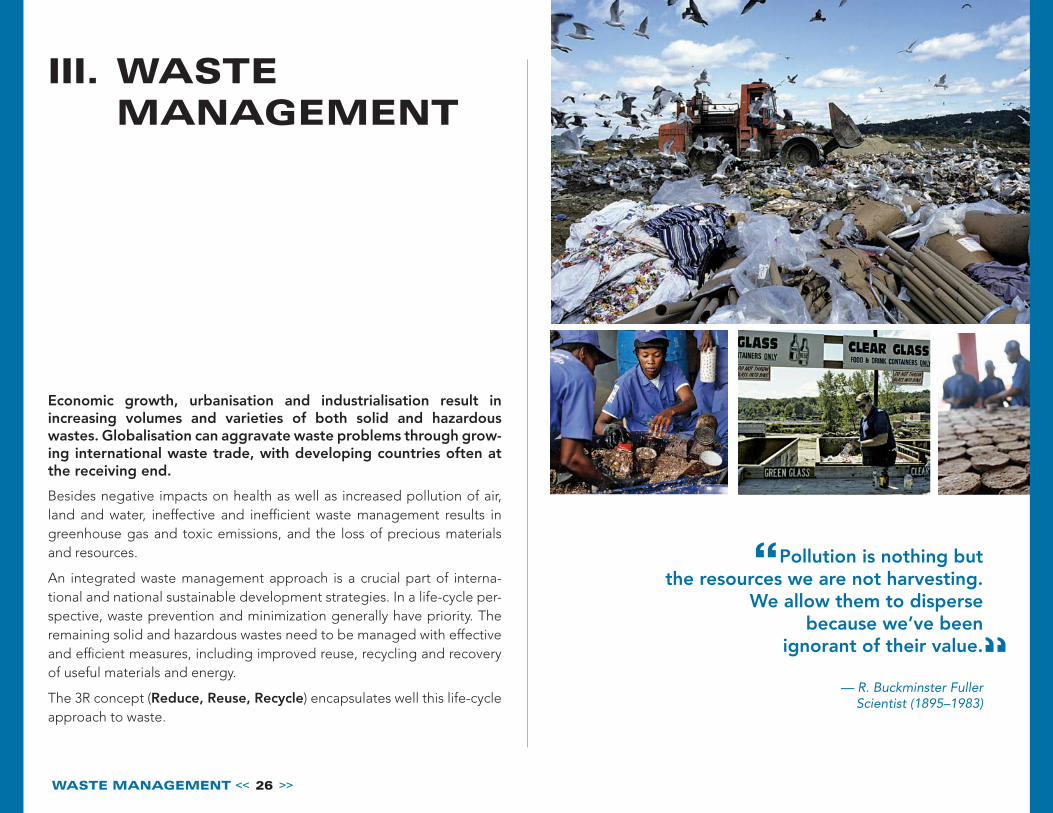
Economic growth, urbanisation and industrialisation result in increasing volumes and varieties of both solid and hazardous wastes. Globalisation can aggravate waste problems through growing international waste trade, with developing countries often at the receiving end.
Besides negative impacts on health as well as increased pollution of air, land and water, ineffective and inefficient waste management results in greenhouse gas and toxic emissions, and the loss of precious materials and resources.
An integrated waste management approach is a crucial part of interna-tional and national sustainable development strategies. In a life-cycle per-spective, waste prevention and minimization generally have priority. The remaining solid and hazardous wastes need to be managed with effective and efficient measures, including improved reuse, recycling and recovery of useful materials and energy.
The 3R concept (Reduce, Reuse, Recycle) encapsulates well this life-cycle approach to waste.
Pollution is nothing but the resources we are not harvesting.
We allow them to disperse because we’ve been
ignorant of their value.
— R. Buckminster Fuller Scientist (1895–1983)
WaSTE maNagEmENT << 27 >>
A growing share of municipal waste contains hazardous electronic or electric products. In Europe ewaste is increasing by 3–5 per cent per year.
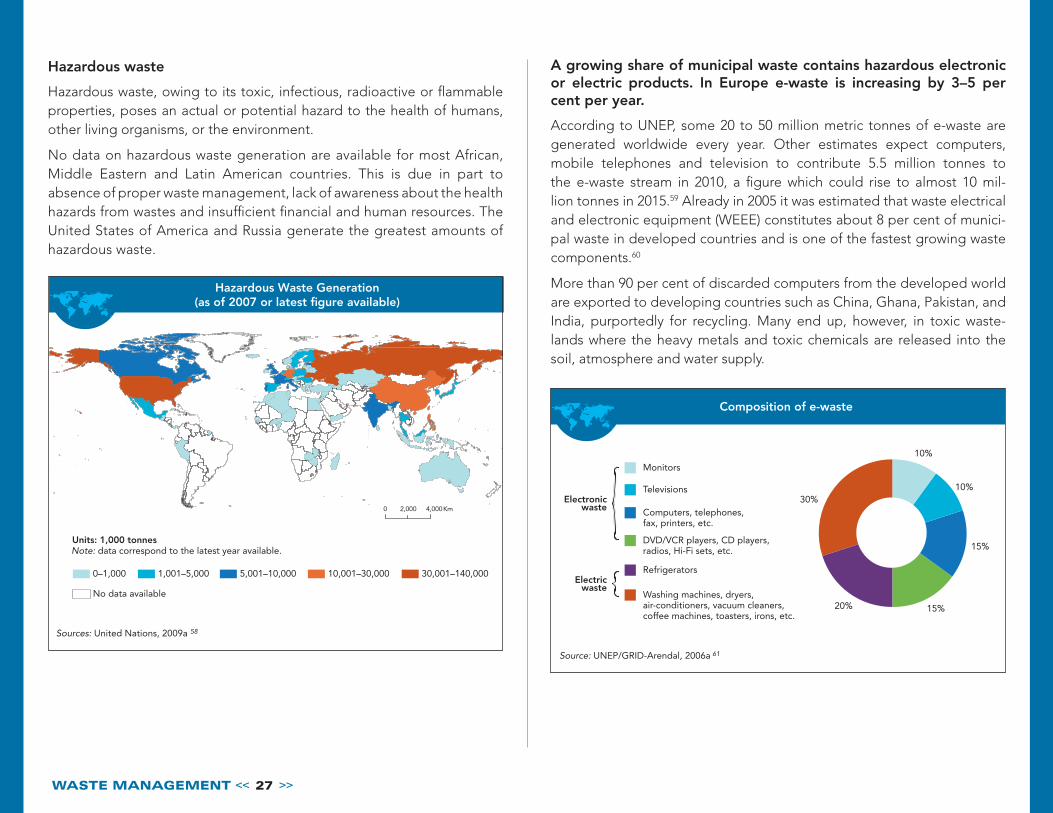
According to UNEP, some 20 to 50 million metric tonnes of e-waste are generated worldwide every year. Other estimates expect computers, mobile telephones and television to contribute 5.5 million tonnes to the e-waste stream in 2010, a figure which could rise to almost 10 mil-lion tonnes in 2015.59 Already in 2005 it was estimated that waste electrical and electronic equipment (WEEE) constitutes about 8 per cent of munici-pal waste in developed countries and is one of the fastest growing waste components.60
More than 90 per cent of discarded computers from the developed world are exported to developing countries such as China, Ghana, Pakistan, and India, purportedly for recycling. Many end up, however, in toxic waste-lands where the heavy metals and toxic chemicals are released into the soil, atmosphere and water supply.
Hazardous Waste Generation(as of 2007 or latest figure available)
Sources: United Nations, 2009a 58
Note: data correspond to the latest year available.Units: 1,000 tonnes
0–1,000 1,001–5,000 5,001–10,000 10,001–30,000 30,001–140,000
No data available
0 4,0002,000 Km
Hazardous waste
Hazardous waste, owing to its toxic, infectious, radioactive or flammable properties, poses an actual or potential hazard to the health of humans, other living organisms, or the environment.
No data on hazardous waste generation are available for most African, Middle Eastern and Latin American countries. This is due in part to absence of proper waste management, lack of awareness about the health hazards from wastes and insufficient financial and human resources. The United States of America and Russia generate the greatest amounts of hazardous waste.
10%
10%
15%
15%20%
30%
Composition of e-waste
Source: UNEP/GRID-Arendal, 2006a 61
Monitors
Televisions
Computers, telephones, fax, printers, etc.
DVD/VCR players, CD players, radios, Hi-Fi sets, etc.
Washing machines, dryers,air-conditioners, vacuum cleaners, coffee machines, toasters, irons, etc.
RefrigeratorsElectric
waste
Electronicwaste
WaSTE maNagEmENT << 28 >>
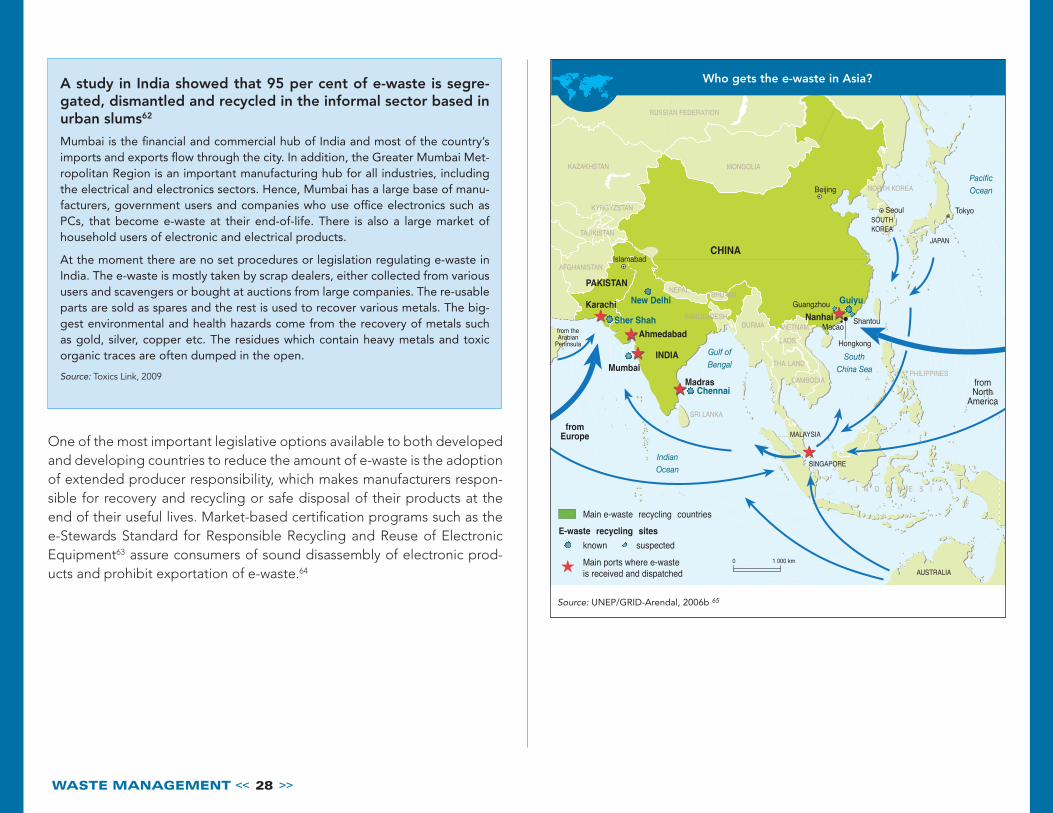
Who gets the e-waste in Asia?
Source: UNEP/GRID-Arendal, 2006b 65
A study in India showed that 95 per cent of ewaste is segregated, dismantled and recycled in the informal sector based in urban slums62
Mumbai is the financial and commercial hub of India and most of the country’s imports and exports flow through the city. In addition, the Greater Mumbai Met-ropolitan Region is an important manufacturing hub for all industries, including the electrical and electronics sectors. Hence, Mumbai has a large base of manu-facturers, government users and companies who use office electronics such as PCs, that become e-waste at their end-of-life. There is also a large market of household users of electronic and electrical products.
At the moment there are no set procedures or legislation regulating e-waste in India. The e-waste is mostly taken by scrap dealers, either collected from various users and scavengers or bought at auctions from large companies. The re-usable parts are sold as spares and the rest is used to recover various metals. The big-gest environmental and health hazards come from the recovery of metals such as gold, silver, copper etc. The residues which contain heavy metals and toxic organic traces are often dumped in the open.
Source: Toxics Link, 2009
One of the most important legislative options available to both developed and developing countries to reduce the amount of e-waste is the adoption of extended producer responsibility, which makes manufacturers respon-sible for recovery and recycling or safe disposal of their products at the end of their useful lives. Market-based certification programs such as the e-Stewards Standard for Responsible Recycling and Reuse of Electronic Equipment63 assure consumers of sound disassembly of electronic prod-ucts and prohibit exportation of e-waste.64
WaSTE maNagEmENT << 29 >>
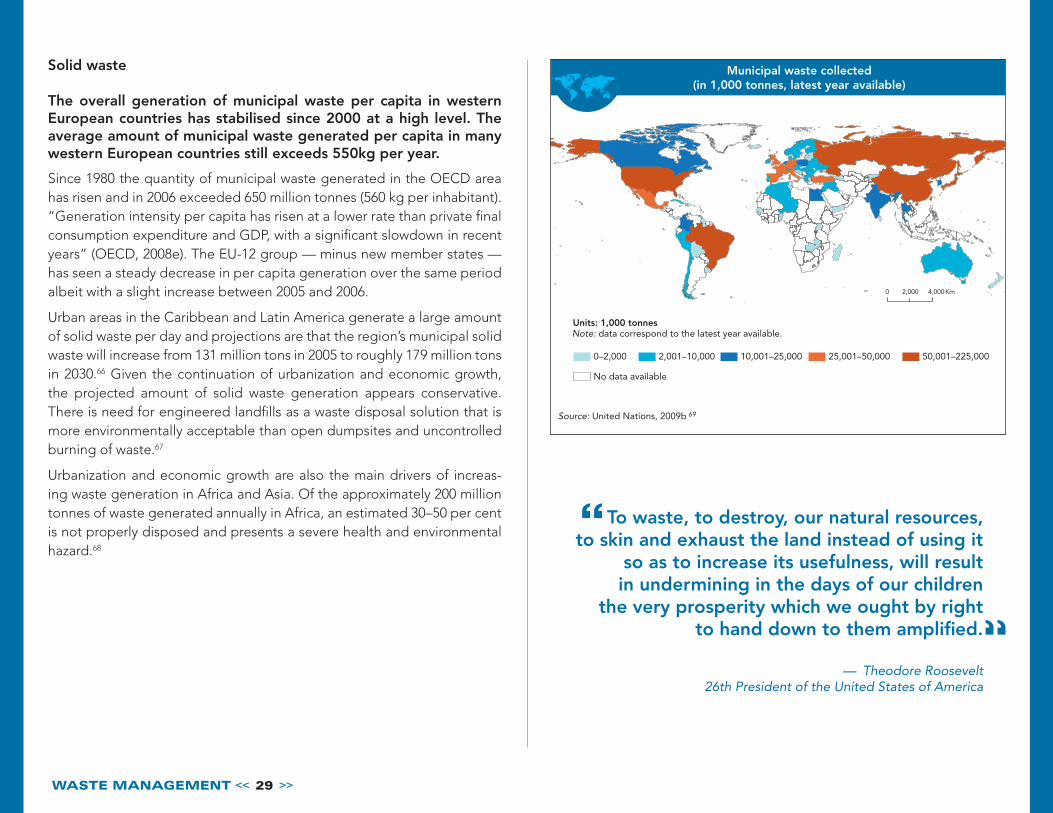
Municipal waste collected(in 1,000 tonnes, latest year available)
Source: United Nations, 2009b 69
Note: data correspond to the latest year available.Units: 1,000 tonnes
0–2,000 2,001–10,000 10,001–25,000 25,001–50,000 50,001–225,000
No data available
0 4,0002,000 Km
Solid waste
The overall generation of municipal waste per capita in western European countries has stabilised since 2000 at a high level. The average amount of municipal waste generated per capita in many western European countries still exceeds 550kg per year.
Since 1980 the quantity of municipal waste generated in the OECD area has risen and in 2006 exceeded 650 million tonnes (560 kg per inhabitant). “Generation intensity per capita has risen at a lower rate than private final consumption expenditure and GDP, with a significant slowdown in recent years” (OECD, 2008e). The EU-12 group — minus new member states — has seen a steady decrease in per capita generation over the same period albeit with a slight increase between 2005 and 2006.
Urban areas in the Caribbean and Latin America generate a large amount of solid waste per day and projections are that the region’s municipal solid waste will increase from 131 million tons in 2005 to roughly 179 million tons in 2030.66 Given the continuation of urbanization and economic growth, the projected amount of solid waste generation appears conservative. There is need for engineered landfills as a waste disposal solution that is more environmentally acceptable than open dumpsites and uncontrolled burning of waste.67
Urbanization and economic growth are also the main drivers of increas-ing waste generation in Africa and Asia. Of the approximately 200 million tonnes of waste generated annually in Africa, an estimated 30–50 per cent is not properly disposed and presents a severe health and environmental hazard.68
To waste, to destroy, our natural resources, to skin and exhaust the land instead of using it
so as to increase its usefulness, will result in undermining in the days of our children
the very prosperity which we ought by right to hand down to them amplified.
— Theodore Roosevelt 26th President of the United States of America
WaSTE maNagEmENT << 30 >>
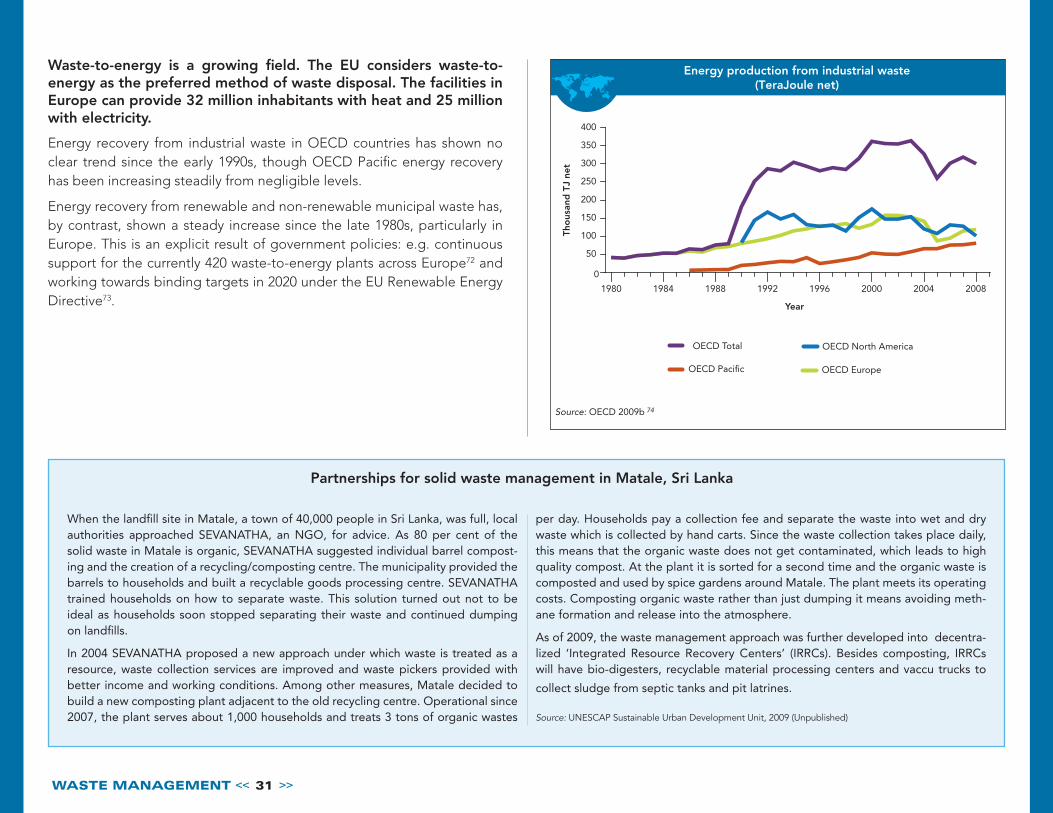
Amounts of waste generation by sector 2006-2008
36 Mt
629 Mt
629 Mt
619 Mt
327 Mt
161 Mt92 Mt
68 Mt
Source: Calculations based on data from OECD, 2008d 71
Manufacturing
Mining and quarrying
Agriculture and forestry
Other
Construction
Municipal waste
Energy production
Water purification
Million tonnes (Mt)
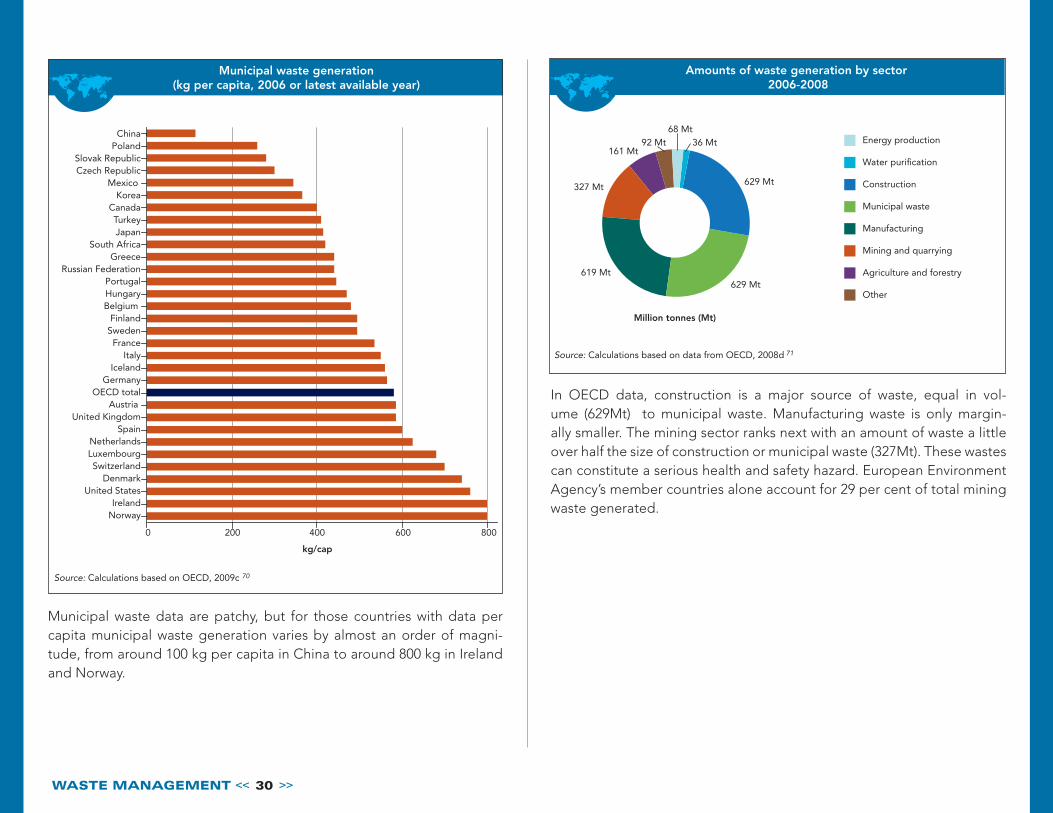
Municipal waste generation(kg per capita, 2006 or latest available year)
Source: Calculations based on OECD, 2009c 70
ChinaPoland
Slovak RepublicCzech Republic
Mexico Korea
CanadaTurkeyJapan
South AfricaGreece
Russian FederationPortugalHungaryBelgium
FinlandSwedenFrance
ItalyIceland
GermanyOECD total
Austria United Kingdom
SpainNetherlandsLuxembourgSwitzerland
DenmarkUnited States
IrelandNorway
0 200 400 600 800
kg/cap
Municipal waste data are patchy, but for those countries with data per capita municipal waste generation varies by almost an order of magni-tude, from around 100 kg per capita in China to around 800 kg in Ireland and Norway.
In OECD data, construction is a major source of waste, equal in vol-ume (629Mt) to muni cipal waste. Manufacturing waste is only margin-ally smaller. The mining sector ranks next with an amount of waste a little over half the size of construction or municipal waste (327Mt). These wastes can constitute a serious health and safety hazard. European Environment Agency’s member countries alone account for 29 per cent of total mining waste generated.
WaSTE maNagEmENT << 31 >>
When the landfill site in Matale, a town of 40,000 people in Sri Lanka, was full, local authorities approached SEVANATHA, an NGO, for advice. As 80 per cent of the solid waste in Matale is organic, SEVANATHA suggested individual barrel compost-ing and the creation of a recycling/composting centre. The municipality provided the barrels to households and built a recyclable goods processing centre. SEVANATHA trained households on how to separate waste. This solution turned out not to be ideal as households soon stopped separating their waste and continued dumping on landfills.
In 2004 SEVANATHA proposed a new approach under which waste is treated as a resource, waste collection services are improved and waste pickers provided with better income and working conditions. Among other measures, Matale decided to build a new composting plant adjacent to the old recycling centre. Operational since 2007, the plant serves about 1,000 households and treats 3 tons of organic wastes
per day. Households pay a collection fee and separate the waste into wet and dry waste which is collected by hand carts. Since the waste collection takes place daily, this means that the organic waste does not get contaminated, which leads to high quality compost. At the plant it is sorted for a second time and the organic waste is composted and used by spice gardens around Matale. The plant meets its operating costs. Composting organic waste rather than just dumping it means avoiding meth-ane formation and release into the atmosphere.
As of 2009, the waste management approach was further developed into decentra-lized ‘Integrated Resource Recovery Centers’ (IRRCs). Besides composting, IRRCs will have bio-digesters, recyclable material processing centers and vaccu trucks to
collect sludge from septic tanks and pit latrines.
Source: UNESCAP Sustainable Urban Development Unit, 2009 (Unpublished)
Partnerships for solid waste management in Matale, Sri Lanka
50
100
150
200
250
300
350
400
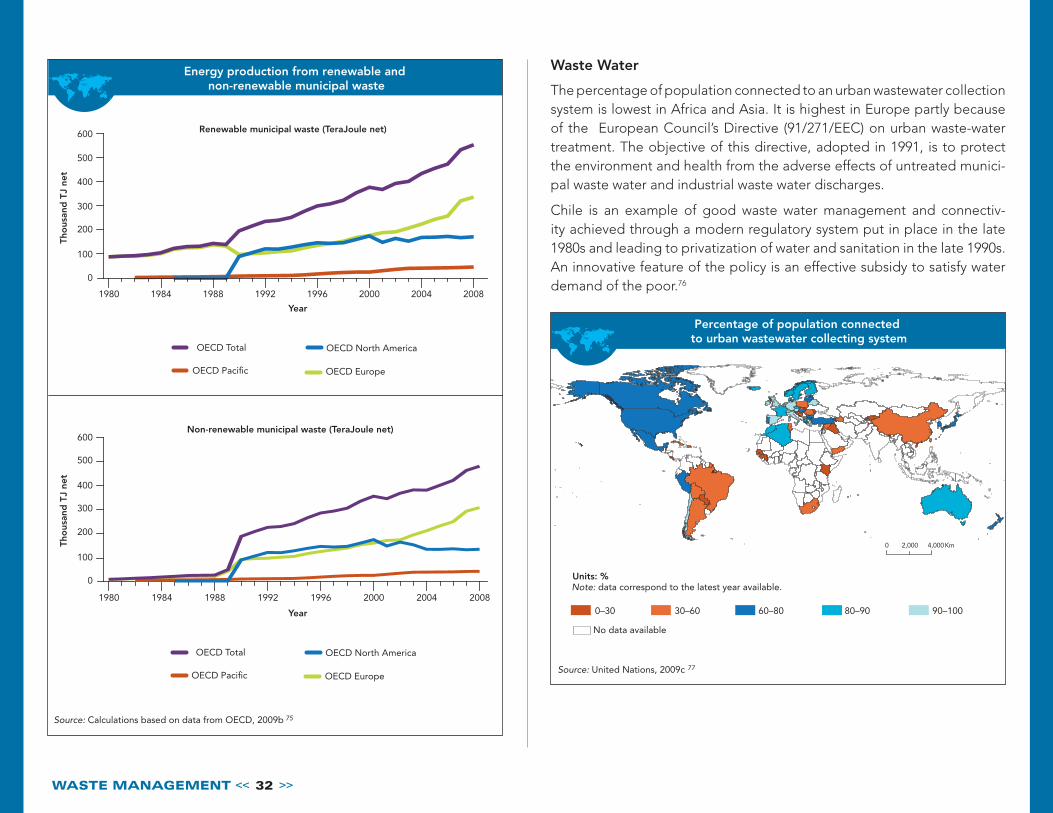
Energy production from industrial waste (TeraJoule net)
Tho
usan
d T
J ne
t
Source: OECD 2009b 74
0
1980 1984 1988 1992 1996 2000 2004 2008
OECD North America
OECD Pacific OECD Europe
OECD Total
Year
Wastetoenergy is a growing field. The EU considers wastetoenergy as the preferred method of waste disposal. The facilities in Europe can provide 32 million inhabitants with heat and 25 million with electricity.
Energy recovery from industrial waste in OECD countries has shown no clear trend since the early 1990s, though OECD Pacific energy recovery has been increasing steadily from negligible levels.
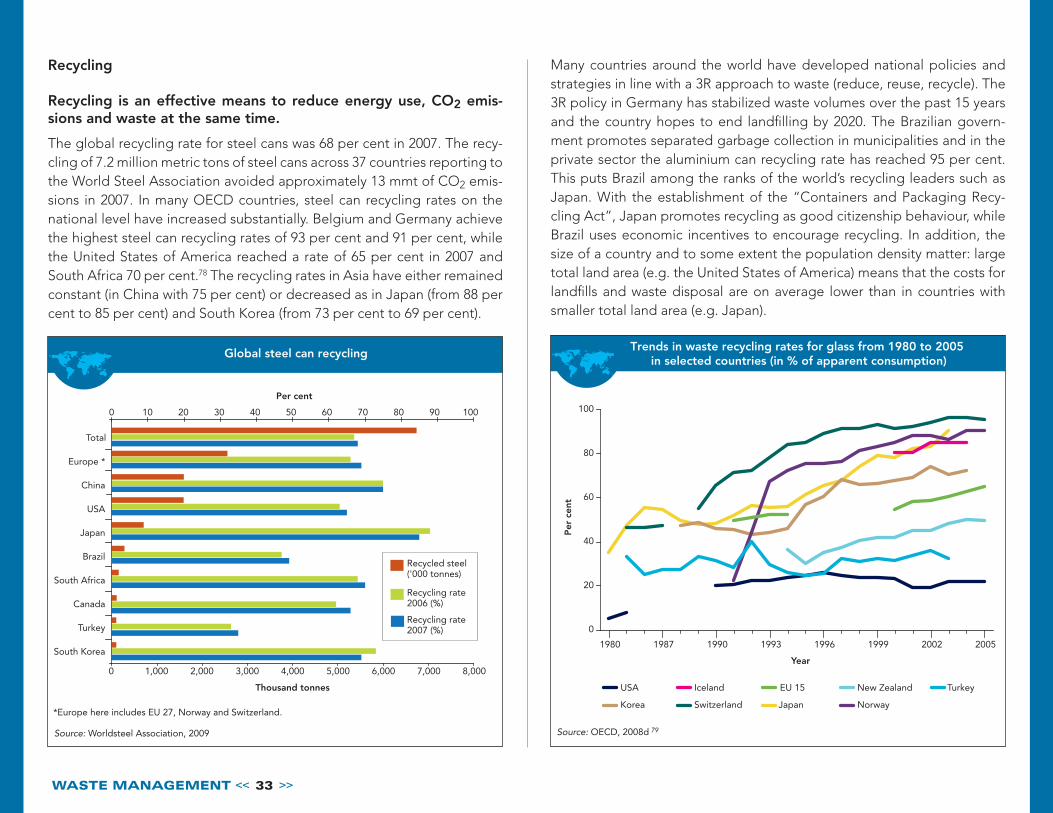
Energy recovery from renewable and non-renewable municipal waste has, by contrast, shown a steady increase since the late 1980s, particularly in Europe. This is an explicit result of government policies: e.g. continuous support for the currently 420 waste-to-energy plants across Europe72 and working towards binding targets in 2020 under the EU Renewable Energy Directive73.
WaSTE maNagEmENT << 32 >>
Energy production from renewable and non-renewable municipal waste
Renewable municipal waste (TeraJoule net)
Non-renewable municipal waste (TeraJoule net)
Source: Calculations based on data from OECD, 2009b 75
1980 1984 1988 1992 1996 2000 2004 2008
100
200
300
400
500
600
0
1980 1984 1988 1992 1996 2000 2004 2008
100
200
300
400
500
600
0
Tho
usan
d T
J ne
t
Year
Year
Tho
usan
d T
J ne
t
OECD North America
OECD Pacific OECD Europe
OECD Total
OECD North America
OECD Pacific OECD Europe
OECD Total
Percentage of population connected to urban wastewater collecting system
0 4,0002,000 Km
0–30 30–60 60–80 80–90 90–100
Source: United Nations, 2009c 77
Note: data correspond to the latest year available.Units: %
No data available
Waste Water
The percentage of population connected to an urban wastewater collection system is lowest in Africa and Asia. It is highest in Europe partly because of the European Council’s Directive (91/271/EEC) on urban waste-water treatment. The objective of this directive, adopted in 1991, is to protect the environment and health from the adverse effects of untreated munici-pal waste water and industrial waste water discharges.
Chile is an example of good waste water management and connectiv-ity achieved through a modern regulatory system put in place in the late 1980s and leading to privatization of water and sanitation in the late 1990s. An innovative feature of the policy is an effective subsidy to satisfy water demand of the poor.76
WaSTE maNagEmENT << 33 >>
Trends in waste recycling rates for glass from 1980 to 2005 in selected countries (in % of apparent consumption)
Source: OECD, 2008d 79
0
20
40
60
80
100
1980 1987 1990 1993 1996 1999 2002 2005
USA
JapanKorea
New ZealandIceland
NorwaySwitzerland
TurkeyEU 15
Per
cen
t
Year
Global steel can recycling
Source: Worldsteel Association, 2009
0 1,000 2,000 3,000 4,000 5,000 6,000 7,000 8,000
South Korea
Turkey
Canada
South Africa
Brazil
Japan
USA
China
Europe *
Total
0 10 20 30 40 50 60 70 80 90 100
Recycled steel ('000 tonnes)
Recycling rate 2006 (%)
Recycling rate 2007 (%)
*Europe here includes EU 27, Norway and Switzerland.
Per cent
Thousand tonnes
Recycling
Recycling is an effective means to reduce energy use, CO2 emissions and waste at the same time.
The global recycling rate for steel cans was 68 per cent in 2007. The recy-cling of 7.2 million metric tons of steel cans across 37 countries reporting to the World Steel Association avoided approximately 13 mmt of CO2 emis-sions in 2007. In many OECD countries, steel can recycling rates on the national level have increased substantially. Belgium and Germany achieve the highest steel can recycling rates of 93 per cent and 91 per cent, while the United States of America reached a rate of 65 per cent in 2007 and South Africa 70 per cent.78 The recycling rates in Asia have either remained constant (in China with 75 per cent) or decreased as in Japan (from 88 per cent to 85 per cent) and South Korea (from 73 per cent to 69 per cent).
Many countries around the world have developed national policies and strategies in line with a 3R approach to waste (reduce, reuse, recycle). The 3R policy in Germany has stabilized waste volumes over the past 15 years and the country hopes to end landfilling by 2020. The Brazilian govern-ment promotes separated garbage collection in municipalities and in the private sector the aluminium can recycling rate has reached 95 per cent. This puts Brazil among the ranks of the world’s recycling leaders such as Japan. With the establishment of the “Containers and Packaging Recy-cling Act”, Japan promotes recycling as good citizenship behaviour, while Brazil uses economic incentives to encourage recycling. In addition, the size of a country and to some extent the population density matter: large total land area (e.g. the United States of America) means that the costs for landfills and waste disposal are on average lower than in countries with smaller total land area (e.g. Japan).
WaSTE maNagEmENT << 34 >>
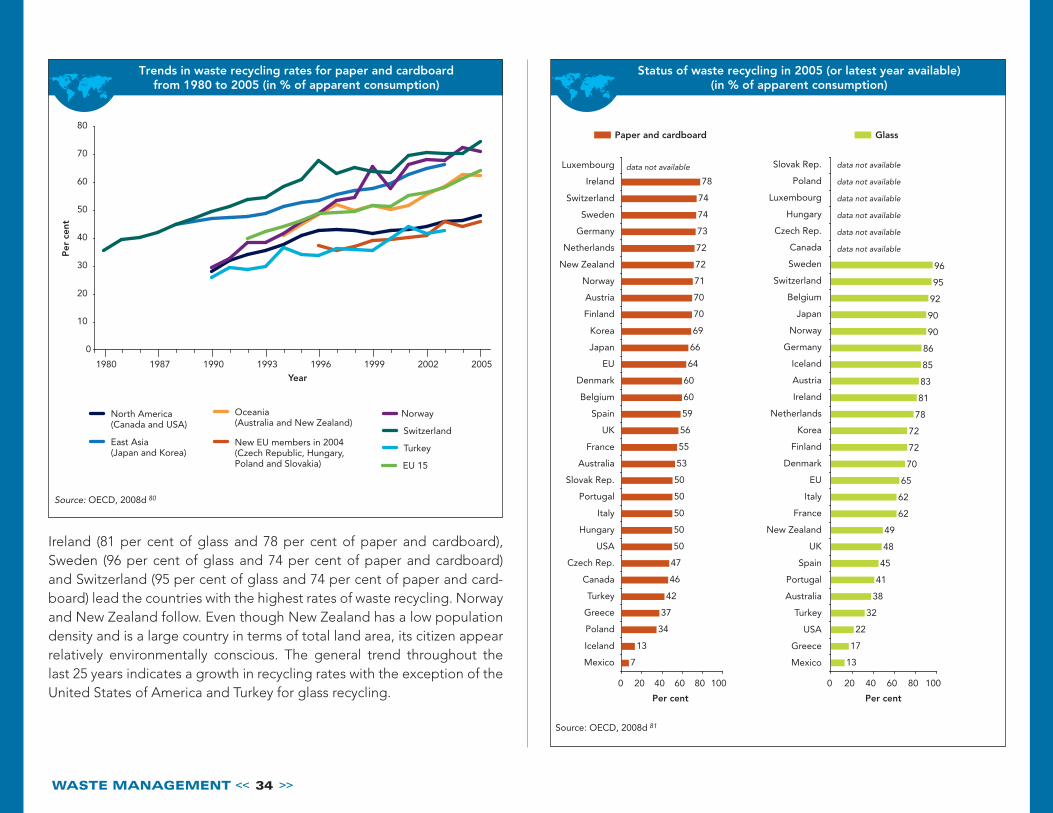
Status of waste recycling in 2005 (or latest year available)(in % of apparent consumption)
Source: OECD, 2008d 81
Paper and cardboard
7
13
34
37
42
46
47
50
50
50
50
50
53
55
56
59
60
60
64
66
69
70
70
71
72
72
73
74
74
78
0 20 40 60 80 100
Mexico
Iceland
Per cent Per cent
Poland
Greece
Turkey
Canada
Czech Rep.
USA
Hungary
Italy
Portugal
Slovak Rep.
Australia
France
UK
Spain
Belgium
data not available
data not available
data not available
data not available
data not available
data not available
data not available
Denmark
EU
Japan
Korea
Finland
Austria
Norway
New Zealand
Netherlands
Germany
Sweden
Switzerland
Ireland
Luxembourg
Glass
13
17
22
32
38
41
45
48
49
62
62
65
70
72
72
78
81
83
85
86
90
90
92
95
96
0 20 40 60 80 100
Mexico
Greece
USA
Turkey
Australia
Portugal
Spain
UK
New Zealand
France
Italy
EU
Denmark
Finland
Korea
Netherlands
Ireland
Austria
Iceland
Germany
Norway
Japan
Belgium
Switzerland
Sweden
Canada
Czech Rep.
Hungary
Luxembourg
Poland
Slovak Rep.
Trends in waste recycling rates for paper and cardboardfrom 1980 to 2005 (in % of apparent consumption)
Source: OECD, 2008d 80
0
10
20
30
40
50
60
70
80
North America (Canada and USA)
East Asia (Japan and Korea)
Oceania (Australia and New Zealand)
New EU members in 2004 (Czech Republic, Hungary, Poland and Slovakia)
Norway
Switzerland
Turkey
EU 15
1980 1987 1990 1993 1996 1999 2002 2005
Per
cen
t
Year
Ireland (81 per cent of glass and 78 per cent of paper and cardboard), Sweden (96 per cent of glass and 74 per cent of paper and cardboard) and Switzerland (95 per cent of glass and 74 per cent of paper and card-board) lead the countries with the highest rates of waste recycling. Norway and New Zealand follow. Even though New Zealand has a low population density and is a large country in terms of total land area, its citizen appear relatively environmentally conscious. The general trend throughout the last 25 years indicates a growth in recycling rates with the exception of the United States of America and Turkey for glass recycling.
WaSTE maNagEmENT << 35 >>
As defined by the Grass Roots Recycling Network, Zero Waste includes recycling but goes beyond to address the reduction of “upstream” waste created through mining, extraction, and manufacturing of products. Zero waste maximizes recycling, minimizes waste, reduces consumption and encourages the development of products that are made to be reused, repaired or recycled back into nature or the marketplace.
Achieving zero waste by 2030 is an expressed goal of Los Angeles and is consistent with its goal to be a sustainable city. For the first time in the history of solid waste planning within the city, Los Angeles is developing a Solid Waste Integrated Resources Plan. This plan seeks input from stakeholders representing a broad section of the community, from diverse cultural backgrounds and income levels, and will result in the development and implementation of a 20 year master plan for the City’s solid waste and recycling programs.
Currently the city diverts 62 per cent of its waste from landfills and the goal set by the Mayor and City Council is 70 per cent by 2015 and 90 per cent by 2025. Los Angeles aims to, for example, encourage the establishment of small, local processing centers and will convert 80 to 90 per cent of trash into energy or reuse. Its restaurant industry will be green in ten years and government services will be paperless.
Source: http://www.zerowaste.lacity.org
Los Angeles, a case for Zero Waste
The parties to this convention are convinced that States should take necessary measures to ensure that
the management of hazardous wastes and other wastes including their
transboundary movement and disposal is consistent with the protection of human health and the environment
whatever the place of disposal.
— Basel Convention on the Control of Transboundary Movements of Hazardous Wastes and their Disposal (1992)