Intake/Interview & Quality Review Training 2021 Filing Season

Section Two — Filing Season Review8
TAS Technology Research Initiatives Efforts to Improve Advocacy Areas of Focus Filing Season
Review Preface
II. Review of the 2015 Filing Season
The 2015 filing season was akin to a Tale of Two Cities . For the majority of taxpayers who filed their returns and did not require IRS assistance, the filing season was generally successful . For the segment of taxpayers who required help from the IRS, the filing season was by far the worst in memory .
The 2015 filing season presented the IRS with extraordinary challenges and considerable risks . The IRS’s budget has been declining since fiscal year (FY) 2010 and now stands about 17 percent below its FY 2010 peak in inflation-adjusted terms .1 At the same time, the IRS this year was charged by law with imple-menting the most challenging portions of the Patient Protection and Affordable Care Act (ACA)2 as well as the Foreign Account Tax Compliance Act (FATCA)3 and “tax extenders” legislation passed last fall .4
The IRS received the same appropriation for its Taxpayer Services account in FY 2015 as it had received in FY 2014 . However, it did not receive any additional funding to implement the ACA and FATCA . To enable it to implement those laws, the IRS reallocated about $133 million in user fees from Taxpayer Services to its Operations Support account, primarily to complete required systems programming .5 That decision left less funding for taxpayer services .
Under these difficult circumstances, the IRS accomplished a great deal . It received and processed most tax returns in a timely manner, and it issued timely refunds to most taxpayers who were entitled to them . The following table presents the IRS’s overall IRS filing season statistics .
FIGURE 2.1.1, Filing Season Statistics Comparing Weeks Ending April 18, 2014 and April 17, 20156
2014 2015 % change
Individual Income Tax Returns
Total Receipts 131,170,000 132,268,000 0.8%
Total Processed 125,604,000 126,121,000 0.4%
e-Filing Receipts
Self-Prepared 45,977,000 48,702,000 5.9%
Tax Professionals 69,992,000 70,064,000 0.1%
Total e-Filing 115,969,000 118,766,000 2.4%
Web Usage Visits to IRS.gov 269,138,999 302,576,118 12.4%
Total Refunds
Number 94,809,000 91,818,000 -3.2%
Amount $254.7 bil $248.9 bil -2.3%
Average Refund $2,686 $2,711 0.9%
Direct Deposit Refunds
Number 76,714,000 76,824,000 0.1%
Amount $217.7 bil $222.0 bil 2.0%
Average Refund $2,837 $2,890 1.8%
1 In FY 2010, the agency’s appropriated budget stood at $12.1 billion. In FY 2015, its budget was set at $10.9 billion, a reduc-tion of about 9.9 percent. Inflation over the same period is estimated at about 9.4 percent. Adjusting for the interactive effects of these cuts and the impact of the federal pay freeze, we estimate the inflation-adjusted reduction in funding has been about 17 percent. For additional detail, see National Taxpayer Advocate 2014 Annual Report to Congress 13 n.50.
2 Pub. L. No. 111-148, 124 Stat. 119 (2010).3 Pub. L. No. 111-147, Title V, Subtitle A, 124 Stat. 71, 97 (2010).4 Pub. L. No. 113-295, 128 Stat. 4010 (2014).5 IRS Chief Financial Officer, Corporate Budget.6 IRS, Filing Season Statistics for Week Ending April 17, 2015, available at http://www.irs.gov/uac/Newsroom/Filing-Season-
Statistics-for-Week-Ending-April-17-2015.

Taxpayer Advocate Service — Fiscal Year 2016 Objectives Report to Congress — Volume One 9
Preface Filing Season Review Areas of Focus Efforts to Improve
Advocacy Research Initiatives TAS Technology
However, the large segment of taxpayers who needed to interact with the IRS personally did not fare nearly as well . Very simply, these taxpayers did not receive acceptable levels of taxpayer service . The IRS’s shortcomings were apparent across the full range of taxpayer services, including telephone service, walk-in assistance, and correspondence . At the same time, taxpayers who were victims of identity theft continued to encounter significant frustration and delay in resolving their problems, and there were several glitches associated with the ACA (although mostly not due to IRS error) . After the filing season ended, it was learned that the confidential tax information of more than 100,000 taxpayers had been stolen by cyber-criminals who used the IRS’s “Get Transcript” application to obtain it .7
The National Taxpayer Advocate is deeply concerned about the magnitude of taxpayer-service shortcom-ings . While we understand that limited resources have played a significant role, the impact on taxpayers requiring assistance has been profound . The IRS took a big step last year in adopting a Taxpayer Bill of Rights . Among those rights is the right to quality service . Whatever the cause, there remains a vast gulf between the goal of providing high-quality taxpayer service and the current state of taxpayer service .
The following discussion describes some of the key challenges that arose during the filing season .
TELEPHONE SERVICE
The IRS’s performance in responding to taxpayer telephone calls this year was, as IRS Commissioner Koskinen has acknowledged, “abysmal .”8 During the filing season, the IRS was only able to answer about 37 percent of the calls routed to telephone assistors, and those callers who managed to get through had to wait on hold an average about 23 minutes .9 (Except where otherwise noted, the telephone and corre-spondence data cited herein is for the filing season covering the January 1 through April 18 period or the comparable period for prior years .)
The percentage of calls answered by telephone assistors (known as the “Customer Service Representative Level of Service” or “LOS”) and the average hold times this filing season constituted by far their worst levels since the IRS adopted its current performance measures in 2001 . For comparison, the IRS reached its high-water mark in providing taxpayer service in 2004 when it answered 85 percent of taxpayer calls directed to telephone assistors and hold times averaged three minutes during the filing season .10 Even during last year’s filing season, the IRS answered 71 percent of its calls and hold times averaged about 14 minutes .11
To understand the IRS’s telephone statistics, a few concepts are important to review . First, the IRS tracks the total number of calls it receives, which is known as the “Enterprise Total .” The Enterprise Total includes calls to the “Accounts Management” (AM) telephone lines (which typically account for around 85-90 percent of all “Enterprise Total” calls), calls to the compliance telephone lines, and calls to a few additional low-volume telephone lines .12 Second, answered calls are split between “Assistor Answered Calls” and calls handled by the IRS’s automated processes . Whether a call is routed to automation or to
7 IRS Statement on the “Get Transcript” Application (June 2, 2015), available at http://www.irs.gov/uac/Newsroom/IRS-Statement-on-the-Get-Transcript-Application.
8 John A. Koskinen, Commissioner of Internal Revenue, Address at the National Press Club (Mar. 31, 2015).9 IRS, Joint Operations Center (JOC), Snapshot Reports: Enterprise Snapshot (Apr. 18, 2015). 10 IRS, JOC, Snapshot Reports: Enterprise Snapshot (Apr. 17, 2004).11 IRS, JOC, Snapshot Reports: Enterprise Snapshot (Apr. 18, 2015).12 For the Jan. 1-April 18 period, the IRS received 56.2 million calls Enterprise-wide, and of that total, 49.9 million calls were
directed to the AM telephone lines (89 percent). Typically, calls to the IRS compliance lines are answered at a somewhat higher level of service and with somewhat shorter hold times than the average call to an AM line. Id.

Section Two — Filing Season Review10
TAS Technology Research Initiatives Efforts to Improve Advocacy Areas of Focus Filing Season
Review Preface
a customer service representative (CSR) depends on the telephone number the taxpayer calls and how the caller responds to the prompts he or she encounters . Third, the official “Level of Service” statistics reflect only calls routed to CSRs on the AM telephone lines .
Between January 1 and April 18, the IRS AM telephone lines received about 50 million taxpayer tele-phone calls .13 Of those, about 30 million were routed to automated processes, and about 20 million were routed to telephone assistors .14 One might assume that calls routed to automation would be answered at a much higher rate than calls routed to telephone assistors, but that is not the case . Of the 49 .9 million calls the IRS received on its AM lines, including calls routed to automation, 24 .1 million were deemed to be answered . That is less than 50 percent .
The following figure shows the IRS’s performance during the 2014 and 2015 filing seasons for the Enterprise Total, the AM total, and many of the filing season-related phone lines that are components of
the AM total .
13 IRS, JOC, Snapshot Reports: Enterprise Snapshot (Apr. 18, 2015).14 The standard JOC reports do not list the number of calls gated to CSRs. However, the reports include the number of calls
answered by CSRs and the percentage of calls routed to CSRs that were answered. One can compute the approximate num-ber of calls routed to CSRs by dividing the number of calls answered by CSRs (7,386,265) by the percentage of calls routed to CSRs that were answered (37.28 percent).

Taxpayer Advocate Service — Fiscal Year 2016 Objectives Report to Congress — Volume One 11
Preface Filing Season Review Areas of Focus Efforts to Improve
Advocacy Research Initiatives TAS Technology
FIG
UR
E 2.1
.2, 2
014 &
2015 F
iling
Sea
son
Sta
tist
ics
for
Sel
ecte
d To
ll-Fr
ee T
elep
hone
Lin
es
20
14
20
15
Per
cent
Cha
nge
Tele
phon
e Li
neD
iale
d At
tem
pts
Assi
stor
C
alls
An
swer
ed
Aver
age
Spe
ed o
f An
swer
(M
inut
es)
Leve
l of
Ser
vice
Dia
led
Atte
mpt
s
Assi
stor
C
alls
An
swer
ed
Aver
age
Spe
ed
of A
nsw
er
(Min
utes
)
Leve
l of
Ser
vice
ASA
Perc
enta
ge
Cha
nge
LOS
Pe
rcen
tage
C
hang
e
Acc
ount
s M
anag
emen
t (A
M)
[S
UM
of
29
Lin
es]
45
,38
2,5
67
9,9
59,8
28
14.1
70.9
%49,9
11,8
68
7,3
86,2
65
22.9
37.3
%62%
-47.4
%
Tax
Law
86
6-8
83
-02
17
1,0
30
,75
67
40,8
86
11.9
75.4
%828,3
03
468,0
09
13.9
68.9
%17%
-8.6
%
Indi
vidu
al Inc
ome
Tax
Ser
vice
s 8
00
-82
9-1
04
07
,32
8,5
49
1,9
28,7
89
15.4
73.0
%9,4
88,0
71
1,1
96,9
65
22.5
25.7
%46%
-64.8
%
Bus
ines
s &
Spe
cial
ty T
ax
Ser
vice
s Li
ne 8
00
-82
9-
49
33
1,5
04
,90
47
25,4
85
17.5
70.1
%1,6
20,4
09
486,3
68
26.4
44.4
%51%
-36.7
%
Ref
und
Hot
line
8
00
-82
9-1
95
41
8,3
45
,84
51
05,1
80
18.4
52.7
%15,9
32,3
00
79,8
82
23.0
25.6
%25%
-51.5
%
BM
F C
usto
mer
Res
pons
e 8
00
-82
9-0
11
57
76
,40
74
90,9
20
18.9
73.3
%1,1
30,3
78
450,0
53
25.3
45.9
%34%
-37.4
%
Sel
f Em
ploy
ed IM
F C
usto
mer
Res
pons
e 8
00
-8
29
-83
74
1,0
87
,66
53
73,3
47
15.0
61.4
%1,4
03,3
00
220,5
40
23.2
26.2
%55%
-57.3
%
Wag
e &
Inv
estm
ent
IMF
Cus
tom
er R
espo
nse
80
0-
82
9-0
92
22
,18
8,4
48
69
2,4
24
15.8
59.8
%2,7
82,6
45
399,5
57
22.8
24.5
%44%
-59.0
%
Ref
und
Cal
l Bac
k
80
0-8
29
-05
82
1,9
54
,50
55
56,4
70
18.9
69.1
%2,9
20,6
14
471,8
40
21.2
35.9
%12%
-48.0
%
TAC
-CAS
86
6-8
55
-17
78
31
00.0
0.0
%17,9
53
14,3
99
3.0
82.0
%n/
an/
a
VITA
Loc
atio
n 80
0-9
06
-9
88
75
8,3
05
48
,542
1.2
91.4
%58,8
80
34,3
25
5.5
64.3
%358%
-29.7
%
Indi
vidu
al T
axpa
yer
Iden
tific
atio
n N
umbe
r (IT
IN)
80
0-9
08
-99
82
16
4,9
51
11
8,6
78
4.4
83.1
%185,3
04
87,8
57
16.0
53.5
%264%
-35.7
%
ARR
A C
P N
otic
e R
espo
nse
Line
80
0-9
08
-41
84
1,9
65
849
14.1
69.2
%838
125
21.3
40.1
%51%
-42.1
%
Elec
tron
ic F
iling
Pin
Hel
p 8
66
-70
4-7
38
85
,36
3,6
42
98
9,2
95
9.5
64.0
%5,7
61,3
60
610,3
80
23.7
31.6
%149%
-50.6
%
ACA
Hot
line
80
0-9
19
-04
52
51
,61
81
6,5
21
8.1
81.0
%566,9
67
324,8
50
16.4
67.8
%102%
-16.3
%
FTH
BC
80
0-9
19-0
35
21
6,5
10
3,6
35
37.6
60.8
%24,4
35
7,2
29
29.6
61.4
%-2
1%
0.9
%
Tran
scrip
t 8
00
-90
8-9
94
67
85
,62
35
9,6
14
17.0
70.6
%627,9
18
41,3
42
26.9
53.3
%58%
-24.5
%

Section Two — Filing Season Review12
TAS Technology Research Initiatives Efforts to Improve Advocacy Areas of Focus Filing Season
Review Preface
FIG
UR
E 2.1
.2, 2
014 &
2015 F
iling
Sea
son
Sta
tist
ics
for
Sel
ecte
d To
ll-Fr
ee T
elep
hone
Lin
es (
cont
inue
d)15
20
14
20
15
Per
cent
Cha
nge
Tele
phon
e Li
neD
iale
d At
tem
pts
Assi
stor
C
alls
An
swer
ed
Aver
age
Spe
ed o
f An
swer
(M
inut
es)
Leve
l of
Ser
vice
Dia
led
Atte
mpt
s
Assi
stor
C
alls
An
swer
ed
Aver
age
Spe
ed
of A
nsw
er
(Min
utes
)
Leve
l of
Ser
vice
ASA
Perc
enta
ge
Cha
nge
LOS
Pe
rcen
tage
C
hang
e
Amen
ded
Ret
urn
Hot
line
86
6-4
64
-20
50
23
1,9
42
71
,682
16.2
73.3
%352,4
98
148,3
82
22.1
66.0
%36%
-9.9
%
NTA
87
7-7
77
-47
78
24
6,1
38
12
5,7
06
5.5
71.6
%359,5
96
102,3
99
18.8
38.5
%242%
-46.2
%
PPS
86
6-8
60
-42
59
56
1,3
34
36
2,3
65
19.7
75.4
%599,6
55
229,2
81
44.8
44.5
%127%
-41.0
%
VITA
80
0-8
29
-84
82
6,8
41
6,5
27
0.7
97.8
%5,4
64
4,7
28
1.6
91.2
%129%
-6.7
%
Inte
rnat
iona
l 877
5
(85
5-7
90
-87
75)
21
4,3
38
12
8,7
58
10.5
71.3
%216,0
71
99,2
16
20.3
55.0
%93%
-22.9
%
Tax
Exem
pt a
nd
Gov
ernm
ent
Entit
ies
(TE/
GE)
8
77
-82
9-5
50
0
23
3,2
60
14
3,0
37
14.2
73.8
%208,5
96
91,2
66
30.0
55.7
%111%
-24.5
%
Iden
tity
Prot
ectio
n S
peci
aliz
ed U
nit
(IPS
U)
8
00
-90
8-4
49
08
90
,91
35
41,3
89
12.3
82.0
%1,5
55,8
60
530,0
10
25.4
54.1
%107%
-34.0
%
Com
bat
Zone
80
0-9
08
-03
68
3,8
82
3,2
17
0.4
85.0
%3,0
17
2,7
42
0.6
93.8
%50%
10.4
%
Form
s O
rder
Lin
e 8
00
-82
9-
36
76
(8
00
-TA
X-FO
RM
)1
,18
6,0
61
70
6,2
50
4.4
81.3
%2,1
35,8
92
824,7
69
7.2
58.8
%64%
-27.6
%
ASK
TA
S 8
77
-27
5-8
27
1
(87
7-A
SK-T
AS1
)1
5,6
49
13
,166
1.3
97.0
%36,7
45
30,9
88
4.2
92.3
%223%
-4.9
%
Inst
allm
ent
Agr
eem
ent/
B
alan
ce D
ue2
,27
9,6
20
1,7
20,4
85
13.1
75.5
%3,1
51,0
30
1,2
50,9
73
24.3
39.7
%85%
-47.4
%
Taxp
ayer
Pro
tect
ion
Pro
gram
8
00
-83
0-5
08
4
23
2,6
98
18
1,7
66
8.4
81.4
%2,8
63,8
09
489,4
46
27.7
17.0
%230%
-79.1
%
Ente
rpri
se T
otal
(In
clud
es
AM
, Com
plia
nce,
For
ms
Ord
er
Line
, AS
K T
AS
and
EP
SS
)5
0,8
09
,53
01
3,0
76,2
49
13.4
71.8
%56,1
95,7
33
10,4
65,0
10
20.2
43.4
%51%
-39.5
%
15
IRS
, JO
C, S
naps
hot
Rep
orts
: En
terp
rise
Sna
psho
t (A
pr.
18, 2
015)
(sou
rce
of A
M a
nd E
nter
pris
e To
tal d
ata)
; IR
S, J
OC
, Sna
psho
t R
epor
ts: Pr
oduc
t Li
ne D
etai
l (Ap
r. 18, 2
015)
(sou
rce
of a
ll ot
her
data
exc
ept
the
Taxp
ayer
Pro
tect
ion
Prog
ram
(TP
P) li
ne); IR
S, J
OC
, FY
201
5 W
eekl
y TP
P S
naps
hot
Rep
ort
(Apr
. 18, 2
015)
(sou
rce
of T
PP li
ne d
ata)
.

Taxpayer Advocate Service — Fiscal Year 2016 Objectives Report to Congress — Volume One 13
Preface Filing Season Review Areas of Focus Efforts to Improve
Advocacy Research Initiatives TAS Technology
As the above chart shows, the LOS and Average Speed of Answer (hold time) varied, sometimes consider-ably, among the telephone lines .
The LOS and hold times also varied considerably over the course of the filing season . The following graphs show how the IRS handled key phone lines, on a weekly basis, during the filing season:
Accounts Management Rollup The official measure of IRS telephone performance is based on calls made to the “Accounts Management” telephone lines . There are 29 lines that are considered “Accounts Management” lines, including all lines shown in the graphs below (except for the Taxpayer Protection Program (TPP) line) .16
FIGURE 2.1.317
16 IRS, JOC, Snapshot Reports: Enterprise Snapshot and Product Line Detail (Apr. 18, 2015). The “Accounts Management” tele-phone lines were formerly known as “Customer Account Services” telephone lines. The number of lines varies by year as IRS increases or decreases specialty lines for various topics.
17 IRS, JOC, Snapshot Reports: Enterprise Snapshot (weeks ending Jan. 3, 2015 through Apr. 18, 2015).
Accounts Management LinesA combined total of the lines on which Accounts Management toll-free assistors are responsible for providing assistance; the number of lines has varied as new lines are added or discontinued.
1/3 2/7 4/183/141/10 1/17 1/24 1/31 2/212/14 2/28 4/4 4/113/7 3/21 3/282015 Week Ending
80
40
60
20
61%
52%
44%
36% 33% 35% 35% 36%
28.5min
28.6min 28.5
min16.7 min
21.3 min
20.3min
22.5min 17.6
min
Average Speed of AnswerCustomer Service Representative Level of Service

Section Two — Filing Season Review14
TAS Technology Research Initiatives Efforts to Improve Advocacy Areas of Focus Filing Season
Review Preface
Individual Income Tax Services/Form 1040 The “1040” number serves as the general, all-purpose phone line for individual taxpayers seeking assis-tance in preparing tax forms or answers to general questions .
FIGURE 2.1.418
Refund Hotline The Refund Hotline allows taxpayers to check on the status of their refund by phone . Because the IRS computer systems generally have the most current information, most calls are handled through automa-tion . A relatively small percentage requires the involvement of a telephone assistor .
FIGURE 2.1.519
18 IRS, JOC, Snapshot Reports: Product Line Detail (weeks ending Jan. 3, 2015 through Apr. 18, 2015).19 Id.
IRS 1040 Individual LineThe general, all-purpose line for individual taxpayers needing assistance
in preparing individual tax forms or for general individual questions.
1/3 2/7 4/183/141/10 1/17 1/24 1/31 2/212/14 2/28 4/4 4/113/7 3/21 3/282015 Week Ending
80
40
60
20
63%
49%43%
20% 16%
30% 31%27%
30.0 min 26.3
min20.5 min
14.0 min 23.3
min22.8 min
27.5 min
19.3 min
Average Speed of AnswerCustomer Service Representative Level of Service
IRS Refund HotlineThe IRS established this line to allow taxpayers to check on the status of their refund via the telephone,
but in certain instances, a taxpayer may need a live assistor to answer his or her inquiry.
1/3 2/7 4/183/141/10 1/17 1/24 1/31 2/212/14 2/28 4/4 4/113/7 3/21 3/282015 Week Ending
80
40
60
20
43%52%
19%
31% 30%
22% 22%22%29.2
min 24.7min
24.5 min
14.1 min
23.3 min
24.7min
25.2 min
18.8min
Average Speed of AnswerCustomer Service Representative Level of Service

Taxpayer Advocate Service — Fiscal Year 2016 Objectives Report to Congress — Volume One 15
Preface Filing Season Review Areas of Focus Efforts to Improve
Advocacy Research Initiatives TAS Technology
Wage & Investment (W&I) Customer Response The W&I customer response telephone number is provided to taxpayers who receive a notice, such as a math error notice, so they can contact the IRS to provide additional information or correct an error .
FIGURE 2.1.620
National Taxpayer Advocate (NTA) Toll-Free Hotline The NTA phone line, staffed by W&I employees, is used by taxpayers who believe they are experienc-ing financial or systemic burden and seek assistance from TAS . Because TAS is intended to be the IRS’s “safety net” for taxpayers, it was particularly frustrating that more than 60 percent of calls could not get through, and those who succeeded had to wait an average of 19 minutes on hold .21
FIGURE 2.1.722
20 IRS, JOC, Snapshot Reports: Product Line Detail (weeks ending Jan. 3, 2015 through Apr. 18, 2015).21 IRS, JOC, Snapshot Reports: Product Line Detail (Apr. 18, 2015).22 IRS, JOC, Snapshot Reports: Product Line Detail (weeks ending Jan. 3, 2015 through Apr. 18, 2015).
Average Speed of AnswerCustomer Service Representative Level of Service
Wage & Investment Customer Response LineThis line is provided to taxpayers who receive a notice, such as a math error notice,
to contact the IRS and provide additional information or correct the error.
1/3 2/7 4/183/141/10 1/17 1/24 1/31 2/212/14 2/28 4/4 4/113/7 3/21 3/282015 Week Ending
80
40
60
20
57%
41%
28%33%
28%
19% 21% 17%31.5min 26.2
min
18.6min
11.9min
23.0 min 22.1
min
27.0min
19.6 min
NTA Toll-Free LineAssistors provide services for taxpayers seeking TAS assistance.
1/3 2/7 4/183/141/10 1/17 1/24 1/31 2/212/14 2/28 4/4 4/113/7 3/21 3/28
2015 Week Ending
80
40
60
20
76%
51%
38% 37%41%
44%39% 40%
11.2min
16.4min
45.1 min 40.9
min
19.2 min
9.2 min
13.8 min
13.5 min
Average Speed of AnswerCustomer Service Representative Level of Service

Section Two — Filing Season Review16
TAS Technology Research Initiatives Efforts to Improve Advocacy Areas of Focus Filing Season
Review Preface
Practitioner Priority Service (PPS) The PPS phone line is used by tax professionals who are trying to reach the IRS to assist their clients . Over the course of the filing season, the IRS answered only 45 percent of practitioner calls on this line, and the hold time averaged 45 minutes .23 Thus, the use of the term “priority” has understandably evoked a com-bination of frustration and amusement from tax attorneys, CPAs, and Enrolled Agents, who must decide whether and how much to charge their clients for the time they spend waiting on hold . Of course, the 45-minute hold time represents merely an average . One practitioner told the National Taxpayer Advocate of waiting six hours to reach a telephone assistor . Another practitioner whom the National Taxpayer Advocate knows well forwarded an email from an associate at his law firm reporting on a four-hour and 24-minute telephone call, of which the first four hours and three minutes were spent waiting on hold .
FIGURE 2.1.824
23 IRS, JOC, Snapshot Reports: Product Line Detail (Apr. 18, 2015).24 IRS, JOC, Snapshot Reports: Product Line Detail (weeks ending Jan. 3, 2015 through Apr. 18, 2015).
Practitioner Priority Service LineThis line provides tax professionals a dedicated channel to resolve taxpayer-client account issues.
1/3 2/7 4/183/141/10 1/17 1/24 1/31 2/212/14 2/28 4/4 4/113/7 3/21 3/28
2015 Week Ending
80
40
60
20
77%
53%
36%42% 42% 38%
47%43%40.2
min
53.8min
82.1 min
46.7 min
40.3 min
30.5min
34.7 min 29.0
min
Average Speed of AnswerCustomer Service Representative Level of Service

Taxpayer Advocate Service — Fiscal Year 2016 Objectives Report to Congress — Volume One 17
Preface Filing Season Review Areas of Focus Efforts to Improve
Advocacy Research Initiatives TAS Technology
Identity Protection Specialized Unit (IPSU) IPSU assistors provide assistance to victims of tax-related identity theft and refund fraud, generally after the tax-related theft has taken place .
FIGURE 2.1.925
Taxpayer Protection Program The TPP line is designed to help taxpayers whose returns the IRS has suspended because of suspected but uncon-firmed identity theft . When an IRS filter stops a return, the IRS sends the taxpayer a letter asking him or her to either call the TPP phone number or go online to verify his or her identity by answering “out-of-wallet” questions . As shown in this graph and discussed in more detail below, the level of service on the TPP line has been particularly poor .
FIGURE 2.1.1026
25 IRS, JOC, Snapshot Reports: Product Line Detail (weeks ending Jan. 3, 2015 through Apr. 18, 2015).26 IRS, JOC, FY 2015 Weekly TPP Snapshot Report (weeks ending Jan. 3, 2015 through Apr. 18, 2015).
Identity Protection Specailized Unit LineThe assistors provide services for victims of identity theft, normally after the tax-related theft has taken place.
1/3 2/7 4/183/141/10 1/17 1/24 1/31 2/212/14 2/28 4/4 4/113/7 3/21 3/28
2015 Week Ending
80
40
60
20
67%
59% 59%
49%
56% 57%52%
59%
24.8 min
25.3min
34.2 min
25.8 min 22.2
min 16.0 min
17.2min
22.4min
Average Speed of AnswerCustomer Service Representative Level of Service
Taxpayer Protection Program LineAssistors conduct identity verification for returns halted in processing when the IRS determines
there is a high risk of an identity thief filing the return rather than the actual taxpayer.
1/3 2/7 4/183/141/10 1/17 1/24 1/31 2/212/14 2/28 4/4 4/113/7 3/21 3/28
2015 Week Ending
80
40
60
20
Average Speed of AnswerCustomer Service Representative Level of Service
83%
49%
39%44%
10% 10%
25%
42%
19.3 min
19.5min
60.2 min
46.7min
19.2 min
27.7min 22.4
min25.0min

Section Two — Filing Season Review18
TAS Technology Research Initiatives Efforts to Improve Advocacy Areas of Focus Filing Season
Review Preface
The telephone lines depicted in the above graphs present an important, but limited, perspective on the IRS’s overall telephone operations . One basic system limitation results in what in IRS parlance is known as a “courtesy disconnect .” When the IRS switchboard is overloaded and cannot handle additional calls, the IRS essentially hangs up on callers . The number of courtesy disconnects skyrocketed this filing season as compared with prior years, rising by more than 1,500 percent from about 544,000 in 2014 to about 8 .8 million this year .27 The following chart shows the number of courtesy disconnects for each of the last five years .
FIGURE 2.1.1128
Overall, the sharp decline in the LOS from 2014 to 2015 is attributable to the IRS receiving more calls, answering fewer calls, and spending more time on the average call .
■■ Number of Calls Routed to Telephone Assistors Was Up 41 Percent. In 2014, the IRS received about 14 .0 million calls on its AM lines that were routed to CSRs . In 2015, that number rose to about 19 .8 million calls .29
■■ Number of Calls Answered by IRS Telephone Assistors Was Down 26 Percent. The number of calls answered by telephone assistors declined from about 10 .0 million in 2014 to about 7 .4 million this year . Viewed differently, if the IRS had received the same number of calls routed to CSRs in 2015 as it had received in 2014, the number of calls it actually answered in 2015 would have produced an LOS of about 53 percent .30
27 IRS, JOC, Custom Report RRC 2015-1623 (including weekly data on the number of courtesy disconnects during the 2014 and 2015 filing seasons).
28 Id; Custom Reports RRC 1699 & 1700 (including weekly data for the 2011, 2012, and 2013 filing seasons). Graph shows week-ending dates for 2015 for labeling purposes; for prior years, data reflects corresponding week-ending dates.
29 The standard JOC reports do not list the number of calls routed to CSRs. However, the reports include the number of calls answered by CSRs and the percentage of calls routed to CSRs that were answered. One can compute the approximate num-ber of calls routed to CSRs by dividing the number of calls answered by CSRs by the percentage of calls routed to CSRs that were answered.
30 Using the methodology described in the preceding footnote, the IRS received 14,047,712 calls that were routed to CSRs during the 2014 filing season. (That number is very close to the actual number, but is not precise.) IRS CSRs answered 7,386,265 calls during the 2015 filing season. IRS, JOC, Snapshot Reports: Enterprise Snapshot (Apr. 18, 2015).
2011
Courtesy DisconnectsFiling Seasons 2011-2015
1/3 2/7 4/183/141/10 1/17 1/24 1/31 2/212/14 2/28 4/4 4/113/7 3/21 3/28
1,000,000
500,000
2015 Week Ending
2012 2013 2014 2015
Taxpayer Advocate Service — Fiscal Year 2016 Objectives Report to Congress — Volume One 19
Preface Filing Season Review Areas of Focus Efforts to Improve
Advocacy Research Initiatives TAS Technology
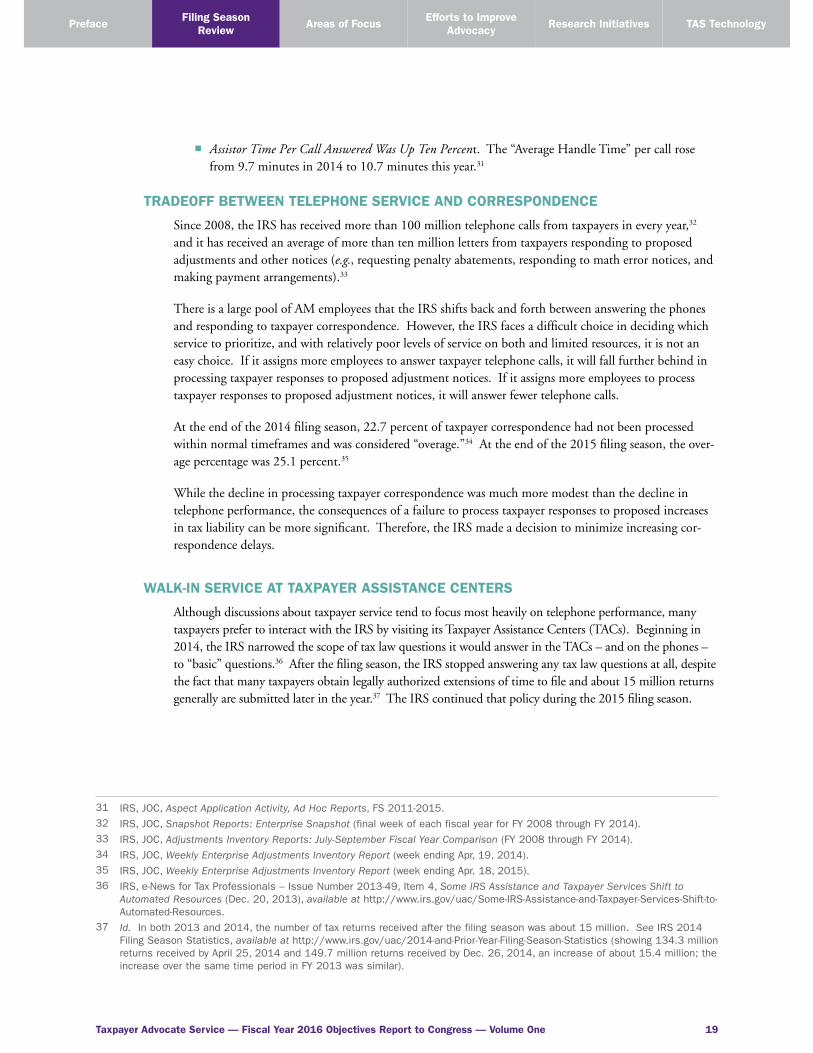
■■ Assistor Time Per Call Answered Was Up Ten Percent . The “Average Handle Time” per call rose from 9 .7 minutes in 2014 to 10 .7 minutes this year .31
TRADEOFF BETWEEN TELEPHONE SERVICE AND CORRESPONDENCE
Since 2008, the IRS has received more than 100 million telephone calls from taxpayers in every year,32 and it has received an average of more than ten million letters from taxpayers responding to proposed adjustments and other notices (e.g., requesting penalty abatements, responding to math error notices, and making payment arrangements) .33
There is a large pool of AM employees that the IRS shifts back and forth between answering the phones and responding to taxpayer correspondence . However, the IRS faces a difficult choice in deciding which service to prioritize, and with relatively poor levels of service on both and limited resources, it is not an easy choice . If it assigns more employees to answer taxpayer telephone calls, it will fall further behind in processing taxpayer responses to proposed adjustment notices . If it assigns more employees to process taxpayer responses to proposed adjustment notices, it will answer fewer telephone calls .
At the end of the 2014 filing season, 22 .7 percent of taxpayer correspondence had not been processed within normal timeframes and was considered “overage .”34 At the end of the 2015 filing season, the over-age percentage was 25 .1 percent .35
While the decline in processing taxpayer correspondence was much more modest than the decline in telephone performance, the consequences of a failure to process taxpayer responses to proposed increases in tax liability can be more significant . Therefore, the IRS made a decision to minimize increasing cor-respondence delays .
WALK-IN SERVICE AT TAXPAYER ASSISTANCE CENTERS
Although discussions about taxpayer service tend to focus most heavily on telephone performance, many taxpayers prefer to interact with the IRS by visiting its Taxpayer Assistance Centers (TACs) . Beginning in 2014, the IRS narrowed the scope of tax law questions it would answer in the TACs – and on the phones – to “basic” questions .36 After the filing season, the IRS stopped answering any tax law questions at all, despite the fact that many taxpayers obtain legally authorized extensions of time to file and about 15 million returns generally are submitted later in the year .37 The IRS continued that policy during the 2015 filing season .
31 IRS, JOC, Aspect Application Activity, Ad Hoc Reports, FS 2011-2015. 32 IRS, JOC, Snapshot Reports: Enterprise Snapshot (final week of each fiscal year for FY 2008 through FY 2014).33 IRS, JOC, Adjustments Inventory Reports: July-September Fiscal Year Comparison (FY 2008 through FY 2014).34 IRS, JOC, Weekly Enterprise Adjustments Inventory Report (week ending Apr, 19, 2014).35 IRS, JOC, Weekly Enterprise Adjustments Inventory Report (week ending Apr. 18, 2015).36 IRS, e-News for Tax Professionals – Issue Number 2013-49, Item 4, Some IRS Assistance and Taxpayer Services Shift to
Automated Resources (Dec. 20, 2013), available at http://www.irs.gov/uac/Some-IRS-Assistance-and-Taxpayer-Services-Shift-to-Automated-Resources.
37 Id. In both 2013 and 2014, the number of tax returns received after the filing season was about 15 million. See IRS 2014 Filing Season Statistics, available at http://www.irs.gov/uac/2014-and-Prior-Year-Filing-Season-Statistics (showing 134.3 million returns received by April 25, 2014 and 149.7 million returns received by Dec. 26, 2014, an increase of about 15.4 million; the increase over the same time period in FY 2013 was similar).

Section Two — Filing Season Review20
TAS Technology Research Initiatives Efforts to Improve Advocacy Areas of Focus Filing Season
Review Preface
Another change was implemented in 2014 and continued this year: The IRS departed from its longstand-ing practice of preparing tax returns in the TACs for low income, disabled, and elderly taxpayers seeking to comply with their tax obligations .38
A third change was continued from last year but marks a departure from earlier years: The TACs were not open on Saturdays or Presidents Day, and they no longer offer extended hours during the filing season . When the TACs’ hours of operation are limited to regular business hours, taxpayers who hold “9-to-5” jobs may be unable to utilize them .
As of this writing, we do not have reliable objective data to assess the IRS’s performance in meeting taxpayer needs at the TACs . However, it is worth noting that the IRS conducted a significant pilot program at 44 TACs that may help it do a better job of meeting taxpayer needs in the future . Specifically, it allowed taxpayers to schedule appointments in advance . The results of this scheduling approach need to be evaluated fully, but it appears it may have succeeded in two important ways – more upfront issue resolution and shorter wait times .
First, when a taxpayer called to arrange an appointment, IRS schedulers initially tried to assist the taxpayer in resolving his or her problem during the phone call – sometimes by directing him or her to online information he or she did not know about, sometimes by answering a question . Anecdotally, we have been told that many taxpayer problems were resolved by phone, obviating the need for the taxpayer to visit the TAC . If objective data bear that out, this approach will have shown itself to save taxpayers the time of traveling to the TACs and IRS employees the time of conducting a full meeting . Of course, other problems could not be resolved in that way, and the IRS W&I Division reports it scheduled 67,000 appointments at the test locations .39 We have been advised that the initial phone call scheduling the ap-pointment was also helpful in this situation . IRS assistors were able to identify other issues about which taxpayers were unaware and informed taxpayers what information they should bring to the appointment to resolve their concerns .
Second, initial reports indicate that overall wait times at the locations experimenting with this approach declined .40
W&I further reports that initial reaction from taxpayers and employees to the scheduling pilot was favor-able, and it will continue to analyze the results to determine the feasibility of expanding it to other loca-tions .41 The one downside to the pilot – and it is significant – is that the TACs that scheduled appoint-ments substantially stopped assisting taxpayers who came in for help without appointments . The IRS limited taxpayers without an appointment to picking up forms or making payments . Thus, any taxpayer unaware of this change who went to one of the pilot TACs with a basic tax law question but without an appointment was generally turned away .42
38 IRS, e-News for Tax Professionals – Issue Number 2013-49, Item 4, Some IRS Assistance and Taxpayer Services Shift to Automated Resources (Dec. 20, 2013), available at http://www.irs.gov/uac/Some-IRS-Assistance-and-Taxpayer-Services-Shift-to-Automated-Resources.
39 IRS W&I Division, Business Performance Review 20-21 (May 15, 2015).40 Id.41 Id.42 IRS News Release, IR-2015-30, IRS Begins Limited Test of Providing Appointments at 10 Walk-In Locations; Goal to Increase
Efficiency, Help Taxpayers (Feb. 18, 2015). The initial test locations available by appointment were: Atlanta, GA (Atlanta-Woodcock); Austin, TX; Birmingham, AL; Chicago, IL (Dearborn); Denver, CO; Fresno, CA; Hartford, CT; Plantation, FL; San Antonio, TX; and Seattle, WA.

Taxpayer Advocate Service — Fiscal Year 2016 Objectives Report to Congress — Volume One 21
Preface Filing Season Review Areas of Focus Efforts to Improve
Advocacy Research Initiatives TAS Technology
Since most TAC offices have been in existence for many years and have never previously required appoint-ments, some taxpayers travel long distances and may take time off from work to get to them . As part of the assessment of the appointments pilot, the IRS should consider ways to meet the needs of taxpayers who visit without appointments in the future .
AVAILABILITY OF TAX FORMS AND PUBLICATIONS
During the 2015 filing season, the IRS continued a recent trend of making it more difficult for taxpay-ers to obtain paper copies of its forms and publications . The IRS not only printed and distributed fewer forms, instructions, and publications this year, but it also delayed the delivery of those documents to its TACs and its Tax Form Outlet Partners (TFOPs), including libraries and post offices .43 Forms were not available at these locations until February 28, almost halfway through the filing season .44 Moreover, the IRS decided not to stock Form 1040EZ, Income Tax Return for Single and Joint Filers with No Dependents, in its own walk-in sites .45 Once a TAC ran out of forms or publications, it could not order more .46
In an alert to all employees on February 10, 2015, the IRS acknowledged that these changes have “created questions and concerns from taxpayers .”47 The IRS advised employees not to give out the 1-800 number for ordering tax forms and publications unless the taxpayer affirmatively stated that he or she did not have a computer or Internet access or otherwise pressed the employee about ordering by telephone .48
The IRS also ceased widespread distribution of Publication 17, Your Federal Income Tax for Individuals, which consolidates information about individual tax issues into one document . The IRS decided taxpayers could obtain Publication 17 content through other publications,49 thus imposing on taxpay-ers the burden of locating information dispersed throughout multiple publications and instructions . In subsequent filing seasons, each TFOP will receive one copy of Publication 17; taxpayers will have to pay to make photocopies . The IRS advised its employees that when taxpayers ask about Publication 17, they should not tell the taxpayer about limitations on availability but instead should remind the taxpayer that he or she can access the publication online or through the Government Publishing Office (GPO) .50
Taxpayers can attempt to purchase Publication 17 for $23 from the GPO, but there is no guarantee of success . When a TAS employee ordered Publication 17 through the GPO, she received a postcard advis-ing her that her order was cancelled and her check would be returned . As best we can tell, the IRS did not order sufficient printed copies of the publication to meet the demand of even those taxpayers willing to pay $23 to help them meet their compliance obligations .
43 IRS, Servicewide Electronic Research Program (SERP) Alert 15A0052, Forms and Pubs in Taxpayer Assistance Centers (revised Feb. 10, 2015); IRS, Talking Points about IRS Forms Availability (Feb. 4, 2015).
44 IRS, Talking Points About IRS Forms Availability (Feb. 4, 2015).45 IRS, SERP Alert 15A0052, Forms and Pubs in Taxpayer Assistance Centers (revised Feb. 10, 2015).46 IRS Field Assistance function, FA Service Approach Questions and Answers.47 IRS, SERP Alert 15A0052, Forms and Pubs in Taxpayer Assistance Centers (revised Feb. 10, 2015).48 Id.49 Id.50 Id.
Section Two — Filing Season Review22
TAS Technology Research Initiatives Efforts to Improve Advocacy Areas of Focus Filing Season
Review Preface
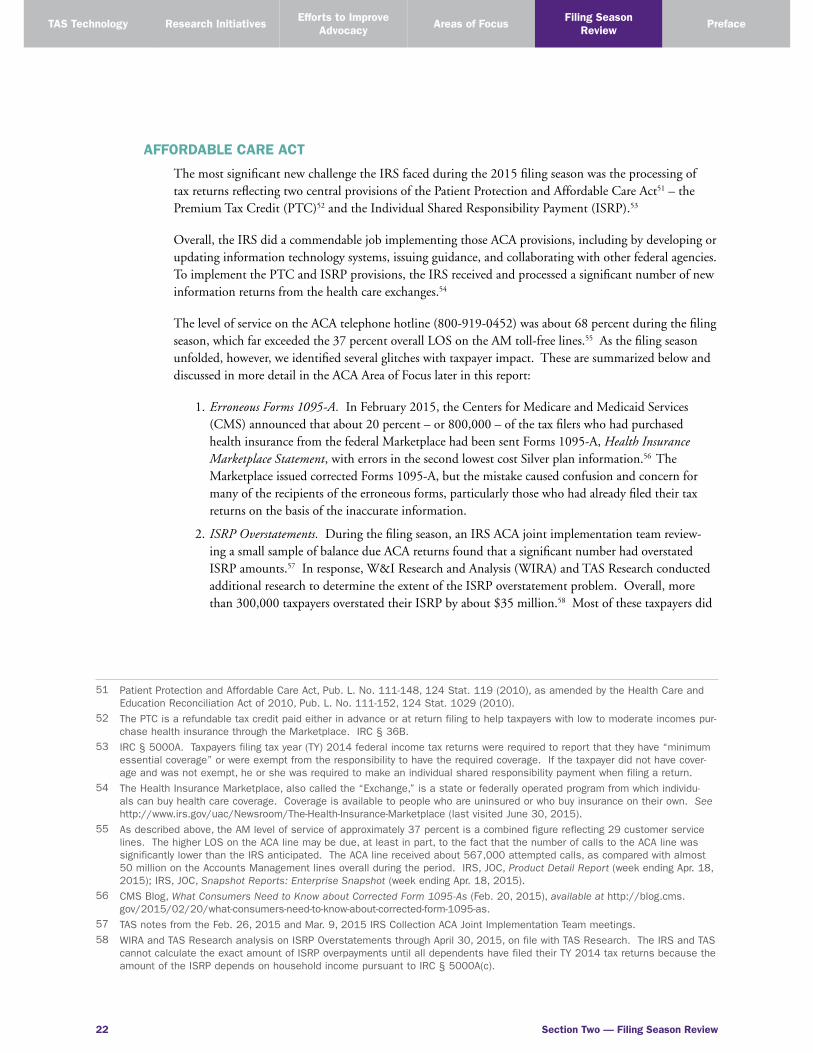
AFFORDABLE CARE ACT
The most significant new challenge the IRS faced during the 2015 filing season was the processing of tax returns reflecting two central provisions of the Patient Protection and Affordable Care Act51 – the Premium Tax Credit (PTC)52 and the Individual Shared Responsibility Payment (ISRP) .53
Overall, the IRS did a commendable job implementing those ACA provisions, including by developing or updating information technology systems, issuing guidance, and collaborating with other federal agencies . To implement the PTC and ISRP provisions, the IRS received and processed a significant number of new information returns from the health care exchanges .54
The level of service on the ACA telephone hotline (800-919-0452) was about 68 percent during the filing season, which far exceeded the 37 percent overall LOS on the AM toll-free lines .55 As the filing season unfolded, however, we identified several glitches with taxpayer impact . These are summarized below and discussed in more detail in the ACA Area of Focus later in this report:
1 . Erroneous Forms 1095-A. In February 2015, the Centers for Medicare and Medicaid Services (CMS) announced that about 20 percent – or 800,000 – of the tax filers who had purchased health insurance from the federal Marketplace had been sent Forms 1095-A, Health Insurance Marketplace Statement, with errors in the second lowest cost Silver plan information .56 The Marketplace issued corrected Forms 1095-A, but the mistake caused confusion and concern for many of the recipients of the erroneous forms, particularly those who had already filed their tax returns on the basis of the inaccurate information .
2 . ISRP Overstatements. During the filing season, an IRS ACA joint implementation team review-ing a small sample of balance due ACA returns found that a significant number had overstated ISRP amounts .57 In response, W&I Research and Analysis (WIRA) and TAS Research conducted additional research to determine the extent of the ISRP overstatement problem . Overall, more than 300,000 taxpayers overstated their ISRP by about $35 million .58 Most of these taxpayers did
51 Patient Protection and Affordable Care Act, Pub. L. No. 111-148, 124 Stat. 119 (2010), as amended by the Health Care and Education Reconciliation Act of 2010, Pub. L. No. 111-152, 124 Stat. 1029 (2010).
52 The PTC is a refundable tax credit paid either in advance or at return filing to help taxpayers with low to moderate incomes pur-chase health insurance through the Marketplace. IRC § 36B.
53 IRC § 5000A. Taxpayers filing tax year (TY) 2014 federal income tax returns were required to report that they have “minimum essential coverage” or were exempt from the responsibility to have the required coverage. If the taxpayer did not have cover-age and was not exempt, he or she was required to make an individual shared responsibility payment when filing a return.
54 The Health Insurance Marketplace, also called the “Exchange,” is a state or federally operated program from which individu-als can buy health care coverage. Coverage is available to people who are uninsured or who buy insurance on their own. See http://www.irs.gov/uac/Newsroom/The-Health-Insurance-Marketplace (last visited June 30, 2015).
55 As described above, the AM level of service of approximately 37 percent is a combined figure reflecting 29 customer service lines. The higher LOS on the ACA line may be due, at least in part, to the fact that the number of calls to the ACA line was significantly lower than the IRS anticipated. The ACA line received about 567,000 attempted calls, as compared with almost 50 million on the Accounts Management lines overall during the period. IRS, JOC, Product Detail Report (week ending Apr. 18, 2015); IRS, JOC, Snapshot Reports: Enterprise Snapshot (week ending Apr. 18, 2015).
56 CMS Blog, What Consumers Need to Know about Corrected Form 1095-As (Feb. 20, 2015), available at http://blog.cms.gov/2015/02/20/what-consumers-need-to-know-about-corrected-form-1095-as.
57 TAS notes from the Feb. 26, 2015 and Mar. 9, 2015 IRS Collection ACA Joint Implementation Team meetings. 58 WIRA and TAS Research analysis on ISRP Overstatements through April 30, 2015, on file with TAS Research. The IRS and TAS
cannot calculate the exact amount of ISRP overpayments until all dependents have filed their TY 2014 tax returns because the amount of the ISRP depends on household income pursuant to IRC § 5000A(c).

Taxpayer Advocate Service — Fiscal Year 2016 Objectives Report to Congress — Volume One 23
Preface Filing Season Review Areas of Focus Efforts to Improve
Advocacy Research Initiatives TAS Technology
not owe an ISRP because they were eligible for an exemption as a result of their low income .59 The average ISRP overstatement amount was a little over $110 per return .60
The National Taxpayer Advocate has recommended that the IRS issue refunds to the affected taxpayers without requiring them to file amended returns; since the majority of taxpayers use paid tax return preparers, they would probably spend more than the roughly $110 average overpayment amount in preparer fees if amended returns are required . As of this writing, the IRS is considering our recommendation but has not made a decision .
3 . Penalty Abatement Relief. The IRS issued Notice 2015-9, which provided limited penalty relief for taxpayers who had a balance due on their 2014 income tax returns as a result of reconciling advance payments of the premium tax credit (APTC) against the PTC allowed on the tax return . The National Taxpayer Advocate supported the IRS’s decision to grant this relief . However, we expressed concern that some taxpayers were receiving penalty relief for late payment under the so-called “first-time penalty abatement” administrative waiver, which is available only once every three years, rather than under the relief provided in the notice .61 As a consequence, some taxpayers who otherwise would qualify for penalty relief during the succeeding three-year period may not receive it . Our office will investigate this matter to determine the extent to which taxpayers received the inappropriate type of penalty relief and will work with the IRS to reclassify the reason for the penalty abatement, where appropriate .
General ACA Tax Return DataEligible individual taxpayers claimed the PTC for the first time on TY 2014 returns filed during the 2015 filing season . The following table provides information regarding the extent to which individual taxpayers claimed the PTC on their TY 2014 returns .
59 Nearly 250,000 of these taxpayers were eligible for an ISRP exemption. These taxpayers paid in over $27 million in ISRP. In addition, more than 50,000 taxpayers paid a total of nearly $8 million because the ISRP amount was miscalculated. These amounts include returns processed by the IRS through the end of Apr. 2015. W&I Research and TAS Research estimates from the Individual Returns Transaction File on the IRS Compliance Data Warehouse. This data is preliminary and is subject to change as the IRS reviews the data, processes additional TY 2014 returns, and conducts compliance activities.
60 This average only includes returns with an ISRP overstatement.61 First-time abatement applies if the taxpayer does not have a failure to pay, failure to file, or failure to deposit penalty in the
three years preceding the assessment year. For more information about the first-time abatement administrative waiver, see IRM 20.1.1.3.6.1, First Time Abate (FTA) (Aug. 5, 2014).

Section Two — Filing Season Review24
TAS Technology Research Initiatives Efforts to Improve Advocacy Areas of Focus Filing Season
Review Preface
FIGURE 2.1.12, Reporting of the Premium Tax Credit on Forms 8962 for TY 2014 Returns Through April 30, 201562 Returns Filed with Forms 8962, Premium Tax Credit (PTC) 2.6 milion
Total PTC Amount Claimed $7.7 billion
Average PTC Amount Claimed Per Return $3,000
Returns Reporting Advanced PTC 2.4 million (93% of returns with Forms 8962)
Total Advanced PTC Reported $8.7 billion
Prepared Returns Filed with Forms 8962 (Paid or Volunteer) 1.6 million
Individual taxpayers who did not have minimum essential coverage or qualify for an exemption were required to make an ISRP on their TY 2014 returns . The following table provides data on the reporting of ISRPs on TY 2014 returns .
FIGURE 2.1.13, Reporting of the Individual Shared Responsibility Payments on TY 2014 Returns Through April 30, 201563
Returns Claiming Coverage 94 million
Returns with ISRP 6.6 million
Average ISRP per Return Reporting ISRP $190
Prepared Returns Reporting ISRP (Paid or Volunteer) 4.3 million
Returns Filed with Forms 8965, Health Coverage Exemptions 10.7 million
Returns Filed with Forms 8965 Claiming the Household Coverage Exemption (checked yes in Form 8965 Part II 7a or 7b or both)
3.2 million
Returns Filed with Forms 8965 Claiming Coverage Exemption (Part III) 7.5 milion
Prepared Returns Filed with Forms 8965 (Paid or Volunteer)5.7 million
(53% of returns with Form 8965)
62 WIRA, ACA Fact Sheet 05-21-2015 (returns processed through April 2015). This data is based on returns that had posted as of the end of April 2015 and is preliminary and subject to change as the IRS reviews the data, processes additional TY 2014 returns, and conducts compliance activities. Note that the number of “Returns Reporting Advanced PTC” is a subset of the number of “Returns Filed with Forms 8962, Premium Tax Credit (PTC).” All taxpayers claiming the PTC were required to file a Form 8962. Of those taxpayers whose returns were processed through April 30, about 93 percent claimed the Advanced PTC, while about seven percent waited to claim the PTC until they filed their returns. However, not all Advanced PTC recipients have filed returns and reconciled their credit amounts. Therefore, it is difficult to compare the “Total Advanced PTC Reported” (about $8.7 billion) to the “Total PTC Amount Claimed” (about $7.7 billion). The difference of roughly $1 billion is probably attributable, at least in part, to some taxpayers having reported receiving more in Advanced PTC during the year than they ultimately claimed. Of the 2.6 million returns filed with Forms 8962, about 1.6 million returns were prepared by a paid or vol-unteer preparer, and about one million were deemed self-prepared.
63 Id. This data is based on returns that had posted as of the end of April 2015 and is preliminary and subject to change as the IRS reviews the data, processes additional TY 2014 returns, and conducts compliance activities. Note that there were about 6.6 million returns reporting an ISRP. Of those, about 4.3 million were submitted on returns prepared by a paid or volunteer preparer, and about 2.3 million were deemed self-prepared. Taxpayers also filed about 10.7 million returns claiming an exemp-tion from the ISRP using Form 8965, Health Coverage Exemptions. Of those, about 53 percent were prepared by a paid or volunteer preparer, and about 47 percent were deemed self-prepared. Taxpayers who report an ISRP may or may not file Form 8965. The roughly 10.7 million returns claiming an exemption on Form 8965 were divided between about 7.5 million claim-ing a Part III coverage exemption for individuals and about 3.2 million claiming a Part II coverage exemption for households (although some taxpayers claimed an exemption in both Part II and Part III).

Taxpayer Advocate Service — Fiscal Year 2016 Objectives Report to Congress — Volume One 25
Preface Filing Season Review Areas of Focus Efforts to Improve
Advocacy Research Initiatives TAS Technology
IDENTITY THEFT
For much of the past decade, one of the biggest challenges facing taxpayers and the IRS each filing season has been the use of stolen taxpayer identities to commit refund fraud .64 In these cases, an identity thief committing refund fraud has been able to obtain the name and Social Security number (SSN) of a legiti-mate taxpayer and has then filed a return in the legitimate taxpayer’s name claiming a refund . The IRS uses a series of filters to try to identify potentially fraudulent returns .
If a fraudulent return is not stopped by the filters, the IRS generally pays out the claimed refund to the identify thief and then freezes the return of the legitimate taxpayer when he or she files later in the filing season . The legitimate taxpayer must then prove his or her identity and persuade the IRS that the prior-filed return was fraudulent before the IRS will pay his or her refund claim . If a return is stopped by the filters as potentially fraudulent, the IRS may freeze the account until it receives sufficient documentation to ensure it is paying the refund to the legitimate taxpayer .
The IRS developed the TPP as a way to suspend the processing of certain questionable returns . Taxpayers who are caught up in the TPP filters are notified that there was a problem in processing their return and are instructed to call the IRS or answer a series of “out-of-wallet” questions to self-authenticate online . Until then, the IRS suspends the processing of the return (i.e., the return becomes “unpostable,” in IRS parlance) .
During the 2015 filing season, the TPP stopped more than twice as many questionable returns as in the prior year . As of April 23, 2015, the TPP stopped 1,558,874 returns as compared with 764,439 at a similar point in 2014, an increase of 104 percent .65 Yet at least one-third of the returns stopped by the TPP turned out to come from legitimate filers; IRS data shows the false positive rate for the TPP was 34 percent as of June 18, 2015 .66 While we were not able to obtain the false positive rate for the overall TPP program for 2014 to make a direct comparison, we were able to obtain the false positive rate for the portion of TPP returns flagged by the Dependent Database (DDb) filters, which constitutes the largest portion of the TPP inventory . As of June 18, the false positive rate for the DDb filters is 36 percent this year, up from 20 percent in 2014 – an increase of about 80 percent . Thus, the com-bined effect of stopping twice as many returns and ending up with almost twice as high a false positive rate suggests the IRS may be delaying the issuance of refunds to nearly four times as many legitimate taxpayers as last year .
This high false positive rate can have a significant adverse financial impact on the affected taxpay-ers . Taxpayers caught up in the TPP filters are entitled to tax refunds . Among all taxpayers receiving refunds this filing season, the average refund amount was just over $2,700 .67 That being an “average,” some taxpayers were entitled to less while other taxpayers were entitled to considerably more . Taxpayers affected by identity theft often face considerable delays while the IRS validates their identities .68 Thus,
64 For additional discussion concerning the IRS’s efforts to prevent tax-related identity theft, see Area of Focus: The IRS Should Provide Victims of Identity Theft with a True Single Point of Contact to Help Them Resolve Their Account Problems and Obtain Their Refunds, infra.
65 IRS Return Integrity & Compliance Services (RICS), Update of the Taxpayer Protection Program (TPP) 6 (Apr. 29, 2015); RICS, Update of the Taxpayer Protection Program (TPP) 5 (Apr. 30, 2014).
66 See IRS, RICS, Update of the Taxpayer Protection Program (TPP) 9 (June 24, 2015).67 IRS, Filing Season Statistics for Week Ending April 17, 2015, available at http://www.irs.gov/uac/Newsroom/Filing-Season-
Statistics-for-Week-Ending-April-17-2015.68 See National Taxpayer Advocate 2014 Annual Report to Congress vol. 2, 52-53 (Research Study: Identity Theft Case Review
Report: A Statistical Analysis of Identity Theft Cases Closed in June 2014).

Section Two — Filing Season Review26
TAS Technology Research Initiatives Efforts to Improve Advocacy Areas of Focus Filing Season
Review Preface
the legitimate refund claims of more than 600,000 taxpayers have been blocked and delayed by the TPP filters so far this year .69
In addition, taxpayers who were impacted by the TPP have had extreme difficulty reaching a live assistor when they have called the telephone number listed on the notice they received . The LOS on the TPP line during the filing season overall was 17 percent,70 and during three consecutive weeks in late February and early March, it was below ten percent .71 It is difficult to overstate the frustration of a taxpayer whose return was suspended and who did not receive an expected refund, but could not reach the IRS on the number he or she was told to call .
It should be emphasized that the taxpayer problems arising from tax-related identity theft are caused in the first instance by criminals – not by the IRS . It should also be acknowledged again that the IRS faces significant resource constraints that are limiting its staffing in all areas . Still, the National Taxpayer Advocate believes the IRS can improve the quality of assistance it provides to victims of tax-related iden-tity theft to help them resolve their account problems and receive their refunds more quickly .
“Get Transcript” Data BreachIn late May, more than a month after the filing season ended, the IRS announced that cybercriminals had been able to access more than 100,000 taxpayer accounts by using its “Get Transcript” application .72 In so doing, they were able to obtain access to information that typically appears on a tax return, including the names, SSNs, and dates of birth of dependent children . This was an extraordinary data breach that has the potential to undermine taxpayer confidence in the security of the IRS’s data systems and has dealt at least a temporary setback to the IRS’s efforts to move more services online .
In announcing the data breach, the IRS emphasized that the cybercriminals were not able to break into the IRS’s data system and gain unfettered access to taxpayer accounts . Rather, the cybercriminals were able to obtain sufficient information about the roughly 100,000 victims (e.g., the taxpayer’s SSN, date of birth, and address) from other sources to pass the authentication screens one account at a time .
That is an important distinction . But it does not give the IRS a pass . Financial institutions and retail-ers widely recognize that criminals will periodically obtain enough information about individuals to impersonate them and access their accounts . In response, they deploy a variety of security measures to guard against the risk . No single security measure is perfect, and considerable amounts of data have been exposed . But as the custodian of taxpayers’ financial and personal information, the IRS bears a special responsibility to protect that information .
The IRS launched “Get Transcript” in early 2014 for a variety of reasons, including to reduce the costs of using employees to respond to transcript requests submitted by phone or on paper . The White House even promoted “Get Transcript” as a vehicle that would give student loan applicants “the ability to view, print, and download their tax transcripts – making it easier for student borrowers to access their own tax
69 See IRS, RICS, Update of the Taxpayer Protection Program (TPP) 9 (June 24, 2015) (showing that 1,788,856 returns were stopped by the TPP as of June 18 and the TPP had a 33.9 percent false positive rate, which means that more than 606,000 legitimate returns had been stopped as of that date).
70 IRS, JOC, FY 2015 Weekly TPP Snapshot (week ending Apr 18, 2015 (showing aggregate LOS for the Jan. 1 through Apr. 18 period)).
71 IRS, JOC, FY 2015 Weekly TPP Snapshot (weeks ending Feb. 28, 2015 [9.7 percent], Mar. 7, 2015 [7.6 percent], and Mar. 14, 2015 [9.8 percent]).
72 IRS Statement on the “Get Transcript” Application (May 26, 2015), available at http://www.irs.gov/uac/Newsroom/IRS-Statement-on-the-Get-Transcript-Application.

Taxpayer Advocate Service — Fiscal Year 2016 Objectives Report to Congress — Volume One 27
Preface Filing Season Review Areas of Focus Efforts to Improve
Advocacy Research Initiatives TAS Technology
records needed for loan and grant applications .”73 In retrospect, the IRS should assess whether it was so eager to roll out the “Get Transcript” application that it did not adequately consider the full range of security risks and implement sufficient measures to guard against them .
At this point, the IRS is one of the few tax agencies in the world that does not allow taxpayers to interact with it through online accounts . The National Taxpayer Advocate and others have recommended that the IRS accelerate its efforts to allow online access, and the IRS is in the process of doing so . But the “Get Transcript” incident serves as an important reminder that where data security must be balanced against convenience and budget savings, data security must be paramount . While the National Taxpayer Advocate continues to believe the IRS must expand the ability of taxpayers to interact with it digitally, all existing plans must be double-checked and then triple-checked before implementation to ensure that every reasonable data security precaution has been considered .
CONCLUSION
The IRS faced significant challenges this filing season and did a good job processing returns and deliver-ing refunds for the majority of taxpayers who did not require assistance . However, it did a poor job of meeting the needs of taxpayers who required help . To a significant degree, the IRS’s shortcomings are budget-driven . When an organization is given more responsibility and its budget is simultaneously reduced by about 17 percent on an inflation-adjusted basis, its performance almost inevitably will suffer . To improve taxpayer service, the IRS will need more resources to answer taxpayer telephone calls, process and respond to taxpayer correspondence, and assist taxpayers who seek assistance in its walk-in sites . At the same time, the IRS can take steps to improve its resource-allocation decisions . The following Areas of Focus outline multiple ways in which the IRS can improve its operations in an effective but cost-con-scious manner while at the same time protecting taxpayer rights and treating U .S . taxpayers in the manner they have a right to expect from their government .
73 Fact Sheet: Education Datapalooza to Promote Innovation in Improving College Access, Affordability, and Completion (Jan. 2014), available at https://www.whitehouse.gov/sites/default/files/docs/datapalooza_fact_sheet.pdf.