ii NOISE SOURCE IDENTIFICATION OF SPLIT UNIT AIR...
24
ii NOISE SOURCE IDENTIFICATION OF SPLIT UNIT AIR CONDITIONER SYSTEM MUHAMMAD HANIF BIN ABD RASID A report submitted in partial fulfilment of the requirements for the award of the degree of Bachelor of Mechanical Engineering Faculty of Mechanical Engineering UNIVERSITI MALAYSIA PAHANG NOVEMBER 2008
Transcript of ii NOISE SOURCE IDENTIFICATION OF SPLIT UNIT AIR...
ii
NOISE SOURCE IDENTIFICATION OF SPLIT UNIT AIR CONDITIONER SYSTEM
MUHAMMAD HANIF BIN ABD RASID
A report submitted in partial fulfilment of the requirements for the award of the degree of
Bachelor of Mechanical Engineering
Faculty of Mechanical EngineeringUNIVERSITI MALAYSIA PAHANG
NOVEMBER 2008

iii
SUPERVISOR’S DECLARATION
We hereby declare that we have checked this project and in our opinion this project is
satisfactory in terms of scope and quality for the award of the degree of Bachelor of
Mechanical Engineering.
Signature........................................
Name of Supervisor: Mr. Mohd Shahrir Bin Mohd Sani
Position: Deputy Dean
Date: ..................................
Signature................................
Name of Panel: Mr. Azizuddin Bin Abd Aziz
Position: Lecturer
Date: ....................................
iv
STUDENT’S DECLARATION
I hereby declare that the work in this thesis is my own except for quotations and
summaries which have been duly acknowledged. The thesis has not been accepted
for any degree and is not concurrently submitted for award of other degree.
Signature.............................................
Name: Muhammad Hanif Bin Abd Rasid
ID Number: MA05025
Date: .....................................
v
To my beloved Father and Mother
Abd Rasid Bin Haji Ayub
Habshah Binti Abu Hassan

vi
ACKNOWLEDGEMENTS
All praises and thanks be to Allah S.W.T, who has guided us to this, never
could we have found guidance, were it not that Allah had guided us! (Q7:43)
Greatest gratitude to my supervisor, Mr. Mohd Shahrir Bin Mohd Sani for his
supervision, advice, guidance and his time from the early stage of this project until
the end. His never give up on me and give me moral support when there is a problem
when doing this project.
I also would like to heartily thank to the technician in mechanical laboratory
University Malaysia Pahang for constantly being helping during my laboratory
sessions and of course to the rest of the staff, academic and non-academic wise.
Special thanks to my family for give me all their support since I was young
until I can enter University Malaysia Pahang (UMP) and end up my studied here. I
really appreciate for all what they had done for me. Last but not least, to all my
friends who shared their ideas and helped me doing this project successfully.
vii
ABSTRACT
Noise in split unit air conditioning system is a frequent problem for the air
conditioner manufactures. Split unit air conditioners have an indoor unit and an
outdoor unit connected by communication pipes. The noise can not be eliminated but
it can be reduced. Noise can make in some cases limit the cooling efficiency of the
air conditioner. In this project, to identify and analysis the noise at air conditioner
system was investigated by using sound intensity. The investigation was carried out
by varying the parameter which is the fan speed and temperature at air conditioner.
For the identify where the noise source comes form the rig had been build to get the
noise location and their rating by located the microphone at the rig point. The signal
from the probe will be analyze by the analyzer using Pulse LabShop software from
Brüel & Kjær. The results for the noise were showed in noise mapping. A different
colour in the noise mapping indicates different level of noise and it showed where
the most noise comes from. The highest noise sound levels occur at the front side of
air conditioner which is at the fan that is about 74.784dB. The second highest noise
sound level is occur at the right side which is at the compressor is about 72.115dB.
Comparison of the graph will show the relation between noise and the parameter and
it can be concluded that sound power level will increase as higher fan speed and the
lowest temperature of the air conditioner.
viii
ABSTRAK
Bunyi bising di dalam sistem pengahawa dingin jenis unit berasingan kerap kali
meninbulkan masalah kepada pengusaha penghawa dingin. Unit berasingan ini
terdiri daripada unit dalam dan unit luar yang disambung menggunakan paip. Bunyi
bising yang dihasilkan tidak boleh dihapuskan tetapi boleh dikurangkan. Dalam
beberapa perkara bunyi bising boleh mengurangkan kecekapan penghawa dingin
tersebut. Di dalam projek ini, cara keamatan bunyi digunakan untuk mengenal pasti
dan menganalisis bunyi bising di dalam sistem penghawa dingin. Kajian telah
dijalankan dengan mempelbagaikan pembolehubah seperti halaju kipas dan suhu
pada sistem penghawa dingin. Untuk mengenal pasti dari mana datangnya sumber
bunyi bising itu jaring telah dibina untuk mendapatkan lokasi serta kadar bunyi
bising tersebut dengan meletakkan mikrofon pada bahagian jaring itu. Signal
daripada penguji tersebut akan dianalisis oleh analyzer menggunakan perisian Pulse
LabShop dari Brüel & Kjær. Hasil bunyi bising itu ditunjukkan di dalam pemetaan
bunyi bising. Warna yang berbeza daripada pemetaan menunjukkan kadar bunyi
bising yang berbeza dan menunjukkan di mana sumber bunyi yang paling bising.
Bunyi yang paling bising berlaku pada bahagian depan iaitu kipas lebih kurang
74.784dB. Bunyi yang kedua paling bising berlaku pada bahagian kanan iaitu
pemampat lebih kurang 72.115dB. Perbezaan grah menunjukkan hubungan di antara
bunyi bising dengan pembolehubah tersebut dan ini boleh disimpulkan bahawa aras
kuasa bunyi akan bertambah dengan penambahan kelajuan kipas dan penurunan suhu
penghawa dingin.

ix
TABLE OF CONTENTS
Page
SUPERVISOR’S DECLARATION iii
STUDENT’S DECLARATION iv
ACKNOWLEDGEMENTS vi
ABSTRACT vii
ABSTRAK viii
TABLE OF CONTENTS ix
LIST OF TABLES xi
LIST OF FIGURES xii
LIST OF SYMBOLS xiv
LIST OF ABBREVIATIONS xv
CHAPTER 1 INTRODUCTION
1.1 Background 1
1.2 Problem Statements 2
1.3 Objectives 2
1.4 Scope of Project 2
1.5 Outline 3
1.6 Gantt Chart 3
CHAPTER 2 LITERATURE REVIEW
2.1 Air Conditioner 4
2.2 Air Conditioner System 4
2.3 Noise 6
2.4 Sound Intensity 6
2.5 Sound Intensity Instruments and Techniques 7

x
2.6 Sound Fields 8
2.7 Paper Review 9
CHAPTER 3 METHODOLOGY
3.1 Introduction 14
3.2 Methodology of Flow Chart 15
3.3 Fabrication of Rig 16
3.4 Experimental Setup 19
3.5 Analysis Parameters 21
3.6 Analysis for Noise Source 23
CHAPTER 4 RESULT AND DISCUSSIONS
4.1 Introduction 25
4.2 Mapping Process 25
4.3 Identify the Noise Location 26
4.4 Analysis Result on Different Parameter 38
4.4.1 Total Sound Power at Different Temperature 38 4.4.2 Total Sound Power at Different Fan Speed 41
CHAPTER 5 CONCLUSION AND RECOMMENDATIONS
5.1 Conclusions 45
5.2 Recommendations 46
REFERENCES 47
APPENDICES 49
xi
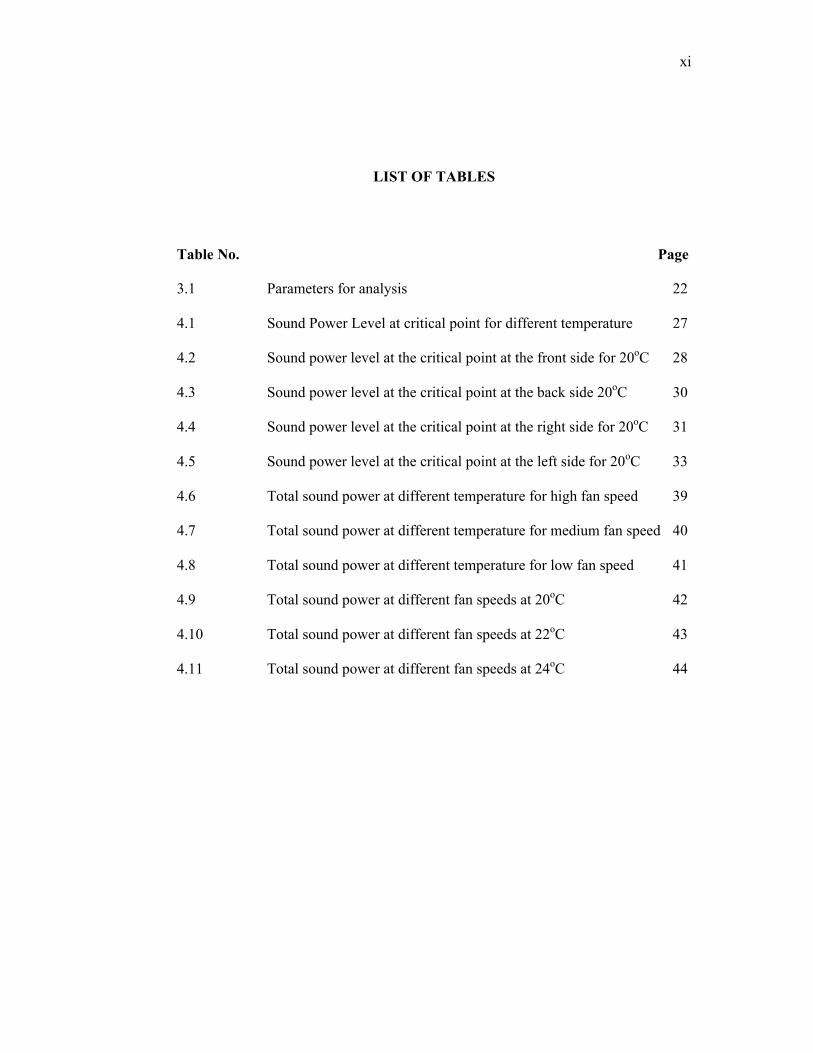
LIST OF TABLES
Table No. Page
3.1 Parameters for analysis 22
4.1 Sound Power Level at critical point for different temperature 27
4.2 Sound power level at the critical point at the front side for 20oC 28
4.3 Sound power level at the critical point at the back side 20oC 30
4.4 Sound power level at the critical point at the right side for 20oC 31
4.5 Sound power level at the critical point at the left side for 20oC 33
4.6 Total sound power at different temperature for high fan speed 39
4.7 Total sound power at different temperature for medium fan speed 40
4.8 Total sound power at different temperature for low fan speed 41
4.9 Total sound power at different fan speeds at 20oC 42
4.10 Total sound power at different fan speeds at 22oC 43
4.11 Total sound power at different fan speeds at 24oC 44

xii
LIST OF FIGURES
Figure No. Page
2.1 Split Unit Air Conditioner Systems 5
2.2 Instrumentation used for sound intensity measurements with a schematic representation of a measurement grid. 7
2.3 Sound fields 9
3.1 Flow chart of Methodology 15
3.2 The rig for mapping noise sources 16
3.3 Cut the steel with follow the dimension 17
3.4 Welding the steel to get the frame 17
3.5 Make a holes using hand drill 18
3.6 Tie the wire to make the cross section 18
3.7 Laptop with Pulse LabShop software 19
3.8 Real time analyzer 20
3.9 The probe 20
3.10 The outdoor unit 21
3.11 Components in outdoor unit 22
3.12 The probe position for left side measurement 23
3.13 The microphone were calibrate 24
3.14 Microphone has been calibrated 24
4.1 Front View 26
4.2 Back View 26

xiii
4.3 Left View 26
4.4 Right View 26
4.5 Frequency for front side is at 160Hz for 20oC 28
4.6 Noise sources for high speed fan at 20oC at the front side 28
4.7 Frequency for back side is at 630Hz for 20oC 29
4.8 Noise sources for high speed fan at 20oC at the back side 30
4.9 Frequency for right side is at 160Hz for 20oC 31
4.10 Noise sources for high speed fan at 20oC at the right side 31
4.11 Frequency for left side is at 160Hz for 20oC 32
4.12 Noise sources for high speed fan at 20oC at the left side 33
4.13 Noise sources for high speed fan at 22oC at the front side 34
4.14 Noise sources for high speed fan at 24oC at the front side 34
4.15 Noise sources for high speed fan at 22oC at the back side 35
4.16 Noise sources for high speed fan at 24oC at the back side 35
4.17 Noise sources for high speed fan at 22oC at the right side 36
4.18 Noise sources for high speed fan at 24oC at the right side 36
4.19 Noise sources for high speed fan at 22oC at the left side 37
4.20 Noise sources for high speed fan at 24oC at the left side 37
4.21 Graph of total sound power at different temperature for high fan speeds 38
4.22 Graph of total sound power at different temperature for medium fan speeds 39
4.23 Graph of total sound power at different temperature for low fan speeds 40
4.24 Graph of total sound power at different fan speeds at 20oC 41
4.25 Graph of total sound power at different fan speeds at 22oC 42
4.26 Graph of total sound power at different fan speeds at 24oC 43

xiv
LIST OF SYMBOLS
p(t) Instantaneous sound pressures
vr(t) Particle velocity in the direction of r
t Time
ω Natural Frequency
r The separation distance between the two microphones
G12 (ω) The one-sided cross-power spectrum density function between microphone channels1 and 2
ρ Density
Ir (ω) Sound Intensity

xv
LIST OF ABBREVIATIONS
hp Horsepower
HVAC&R Heating, ventilating, air conditioner and refrigerating
BLDC Brushless DC motor
CFD Computational Fluids Dynamics
CAE Computer Aided Engineering
NVH Noise, vibration, and harshness
FEM Finite Element Methods
MIG Metal Inert Gas

CHAPTER 1
INTRODUCTION
1.1 INTRODUCTION
Air conditioners are typically categorized into split-type and multi-type air
conditioners. Split-type air conditioners have an indoor unit and an outdoor unit
connected by communication pipes. Multi-type air conditioners have plural indoor
units connected to an outdoor unit. Air conditioners may also be categorized into
ones that air conditioners operate a refrigerant cycle in one direction to only supply a
room with cool air, and ones that selectively operate a refrigerant cycle in two
directions to supply a room with hot or cool air.
Now days, mostly every home has their own air conditioner system is to
provide comfort during hot days and nights. Usually, split unit air conditioner system
is commonly being use in more appliances.
A frequent problem for the air conditioner manufacture is the noise comes
from the air conditioner. Noise is considered undesirable and the cause of the noise
may in some cases even limit the heating or cooling efficiency of the air conditioner.
Noise level can not be eliminated but it can be reduce.
As the customer’s requirements for more silent operation of appliances is
increasing, reducing of the noise levels in air-conditioner is concentrated. An air-
conditioning system of low noise level is especially welcomed as the most important
aspect of installing it is to provide a comfortable environment for leisure, relaxation
and sleeping.

2
1.2 PROBLEM STATEMENTS
Live in comfort ness in their house is a dream of everyone. Consumers prefer
a low noise air conditioner to make sure that unwanted noise did not disturb them.
So, for the comfort ness reduces of the noise levels that occur from the air
conditioner is necessary.
1.3 OBJECTIVES
Basically, the objectives of this project are listed below:
a) To identify noise source in split unit air conditioner system using sound
intensity measurements.
b) To analysis the noise in split unit air conditioner system at different
parameter.
1.4 SCOPES OF PROJECT
This research focus on identify noise source that happen in split unit air
conditioner system using sound intensity measurements. The focus areas on this
project are:
a) Focuses on split unit air conditioner system with 1horsepower (hp).
b) Sound intensity mapping to measure the noise produces from the air
conditioner using Pulse LabShop software.
3
1.5 OUTLINE
This project present identifying the noise location and rating level of noise in
the split unit air conditioner system. This report consist 5 chapter contain background
of the project as well as the details information that clarify overall of project.
Chapter 1 is the introduction part for this project. On this chapter, the general
description of the problem is defined. This chapter consists of the objectives of this
project, the problem statements and the scope of study as well as the background of
this project.
Chapter 2 presents the literature review on the final year project. This project is
reviewed through from journal, books and technical note that are related to this
project to make this final project clearer.
Chapter 3 contains the flow chart and project methodology of this final year project
which shows how the project is carried on from the start until the end.
Chapter 4 covers the preliminary finding that is obtained from previous research
through the journal, books and technical note that suitable for the final year project.
The finding includes the result and discussion on the research that can be compared
with the result obtained from final year project.
Chapter 5 is the last chapter where overall project is concluded.
1.6 GANTT CHARTS
The Gantt chart shows all the project activities from week one until week
fourth teen. Start with define the title until go for presentation. The Gantt chart will
be attaching at the appendix A.
4
CHAPTER 2
LITERATURE REVIEW
2.1 AIR CONDITIONER
Air conditioner is a combined process that performs many functions
simultaneously. It conditions the air, transports it, and introduces it to the conditioned
space. It provides heating and cooling from its central plant or rooftop units. It also
controls and maintains the temperature, humidity, air movement, air cleanliness,
sound level, and pressure differential in a space within predetermined limit for the
comfort and health of the occupants of the conditioned space or for the propose of
product processing.
The term HVAC&R is an abbreviation heating, ventilating, air conditioner
and refrigerating. The combination of process in this commonly adopted term is
equivalent to the current definition of air conditioner. Because of all these individual
components processes were developed prior to the more complete concept of air
conditioning, the term of HVAC&R is of used by the industry. [1]
2.2 AIR CONDITIONER SYSTEM
An air conditioning or HVAC&R, systems is composed of components and
equipments arranged in sequence to conditioned space and control the indoor
environmental parameters of a specific space within required limits.

5
Figure 2.1 Split Unit Air Conditioner SystemsSource: Handbook of air conditioner and refrigeration
Most of air conditioning systems perform the following functions:
a) Provide the cooling and heating energy required.
b) Condition the supply air, that is, heat or cool, humidity or dehumidify,
clean or purify, and attenuate any objectionable noise produce by the
HVAC&R equipment.
c) Distributed the conditioned air, containing sufficient outdoor air, to the
conditioned space.
d) Control and maintain the indoor environmental parameters – such as
temperature, humidity, cleanliness, air movements, sound level, and
pressure differential between the conditioned space and surroundings –
within predetermined limits.
6
Parameters such as the size and the occupancy of the conditioned space, the
indoor environmental parameter to be controlled, the quality and the effectiveness of
control and the cost involved determine the various types and arrangements of
components used to provide appropriate characteristic. [1]
2.3 NOISE
Sounds are unpleasant or unwanted are called noise. Noise problem are
commonly happen in split unit air conditioner system. The noise produced by an air
conditioning and heating unit may be caused by several mechanical and aerodynamic
sources:
a) Vibration of the compressor shell.
b) Electric motor vibration.
c) Fan noise. [2]
Noise is a very important performance of a split-unit air condition which
consists of indoor set and outdoor set. The noise generated by an air conditioner
outdoor set consists of three parts:
a) The aerodynamic noise.
b) The high frequency noise generated by the compressor.
c) The low frequency vibrating noise. [3]
2.4 SOUND INTENSITY
Noise is an unavoidable part of everyday life and technological development
has resulted in an increase in noise level from machines, factories and traffic. Noise
that produce from air conditioner system can causes annoyance and hearing damage.
It is therefore important that steps towards a reduction in noise are taken, so that
noise is not something that had to accept.
7
In order to reduce noise, the amount and location of noise have to be
identifying by using sound intensity mapping. Sound intensity is defined as the rate
of energy flow through a unit area. When locating the source of sound, sound
intensity is very useful because it is a vector unit that gives the magnitude and
direction. [4]
2.5 SOUND INTENSITY INSTRUMENTS AND TECHNIQUES
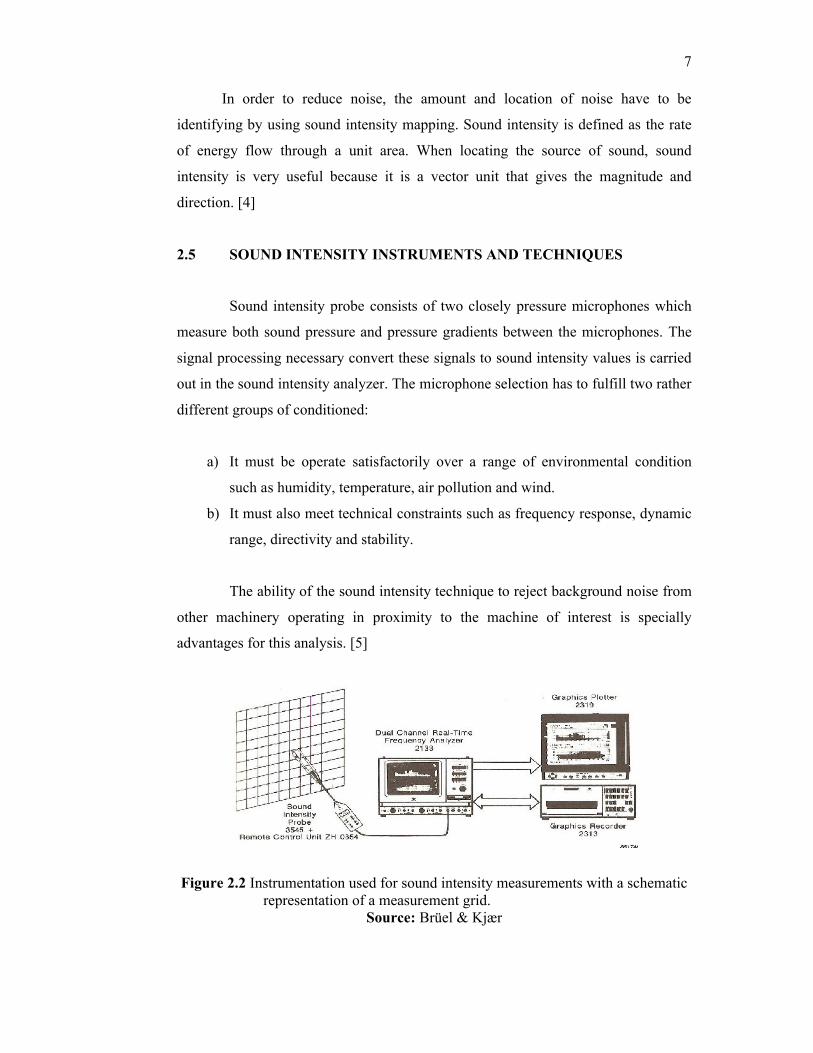
Sound intensity probe consists of two closely pressure microphones which
measure both sound pressure and pressure gradients between the microphones. The
signal processing necessary convert these signals to sound intensity values is carried
out in the sound intensity analyzer. The microphone selection has to fulfill two rather
different groups of conditioned:
a) It must be operate satisfactorily over a range of environmental condition
such as humidity, temperature, air pollution and wind.
b) It must also meet technical constraints such as frequency response, dynamic
range, directivity and stability.
The ability of the sound intensity technique to reject background noise from
other machinery operating in proximity to the machine of interest is specially
advantages for this analysis. [5]
Figure 2.2 Instrumentation used for sound intensity measurements with a schematic representation of a measurement grid.
Source: Brüel & Kjær

8
2.6 SOUND FIELDS
The sound energy will not always be allowed to radiate freely from the
source. When sound radiated in a room reaches the surfaces some energy will be
reflected and some will be absorbed by, and transmitted through the surfaces. In a
room with hard reflecting surfaces, all the energy will be reflected and a so called
diffuse field with sound energy uniformly distributed throughout the room is set up.
Such a room is called a reverberation room. In a room with highly absorbent surfaces
all the energy will be absorbed by the surfaces and the noise energy in the room will
spread away from the source as if the source was in a free field. Such a room is
called an anechoic room.
In practice, the majority of sound measurements are made in rooms that are
neither anechoic nor reverberant but somewhere in between. This makes it difficult
to find the correct measuring positions where the noise emission from a given source
must be measured. It is normal practice to divide the area around a noise source:
a) Near field
The area very close to the machine where the sound pressure level may
vary significantly with a small change in position. The area extends to a
distance less than the wavelength of the lowest frequency emitted from
the machine, or at less than twice the greatest dimension of the machine,
whichever distance is the greater. Sound pressure measurements in this
region should be avoided.
b) Far field
Divided into the free field and the reverberant field.
c) Free field
The sound behaves as if in open air without reflecting surfaces to interfere
with its propagation. This means, that in this region the sound level drops
6 dB for a doubling in distance from the source.

9
d) Reverberant field.
Reflections from walls and other objects may be just as strong as the
direct sound from the machine. [4]
Figure 2.3 Shows details on sound fieldsSource: Brüel & Kjær
2.7 PAPER REVIEW
Cogging torque from Brushless DC (BLDC) motor is an undesirable effect
that prevents the smooth rotation of the rotor and results in noise. This paper
identifies the source of excessive noise in the small fan-motor system for household
refrigerators. The source is presumed to a mechanical resonance excited by torque
ripple of the BLDC motor. By using finite element analysis, natural frequencies and
mode shapes of the rotating part of the system are obtained and they are compared
with experimental mode shapes obtained by electronic torsional excitation test which
uses BLDC motor itself as an exciter. Measurement of noise and vibration was
conducted in an anechoic room. An accelerometer (B&K4371) was set on the top of
the motor and a microphone (LA5110, Onno-Sokki) was set 0.50m apart from the
fan motor at the same height. A four-channel FFT analyzer (Medallion 2300, Zonic)
was used for data acquisition and signal processing. [6]

10
Sound intensity at a point in a sound field in a specific direction r can be
expressed as:
T
rr dttvtpT
I0
)()(1
(1)
where T is a sufficiently long averaging time, p(t) and are instantaneous
sound pressures, vr(t) and particle velocity in the direction of r. The tests were carried
out in an anechoic room, which has acoustic wedges on all surfaces except the floor,
which is of smooth concrete. The sound pressure at the midpoint of the two
microphones can be obtained by taking the arithmetic average of two sound pressure
signals:
2
)()()( 21 tPtP
tP
(2)
The particle velocity at that midpoint can be obtained by Euler’s equation for
a zero-mean velocity medium:
rj
tPtPdttpVr
)()()(
1 12 (3)
By using Fourier transforms, sound intensity can also be expressed as
r
GI r
)(Im)( 12 (4)
The measurements were made with a two-microphone sound intensity probe
and these resulted in sound power level data. The sound power levels produced by
radiation from the inlet, exhaust and cabinet were obtained for five different volume
flow rates. Some studies on fan noise have found that it is of little use to experiment
with minor changes in geometry or configuration of the fan itself in an attempt to
reduce noise. This is because fan performance and efficiency are normally adversely
affected by such changes.