II I IIII !:::~llllh - justiceacademy.org · 2-step cert. 2.3 2.0 1.5 1.4 0.4 2-step reg. 2.2 1.9...
56
1111111111 ,1111111111111, 11111111\1111 I 1111 11 ' 11111111 11 , 1111111 1111 111111111 II II 1111111111 III 111111 111111111111 II 1111111:::: I I 111111 11111111111 11111 111111 IIII 1111111111 111111111111111' A COMPARATIVE STUDY OF JURY SELECTION SYSTEMS Federal Judicial Center
Transcript of II I IIII !:::~llllh - justiceacademy.org · 2-step cert. 2.3 2.0 1.5 1.4 0.4 2-step reg. 2.2 1.9...

1111111111 ,1111111111111,
11111111\1111 I 1111 11'
11111111 11 , 1111111 1111
111111111 II II1111111111 III
111111 111111111111 II 1111111::::I I 111111 11111111111 11111 111111IIII !:::~llllh
1111111111 111111111111111'
ACOMPARATIVE STUDY OF JURY SELECTION SYSTEMS
Federal Judicial Center

A COMPARATIVE STUDY OF JURY SELECTION SYSTEMS
An Empirical Analysis of First-Class versus Certified Mail for Service of Summons
and Simultaneous versus Separate Delivery
of Summons and Qualification Questionnaire
John E. Shapard
Federal Judicial Center September 1981
This paper is a product of a study undertaken in furtherance of the Center's statutory mission to conduct and stimulate research and development on matters of judicial administration. The analyses, conclusions, and points of view are those of the author. This work has been subjected to staff review within the Center, and publication signifies that it is regarded as responsible and valuable. It should be emphasized, however, that on matters of policy the Center speaks only through its Board.
Cite as J. Shapard, A Comparative Study of Jury Selection Systems
(Federal Judicial Center 19S1).
FJC-SP-Sl-3
TABLE OF CONTENTS
I. INTRODUCTION • • • • • • . . . . . 1
II. ANALYSIS OF EFFICIENCY • • . . . . . . . . . . 4
III. DIFFERENTIAL EFFECTS OF FIRST-CLASS AND CERTIFIED MAIL • • • • • • • • • • . . . . . . . ., 8
Effects on Efficiency • • • • • • • 8 Effects on Race and Sex Composition .. .... 11
IV. CONCLUSION AND RECOMMENDATION . . . . . . . . . . . . 14
APPENDIX • • • • . . . . . . . . . . . . . . . 17
iii

I. INTRODUCTION
The study reported here was an effort to compare the effec
tiveness of four different systems of juror selection. The term
"juror selection system" refers to the process that results in
citizens appearing at the courthouse, available for service on
grand or petit juries. It does not refer to the in-court selec
tion of a panel of prospective jurors for voir dire, nor to the
selection of a petit jury through voir dire. The term "jurors"
is hereafter used interchangeably with "prospective jurors."
This report presents a summary description of the methods
employed in the study and the principal results. The appendix
offers a more complete description of the methodology and re
sults.
The four juror selection methods investigated are simply the
four possible combinations of two significant choices that can be
made in designing a system that begins with a list of names and
addresses from a source list (for example, a list of registered
voters), then inquires into the qualifications of these persons,
and ends with jury service on the part of a subset of the origi
nal group. The two options that define the four selection sys
tems arE!: (I) The qualification and summoning of jurors can be
done in separate steps or as a single step. (2) The summons can
be delivered by certified mail or by regular (first-class) mail.
I

2
The present system used by United States district courts,
and prescribed by the Jury Selection and Service Act of 1968 (28
u.s.c. §§ 1861-1869), is a two-step, certified-mail system. In
the first step, names of prospective jurors are drawn at random
from voter registration rolls, and qualification questionnaires
are mailed (by regular mail) to the named jurors. Responses to
the qualification questionnaire enable the court to place the
juror in one of four categories: not qualified, exempt, excused,
or qualified. For the purposes of this analysis, the not quali
fied, exempt, and excused categories can be lumped together into
an unqualified category, which includes jurors who have been
"filtered out" by the system and will no longer be considered for
jury service. In the second step, summonses to appear for jury
service are sent to qualified jurors by certified mail. Subse
quently, some proportion of those summoned will appear for ser
vice.
Some state court systems are now using a one-step system
(with regular or certified mail) that has come to be known as a
"direct summoning" system. In this system, jurors selected at
random from the source list are sent both a summons and a quali
fication questionnaire in a single mailing. Although there is
some variation in the steps the juror is directed to take, we
focus here on a system that directs the juror to complete and
return the questionnaire and to appear at the courthouse on the
date specified unless notified to the contrary. If, on receipt
of the questionnaire, the court determines that the juror is
3
excused, exempt, or not qualified, it then sends a notice that
the juror need not appear.
In all four of the systems to be compared, the filtering out
of jurors is much more complex than is apparent from the descrip
tions given above. Because of the variation in and interaction
of a number of filters, the effectiveness of the systems may dif
fer. Moreover, since the nature of the filters varies from court
to court, it is plausible that one system might be the most effi
cient in one court but the least efficient in another court.
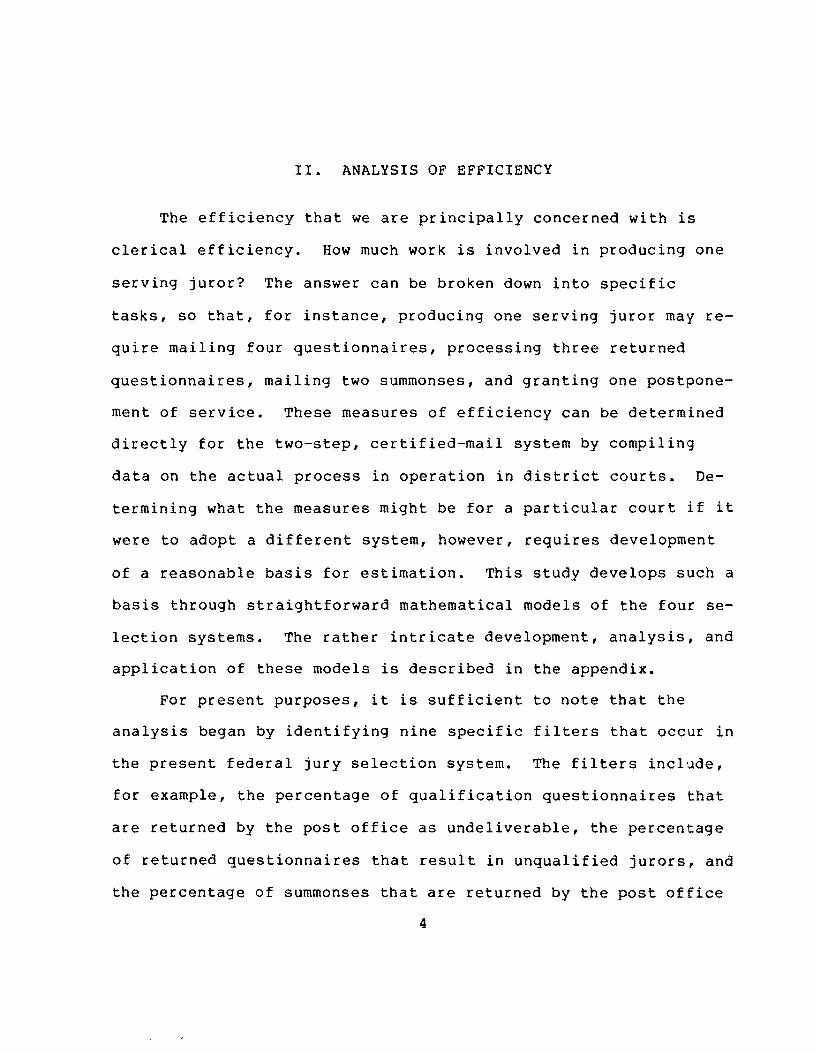
II. ANALYSIS OF EFFICIENCY
The efficiency that we are principally concerned with is
clerical efficiency. How much work is involved in producing one
serving juror? The answer can be broken down into specific
tasks, so that, for instance, producing one serving juror may re
quire mailing four questionnaires, processing three returned
questionnaires, mailing two summonses, and granting one postpone
ment of service. These measures of efficiency can be determined
directly for the two-step, certified-mail system by compiling
data on the actual process in operation in district courts. De
termining what the measures might be for a particular court if it
were to adopt a different system, however, requires development
of a reasonable basis for estimation. This study develops such a
basis through straightforward mathematical models of the four se
lection systems. The rather intricate development, analysis, and
application of these models is described in the appendix.
For present purposes, it is sufficient to note that the
analysis began by identifying nine specific filters that occur in
the present federal jury selection system. The filters incl~de,
for example, the percentage of qualification questionnaires that
are returned by the post office as undeliverable, the percentage
of returned questionnaires that result in unqualified jurors, and
the percentage of summonses that are returned by the post office
4

5
as "unclaimed" or "refused." These nine filters define the cur
rent system in mathematical terms. Mathematical models for the
three hypothetical systems were then developed by noting the
differences in the filters that would be expected for one-step
mailing or for use of regular-mail delivery. Finally, data on
the current processes in operation in the courts under study, as
well as data obtained from experimental comparisons of regular
and certified mail, were used to estimate the values of the
filters for the hypothetical systems. The models for all four
systems were then used to estimate the number and type of
specific tasks required, on the average, to obtain one serving
juror.
An additional aspect of the study was the collection of
estimates, from local jury clerks, of actual time consumed (or
likely to be consumed) by each of these tasks. These estimates
were combined with the estimates of numbers of tasks to produce
final estimates of the number of man-hours consumed in obtaining
one serving juror. These final estimates are presented in table
1. The more detailed estimates of number and type of tasks re
quired per serving juror are shown in table 2.
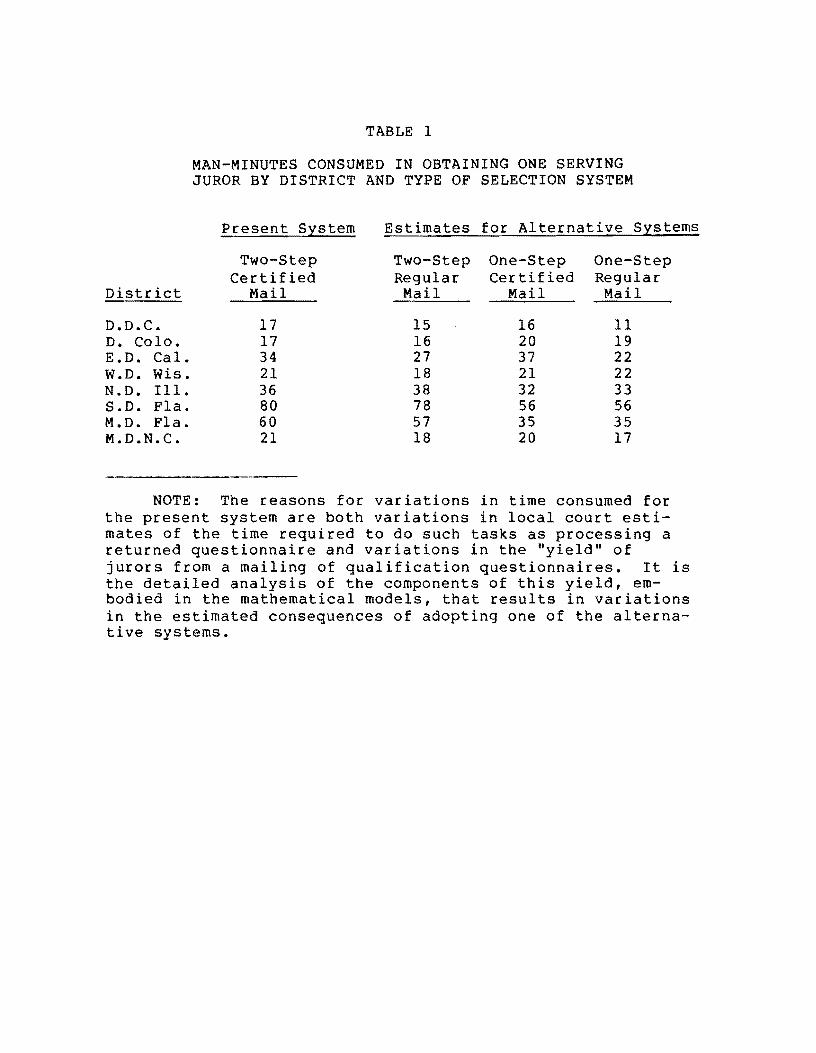
TABLE 1
MAN-MINUTES CONSUMED IN OBTAINING ONE SERVING JUROR BY DISTRICT AND TYPE OF SELECTION SYSTEM
Present System Estimates for Alternative Systems
District
Two-Step Certified
Two-Step Regular
One-Step Certified
One-Step Regular
D.D.C. D. Colo. E.D. Cal. W.D. Wis. N.D. Ill. S.D. Fla. M.D. Fla. M.D.N.C.
17 17 34 21 36 80 60 21
15 16 27 18 38 78 57 18
16 20 37 21 32 56 35 20
11 19 22 22 33 56 35 17
NOTE: The reasons for variations in time consumed for the present system are both variations in local court esti mates of the time required to do such tasKs as processing a returned questionnaire and variations in the "yield" of jurors from a mailing of qualification questionnaires. It is the detailed analysis of the components of this yield, embodied in the mathematical models, that results in variations in the estimated consequences of adopting one of the alternative systems.
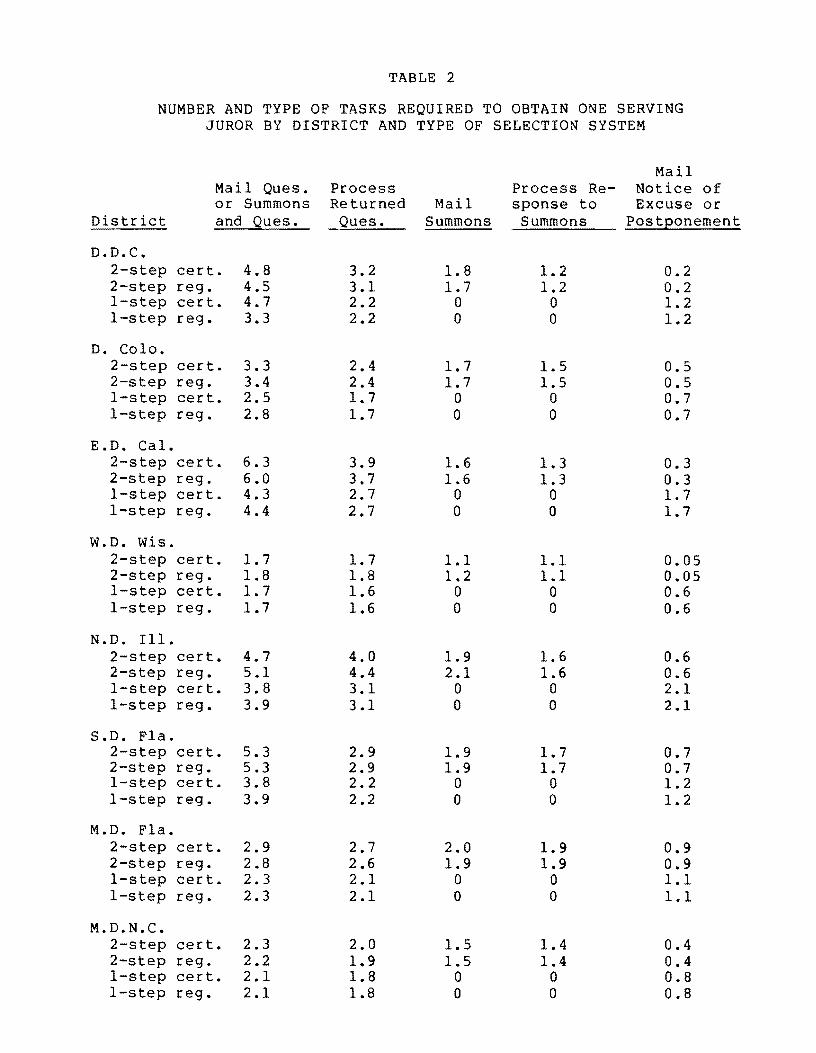
TABLE 2
NUMBER AND TYPE OF TASKS REQUIRED TO OBTAIN ONE SERVING JUROR BY DISTRICT AND TYPE OF SELECTION SYSTEM
Mail Mail Ques. Process Process Re- Notice of or Summons Returned Mail sponse to Excuse or
District and Ques. Ques. Summons Summons Postponement
D.D.C. 2-step cert. 4.8 3.2 1.8 1.2 0.2 2-step reg. 4.5 3.1 1.7 1.2 0.2 I-step cert. 4.7 2.2 0 0 1.2 I-step reg. 3.3 2.2 0 0 1.2
D. Colo. 2-step cert. 3.3 2.4 1.7 1.5 0.5 2-step reg. 3.4 2.4 1.7 1.5 0.5 I-step cert. 2.5 1.7 0 0 0.7 I-step reg. 2.8 1.7 0 0 0.7
E.D. Cal. 2-step cert. 6.3 3.9 1.6 1.3 0.3 2-step reg. 6.0 3.7 1.6 1.3 0.3 I-step cert. 4.3 2.7 0 0 1.7 I-step reg. 4.4 2.7 0 0 1.7
W.D. Wis. 2-step cert. 1.7 1.7 1.1 1.1 0.05 2-step reg. 1.8 1.8 1.2 1.1 0.05 I-step cert. 1.7 1.6 0 0 0.6 I-step reg. 1.7 1.6 0 0 0.6
N.D. Ill. 2-step cert. 4.7 4.0 1.9 1.6 0.6 2-step reg. 5.1 4.4 2.1 1.6 0.6 I-step cert. 3.8 3.1 0 0 2.1 I-step reg. 3.9 3.1 0 0 2.1
S.D. Fla. 2-step cert. 5.3 2.9 1.9 1.7 0.7 2-step reg. 5.3 2.9 1.9 1.7 0.7 I-step cert. 3.8 2.2 0 0 1.2 I-step reg. 3.9 2.2 0 0 1.2
M.D. Fla. 2-step cert. 2.9 2.7 2.0 1.9 0.9 2-step reg. 2.8 2.6 1.9 1.9 0.9 I-step cert. 2.3 2.1 0 0 1.1 I-step reg. 2.3 2.1 0 0 1.1
M.D.N.C. 2-step cert. 2.3 2.0 1.5 1.4 0.4 2-step reg. 2.2 1.9 1.5 1.4 0.4 I-step cert. 2.1 1.8 0 0 0.8 I-step reg. 2.1 1.8 0 0 0.8
III. DIFFERENTIAL EFFECTS OF FIRST-CLASS AND CERTIFIED MAIL
Effects on Efficiency
The experimental comparisons of regular and certified mail
warrant special attention, since they provided information of
importance to the design of jury selection systems in general.
They were used in this project for two purposes: to generate
data required for the models of selection systems and to assess
the consequences of type of mail delivery for the race and sex
composition of those responding to a mailing. The consequences
for race and sex composition are discussed later in this chapter~
here we focus on the consequences for efficiency.
Experiments were conducted in six of the federal courts
under study. In each experiment, a fairly large group of
prospective jurors was divided in half in a random fashion: one
half was sent a questionnaire or summons by certified mail and
the other half was sent the material by regular mail. There were
two important results relevant to the efficiency of the types of
mail in reaching the addressees and in achieving responses.
First, in two of the four experiments for which we obtained
information on race and sex of the respondents, there was a clear
difference between the types of mail in the frequency with which
respondents failed to indicate their race or sex. In both cases,
certified mail resulted in a superior rate of response. In the
8
9
District of Columbia, 10 percent of the regular-mail respon
dents failed to indicate their race, but only 5 percent of the
certified-mail respondents failed to do so. That experiment
involved 2,000 questionnaires, so this result is very significan1
(.01 level of significance). The effect was the same in the
Northern District of Illinois. There, 13 percent of the
regular-mail respondents failed to indicate race, in contrast to
9 percent of the certified-mail respondents (.05 level). Al
though this may support the theory that prospective jurors more
readily respect requirements communicated by certified mail, the
second result of the experiments casts this interpretation in
doubt. As we explain below, certified mail proved to be less
effective in actually reaching the addressees, suggesting that
the difference in failure to indicate race may be nothing more
than a reflection of the difference between persons who receive
certified mail and those who do not.
For each type of mail, we identified the percentage of ques
tionnaires or summonses actually delivered by the post office as
well as the percentage that were returned completed (in the case
of questionnaires) or responded to (in the case of summonses).
The results are shown in table 3.
In all but one district, regular mail achieved a rate of de
livery superior to that of certified mail, the difference being
quite dramatic in the District of Columbia. The net rates of re
turn or response, however, did not differ as much, and the dif
ferences were of consequence in only two districts. The reason

10
TABLE 3
PERCENTAGES OF QUESTIONNAIRES OR SUMMONSES DELIVERED AND RETURNED OR RESPONDED TO BY TYPE OF MAIL
Delivered Returned or Responded to
District Certified Regular ~* Certified Regular §.!9.~*
E.D. Cal. 89% 94% .01 D. Colo. 94 98 .05 91% 91% nsd D.D.C. 54 80 .01 45 54 .01 S.D. Fla. 93 96 .10 93 96 .10 N.D. Ill. 84 91 .01 78 76 nsd W.D. Wis. 94 93 nsd 91 85 .05
NOTE: Questionnaires only were mailed in all districts except the Southern District of Florida, in which summonses only were mailed. All summonses delivered in this district, whether by regular mail or by certified mail, were responded to. Return data were not obtained for the Eastern District of California.
*Statistical significance level of the difference in results between regular and certified mail; "nsd" means no significant difference, .01 indicates a very significant difference, and .10 indicates a marginally significant difference.
is that certified mail generally results in higher response rates
from those to whom it is delivered than does regular mail. The
implication seems to be that although persons who receive certi
fied mail respond more readily than do those who receive regular
mail, regular mail is generally more effective in reaching the
addressee and usually affords a net response rate as good as or
better than that for certified mail. In light of the fact that
certified mail demands greater effort on the part of court per
sonnel and the postal service, the results suggest that regular
mail should be an allowable, if not the preferred, method for de
livery of juror summonses.
11
Effects on Race and Sex Composition
An important potential consequence of choosing any of the
four jury selection systems studied is the effect the selection
method will have on the representativeness of pools of potential
jurors. A dominant goal of the Jury Selection and Service Act is
to ensure that jurors are selected from a "fair cross section of
the community." To monitor the representativeness of jury
wheels, the juror qualification forms used by federal district
courts ask the juror to indicate race and sex. This indication
provided us with a means to assess the potential effects of a
change in selection systems on the race and sex composition of
the resultant jury pools. We obtained race and sex data in four
of the six experimental mailings.
The only difference among the four jury selection systems
that is particularly likely to affect representativeness is that
between regular mail and certified mail for delivery of sum
monses. The two types of mail differ both in the mechanism by
which they are delivered to the addressee and in the importance
or official character they symbolize. Delivery of certified mail
may be refused by one who expects it to convey "bad news." More
important, if no one is available to accept certified mail when
delivery is first attempted, the mail is generally not rede
livered without action by the addressee. There is ample reason
to suspect that the consequences of these differences vary among
addressees of different races, insofar as race correlates with
differences in socioeconomic factors. There is also reason to
12
suspect a correlation with the sex of the addressee, insofar as
it is more likely that someone will be home to accept a certified
letter at the residence of a female addressee than at that of a
male addressee (for example, in the case of single parents). On
the other hand, there is no apparent reason to believe that the
difference between one-step and two-step qualification and sum
moning would have consequences that would differ according to
race or sex. We therefore investigated the effects on race and
sex composition of jury pools only for the two types of mail
delivery.
The results were mixed, suggesting that type of mail can
indeed have an effect on the race and sex composition of juror
pools. But such effects do not always occur, nor do they pre
dictably result in an increase or decrease in representativeness.
In the Southern District of Florida, a mailing of 400 summonses,
half by each type of mail, showed a modest (.10 level of signifi
cance) difference in race composition of those responding but no
difference in sex composition. The apparent consequence is dif
ficult to evaluate, however. Certified mail resulted in a modest
overrepresentation of nonwhites among those responding (17 per
cent versus 12 percent in the population according to the 1970
census), whereas regular mail resulted in an underrepresentation
of nonwhites (10 percent versus 12 percent). In no other dis
trict was there evidence that race composition was influenced by
type of mail.
In the Western District of Wisconsin, an experimental mail
13
ing of 400 questionnaires (200 by each type of mail) evidenced a
clear influence of type of mail on the sex composition of respon
dents (.05 significance level). Again, neither type of mail pro
duced an obviously superior level of representativeness. Certi
fied mail p~oduced an underrepresentation of females (46 percent
as opposed to the 52 percent in the population), while regular
mail produced an overrepresentation of females (60 percent versus
52 percent). There was no evidence that sex composition was
influenced by type of mail in any of the other experiments.
Race and sex data were also obtained from the experiments
conducted in the District of Columbia and the Northern District
of Illinois. In neither district was there a significant differ
ence in race or sex composition among those who indicated their
race and sex. As we noted earlier, however, there were signifi
cant levels of nonresponse to the race and sex questions in these
districts. Since those failing to indicate race or sex may be
over representative of one race or sex, we cannot be certain that
type of mail does not affect the race or sex composition of jury
pools in these districts.
IV. CONCLUSION AND RECOMMENDATION
Inspection of tables 1 and 2 suggests that none of the four
selection systems studied would be the most efficient method for
all courts. On the other hand, each of the three hypothetical
systems promises significant time savings for some courts, with
savings of 30 to 40 percent projected for three of the eight
courts studied. From table 1, we can calculate that the average
amount of clerical time devoted to obtaining one serving jur3r is
approximately forty minutes. If each of the eight courts adopted
the system that promised it the greatest efficiency, and if the
time estimates were realized in actual implementation, the aver
age amount of clerical time would be reduced to twenty-eight min
utes. Projecting this figure over the estimated 168,000 individ
uals serving as federal jurors per year reveals a potential
savings of 33,000 hours of clerical time per year. If the actual
cost of employing clerical personnel is $20,000 per annum, the
potential dollar savings is roughly $350,000 per year. Although
this estimate is both crude and conservative--conservative be
cause it is the larger courts, which use more jurors, that would
realize the greater economies, and crude because actual implemen
tation of an alternative system might yield greater or lesser
savings than those estimated--it seems unlikely that the actual
savings would exceed $1 million. Although this is a modest sum
14
15
for a nationwide effort, there appears to be no compelling reason
to forgo the opportunity of realizing such savings.
Based on the results of this study, we recommend that courts
be permitted to use a one-step procedure for qualification and
summoning of jurors and regular mail for service of the summons.
The only disadvantage of the one-step system is that in small
courts it might cause a modest increase in the difficulty of pre
dicting how many jurors will actually appear from a particular
summons mailing. Nor is there any net disadvantage to the use of
regular mail for delivery of the summons. Although a change from
certified to regular mail might alter the race and sex represen
tativeness of serving jurors, the change could be either benefi
cial or detrimental. It is sufficient, in this respect, that the
districts be aware of this effect, and measure it to ensure that
any change is not adverse. Moreover, it appears that regular
mail will usually, though not always, result in a rate of re
sponse to the summons that equals or surpasses that achieved by
certified mail. Although we cannot say that regular mail ought
always to be the preferred method for service of summonses, it
seems clear that it ought to be an allowable method. Once given
statutory authority to do so, districts wanting to change to
regular mail are advised to compare the two types of mail, by
experiments conducted in the normal course of their juror summons
activity, to ascertain which is most suited to their circum
stances. Any court that chooses to employ regular mail for
service of summonses may want to use certified mail for resum
16
moning of persons who fail to respond to the initial service,
thus preserving the ability to sanction such failure.
Because these two innovations promise benefits for some
courts, with no apparent systematic adverse effects, we recommend
that the Jury Selection and Service Act be amended to allow both
service of summonses by regular mail and a one-step qualification
and summons procedure at the option of individual district
courts.

APPENDIX

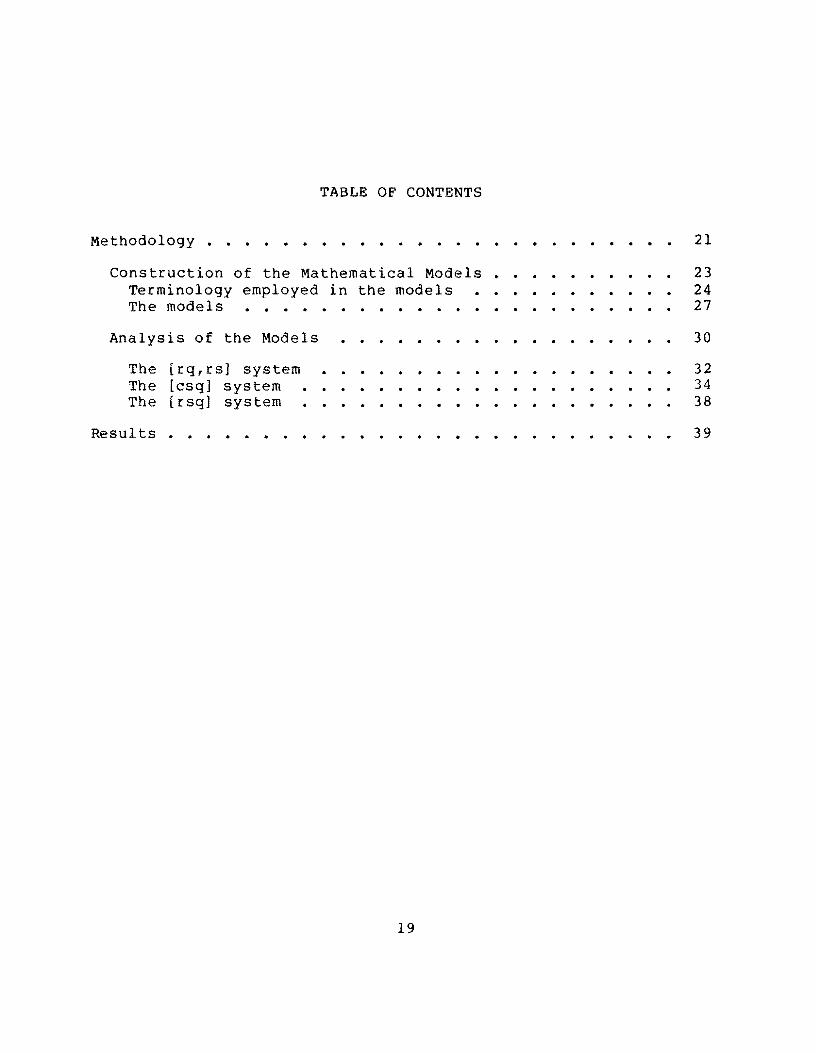
TABLE OF CONTENTS
Methodology • • • . . . . . . . . . . . . . . . . . . . . 21
Construction of the Mathematical Models • 23 Terminology employed in the models 24 The models . • • • • • • . • • . • • 27
Analysis of the Models . . . . . . . . . . . . . . . . 30
The [rq,rs] system 32 The [csq] system 34 The [rsq] system 38
Resul ts 39
19

21
Methodology
There were several distinct components to the data collec
tion and analysis performed for this project. First, data were
collected on the quantitative details of the filtering out of
jurors in the selection process as actually conducted in each of
the eight participant courts. This information permitted us to
model the selection system as it ~xisted at the time the study
was conducted. Second, experimental mailings of summonses or
qualification questionnaires were conducted in six of the parti
cipating courts. In each experiment, two groups of jurors were
selected at random from either the master jury wheel or the
qualified wheel. Members of one group were sent a questionnaire
or summons by certified mail, while members of the other group
were sent a questionnaire or summons by regular mail. The ex
periments served two functions. First, they provided quantita
tive details of filtering as it differed according to the type of
mail delivery, which permitted construction of models of the per
formance of the three hypothetical selection systems. These
models, in turn, yielded estimates of the filtering process that
would occur with each system. Second, the experiments that in
volved juror qualification questionnaires yielded data on the
race and sex composition of responding and qualified jurors,
which permitted inference of the effects of type of mail on the
representativeness of the jury wheels thus obtained. Finally,
the personnel of each court estimated the time required to per
form specific clerical tasks associated with juror selection.
22
This allowed us to make predictions for each of the four models
of actual clerical time required to obtain one serving juror,
which was used as the ultimate measure of the efficiency of each
selection system.
The eight courts participating in the study were selected to
be representative of United States district courts in general.
First, each federal judicial district was assigned to one of
three groups according to size of the district as measured by
juror service days consumed per year. Ten districts were then
selected at random from each group, and questionnaires were sent
to the thirty selected courts to ascertain whether their records
of jury selection processes were capable of revealing the re
quired data about the filtering out of jurors at each stage of
the selection process. From among those courts that could pro
vide the necessary data, three were then randomly selected from
each group to participate in the study. In one of the three
"large" courts, critical data were eventually lost because of the
resignation of the lead jury clerk, so that court was omitted
from the study. The eight courts studied were the District of
Columbia and Northern Illinois, representing the large courts;
Eastern California, Colorado, and Southern Florida, representing
the medium courts; and Middle Florida, Middle North Carolin~, and
Western Wisconsin, representing the small courts. Although the
court selection process avoided selectivity that might lead to
systematic bias in the study results, the small number of courts
involved makes it impossible to assume that the results suggested
for these courts would be realized in others.
23
Construction of the Mathematical Models
This section describes the central and most complicated
aspect of the study, the derivation of abstract mathematical
models of each of the four jury selection systems and the deriva
tion of practical estimates for the values of variables in these
models from the data described above. The modeling approach is
complex because of its extensive attention to details rather than
because of any sophistication of the mathematics involved. The
approach was first to look very carefully at each of the nine
distinct ways in which prospective jurors (whose names are ob
tained from a master jury wheel) are eliminated in the process
that ultimately results in persons reporting to the courthouse
for jury service. These filters were identified through simple
logical analysis and were not dependent on collected data. The
second step, also purely logical, was to construct the mathema
tical formulas by which these filters relate the number of per
sons in the master jury wheel to the number that can actually be
obtained for jury service. This was done for each of the four
selection systems under study. The third step, again purely
logical, was to determine how each filter could be measured from
data on the processes actually operating in the courts and from
the experiments comparing regular and certified mail. Finally,
the fully defined models were combined with collected data to
produce estimates of the clerical burden each selection system
would require if employed in one of the eight participant courts.
Since the final results of the models are based on data that
represent only a limited sample of the very large population of
24
prospective jurors, they are subject to the random error associ
ated with any measurement based on sampling. Because of the com
plexity of the models, as well as the exploratory purpose of the
study, no attempt has been made to determine the statistical re
liability of the ultimate estimates of efficiency. Nevertheless,
the samples employed are generally quite large, and we do not ex
pect that the data are a source of significant error in the pre
dicted results, particularly when these results are viewed in
total as suggestive of what might or might not be gained by any
court that changes from one selection system to another. This is
in fact the only way the results of the models should be viewed,
since the varying practices of individual jury clerks make it
virtually impossible to define a model that would be precisely
applicable to the operations of more than a few courts. The
models must be viewed as no more than reasonable attempts to
characterize juror selection systems in a way that facilitates
prediction of the consequences of particular changes.
Terminology employed in the models. The models developed
below are formulas for measuring efficiency. Each formula is a
simple product of proportions, with each proportion variable
representing the proportion of jurors who are filtered out by one
of the filters that occurs in one of the four selection systems
(or the complementary proportion who are not filtered out). For
instance, the number of questionnaires completed and returned in
a mailing of qualification questionnaires is simply the product
of (1) the number mailed out, (2) the proportion of those mailed
25
that were successfully delivered, and (3) the proportion of those
delivered that were completed and returned. The variables in
volved in the model of one system are usually very similar to the
variables involved in the models of the other three systems.
However, as one sees in the analysis of the models, these similar
variables have slight differences that result in different formu
las for estimating their values. For these reasons, it is help
ful to refer to the specific variables with a terminology that
denotes a general variable along with its specific variations.
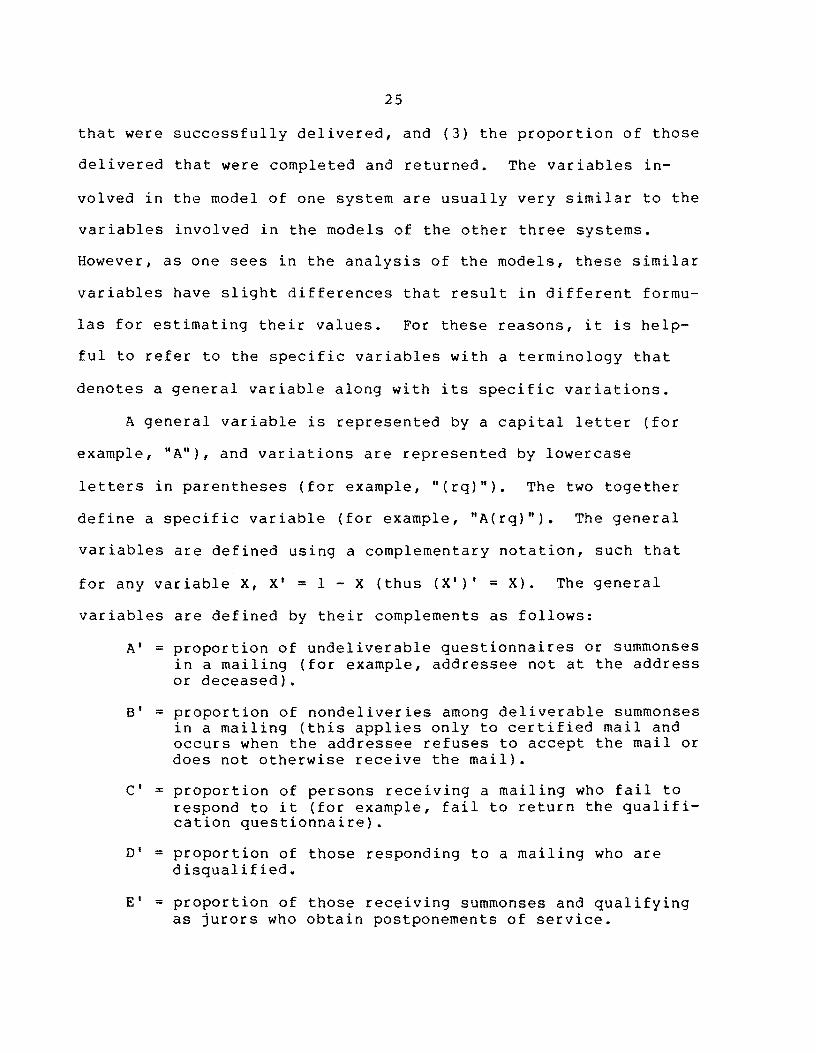
A general variable is represented by a capital letter (for
example, "A"), and variations are represented by lowercase
letters in parentheses (for example, "(rq)"). The two together
define a specific variable (for example, "A(rq)"). The general
variables are defined using a complementary notation, such that
for any variable X, X' = 1 - X (thus (X')' = X). The general
variables are defined by their complements as follows:
A' = proportion of undeliverable questionnaires or summonses in a mailing (for example, addressee not at the address or deceased).
8' = proportion of nondeliveries among deliverable summonses in a mailing (this applies only to certified mail and occurs when the addressee refuses to accept the mail or does not otherwise receive the mail).
C' = proportion of persons receiving a mailing who fail to respond to it (for example, fail to return the qualifi cation questionnaire).
D' = proportion of those responding to a mailing who are disqualified.
E' = proportion of those receiving summonses and qualifying as jurors who obtain postponements of service.
26
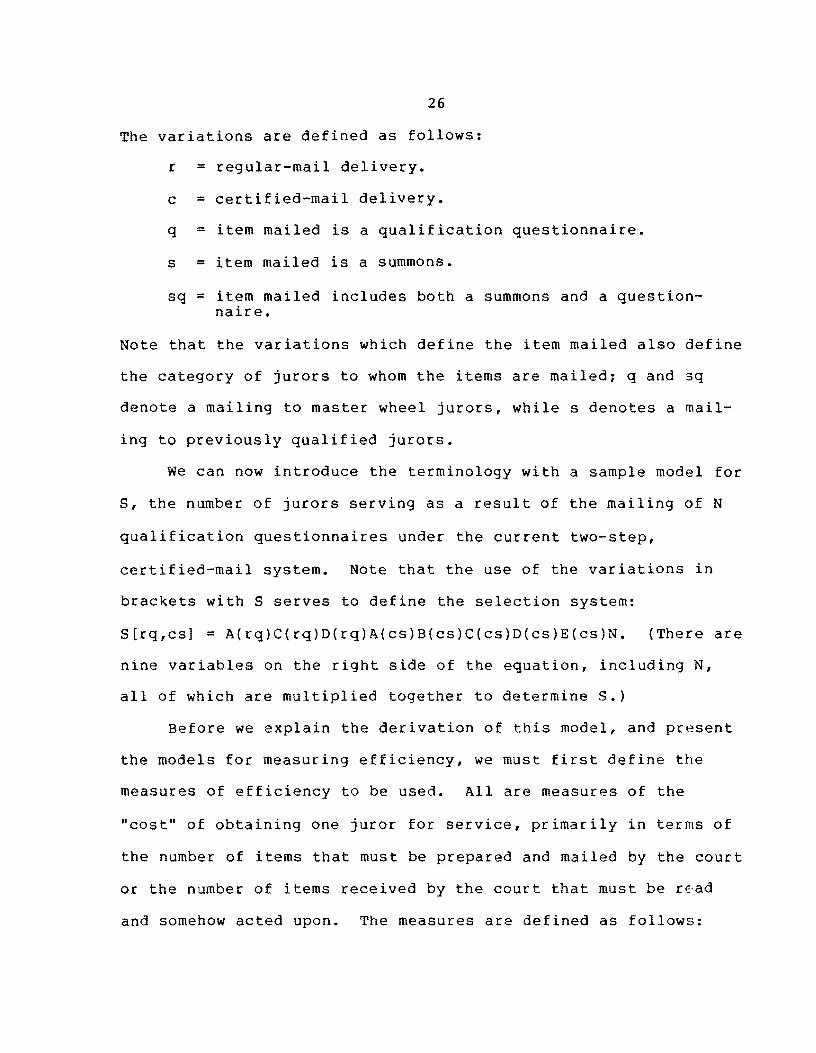
The variations are defined as follows:
r = regular-mail delivery.
c = certified-mail delivery.
q = item mailed is a qualification questionnaire.
s = item mailed is a summons.
sq = item mailed includes both a summons and a questionnaire.
Note that the variations which define the item mailed also define
the category of jurors to whom the items are mailed; q and sq
denote a mailing to master wheel jurors, while s denotes a mail
ing to previously qualified jurors.
We can now introduce the terminology with a sample model for
S, the number of jurors serving as a result of the mailing of N
qualification questionnaires under the current two-step,
certified-mail system. Note that the use of the variations in
brackets with S serves to define the selection system:
S[rq,cs] = A(rq)C(rq)D(rq)A(cs)B(cs)C(cs)D(cs)E(cs)N. (There are
nine variables on the right side of the equation, including N,
all of which are multiplied together to determine S.)
Before we explain the derivation of this model, and present
the models for measuring efficiency, we must first define the
measures of efficiency to be used. All are measures of the
"cost" of obtaining one juror for service, primarily in terms of
the number of items that must be prepared and mailed by the court
or the number of items received by the court that must be r0ad
and somehow acted upon. The measures are defined as follows:
27
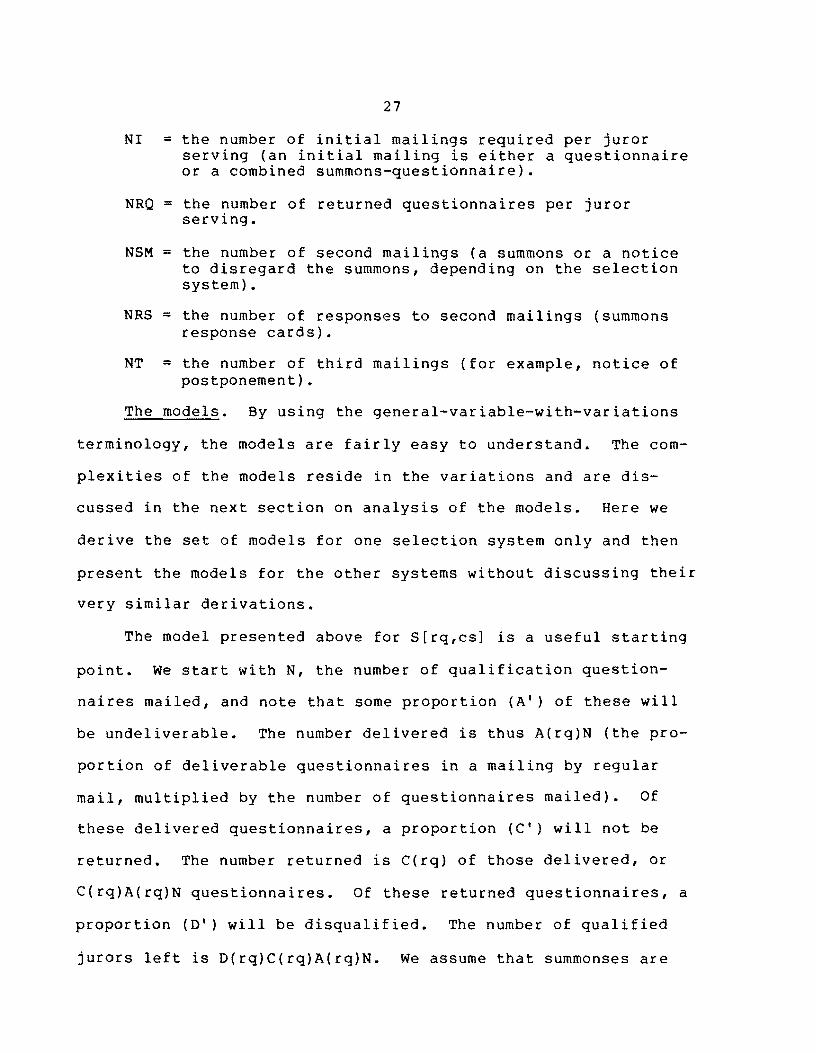
NI = the number of initial mailings required per juror serving (an initial mailing is either a questionnaire or a combined summons-questionnaire).
NRQ = the number of returned questionnaires per juror serving.
NSM = the number of second mailings (a summons or a notice to disregard the summons, depending on the selection system).
NRS = the number of responses to second mailings (summons response cards).
NT = the number of third mailings (for example, notice of postponement).
The models. By using the general-variable-with-variations
terminology, the models are fairly easy to understand. The com
plexities of the models reside in the variations and are dis
cussed in the next section on analysis of the models. Here we
derive the set of models for one selection system only and then
present the models for the other systems without discussing their
very similar derivations.
The model presented above for S[rq,cs] is a useful starting
point. We start with N, the number of qualification question
naires mailed, and note that some proportion (A') of these will
be undeliverable. The number delivered is thus A(rq)N (the pro
portion of deliverable questionnaires in a mailing by regular
mail, multiplied by the number of questionnaires mailed). Of
these delivered questionnaires, a proportion (e l ) will not be
returned. The number returned is e(rq) of those delivered, or
e(rq)A(rq)N questionnaires. Of these returned questionnaires, a
proportion (D') will be disqualified. The number of qualified
jurors left is D(rq)e(rq)A(rq)N. We assume that summonses are
28
sent to all qualified jurors. Some proportion of the summonses
will be undeliverable because of the addressee's death or reloca
tion during the interim between completion of the qualification
questionnaire and mailing of the summons (an interim that can be
as long as four years). We are left with A(cs)D(rq)C(rq)A(rq)N
deliverable summonses. Of these deliverable summonses, a propor
tion (B') will not be delivered because the addressee refused to
accept the mailing or because the addressee was not home when the
mailman attempted delivery and did not appear at the post office
to pick up the mailing. The number of summonses actually de
livered is B(cs)A(cs)D(rq)C(rq)A(rq)N. After those who fail to
respond to the summons have filtered themselves out, we are left
with C(cs)B(cS)A(cs)D(rq)C(rq)A(rq)N jurors responding to the
summons. Of those responding, a proportion will have become dis
qualified in the interim (most likely by a change in employment
or the birth of a child). We multiply the number responding by
D(cs) to determine the number still qualified. Finally, we ac
count for the number of postponements* by multiplying by E(cs).
The resulting number of persons actually serving (or at least
available to serve) is given by
E(cS)D(CS)C(CS)B(CS)A(cs)D(rq)C(rq)A(rq)N,
*We consider postponement to be a filter despite the fact that a postponed juror will presumably be called to serve at a later date. The reason is that we assume that at any time, a constant proportion of qualified jurors will obtain postponements. The constant proportion of postponements throughout the life of a qualified jriror wheel is equivalent to the loss of that proportion of the wheel at its inception.
29
which is merely a rearrangement of the expression for S[rq,cs]
given above.
We now model the measures of efficiency. NI[rq,cs] is
simply N/S[rq,cs], so that NI[rq,cs] =
l/[A(rq)C(rq)D(rq)A(cs)B(CS)C(CS)D(CS)E(CS)]. NRQ is the number
of questionnaires returned (given above as C(rq)A(rq)N) divided
by S, so that NRQ[rq,cs] = l/[D(rq)A(cs)B(cs)C(cs)D(cs)E(cs)].
NSM is the number of qualified jurors obtained from the mailing
of questionnaires divided by S, or [D(rq)C(rq)A(rq)N]/S, which
yields NSM[rq,cs] = l/[A(cS)B(cs)C(cs)D(cs)E(cs)]. NRS is the
number of returned summonses, C(cs)B(cs)A(cs)D(rq)C(rq)A(rq)N,
divided by S, or NRS[rq,cs] = l/[D(cs)E(cs)]. Since a notice of
postponement or disqualification will go to all jurors returning
a summons except those who are available for service, NT = NRS
1, or NT[rq,cs] = l/[D(cs)E(cs)] - 1.
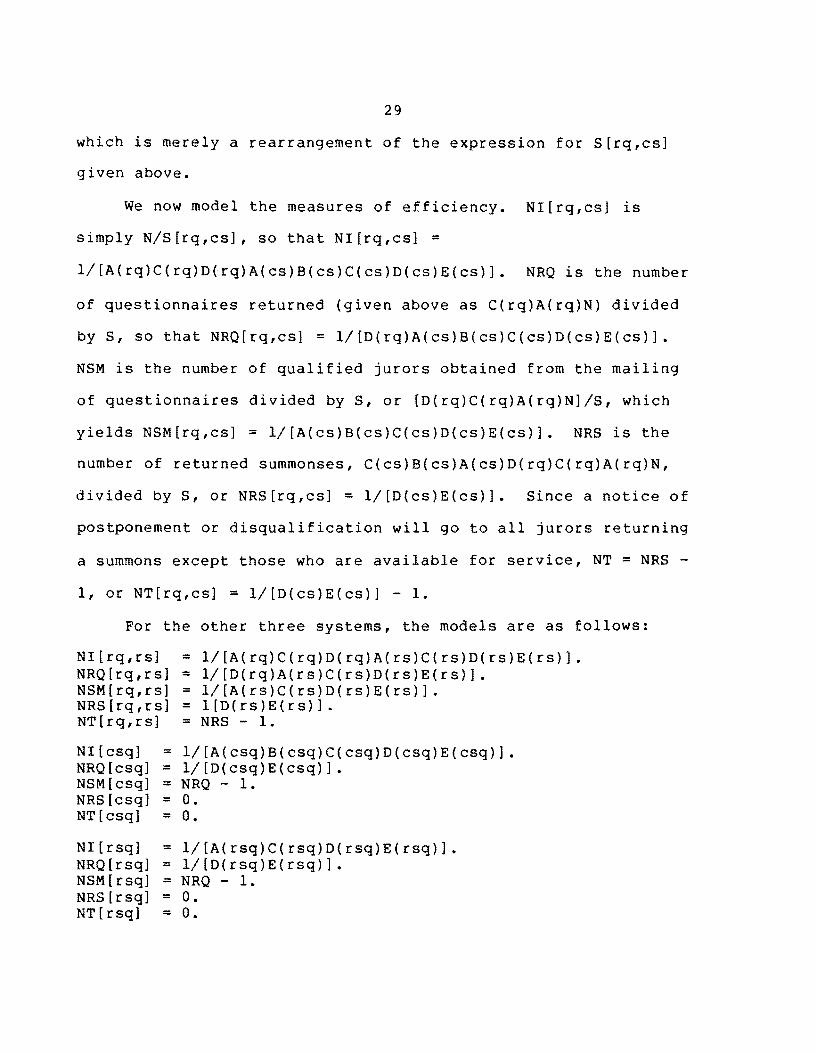
For the other three systems, the models are as follows:
NI[rq,rs] = l/[A(rq)C(rq)D(rq)A(rs)C(rs)D(rs)E(rs)]. NRQ [rq, r s] = 1/ [D ( r q ) A ( r s ) C ( r s ) D ( r s ) E ( r s ) ] • NSM[rq,rs] = l/[A(rs)C(rs)D(rs)E(rs)] • NRS[rq,rs] = l[D(rs)E(rs)] • NT [rq, r s] = NRS - 1.
:::;NI[csq] l/[A(csq)B(csq)C(csq)D(csq)E(csq)] • NRQ [csq] = 1/ [D(csq)E(csq)] • NSM[csq] = NRQ - 1. NRS[csq] = O. NT[csq] = O.
NI[rsq] = l/[A(rsq)C(rsq)D(rsq)E(rsq)] • NRQ [rsq] = l/[D(rsq)E(rsq)] • NSM [rsq] = NRQ - 1. NRS[rsq] = O. NT [rsq] = O.
30
Analysis of the Models
Analysis of the models requires estimation of the values of
the specific variables that define them. Since, as noted
earlier, the values can be expected to vary from court to court,
their estimation must be based on data that relate to each court
included in the project. Since each court currently operates
with the [rq,cs] system, we can directly measure the values of
certain of the specific variables. We can assume that we have
reliable measures of A(rq), C(rq), D(rq), C(cs), D(cs), and
E(cs). Moreover, in some courts, we can measure A(cs) and B(cs)
separately, while in others we can only measure their product,
A(cs)B(cs).
In addition, we have certain estimates based on experiments
comparing certified and regular (first-class) mail. In most par
ticipant courts, qualification questionnaires were mailed to two
groups of jurors randomly selected from the master jury wheel.
The questionnaires were sent to group X by certified mail and to
group Y by regular mail. By monitoring the return of these ques
tionnaires, we obtained independent measures of certain para
meters, which can be defined in our general-variable-with
variations scheme as AX(cq), BX(cq), CX(cq), DX(cq), AY(rq),
CY(rq), and DY(rq).
In other participant courts, the experiments involved the
mailing of actual summonses.* Two groups of jurors randomly
*The service of summonses by regular mail is not permitted by the Jury Selection and Service Act. Thus, the summonses sent
31
selected from the qualified jury wheel, groups X and Y, were sent
summonses by certified or regular mail, respectively. These
experiments provided measures that can be defined as AX(cs),
BX(cs), CX(cs), DX(cs), AY(rs), CY(rs), and DY(rs).
With the measurable variables and the experimentally mea
sured parameters in mind, we now turn to the heart of the analy
sis, the estimation of values for the unknown variables. We
proceed through each of the three system constructs other than
[rq,cs], which is known, and derive estimates for all unknown
variables. Given estimates for all necessary variables, we can
predict the performance of a system by using the models. For
some variables, there is more than one plausible estimate, re
suIting in a number of predictive models.
We introduce the question mark to denote an estimated value
for a variable, with multiple question marks indicating different
estimates of the same variable. Thus, A(rs)? is an estimate of
A(rs), and A(rs)?? is another estimate of A(rs).
For some variables in some courts, we are unable to propose
a "fair" estimate of the variable because of inadequate data (for
example, inability to measure A(cs) and B(cs) separately). In
such situations, we propose "worst-case" estimates, denoting
these with an exclamation point instead of a question mark. This
worst-case assumption is an appropriately conservative approach
to the ultimate purpose of this project, which is to determine
by regular mail are not, technically, "served." This conflict with the statute was rectified by personal service of a duplicate summons upon the juror's arrival at the courthouse.
32
whether any of the hypothetical selection systems offers suffi
cient efficiency to justify amendments to the Jury Selection and
Service Act that might result in substantial nonuniformity of
practices among federal district courts.
The [rq,rs1 system. The models for [rq,rs] involve four
variables of unknown value: A(rs), C(rs), D(rs), and E(rs).
A(rs), the percentage of deliverable summonses in a mailing
by regular mail, should equal A(cs). The only consideration that
lends doubt is that since certified mail requires an attempt at
hand-to-hand delivery, the postman may encounter some cases of
undeliverable mail that would, in regular-mail delivery, appear
as nonresponses (and thus be accounted for in C(rs». The pres
ent experiments, however, offer a test of this phenomenon, since
its presence should cause a difference between AX(cq) and AY(rq)
(or AX(cs) and AY(rs». We thus propose two estimates of A(rs).
The preferred one is A(rs)? = A(cs) [AY{rq)/AX(cq)1 or
A{rs)?? = A{cs) [AY{rs)/AX{cs)]. The other estimate is A{rs)??? =
A{CS). Note that we cannot estimate A{rs) directly by A(rq) or
any other mailing to master wheel jurors, since the master wheel
is likely to be older than the qualified wheel. Since A is
primarily determined by changes of address and deaths in a
once-valid address list, it is expected to decrease constantly
over time.
C(rs) can be estimated by C{cs), C{rq), CX(cq), CY{rq), or
CY{rs). Where CY{rs) is available, it is obviously preferred.,
However, it may not be a valid direct estimate, since some of the
33
nonresponses to regular mail are likely to be attributable to de
liveries to addresses from which the addressee has moved. Since
this amount of the variable is dependent on the age of the quali
fied jury wheel, the best estimate is obtained by treating the
experimental data as an adjustment to C(cs): C(rs)? = C(cs)
[CXC(cs) - CY(rs)]. Where CY(rs) is not available, the estimate
is more problematic. We can assume that C(rs) is not greater
than C(cs), since certified mail presumably commands more re
sponses than does regular mail. We cannot assume a relationship
between C(rs) and CX(cq) or between C(rs) and C(rq), however, be
cause the basic difference between the summons and the question
naire is that the summons commands a more active response. It
can be argued that the greater command of the summons thus de
creases the juror's perception that he can get away with ignoring
the command but at the same time increases his motivation to ig
nore it. The second-best estimate is probably the analogy to the
best one: C(rs)?? = C(cs) - [CX(cq) - CY(rq)]. We also have a
limiting estimate: C(rs)??? ~ C(cs).
It can be argued that D(rs) and E(rs) differ systematically
from D(cs) and E(cs). The argument is based on the hypothesis
that the group that receives summonses delivered by regular mail
differs systematically from the group that receives summonses
delivered by certified mail (that is, the former group includes
those who fail to claim or refuse delivery of certified mail).
It is not clear, however, how such differences would affect the
relationships between D(rs) and D(cs) and between E(rs) and
34
E(cs), nor does it seem likely that the effects would be large.
Thus, the only viable estimates for D(rs) and E(rs) are ones that
appear reliable: D(rs)? = D(cs) and E(rs)? = E(cs).
When the experimental mailing involves summonses, therefore,
the optimal model of the [rq,rs] system is s[rq,rs]? =
A(rq)C(rq)D(rq)A(cs) [AY(rs)!AX(cs)] [C(cs)-CX(cs)+CY(rs)]D(cs)E(cs).
And when the experimental mailing involves questionnaires, the
basic model is S[rq,rs]? =
A(rq)C(rq)D(rq)A(cs) [AY(rq)!AX(cq)] [C(cs)-CX(cq)+CY(rq)]D(~s)E(cs).
The [csq] system. All five variables in the [csq] models
are of unknown value.
~(csg), the percentage of undeliverable items in a certified
mailing of both summonses and questionnaires, is best esti~ated
on the basis ofAX(cq). Here again, however, we must make an
adjustment to account for age differences between jury whe=ls.
Since our comparisons among selection systems are based princi
pally on data from the actual operation of [rq,cs] systems with
master and qualified jury wheels of particular ages, we must
scale estimates to avoid potential bias from comparing measures
based on wheels of different ages. Our experimental data may
measure wheels of different ages from those measured by data from
the systems in actual operation. Thus the difference between
AX(cq) and AY(rq) is used as an age-independent measure of the
difference in delivery rates, which adjusts A(rq) to yield an
estimate of A(csq): A(csq)? = A(rq) - [~Y(rq) - AX(cq)]. Where
AX(cq) is unavailable, the best estimate of A(csq) is constructed
35
by analogy to A(Csq)?: A(CSq)?? = A(rq) - [AY(rs) - AX(cs)].
Note that this estimate is considerably weaker than that based on
AX(cq), since it is based on the differential delivery rates of
certified- and regular-mail summonses, which are sent to a sys
tematically different group than are the combined summons
questionnaires.
B(csq) can be estimated directly by BX(cq). There is no
need for wheel-age adjustment, since the proportion of source
list jurors failing to claim or refusing certified mail should be
constant and therefore unaffected by the age of the wheel. Thus,
8(csq)? = BX{cq). Where 8X(cq) is unavailable, the only avail
able bases of estimate are B(cs) and BX(cs). Since these two
bases are both estimates of the same variable, it is appropriate
to consider their average a better estimate; thus, B{csq)?? =
[B(cs) + BX(cs)]/2. Where B(cs) is unavailable separately, and
appears only in the product A{cs)B{cs), the estimate must be re
duced to 8{csq)??? = BX(cs). Finally, note that where AX(cq) and
BX(cq) are unavailable, any estimate of the combined measure
A(csq)B{csq) is likely to be a significant overestimate. This is
because the estimates of A(csq) and B{csq) are principally based
on the delivery success of summonses, which are mailed to quali
fied wheel jurors. The measure A{csq)B(csq), however, is a mea
sure of the delivery success of certified mail to master wheel
jurors. Since the master wheel is likely to be older than the
qualified wheel and thus contain a higher proportion of old
addresses, and since certified mail is not forwardable {even to a
36
known forwarding address), the actual delivery success of certi
fied summons-questionnaires is likely to be poorer than any of
the estimates. It is therefore advisable that our final analysis
of the [csq] system rely primarily on the models for districts
from which AX{cq) and BX{cq) are available.
C(csq), the proportion of delivered summons-questionnaires
that are responded to, is probably best estimated on the basis of
CX(cq), C(rq), or C(cs). Here, however, we do not posit a direct
estimate, but one based on inequalities. First, note that C(csq)
is probably less than C(cs). Both variables represent response
to certified deliveries of summonses; the critical differe~ce is
in the addressee population. For C(csq}, the population is mas
ter wheel jurors, but for C(cs) it is qualified wheel jurors.
Since qualified wheel jurors have already shown responsiveness to
a qualification questionnaire, presumably with the understanding
that they may be called for jury service, it is expected that
they will be more responsive to summonses than the more general
population of master wheel jurors. Second, both CX(cq) and C(rq)
should be less than C(csq). The difference between CX{cq) and
C(csq) is that the latter pertains to the combined summons
questionnaires, while the former pertains to simple question
naires. Since the summons is more readily recognized as com
manding a response, we can assume that C(csq) will be no Jess
than CX(cq). Since C(rq} measures response to a mailing that is
less commanding in both the type of delivery (regular mail) and
the nature of the item mailed (as for CX(cq}), C(rq) should also
37
be less than C(csq). Given no more than limiting conditions for
C(csq), we posit estimates based on the midpoint (that is, aver
age) of the closest limits. Where CX(cq) is available, C(csq)? =
[C(cs) + CX(cq)]/2. Otherwise, C(csq)?? = [C(cs) + C(rq)]/2. We
also define a worst-case estimate as C(csq)! = Lesser of C(rq)
and CX(cq).
D(csg), the proportion of respondents receiving summons
questionnaires who are qualified, is also estimated on the basis
of limits. The limits are based on D(rq) and D(cs). D(rq) mea
sures qualification based exclusively on responses to particular
questions on the qualification questionnaire. D(cs) is deter
mined both by special hardship excuses (which are not normally
elicited by the qualification questionnaire) and by responses to
some (but usually not all) of the same questions on the qualifi
cation questionnaire. If the disqualifications occurring in re
sponse to the summons were the same as those occurring in re
sponse to the questionnaire, we could estimate D(csq) directly by
D(rq), on the theory that a constant proportion of the master
jury wheel is eligible for or desirous of disqualification at any
given time. Since D(cs) measures disqualification bases that
arise in the interval between the questionnaire and the summons,
and since those disqualifications are presumably balanced by loss
of grounds for disqualification among those eliminated at the
questionnaire stage, we can view D(cs) as a liability peculiar to
the two-step selection systems that would be obviated in a
single-step system. If, on the other hand, the disqualifications
38
measured by D(cs) were entirely distinct from those measured by
D(rq), we would assume that a single-step system would provide
the same bases of excuse but would identify all of them at a
single stage, and we would thus estimate D(csq) as the product of
D(rq) and D(cs). The reality, however, is that D(cs) accounts
for some disqualifications that are distinct from, and others
that are identical to, those accounted for by D(rq). Thus we can
assume that D(csq) lies between D(rq) and the product D(rq)D(cs).
The estimates are defined in the same way as those for C(csq):
D(csq)? = [D(rq) + D(rq)D(cs)]/2 and D(csq)! = D(rq)D(cs).
E(csq) is estimated directly by E(cs), on the theory that
postponements requested (and granted) jurors otherwise willing to
serve occur in constant proportion over time (ignoring seasonal
fluctuations, which are irrelevant to this analysis). Thus,
E(csq)? = E(cs).
The [rsq] system. At first glance, it would appear that
A(rsq) could be directly estimated by A(rq). Again, however, we
are advised to adjust this estimate to account for aging of the
master jury wheel. Since the mailing of the combined summons
questionnaires is expected to coincide more closely in time to
the mailing of summonses than to that of questionnaires, the ap
propriate measure of the incidence of deliverable items is; given
by the product A(rq)A(rs). Since A(rs) is of unknown value, we
substitute for it the estimates posited in the discussion of the
[rq,rs] system. Thus, A(rsq)? = A(rq)A(rs)? and A(rsq)?? = A(rq)A(rs)??

39
By analogy to the discussion of C(csq), we can assume limits
for C(rsq). C(rsq) should be less than both CY(rs) and C(cs) and
should be greater than C(rq). The estimates are thus given by
c(rsq)? = [CY(rs) + C(rq)]/2, c(rsq)?? = [C(cs) + C(rq)]/2, and
C(rsq)! = C(rq).
D(rsq) can be expected to approximate D(csq). The propor
tion qualified of those responding to the combined summons
questionnaire ought not to differ according to the type of mail
delivery except as a product of systematic differences between
the populations that receive certified and regular mail. Such
systematic differences were discussed previously in the evalua
tion of D(rs) and were dismissed as of minor probable conse
quence. The same result is applied here. Thus, D(rsq)? =
[D(rq) + D(rq)D(cs)]/2 and D(rsq)! = D(rq)D(cs).
By analogy to the estimates for E(rs) and E(csq), we esti
mate E(rsg) by E(rsq)? = E(cs).
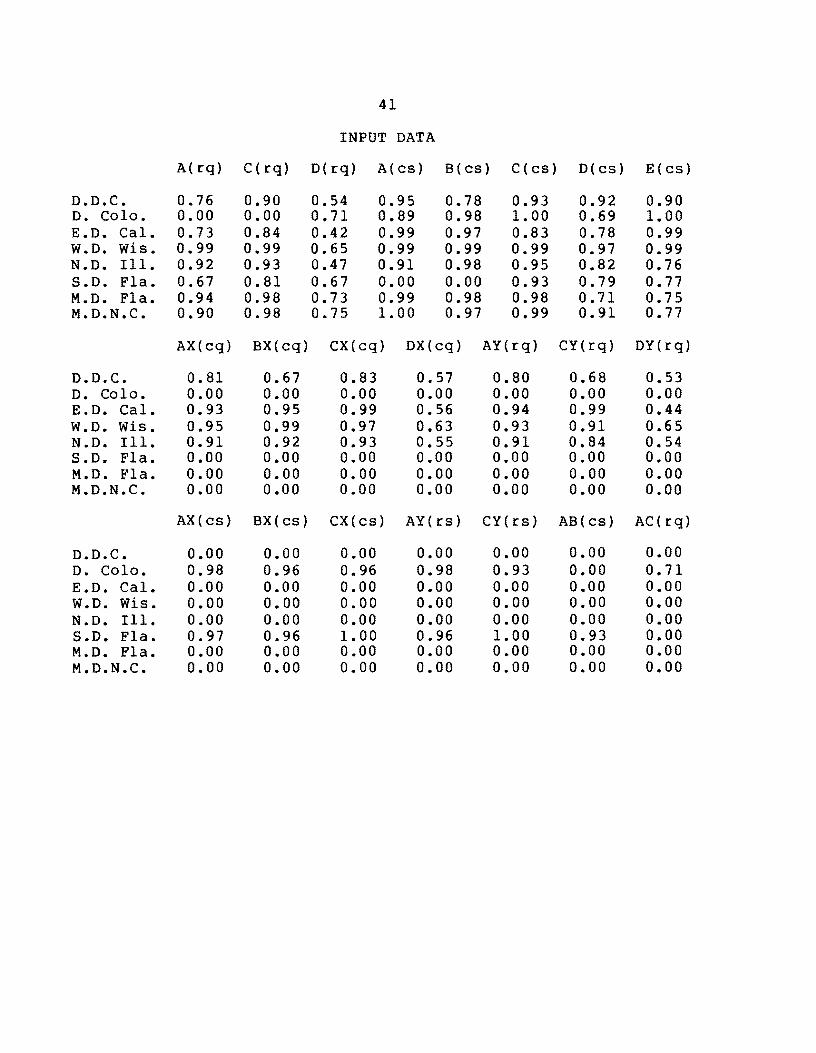
Results
The models were applied to data from each participant court
by a FORTRAN computer program, which produced maximum (max),
minimum (min), and optimum (optim) estimates for each measure of
efficiency. Each estimated measure of efficiency (for example,
NRQ[rsq]) was computed by employing a particular set of estimates
for variables (for example, an estimate for D(rsq» in the model
posited for that measure of efficiency (for example, NRQ[rsq] = l/[D(rsq)E(rsq)]). The maximum estimate was produced by select
ing from the available estimates of each variable (including
40
worst-case and limiting estimates) that estimate which wou:d
maximize the value of the efficiency estimate. The minimum esti
mate was produced in analogous fashion. The optimal estimate
employed the preferred estimate for each variable (or the best
among those available for that court). Each set of estimates of
efficiency was also combined with estimates provided by the
clerks' offices regarding the amount of time each task typically
required of the office staff. This produced a "weighted work"
(WTD WORK) estimate of the man-minutes required to produce one
serving juror.
The results are tabulated on the following pages, beginning
with the input data.
41
INPUT DATA
A(rq) C(rq) D(rq) A(cs) B(cS) C(CS) D(cs) E(cs)
D.D.C. 0.76 0.90 0.54 0.95 0.78 0.93 0.92 0.90 D. Colo. 0.00 0.00 0.71 0.89 0.98 I. 00 0.69 1.00 E.D. Cal. 0.73 0.84 0.42 0.99 0.97 0.83 0.78 0.99 W.O. Wis. 0.99 0.99 0.65 0.99 0.99 0.99 0.97 0.99 N.D. Ill. 0.92 0.93 0.47 0.91 0.98 0.95 0.82 0.76 S.D. Fla. 0.67 0.81 0.67 0.00 0.00 0.93 0.79 0.77 M.D. Fla. 0.94 0.98 0.73 0.99 0.98 0.98 0.71 0.75 M.D.N.C. 0.90 0.98 0.75 I. 00 0.97 0.99 0.91 0.77
AX(cq) BX(cq) CX(cq) DX(cq) AY(rq) CY(rq) DY (rq)
D.D.C. 0.81 0.67 0.83 0.57 0.80 0.68 0.53 D. Colo. 0.00 0.00 0.00 0.00 0.00 0.00 0.00 E.D. Cal. 0.93 0.95 0.99 0.56 0.94 0.99 0.44 W.O. Wis. 0.95 0.99 0.97 0.63 0.93 0.91 0.65 N.D. Ill. 0.91 0.92 0.93 0.55 0.91 0.84 0.54 S.D. Fla. 0.00 0.00 0.00 0.00 0.00 0.00 0.00 M.D. Fla. 0.00 0.00 0.00 0.00 0.00 0.00 0.00 M.D.N.C. 0.00 0.00 0.00 0.00 0.00 0.00 0.00
AX(cs) BX(cs) CX(cs) AY(rs) CY(rs) AB(cs) AC(rq)
D.D.C. 0.00 0.00 0.00 0.00 0.00 0.00 0.00 D. Colo. 0.98 0.96 0.96 0.98 0.93 0.00 0.71 E.D. Cal. 0.00 0.00 0.00 0.00 0.00 0.00 0.00 W.O. Wis. 0.00 0.00 0.00 0.00 0.00 0.00 0.00 N.D. Ill. 0.00 0.00 0.00 0.00 0.00 0.00 0.00 S.D. Fla. 0.97 0.96 1.00 0.96 1.00 0.93 0.00 M.D. Fla. 0.00 0.00 0.00 0.00 0.00 0.00 0.00 M.D.N.C. 0.00 0.00 0.00 0.00 0.00 0.00 0.00
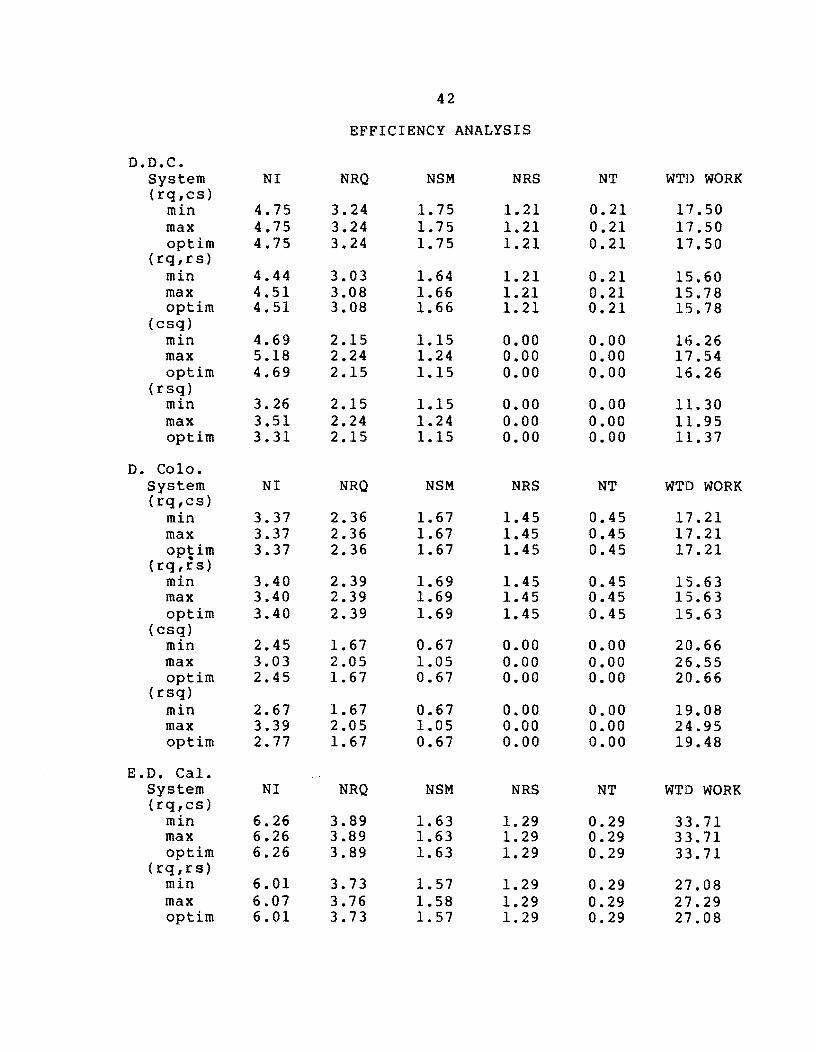
42
EFFICIENCY ANALYSIS
D.D.C. System NI NRQ NSM NRS NT WTD WORK (rq,es)
min 4.75 3.24 1.75 1.21 0.21 17.50 max 4.75 3.24 1.75 1.21 0.21 17.50 optim 4.75 3.24 1. 75 1.21 0.21 17.50
(rq,rs) min 4.44 3.03 1.64 1.21 0.21 15.60 max 4.51 3.08 1.66 1.21 0.21 15.78 optim 4.51 3.08 1.66 1. 21 0.21 15.78
(esq) min 4.69 2.15 1.15 0.00 0.00 16.26 max 5.18 2.24 1.24 0.00 0.00 17.54 optim 4.69 2.15 1.15 0.00 0.00 16.26
(rsq) min 3.26 2.15 1.15 0.00 0.00 11. 30 max 3.51 2.24 1.24 0.00 0.00 11. 95 optim 3.31 2.15 1.15 0.00 0.00 11. 37
D. Colo. System NI NRQ NSM NRS NT WTD WORK (rq,es)
min 3.37 2.36 1.67 1.45 0.45 17.21 max 3.37 2.36 1.67 1.45 0.45 17.21 optim 3.37 2.36 1.67 1.45 0.45 17.21
(rq,rs) min 3.40 2.39 1.69 1.45 0.45 15.63 max 3.40 2.39 1.69 1.45 0.45 15.63 optim 3.40 2.39 1.69 1.45 0.45 15.63
(esq) min 2.45 1.67 0.67 0.00 0.00 20.66 max 3.03 2.05 1.05 0.00 0.00 26.55 optim 2.45 1.67 0.67 0.00 0.00 20.66
( rsq) min 2.67 1.67 0.67 0.00 0.00 19.08 max 3.39 2.05 1.05 0.00 0.00 24.95 optim 2.77 1.67 0.67 0.00 0.00 19.48
E.D. Cal. System NI NRQ NSM NRS NT WTD WORK (rq,es)
min 6.26 3.89 1.63 1. 29 0.29 33.71 max 6.26 3.89 1.63 1.29 0.29 33.71 optim 6.26 3.89 1. 63 1.29 0.29 33.71
(rq,rs) min 6.01 3.73 1.57 1.29 0.29 27.08 max 6.07 3.76 1.58 1.29 0.29 27.29 optim 6.01 3.73 1. 57 1.29 0.29 27.08
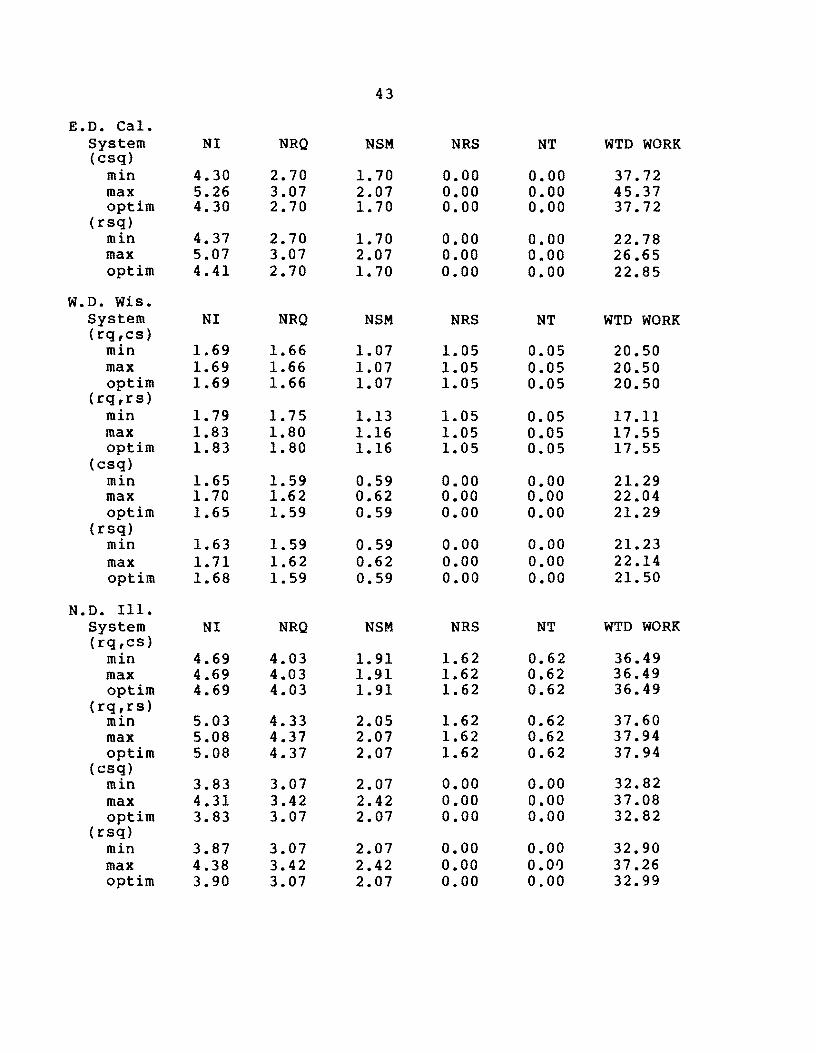
43
E.D. Cal. System(csq)
NI NRQ NSM. NRS NT WTD WORK
min 4.30 2.70 1. 70 0.00 0.00 37.72 max 5.26 3.07 2.07 0.00 0.00 45.37 optim 4.30 2.70 1.70 0.00 0.00 37.72
(rsq) min 4.37 2.70 1.70 0.00 0.00 22.78 max 5.07 3.07 2.07 0.00 0.00 26.65 optim 4.41 2.70 1.70 0.00 0.00 22.85
W.D. Wis. System (rq,cs)
NI NRQ NSM. NRS N'J; WTD WORK
min 1.69 1.66 1.07 1.05 0.05 20.50 max 1.69 1.66 1.07 1.05 0.05 20.50 optim
(rq,rs) 1.69 1.66 1.07 1.05 0.05 20.50
min 1. 79 1.75 1.13 1.05 0.05 17.11 max 1.83 1.80 1.16 1.05 0.05 17.55 optim 1.83 1.80 1.16 1.05 0.05 17.55
(csq) min 1.65 1.59 0.59 0.00 0.00 21.29 max 1.70 1.62 0.62 0.00 0.00 22.04 optim 1.65 1. 59 0.59 0.00 0.00 21.29
(rsq) min 1.63 1. 59 0.59 0.00 0.00 21.23 max 1. 71 1.62 0.62 0.00 0.00 22.14 optim 1.68 1.59 0.59 0.00 0.00 21. 50
N.D. Ill. System (rq,cs)
NI NRQ NSM. NRS NT WTD WORK
min 4.69 4.03 1. 91 1.62 0.62 36.49 max 4.69 4.03 1.91 1.62 0.62 36.49 optim 4.69 4.03 1.91 1.62 0.62 36.49
(rq,rs) min 5.03 4.33 2.05 1.62 0.62 37.60 max 5.08 4.37 2.07 1.62 0.62 37.94 optim
(csq) min
5.08
3.83
4.37
3.07
2.07
2.07
1.62
0.00
0.62
0.00
37.94
32.82 max 4.31 3.42 2.42 0.00 0.00 37.08 optim
(rsq) 3.83 3.07 2.07 0.00 0.00 32.82
min 3.87 3.07 2.07 0.00 0.00 32.90 max 4.38 3.42 2.42 0.00 0.01) 37.26 optim 3.90 3.07 2.07 0.00 0.00 32.99
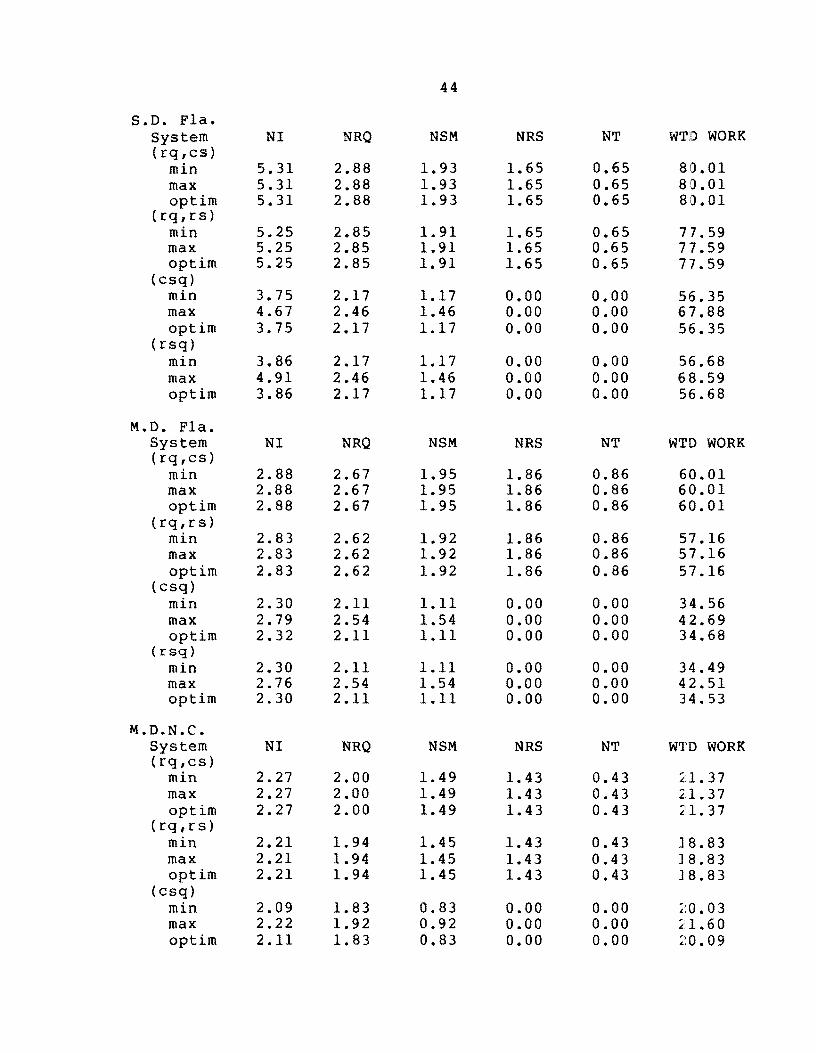
44
S.D. Fla. System NI NRQ NSM NRS NT WTD WORK (rq,es)
min 5.31 2.88 1. 93 1.65 0.65 80.01 max 5.31 2.88 1.93 1.65 0.65 80.01 optim 5.31 2.88 1.93 1.65 0.65 80.01
(rq,rs) min 5.25 2.85 1. 91 1.65 0.65 77.59 max 5.25 2.85 1.91 1.65 0.65 77.59 optim 5.25 2.85 1. 91 1.65 0.65 77.59
(esq) min 3.75 2.17 1.17 0.00 0.00 56.35 max 4.67 2.46 1.46 0.00 0.00 67.88 optim 3.75 2.17 1.17 0.00 0.00 56.35
(rsq) min 3.86 2.17 1.17 0.00 0.00 56.68 max 4.91 2.46 1.46 0.00 0.00 68.59 optim 3.86 2.17 1.17 0.00 0.00 56.68
M.D. Fla. System NI NRQ NSM NRS NT WTD WORK (rq,es)
min 2.88 2.67 1. 95 1.86 0.86 60.01 max 2.88 2.67 1.95 1.86 0.86 60.01 optim 2.88 2.67 1. 95 1. 86 0.86 60.01
(rq,rs) min 2.83 2.62 1. 92 1.86 0.86 57.16 max 2.83 2.62 1.92 1.86 0.86 57.16 optim 2.83 2.62 1. 92 1.86 0.86 57.16
(esq) min 2.30 2.11 1.11 0.00 0.00 34.56 max 2.79 2.54 1.54 0.00 0.00 42.69 optim 2.32 2.11 1.11 0.00 0.00 34.68
(rsq) min 2.30 2.11 1.11 0.00 0.00 34.49 max 2.76 2.54 1.54 0.00 0.00 42.51 optim 2.30 2.11 1.11 0.00 0.00 34.53
M..D.N.C. System NI NRQ NSM NRS NT W'I'D WORK (rq,es)
min 2.27 2.00 1.49 1. 43 0.43 21. 37 max 2.27 2.00 1.49 1.43 0.43 21. 37 optim 2.27 2.00 1.49 1.43 0.43 21. 37
(rq,rs) min 2.21 1. 94 1.45 1. 43 0.43 ]8.83 max 2.21 1.94 1.45 1.43 0.43 ] 8.83 optim 2.21 1. 94 1. 45 1.43 0.43 l8.83
(esq) min 2.09 1. 83 0.83 0.00 0.00 20.03 max 2.22 1.92 0.92 0.00 0.00 21.60 optim 2.11 1. 83 0.83 0.00 0.00 ~.~O. 09

45
M.D.N.C. System (rsq)
min max optim
NI
2.08 2.19 2.08
NRQ
1.83 1.92 1.83
NSM
0.83 0.92 0.83
NRS
0.00 0.00 0.00
NT
0.00 0.00 0.00
WTD WORK
16.89 18.23 16.89


FEDERAL JUDICIAL CENTER DOLLEY MADISON HOUSE
1520 H STREET. N.W.
WASHINGTON, D.C. 20005