
IHS ECONOMICS June 2015 Supplying the Unconventional ... · IHS Economics | Supplying the...
86
9134-TB-0515 Supplying the Unconventional Revolution: Workforce Readiness Main Report IHS ECONOMICS June 2015
Transcript of IHS ECONOMICS June 2015 Supplying the Unconventional ... · IHS Economics | Supplying the...
9134-TB-0515
Supplying the Unconventional Revolution: Workforce ReadinessMain Report
IHS ECONOMICS June 2015

© 2015 IHS ii June 2015
IHS Economics | Supplying the Unconventional Revolution: Sizing the unconventional oil and gas supply chain—Part II. Workforce readiness
About IHS (www.ihs.com)IHS (NYSE: IHS) is the leading source of information, insight and analytics in critical areas that shape today’s business landscape. Businesses and governments in more than 165 countries around the globe rely on the comprehensive content, expert independent analysis and fl exible delivery methods of IHS to make high-impact decisions and develop strategies with speed and confi dence. IHS has been in business since 1959 and became a publicly traded company on the New York Stock Exchange in 2005. Headquartered in Englewood, Colorado, USA, IHS is committed to sustainable, profi table growth and employs approximately 8,000 people in 31 countries around the world.
About High Road Strategies, LLC (www.highroadstrategies.com)High Road Strategies, LLC, Arlington, VA, is an economic policy research, analysis, assessment and design consultancy, with a focus on industrial, energy, and workforce issues. Its clients include business, labor, non-profi t, academic, and government organizations.
For more information, contact:Brendan O’Neil
Managing Director, Consulting, Economics and Country [email protected]
(202) 481-9239
For press information, contact:Kate Smith
Media Relations [email protected]
IHS EconomicsCopyright notice and legal disclaimer© 2015 IHS. No portion of this report may be reproduced, reused, or otherwise distributed in any form without prior written consent, with the exception of any internal client distribution as may be permitted in the license agreement between client and IHS. Content reproduced or redistributed with IHS permission must display IHS legal notices and attributions of authorship. The information contained herein is from sources considered reliable but its accuracy and completeness are not warranted, nor are the opinions and analyses which are based upon it, and to the extent permitted by law, IHS shall not be liable for any errors or omissions or any loss, damage or expense incurred by reliance on information or any statement contained herein. IHS and the IHS logo are trademarks of IHS. For more information, please contact IHS at www.ihs.com/CustomerCare.
EMBARGOED
© 2015 IHS iii June 2015
IHS Economics | Supplying the Unconventional Revolution: Sizing the unconventional oil and gas supply chain—Part II. Workforce readiness
Contents
Executive summary 1The workforce readiness challenge 11Assessing the workforce challenge 13Methodology and approach 13Major workforce challenges 16
– Shortage of qualifi ed local workers 17 – Technological change 17 – “Soft skills” and behavioral barriers 18 – Operator qualifi cations (OQ) 19 – Working conditions and burnout 19 – Attracting youth to skilled trades 20 – An aging workforce 20 – Competition for skilled workers 21
Core and high-demand occupations 22Core occupations 22
– Occupational distribution by sector 25 – Employment projections 2012–25 27 – State comparisons 30 – State occupational employment trends 32
High-demand occupations 33 – HDO employment trends, 2007–13 35 – State HDO employment trends 36 – HDO employment projections 2012–25 37 – Replacement Needs 41
Meeting the readiness challenge 43Multistate initiatives 44State programs 46
– Texas workforce initiatives 46 – Pennsylvania workforce initiatives 48 – Ohio workforce initiatives 49 – Colorado workforce initiatives 51
Conclusion 53Workforce challenges 53Core and high-demand occupations 53State occupational trends 54Employment projections and occupational demand 54Workforce readiness challenge 55Appendix A: Methodology and approach 57Identify core occupations 57Interview and survey stakeholders 58Review of literature and online resources 59Determine high-demand occupations (HDOs) 59Employment forecasts for core and high-demand occupations 60
– Derive occupational employment shares by supply chain sector 60 – Forecast occupational employment by supply chain sector 60 – Estimate employment in supply chain sectors that supports unconventional energy activity 61 – Forecast total demand for employment by occupation considering replacement need 62
Appendix B: Employment growth and replacement needs in high-demand occupations 63

© 2015 IHS iv June 2015
IHS Economics | Supplying the Unconventional Revolution: Sizing the unconventional oil and gas supply chain—Part II. Workforce readiness
Appendix C: High-demand occupation profi les 64Professional occupations 64Construction and extraction occupations 66Equipment manufacturing, maintenance, and repair 68Management and supervisory occupations 69Transportation and materials moving occupations 70Oil and gas service pccupations 71Appendix D: Major producing state occupation and workforce readiness summaries 721. Texas summary 72
– Core and high-demand occupations 72 – Workforce readiness initiatives 73
2. Pennsylvania summary 74 – Core and high-demand occupations 74 – Workforce readiness initiatives 76
3. Ohio summary 76 – Core and high-demand occupations 76 – Workforce readiness initiatives 78
4. Colorado summary 78 – Core and high-demand occupations 79 – Workforce readiness initiatives 80
© 2015 IHS v June 2015
IHS Economics | Supplying the Unconventional Revolution: Sizing the unconventional oil and gas supply chain—Part II. Workforce readiness
Project directors• Phil Hopkins, Director, Economics and Country Risk
• Joel Yudken, Principal, High Road Strategies, LLC
Project team• Tabitha Bailey, Director, Economics and Country Risk
• Vardan Genanyan, Analyst, Economics and Country Risk
• Julie Gressley, Consultant, Economics and Country Risk
• Brendan O’Neil, Managing Director, Economics and Country Risk
• Liz Redman, Senior Consultant, Economics and Country Risk
• Mihaela Solcan, Consultant, Economics and Country Risk
Acknowledgements
We would like to thank Bill Nagler and Keri Semesnyei for their editorial, graphic design, and layout support.
This report o� ers an independent assessment of the workforce readiness challenge confronting the unconventional energy supply chain. This research was prepared for the Energy Equipment and Infrastructure Alliance (EEIA).
EEIA represents the unconventional oil and gas supply chain: equipment manufacturers and distributors, construction contractors, service providers, material suppliers, and logistics companies. EEIA members provide equipment, materials, construction, services, logistics and workers to unconventional oil and gas exploration and production, transportation and processing.
IHS and High Road Strategies are exclusively responsible for this report and all of the analysis and content contained herein. The analysis and metrics developed during the course of this research represent the independent views of IHS and are intended to contribute to the dialogue on the role of the unconventional oil and gas supply chain in promoting employment and economic growth.

© 2015 IHS 1 June 2015
IHS Economics | Supplying the Unconventional Revolution: Sizing the unconventional oil and gas supply chain—Part II. Workforce readiness
Executive summaryAn IHS study, Sizing the Unconventional Revolution, found that unconventional energy development is projected to grow steadily through the next decade. 1 This growth will a� ect dozens of industries beyond the oil and gas sector, distributed across suppliers from every state. Major capital and operating expenditures by unconventional oil and gas producers fl ow to a lengthy supply chain that generates upstream, midstream, and downstream activity. Many suppliers in these sectors have lengthy supply chains of their own, multiplying the e� ect of unconventional energy development.
This rapid growth presents new workforce challenges for employers throughout the unconventional energy supply chain because of the rising demand for skilled workers needed for drilling, extraction, and other supply chain activities. Regions with high levels of unconventional energy development now or in the future seek to maintain and enhance the ability of the local workforce to support this activity to maximize economic development benefi ts. A shortage of qualifi ed workers in the supply chain could limit the amount of unconventional energy development.
To assess the scale, scope, and nature of the workforce readiness challenge confronting this sector, IHS and High Road Strategies, LLC jointly undertook an extensive study of the unconventional energy supply chain’s occupational structure, skill needs, and workforce education and training resources. Specifi cally the project team:• Identifi ed and examined the principal workforce challenges confronting the unconventional energy supply
chain industries;
• Identifi ed the core occupations of the supply chain industries and determined those in greatest demand nationally and in states with major plays; and
• Identifi ed and examined public and private sector workforce training and education programs and initiatives established for the unconventional energy supply chain.
Methodology and approachThe project team applied quantitative and qualitative methods to assess the workforce challenges. The analyses were carried out for the nation as a whole and for three states with signifi cant unconventional plays—Texas, Pennsylvania, and Louisiana; two states at the early stages of unconventional development—Ohio, and Colorado; and one nonproducing state with signifi cant supply chain activity—Illinois. The analyses drew upon IHS’s proprietary economic models and federal employment and occupational statistics (primarily, the Department of Labor’s Bureau of Labor Statistics [BLS]), to identify and assess the unconventional energy supply chain’s core and high-demand occupations, including employment trends and projections.
The qualitative analysis included interviews of key stakeholders and experts, a survey, and a review of relevant literature and online resources. It was used to help evaluate the statistical employment and occupational data, identify the main workforce challenges, and examine workforce readiness initiatives in response to the challenges.
Specifi cally, the study involved the following steps:
1. Identifi cation of core occupations in the unconventional supply chain, which are those that i) perform essential activities within the economic sectors of the supply chain; ii) can directly a� ect a sector’s level of output if positions remain unfi lled; and iii) have specialized education, training, competencies, or skills and experience requirements. The project team identifi ed an initial list of 73 core occupations by applying multiple criteria to the employment by occupation for the North American Industry Classifi cation System
1 IHS Economics. Supplying the Unconventional Revolution: sizing the unconventional oil and gas supply chain. September 2014.
© 2015 IHS 2 June 2015
IHS Economics | Supplying the Unconventional Revolution: Sizing the unconventional oil and gas supply chain—Part II. Workforce readiness
(NAICS) industries that comprise the fi ve unconventional energy core supply chain sectors—construction and well services, capital goods, materials, professional and other services, and logistics.
2. Interviews and survey of stakeholders, which the project team drew upon to help identify the workforce challenges, validate and refi ne the list of core occupations and high-demand occupations (HDOs), and identify and evaluate the e� ectiveness of workforce development programs to meet perceived skill challenges. About 50 individuals representing over 40 organizations in the unconventional energy sector and/or its supply chain provided input, including business and trade associations; supply chain fi rms (e.g., construction contractors, equipment manufacturers and dealers, material suppliers, transportation), labor unions, workforce education and training providers, and government agencies.
3. Literature review, including numerous reports, documents, and articles, especially state assessments of occupational needs and employment growth for unconventional oil and gas development in Pennsylvania, Ohio, Texas, and Colorado by academic research institutes, state agencies, and some oil and gas industry associations.
4. Identifi cation of HDOs based on the fi ndings from multiple sources, including statistical analyses, interview, and survey fi ndings, and the relevant literature. The project team identifi ed and evaluated 24 of the core occupations as being in high demand across the supply chain. This list applies nationally and is reasonably consistent across all the major producing states reviewed in the study.
5. Employment forecasts for core occupations and HDOs for each supply chain sector. The project team forecast detailed occupational employment by supply chain NAICs sector, drawing on IHS’s estimates of total employment for each supply chain NAICS sector in the United States between 2012 and 2025, and applying data from its Business Market Insights (BMI) database.
6. Replacement needs for core occupations and HDOS, which supplement the projections of occupational employment growth for the economic growth of the NAICS supply chain industrial sectors. Replacement needs for an occupation refer to job openings resulting from turnover or retirement or other factors, and are calculated by the Bureau of Labor Standards (BLS) for each year in its long-term occupational forecasts.
Workforce challengesThe project team identifi ed eight workforce challenges facing the unconventional oil and gas supply chain, which refl ect the di� culties many employers have faced in fi lling a number of high demand occupations, some within specifi c sectors and many across the supply chain. While this list is consistent across the six states examined and across the nation, the magnitudes of the challenges vary by state, largely in proportion to their stage of development in the unconventional energy sector. The challenges also vary across industry sectors and occupations.
• Shortage of qualifi ed local workers. The primary challenge supply chain employers have faced, especially in the early stages of exploration and drilling activity, has been fi nding enough qualifi ed local workers. Although the training and recruiting of workers from local labor markets has improved, many challenges remain.
• Technological change. Technological advances in the unconventional energy sector have helped to drive up the demand for higher-skill occupations in the unconventional energy workforce and also have increased the skill requirements in the supply chain.
• “Soft skills” and behavioral barriers. Aside from technical skills, workers must demonstrate that they have “soft skills” and ability to meet behavioral standards. Soft skills include reporting to work on time, knowing how to dress for the workplace, and the interpersonal skills to interact with people and to work on a team. A major challenge is fi nding workers able to pass drug-screening tests.
© 2015 IHS 3 June 2015
IHS Economics | Supplying the Unconventional Revolution: Sizing the unconventional oil and gas supply chain—Part II. Workforce readiness
• Operator qualifi cations. Confronting oil and gas pipeline contractors is the need for standardizing operator qualifi cations across the industry, which specify behavioral criteria for workers in the logistics and transportation components of the supply chain, as required by US Department of Transportation regulations.
• Working conditions and burnout. Many unconventional energy jobs, especially in upstream occupations and in pipeline, road and other construction work, are physically demanding, requiring long hours and sustained periods of work under harsh weather and environmental conditions away from workers’ homes. These stressful working conditions can lead to burnout and high rates of turnover.
• Attracting youth to skilled trades. Aside from di� cult working conditions, young people are not attracted to careers in laborer and skilled trade positions, in particular because of a common “cultural bias” against these types of jobs in industries such as manufacturing and construction. They prefer a career path requiring a four-year college degree over one needing career and technical education.
• An aging workforce. The challenge of maintaining a su� cient workforce in unconventional energy supply chain industries is being made more acute by the looming retirement of aging Baby Boomers working in these fi elds, or the Great Crew Change, as it is known within the oil and gas industry.
• Competition for skilled workers. The rapid growth of demand for oil and gas supply chain jobs and the recovery in the US construction and manufacturing sectors have fostered a fi erce competition for workers with comparable skills, leading to increased pressure to “poach” workers from other fi rms within and outside the particular industry.
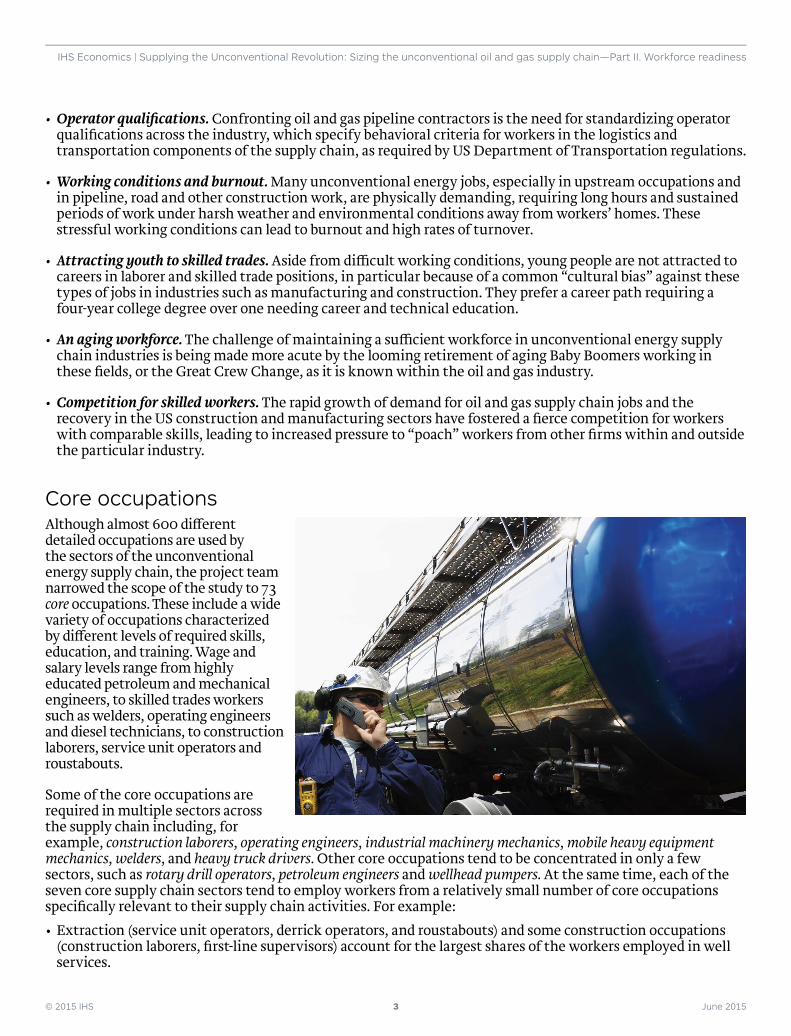
Core occupationsAlthough almost 600 di� erent detailed occupations are used by the sectors of the unconventional energy supply chain, the project team narrowed the scope of the study to 73 core occupations. These include a wide variety of occupations characterized by di� erent levels of required skills, education, and training. Wage and salary levels range from highly educated petroleum and mechanical engineers, to skilled trades workers such as welders, operating engineers and diesel technicians, to construction laborers, service unit operators and roustabouts.
Some of the core occupations are required in multiple sectors across the supply chain including, for example, construction laborers, operating engineers, industrial machinery mechanics, mobile heavy equipment mechanics, welders, and heavy truck drivers. Other core occupations tend to be concentrated in only a few sectors, such as rotary drill operators, petroleum engineers and wellhead pumpers. At the same time, each of the seven core supply chain sectors tend to employ workers from a relatively small number of core occupations specifi cally relevant to their supply chain activities. For example:• Extraction (service unit operators, derrick operators, and roustabouts) and some construction occupations
(construction laborers, fi rst-line supervisors) account for the largest shares of the workers employed in well services.
© 2015 IHS 4 June 2015
IHS Economics | Supplying the Unconventional Revolution: Sizing the unconventional oil and gas supply chain—Part II. Workforce readiness
• Construction-related occupations dominate the two main construction subsectors.
• Engineers, scientists and related technicians tend to be concentrated in professional services, though some occupations, especially mechanical engineers, are also important in the capital goods and materials production sectors.
• Production and related occupations (e.g., machinists, welders, industrial machinery mechanics) predominate in capital goods sectors and play an important role, along with some construction occupations such as operating engineers, in the materials sector.
• Heavy truck drivers account for over 90% of logistics sector jobs, though bus and truck mechanics and diesel engine specialists are also important in this sector.
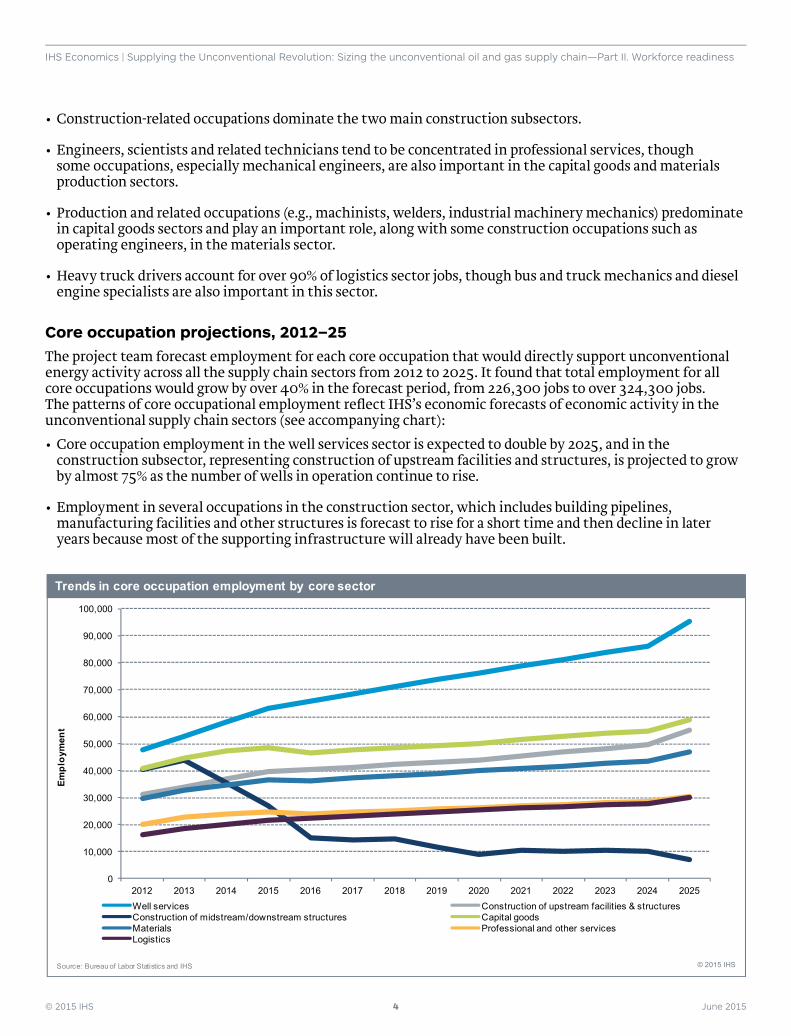
Core occupation projections, 2012–25The project team forecast employment for each core occupation that would directly support unconventional energy activity across all the supply chain sectors from 2012 to 2025. It found that total employment for all core occupations would grow by over 40% in the forecast period, from 226,300 jobs to over 324,300 jobs. The patterns of core occupational employment refl ect IHS’s economic forecasts of economic activity in the unconventional supply chain sectors (see accompanying chart):• Core occupation employment in the well services sector is expected to double by 2025, and in the
construction subsector, representing construction of upstream facilities and structures, is projected to grow by almost 75% as the number of wells in operation continue to rise.
• Employment in several occupations in the construction sector, which includes building pipelines, manufacturing facilities and other structures is forecast to rise for a short time and then decline in later years because most of the supporting infrastructure will already have been built.
0
10,000
20,000
30,000
40,000
50,000
60,000
70,000
80,000
90,000
100,000
2012 2013 2014 2015 2016 2017 2018 2019 2020 2021 2022 2023 2024 2025Well services Construction of upstream facilities & structuresConstruction of midstream/downstream structures Capital goods Materials Professional and other services Logistics
Trends in core occupation employment by core sector
© 2015 IHS
Empl
oym
ent
Source: Bureau of Labor Statistics and IHS
© 2015 IHS 5 June 2015
IHS Economics | Supplying the Unconventional Revolution: Sizing the unconventional oil and gas supply chain—Part II. Workforce readiness
• Core occupation employment is expected to grow at annual rates of 2.9–4.8% in the other core sectors, including capital goods, materials, logistics, and professional services.
Similarly, the employment trends for core occupations grouped by major occupational classifi cation follow projected economic growth for the core sectors: • Extraction jobs, primarily in well services, are expected to grow at the fastest rate—a 5.3% annual average
increase.
• Transportation and materials moving, production, and installation, maintenance and repair jobs are forecast to grow at 4.2% and 3.5% annual rates, respectively.
• Core engineering, scientifi c; and technician employment in the supply sector, are expected to grow at 3% and 4%, respectively, albeit starting from a smaller base.
• Construction trades employment, in contrast, is expected to rise and then fall, showing only modest growth through 2025, refl ecting the economic growth trends in the upstream and downstream construction sectors in the supply chain.
• Management occupations, two of three of which are in construction, correspondingly are expected to have a small net decline.
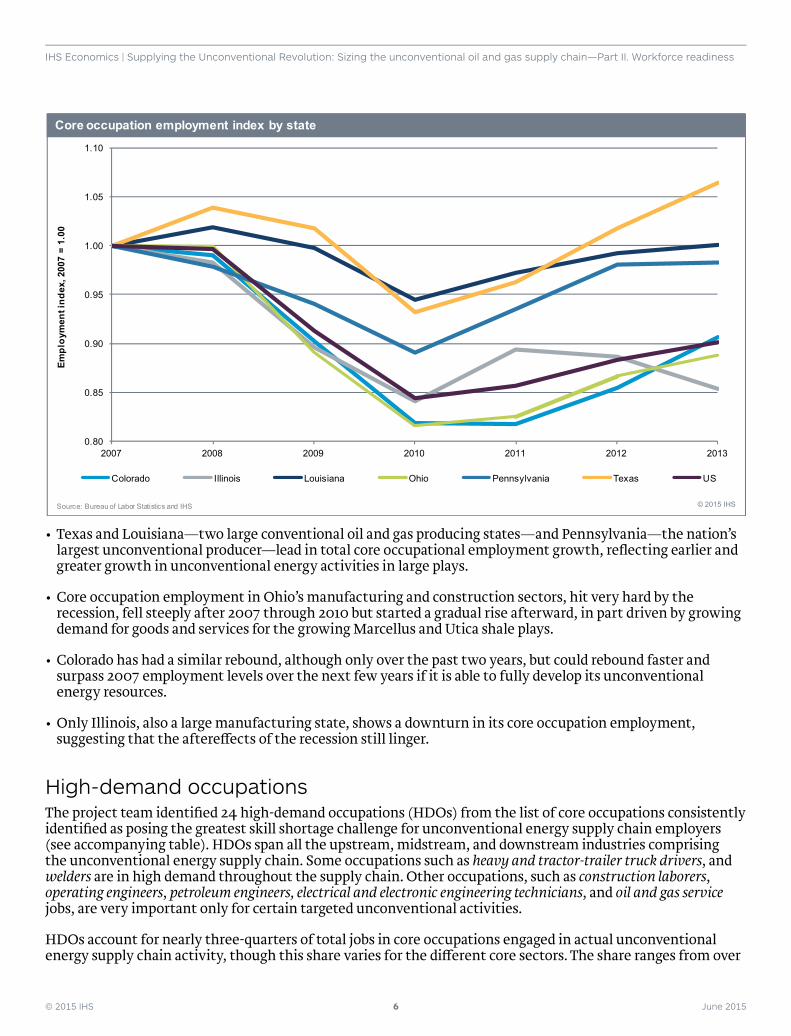
State trends, 2007–13Analyzing state-level employment trends for core occupations from 2007 to 2013 shows that employment levels of core occupations and their corresponding shares of total employment vary across the states. The di� erences are due to both their economic structures and the state of development of their unconventional energy activities. It is important to caution that these trends are for all workers employed in the core supply chain sectors, not just workers directly supporting unconventional energy activity. Because of data limitations, it is not possible to separate out the latter from workers in the same occupations and sectors that support nonenergy-related activities.
• Texas, Louisiana, and Colorado have relatively high employment shares in core construction and extraction occupations—about 24–33%—refl ecting in part their more extensive conventional and unconventional energy production.
• While employment in construction and extraction are also high in Ohio and Pennsylvania, production jobs in core occupations account for the largest share—about one-third—of total supply chain core employment in these states and in nonproducing Illinois, refl ecting their high concentrations of manufacturing.
As seen in the following chart, nationally and in all the states the impact of the Great Recession on employment from 2007 to 2010 is clearly evident in the sharp dips in employment in the core occupations. The growth of unconventional production from 2010-2013 in states with large plays has added jobs more quickly in core occupations in supply chain sectors, which contribute to job growth in these sectors overall and to state economies.
© 2015 IHS 6 June 2015
IHS Economics | Supplying the Unconventional Revolution: Sizing the unconventional oil and gas supply chain—Part II. Workforce readiness
• Texas and Louisiana—two large conventional oil and gas producing states—and Pennsylvania—the nation’s largest unconventional producer—lead in total core occupational employment growth, refl ecting earlier and greater growth in unconventional energy activities in large plays.
• Core occupation employment in Ohio’s manufacturing and construction sectors, hit very hard by the recession, fell steeply after 2007 through 2010 but started a gradual rise afterward, in part driven by growing demand for goods and services for the growing Marcellus and Utica shale plays.
• Colorado has had a similar rebound, although only over the past two years, but could rebound faster and surpass 2007 employment levels over the next few years if it is able to fully develop its unconventional energy resources.
• Only Illinois, also a large manufacturing state, shows a downturn in its core occupation employment, suggesting that the aftere� ects of the recession still linger.
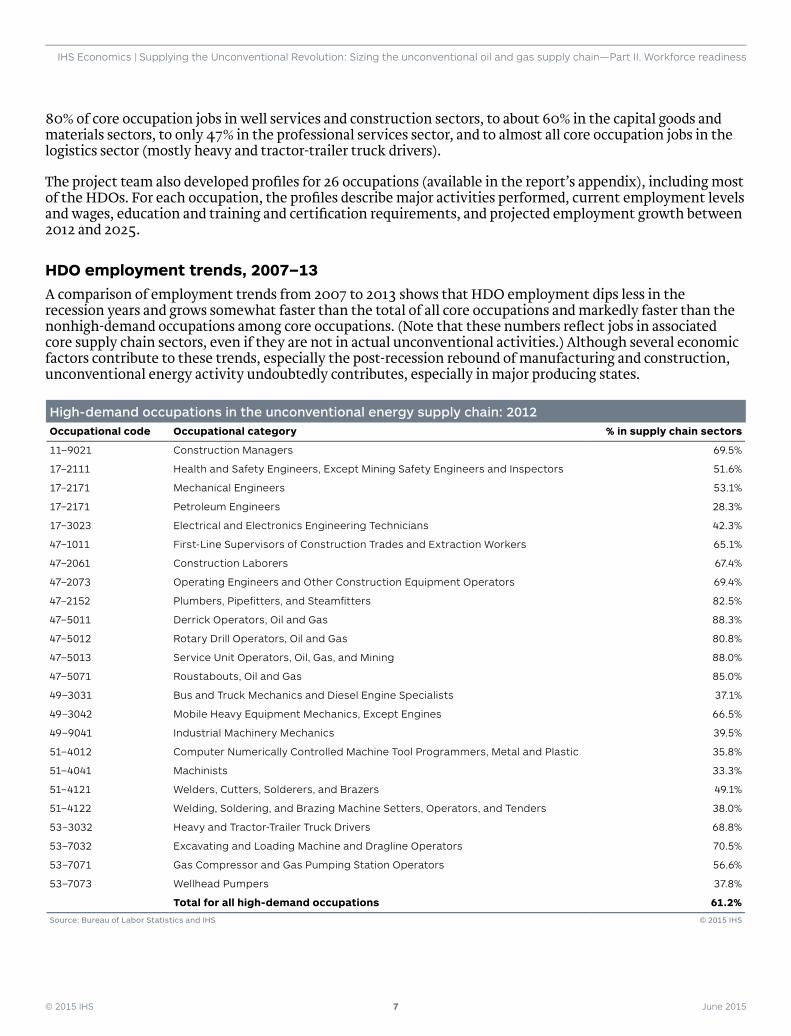
High-demand occupationsThe project team identifi ed 24 high-demand occupations (HDOs) from the list of core occupations consistently identifi ed as posing the greatest skill shortage challenge for unconventional energy supply chain employers (see accompanying table). HDOs span all the upstream, midstream, and downstream industries comprising the unconventional energy supply chain. Some occupations such as heavy and tractor-trailer truck drivers, and welders are in high demand throughout the supply chain. Other occupations, such as construction laborers, operating engineers, petroleum engineers, electrical and electronic engineering technicians, and oil and gas service jobs, are very important only for certain targeted unconventional activities.
HDOs account for nearly three-quarters of total jobs in core occupations engaged in actual unconventional energy supply chain activity, though this share varies for the di� erent core sectors. The share ranges from over
0.80
0.85
0.90
0.95
1.00
1.05
1.10
2007 2008 2009 2010 2011 2012 2013
Colorado Illinois Louisiana Ohio Pennsylvania Texas US
Core occupation employment index by state
© 2015 IHS
Empl
oym
ent i
ndex
, 200
7 =
1.00
Source: Bureau of Labor Statistics and IHS
© 2015 IHS 7 June 2015
IHS Economics | Supplying the Unconventional Revolution: Sizing the unconventional oil and gas supply chain—Part II. Workforce readiness
80% of core occupation jobs in well services and construction sectors, to about 60% in the capital goods and materials sectors, to only 47% in the professional services sector, and to almost all core occupation jobs in the logistics sector (mostly heavy and tractor-trailer truck drivers).
The project team also developed profi les for 26 occupations (available in the report’s appendix), including most of the HDOs. For each occupation, the profi les describe major activities performed, current employment levels and wages, education and training and certifi cation requirements, and projected employment growth between 2012 and 2025.
HDO employment trends, 2007–13A comparison of employment trends from 2007 to 2013 shows that HDO employment dips less in the recession years and grows somewhat faster than the total of all core occupations and markedly faster than the nonhigh-demand occupations among core occupations. (Note that these numbers refl ect jobs in associated core supply chain sectors, even if they are not in actual unconventional activities.) Although several economic factors contribute to these trends, especially the post-recession rebound of manufacturing and construction, unconventional energy activity undoubtedly contributes, especially in major producing states.
High-demand occupations in the unconventional energy supply chain: 2012 Occupational code Occupational category % in supply chain sectors
11–9021 Construction Managers 69.5%
17–2111 Health and Safety Engineers, Except Mining Safety Engineers and Inspectors 51.6%
17–2171 Mechanical Engineers 53.1%
17–2171 Petroleum Engineers 28.3%
17–3023 Electrical and Electronics Engineering Technicians 42.3%
47–1011 First-Line Supervisors of Construction Trades and Extraction Workers 65.1%
47–2061 Construction Laborers 67.4%
47–2073 Operating Engineers and Other Construction Equipment Operators 69.4%
47–2152 Plumbers, Pipefi tters, and Steamfi tters 82.5%
47–5011 Derrick Operators, Oil and Gas 88.3%
47–5012 Rotary Drill Operators, Oil and Gas 80.8%
47–5013 Service Unit Operators, Oil, Gas, and Mining 88.0%
47–5071 Roustabouts, Oil and Gas 85.0%
49–3031 Bus and Truck Mechanics and Diesel Engine Specialists 37.1%
49–3042 Mobile Heavy Equipment Mechanics, Except Engines 66.5%
49–9041 Industrial Machinery Mechanics 39.5%
51–4012 Computer Numerically Controlled Machine Tool Programmers, Metal and Plastic 35.8%
51–4041 Machinists 33.3%
51–4121 Welders, Cutters, Solderers, and Brazers 49.1%
51–4122 Welding, Soldering, and Brazing Machine Setters, Operators, and Tenders 38.0%
53–3032 Heavy and Tractor-Trailer Truck Drivers 68.8%
53–7032 Excavating and Loading Machine and Dragline Operators 70.5%
53–7071 Gas Compressor and Gas Pumping Station Operators 56.6%
53–7073 Wellhead Pumpers 37.8%
Total for all high-demand occupations 61.2%
Source: Bureau of Labor Statistics and IHS © 2015 IHS
© 2015 IHS 8 June 2015
IHS Economics | Supplying the Unconventional Revolution: Sizing the unconventional oil and gas supply chain—Part II. Workforce readiness
Similarly, the HDO employment trends parallel the core occupation employment trends in the six selected states. Texas, Pennsylvania, and Louisiana, with relatively higher levels of unconventional energy development, lead the selected states—and the nation as a whole—in the growth and recovery trends for the high-demand occupations, as they did for core occupations. HDO employment in these three states has grown much faster than for most other occupations, in response to the unconventional energy boom. Ohio and Colorado, refl ecting their less-developed unconventional energy sectors, have grown more slowly. Illinois again is an outlier, as its HDO employment level has not fully recovered from the recession.
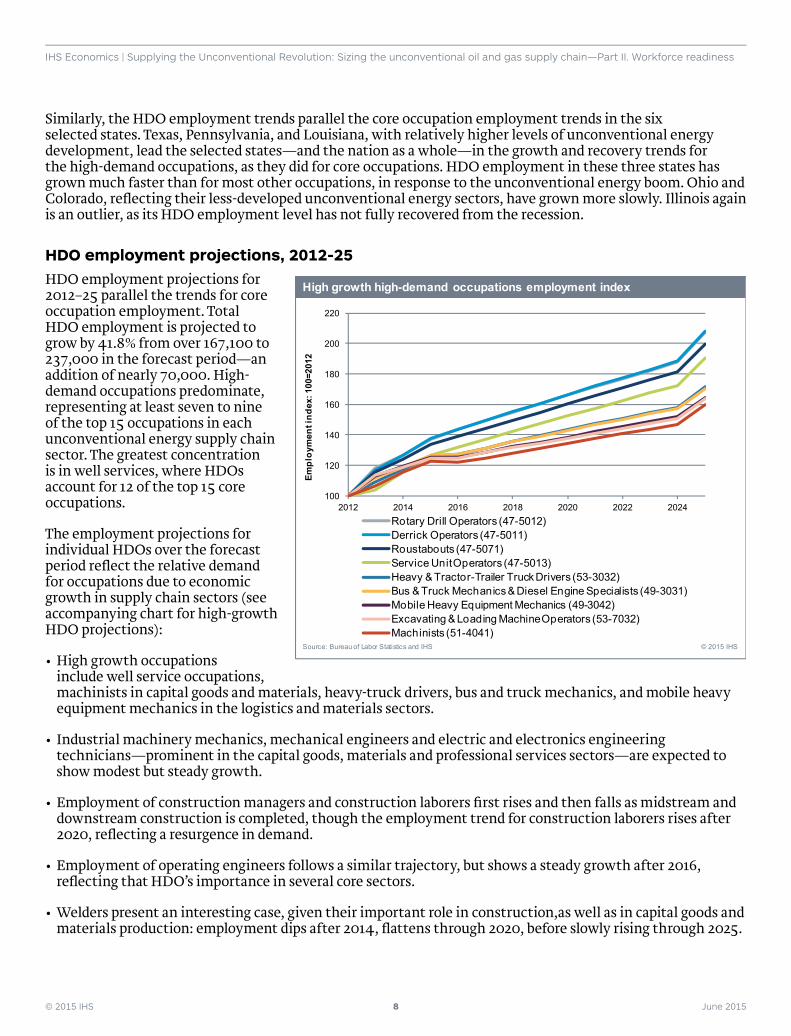
HDO employment projections, 2012-25 HDO employment projections for 2012–25 parallel the trends for core occupation employment. Total HDO employment is projected to grow by 41.8% from over 167,100 to 237,000 in the forecast period—an addition of nearly 70,000. High-demand occupations predominate, representing at least seven to nine of the top 15 occupations in each unconventional energy supply chain sector. The greatest concentration is in well services, where HDOs account for 12 of the top 15 core occupations.
The employment projections for individual HDOs over the forecast period refl ect the relative demand for occupations due to economic growth in supply chain sectors (see accompanying chart for high-growth HDO projections):
• High growth occupations include well service occupations, machinists in capital goods and materials, heavy-truck drivers, bus and truck mechanics, and mobile heavy equipment mechanics in the logistics and materials sectors.
• Industrial machinery mechanics, mechanical engineers and electric and electronics engineering technicians—prominent in the capital goods, materials and professional services sectors—are expected to show modest but steady growth.
• Employment of construction managers and construction laborers fi rst rises and then falls as midstream and downstream construction is completed, though the employment trend for construction laborers rises after 2020, refl ecting a resurgence in demand.
• Employment of operating engineers follows a similar trajectory, but shows a steady growth after 2016, refl ecting that HDO’s importance in several core sectors.
• Welders present an interesting case, given their important role in construction,as well as in capital goods and materials production: employment dips after 2014, fl attens through 2020, before slowly rising through 2025.
100
120
140
160
180
200
220
2012 2014 2016 2018 2020 2022 2024Rotary Drill Operators (47-5012)Derrick Operators (47-5011)Roustabouts (47-5071) Service Unit Operators (47-5013)Heavy & Tractor-Trailer Truck Drivers (53-3032) Bus & Truck Mechanics & Diesel Engine Specialists (49-3031)Mobile Heavy Equipment Mechanics (49-3042) Excavating & Loading Machine Operators (53-7032) Machinists (51-4041)
High growth high-demand occupations employment indexEm
ploy
men
t ind
ex: 1
00=2
012
Source: Bureau of Labor Statistics and IHS © 2015 IHS
© 2015 IHS 9 June 2015
IHS Economics | Supplying the Unconventional Revolution: Sizing the unconventional oil and gas supply chain—Part II. Workforce readiness
Replacement needsReplacement needs for core occupations is a measure of turnover in the labor force, as workers change employers or occupations, go back to school, retire, or leave the workforce for other reasons. The employment changes in occupations due to economic growth of corresponding supply chain sectors do not refl ect the actual numbers of workers that may need to be hired at a given time, because of the turnover in the workforce. Examination of these factors suggests that some high-demand occupations today, especially in the construction sector, may not actually be in high demand by 2025, while others may become in even more high demand because of replacement needs.
Overall, if replacement needs are factored in, supply chain employers could need to fi ll a total of at least 118,300 new jobs—jobs from economic growth and replacement needs—in HDOs by 2025. Estimated replacement needs for individual HDOs show substantial growth in demand for heavy and tractor-trailer truck drivers, roustabouts, service unit operators, machinists, operating engineers, industrial machinery mechanics, mechanical engineers and welders. The demand growth stems from job openings from economic growth and replacement needs in the forecast period, ranging from a 49% increase for welders to a 143% increase for service unit operators compared with 2012.
• Heavy and tractor-trailer truck drivers will have the largest increase in demand—19,800 jobs due to economic growth and 5,800 openings due to replacement needs.
• Most other HDOs also will have substantial replacement needs in addition to projected job increases due to economic growth.
• Both construction laborer and construction manager jobs are projected to decline by 2025. However, because of replacement needs construction laborer jobs still would have a net increase in demand, but construction manager jobs would still fall because replacement needs would not be su� cient to o� set economic-related losses, resulting in a net decline in employment.
Workforce readiness opportunitiesThe projected growth of employment in HDOs, due both to economic growth and replacement needs, raises questions about the capacity of the nation’s workforce education and training system to meet employers’ needs over the next decade. The major unconventional oil and gas producing states will have the greatest challenges to provide the workforce programs needed to support local pools of trained workers in HDOs for oil and gas fi rms and their supply chain.
A large variety of workforce initiatives have been started, expanded, and strengthened with the goal of increasing the supply of skilled workers to meet current and expected growth in demand for HDOs. These e� orts take many di� erent forms involving various combinations of private and public sector participation and operating at the local, state, multistate, and national levels:

© 2015 IHS 10 June 2015
IHS Economics | Supplying the Unconventional Revolution: Sizing the unconventional oil and gas supply chain—Part II. Workforce readiness
• Community college, technical college and university programs as well as union apprenticeships frequently operate in partnership with energy-related companies and business trade associations.
• Most companies do some form of on-the-job training but count on third-party providers (e.g., apprenticeships, community colleges) to provide basic technical knowledge and skills to qualify candidates prior to hiring.
• Consortia of workforce stakeholders—businesses, universities, community colleges, and other education and training providers, both on the national and state level—have come together to monitor and promote policies and programs to address the workforce challenges.
It is beyond the scope of the current study to evaluate the capabilities of these programs to meet the projected demands for workers across the spectrum of HDOs. While there is a general consensus about the serious workforce challenges confronting unconventional supply chain employers, the industry so far appears to be keeping up with the demand. However, it remains unclear whether market forces are su� cient to meet the growing workforce readiness needs of the unconventional energy supply chain over the next decade as it rapidly expands. It is possible support from state and federal policies will be required to optimize the economic growth of the unconventional energy sector, which relies on the availability of a high-skilled, well-trained workforce throughout its value chain.
© 2015 IHS 11 June 2015
IHS Economics | Supplying the Unconventional Revolution: Sizing the unconventional oil and gas supply chain—Part II. Workforce readiness
The workforce readiness challengeThe unprecedented growth of unconventional energy development is opening up substantial economic development opportunities in the United States, especially in the regions where there are large shale, tight sands, and tight oil plays. While this energy boom has helped to reverse some of the economic losses resulting from the Great Recession, it has also presented new workforce challenges for employers in the energy sector and the supporting supply chain.
The growing shortage of qualifi ed workers to meet the demand of the rapidly expanding unconventional energy sector has been widely reported. The International Gas Union (IGU) identifi ed people as a “key element for the energy industry to continue its unprecedented growth” and cited surveys identifying “a shortage of talent as one of industry’s biggest challenges in the coming years.”2 A major concern is that the current workforce in many of the regions experiencing the unconventional energy boom might not be enough to maximize the burgeoning opportunities in the new energy value chain. For example, a report of the Eagle Ford Shale Task Force in Texas asks, “How do we maintain the manpower needed to supply the growing shale play, and how do we ready the local workforce to take advantage of the near limitless job opportunities presented by the play.”3
An FMI International study of the energy construction industry indicates that, both domestically and worldwide, the labor demands resulting from unconventional energy production have been adding to strains in the supply of skilled labor in the conventional oil and gas industry, as well as critical supporting sectors such as oil and gas infrastructure construction.4 The lack of appropriately trained workers in the oil and gas sector could slow development of downstream industrial projects. For example, labor shortages in the Gulf Coast region from the unprecedented rise over the past three years in unconventional oil and gas production are perceived as causing delays in constructing refi neries and processing facilities in Texas and Louisiana.5
Similarly, in extensive surveys of construction fi rms in 2013 and 2014, the Associated General Contractors of America (AGC) identifi ed large and growing construction worker shortages in the United States. In 2014, for example, 83% of the over 1,000 US construction fi rms surveyed reported di� culties in fi nding enough qualifi ed craft workers, while 61% reported di� culties fi nding qualifi ed construction professionals. Many of the fi rms surveyed by the AGC operate within the core construction sectors in the unconventional energy supply chain. The AGC notes that one of the biggest challenges facing these fi rms is the lack of qualifi ed professional and craft workers as the construction industry continues to recover from a severe downturn that began more than seven years ago.6
Many US manufacturers also have long complained about problems fi nding enough workers with skills they need. For example, the National Association of Manufacturers cited a 2011 survey that found 74% of fi rms reported defi ciencies in the skills of candidates for jobs. On the other hand, a 2012–13 survey of nearly 900 manufacturers by a Massachusetts Institute of Technology research team had more modest results. It found that although most employers did not have extended vacancies, nearly one-quarter of the manufacturers surveyed reported long-term vacancies for which they had di� culties fi nding workers with the necessary skills.7 As in the construction sector, as manufacturing recovers from the Great Recession and experiences somewhat of a resurgence from the “re-reshoring” of overseas production, manufacturers, including those in
2 Richard Nemec. “Innovations in Workforce Training, Education.” Pipeline & Gas Journal. 2014. HighBeam Research. (November 29, 2014). http://www.highbeam.com/doc/1G1-356907037.html.
3 Railroad Commission of Texas (RRC). Eagle Ford Shale Task Force Report. Convened and chaired by Railroad Commissioner David Porter. March 2013:12.
4 FMI Corporation. Skill Shortages in a Booming Market: The Big Oil and gas Challenge. 2013 (www.fminet.com).
5 Isaac Arnsdorf, Dan Murtagh and Jack Kaskey. “Labor Shortage Threatens to Bust the Shale Boom.” Bloomberg.com (April 17, 2014).
6 Associated General Contractors of America (AGC). “Worker Shortage Survey Analysis.” Summary. See also AGC, “2013 Worker Shortage Survey Results. National Results.” 2014. See http://news.agc.org/2013/09/04/seventy-four-percent-of-construction-fi rms-report-having-trouble-fi nding-qualifi ed-workers/.
7 See Suzanne Berger and the MIT Task Force on Production and Innovation. Making In America, From Innovation to Market. Cambridge, Massachusetts: The MIT Press, 2013:179-197 (Ch.7).

© 2015 IHS 12 June 2015
IHS Economics | Supplying the Unconventional Revolution: Sizing the unconventional oil and gas supply chain—Part II. Workforce readiness
the unconventional and conventional energy supply chains, are facing increased competition for certain types of skilled production workers.
Along with manufacturing and construction, the challenge of skill shortages exists throughout the unconventional energy supply chain sectors IHS identifi ed in its economic analysis. Supply chain sectors employ workers from a wide range of occupations, from very highly educated petroleum engineers and mechanical engineers, to skilled trade workers such as welders, operating engineers, and diesel technicians, to construction laborers and well-pumpers.
A number of factors underlie the workforce skill challenge in the unconventional energy supply chain. These have been a� ecting e� orts, especially in states with large unconventional plays, to meet the demand for workers with needed skills. Aside from growing competition across and within core sectors, as in construction and manufacturing, some of the most important factors are technological advances that have created new skill requirements; the rapid rise of energy extraction activities that puts pressures on local labor markets; lack of local applicants with appropriate skills and qualifi cations, including so-called “soft skills”; the rural location and di� cult working conditions of unconventional energy activities; the aging and rapidly retiring Baby Boom workforce; and inadequate career education and technical training facilities for HDOs that do not require four-year degreesFederal and state agencies, companies, industry trade associations, labor unions, workforce education and training providers (including one-, two-, and four-year postsecondary institutions), and community and economic development organizations have been involved in expanding or creating workforce readiness initiatives to address these challenges. These e� orts take a variety of di� erent forms, refl ecting the needs of di� erent industry sectors and their occupations, and the size of local labor markets. Some e� orts are national or multistate, but a large number have been instituted within individual states with large unconventional plays. Whether these initiatives will be adequate to meet the workforce readiness challenge, however, remains uncertain, especially as the unconventional energy sector expands as projected over the next decade.
© 2015 IHS 13 June 2015
IHS Economics | Supplying the Unconventional Revolution: Sizing the unconventional oil and gas supply chain—Part II. Workforce readiness
Assessing the workforce challengeTo assess the scale, scope and nature of the workforce readiness challenge, IHS and High Road Strategies, LLC jointly undertook an extensive study of the unconventional energy supply chain’s occupational structure, skill needs, and workforce education and training pipeline. The analysis incudes evaluation of the “upstream” well services, “midstream” construction, professional services, and transport services, and “downstream” suppliers of equipment and materials employed in all phases of unconventional oil and gas production. Relevant activities include predrilling, well-pad preparation, drilling and extraction, transport, and processing of unconventional energy fuels. The study was conducted both at the national level and for a selected group of states with major unconventional energy plays.
Specifi cally, to accomplish these objectives, the IHS-High Road Strategies project team:• Identifi ed and examined the principal workforce challenges confronting the unconventional supply chain
industries; • Identifi ed the core occupations of the unconventional supply chain industries, and of these, determined
which are in greatest demand, both nationally and in selected states with major plays; and• Identifi ed and examined the public and private sector workforce training and education programs and
initiatives established to address the workforce needs of the unconventional energy supply chain. The study’s approach and the results of this analysis are summarized below, and in the sections that follow.
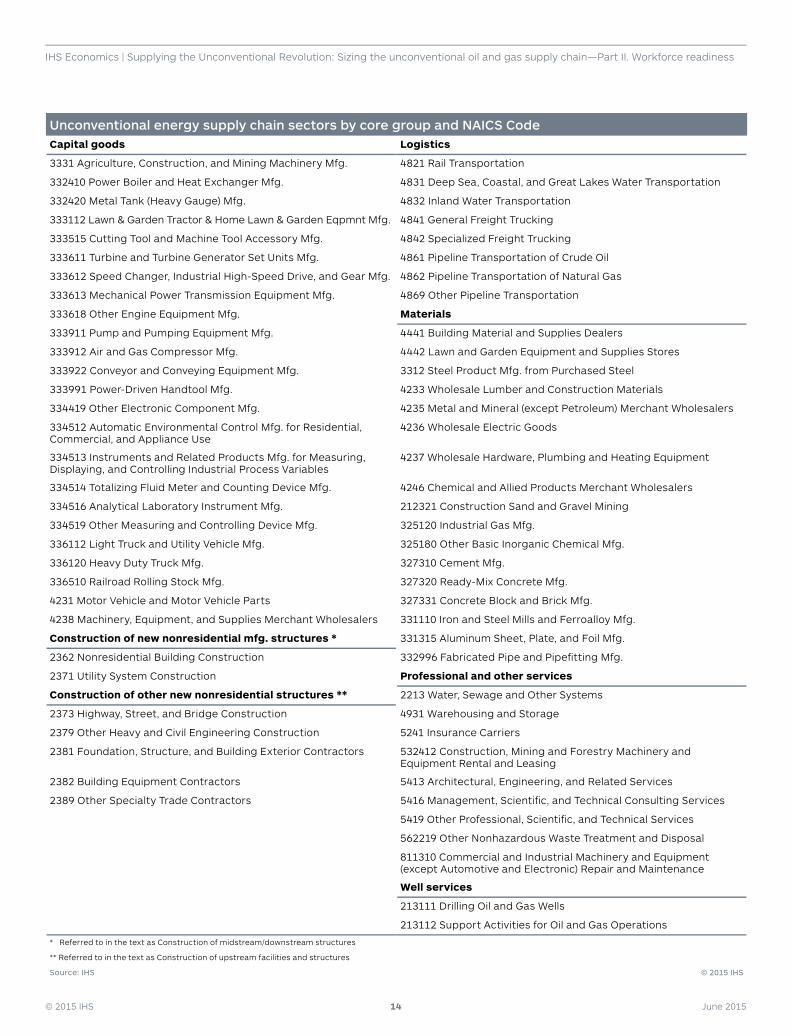
Methodology and approachThis report used the same defi nition of the unconventional energy supply chain that IHS identifi ed in our prior economic analysis of the supply chain, consisting of 67 individual economic sectors at the 4-digit and 6-digit NAICs levels For the purposes of the workforce assessment, the 67 individual sectors were divided into seven core groups—capital goods, construction of new nonresidential mfg. structures, construction of other new nonresidential structures, logistics, materials, professional and other services, and well services8 as shown in the accompanying table. In some of the tables in this report, the well services and the two construction core sectors are combined into a single, larger core sector for ease of presentation.
8 IHS Economics. Supplying the Unconventional Revolution: Sizing the unconventional oil and gas supply chain. September 2014.
© 2015 IHS 14 June 2015
IHS Economics | Supplying the Unconventional Revolution: Sizing the unconventional oil and gas supply chain—Part II. Workforce readiness
Unconventional energy supply chain sectors by core group and NAICS CodeCapital goods Logistics
3331 Agriculture, Construction, and Mining Machinery Mfg. 4821 Rail Transportation
332410 Power Boiler and Heat Exchanger Mfg. 4831 Deep Sea, Coastal, and Great Lakes Water Transportation
332420 Metal Tank (Heavy Gauge) Mfg. 4832 Inland Water Transportation
333112 Lawn & Garden Tractor & Home Lawn & Garden Eqpmnt Mfg. 4841 General Freight Trucking
333515 Cutting Tool and Machine Tool Accessory Mfg. 4842 Specialized Freight Trucking
333611 Turbine and Turbine Generator Set Units Mfg. 4861 Pipeline Transportation of Crude Oil
333612 Speed Changer, Industrial High-Speed Drive, and Gear Mfg. 4862 Pipeline Transportation of Natural Gas
333613 Mechanical Power Transmission Equipment Mfg. 4869 Other Pipeline Transportation
333618 Other Engine Equipment Mfg. Materials
333911 Pump and Pumping Equipment Mfg. 4441 Building Material and Supplies Dealers
333912 Air and Gas Compressor Mfg. 4442 Lawn and Garden Equipment and Supplies Stores
333922 Conveyor and Conveying Equipment Mfg. 3312 Steel Product Mfg. from Purchased Steel
333991 Power-Driven Handtool Mfg. 4233 Wholesale Lumber and Construction Materials
334419 Other Electronic Component Mfg. 4235 Metal and Mineral (except Petroleum) Merchant Wholesalers
334512 Automatic Environmental Control Mfg. for Residential, Commercial, and Appliance Use
4236 Wholesale Electric Goods
334513 Instruments and Related Products Mfg. for Measuring, Displaying, and Controlling Industrial Process Variables
4237 Wholesale Hardware, Plumbing and Heating Equipment
334514 Totalizing Fluid Meter and Counting Device Mfg. 4246 Chemical and Allied Products Merchant Wholesalers
334516 Analytical Laboratory Instrument Mfg. 212321 Construction Sand and Gravel Mining
334519 Other Measuring and Controlling Device Mfg. 325120 Industrial Gas Mfg.
336112 Light Truck and Utility Vehicle Mfg. 325180 Other Basic Inorganic Chemical Mfg.
336120 Heavy Duty Truck Mfg. 327310 Cement Mfg.
336510 Railroad Rolling Stock Mfg. 327320 Ready-Mix Concrete Mfg.
4231 Motor Vehicle and Motor Vehicle Parts 327331 Concrete Block and Brick Mfg.
4238 Machinery, Equipment, and Supplies Merchant Wholesalers 331110 Iron and Steel Mills and Ferroalloy Mfg.
Construction of new nonresidential mfg. structures * 331315 Aluminum Sheet, Plate, and Foil Mfg.
2362 Nonresidential Building Construction 332996 Fabricated Pipe and Pipefi tting Mfg.
2371 Utility System Construction Professional and other services
Construction of other new nonresidential structures ** 2213 Water, Sewage and Other Systems
2373 Highway, Street, and Bridge Construction 4931 Warehousing and Storage
2379 Other Heavy and Civil Engineering Construction 5241 Insurance Carriers
2381 Foundation, Structure, and Building Exterior Contractors 532412 Construction, Mining and Forestry Machinery and Equipment Rental and Leasing
2382 Building Equipment Contractors 5413 Architectural, Engineering, and Related Services
2389 Other Specialty Trade Contractors 5416 Management, Scientifi c, and Technical Consulting Services
5419 Other Professional, Scientifi c, and Technical Services
562219 Other Nonhazardous Waste Treatment and Disposal
811310 Commercial and Industrial Machinery and Equipment (except Automotive and Electronic) Repair and Maintenance
Well services
213111 Drilling Oil and Gas Wells
213112 Support Activities for Oil and Gas Operations
* Referred to in the text as Construction of midstream/downstream structures
** Referred to in the text as Construction of upstream facilities and structures
Source: IHS © 2015 IHS
© 2015 IHS 15 June 2015
IHS Economics | Supplying the Unconventional Revolution: Sizing the unconventional oil and gas supply chain—Part II. Workforce readiness
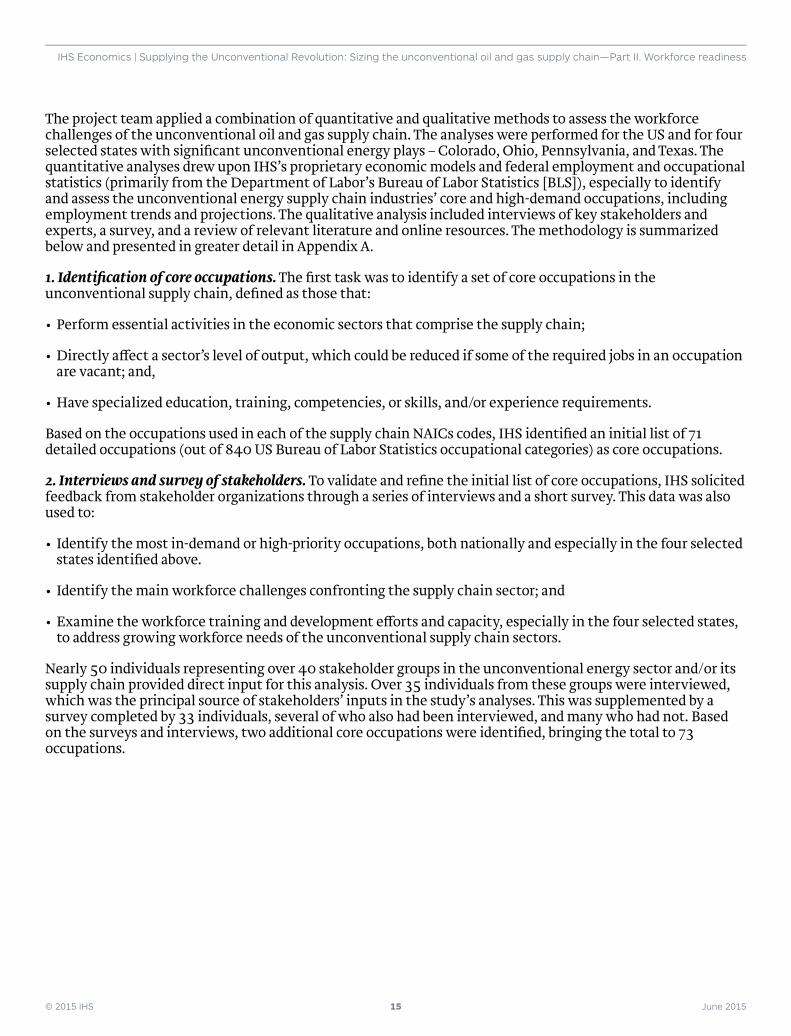
The project team applied a combination of quantitative and qualitative methods to assess the workforce challenges of the unconventional oil and gas supply chain. The analyses were performed for the US and for four selected states with signifi cant unconventional energy plays – Colorado, Ohio, Pennsylvania, and Texas. The quantitative analyses drew upon IHS’s proprietary economic models and federal employment and occupational statistics (primarily from the Department of Labor’s Bureau of Labor Statistics [BLS]), especially to identify and assess the unconventional energy supply chain industries’ core and high-demand occupations, including employment trends and projections. The qualitative analysis included interviews of key stakeholders and experts, a survey, and a review of relevant literature and online resources. The methodology is summarized below and presented in greater detail in Appendix A.
1. Identifi cation of core occupations. The fi rst task was to identify a set of core occupations in the unconventional supply chain, defi ned as those that:
• Perform essential activities in the economic sectors that comprise the supply chain;
• Directly a� ect a sector’s level of output, which could be reduced if some of the required jobs in an occupation are vacant; and,
• Have specialized education, training, competencies, or skills, and/or experience requirements.
Based on the occupations used in each of the supply chain NAICs codes, IHS identifi ed an initial list of 71 detailed occupations (out of 840 US Bureau of Labor Statistics occupational categories) as core occupations.
2. Interviews and survey of stakeholders. To validate and refi ne the initial list of core occupations, IHS solicited feedback from stakeholder organizations through a series of interviews and a short survey. This data was also used to:
• Identify the most in-demand or high-priority occupations, both nationally and especially in the four selected states identifi ed above.
• Identify the main workforce challenges confronting the supply chain sector; and
• Examine the workforce training and development e� orts and capacity, especially in the four selected states, to address growing workforce needs of the unconventional supply chain sectors.
Nearly 50 individuals representing over 40 stakeholder groups in the unconventional energy sector and/or its supply chain provided direct input for this analysis. Over 35 individuals from these groups were interviewed, which was the principal source of stakeholders’ inputs in the study’s analyses. This was supplemented by a survey completed by 33 individuals, several of who also had been interviewed, and many who had not. Based on the surveys and interviews, two additional core occupations were identifi ed, bringing the total to 73 occupations.
© 2015 IHS 16 June 2015
IHS Economics | Supplying the Unconventional Revolution: Sizing the unconventional oil and gas supply chain—Part II. Workforce readiness
3. Review of literature and online resources. The IHS team conducted an extensive review of reports, documents and articles. Of particular value were assessments of occupational needs and employment growth associated with unconventional oil and gas development in Pennsylvania,9 Ohio,10 Texas11 and Colorado,12 performed either by academic research institutes or state agencies, and some sponsored by oil and gas industry associations.
4. Identifi cation of HDOs. A major objective of the study was identifying the core occupations that are in especially high demand. This was achieved by comparing the fi ndings from multiple sources, including: 1) the statistical analyses; 2) interview and survey fi ndings; and 3) the relevant literature, particularly studies evaluating workforce needs in Pennsylvania, Texas, and Ohio. The IHS team identifi ed 24 occupations that qualify as HDOs. This list applies nationally, and is reasonably consistent across all the major producing states reviewed in the study, although which occupations are in highest demand may vary somewhat by state—refl ecting di� erences, for example, in the stage of development of unconventional energy resources among the states with plays.
5. Occupational employment projections and replacement needs. In its economic study of the unconventional energy supply chain, IHS estimated the total employment for each supply chain NAICS sector in the United States between 2012 and 2025. The sector forecasts were specifi cally developed for this study and takes into account IHS’s best assessment of future demands for inputs from the supply chain due to forecast levels of activity in the unconventional energy sector. IHS then forecast detailed occupational employment for each supply chain sector using data from its Business Markets Insights (BMI) database. We estimated occupational employment growth needed to meet replacement needs, defi ned as job openings due to turnover or retirement or other factors, using the annual replacement rates contained in BLS’s long-term occupational forecasts. Gross employment demand for an occupation over time is the sum of the net change due to economic growth plus replacement needs; workforce agencies need to consider both in meeting future labor demand.
Major workforce challengesThere is a broad consensus that unconventional supply chain businesses are currently having di� culty fi nding qualifi ed workers, especially in the producing states. These challenges are not unique to the unconventional oil and gas value chain, as similar concerns have been echoed by the conventional oil and gas industry and in other industrial sectors such as manufacturing, construction and transportation.
Although the nature of workforce challenges in the unconventional supply chain is similar across the United States, the magnitude of the challenge varies by state, often proportional to the stage of play development within a producing state. For example, in Pennsylvania, where unconventional development is relatively advanced, the state has designed training programs to address the workforce needs of the new companies that began operations in the state to take advantage of the Marcellus Shale resource. Ohio, meanwhile, is at an earlier stage of development of its Utica play and is in the early stages of increasing the capacity of its workforce to meet the expected rise in demand for skilled labor.
This report highlights the nature of the workforce and key issues confronting participants in the unconventional supply chain. The evidence collected for this analysis refl ects the national literature and direct
9 See for example, Marcellus Shale Education and Training Center (MSETC; now ShaleTEC). Pennsylvania Marcellus Shale Workforce Needs Assessment. MSETC Needs Assessment Series. Summer 2011 (www.msetc.org); Center for Workforce Information & Analysis (CWIA), Pennsylvania Department of Labor and Industry. Marcellus Shale Fast Fact, July 2012 Edition. August 7, 2013 (www.paworkstats.state.pa.us); CWIA. Job Skills Most Needed Across All Occupations by Occupational Group, December 2013; Pennsylvania Independent Oil & Gas Association (PIOGA). “Careers in Oil and Natural Gas,” n.d. (www.pioga.org); Jim Kaufman and Laura Fisher. Workforce Analysis Report: Energy Sector Jobs in Greater Pittsburgh. Pittsburgh, Pennsylvania: Allegheny Conference on Community Development and Energy Alliance of Greater Pittsburgh. August 20, 2012 (www.AlleghenyConference.org).
10 Ohio Department of Job and Family Services (JFS). Ohio Shale, Quarterly Economic Trends for Ohio Oil and Gas Industries, April 2013 and earlier years. Ohio Oil & Gas Energy Education Program (OOGEEP). Oil and Gas Careers in Ohio Series, Career Guide. March 3, 2014 (www.oogeep/industry-workforce/careers/).
11 RRC. Eagle Ford Task Force; Center for Community and Business Research (CCBR), Institute for Economic Development, University of Texas at San Antonio, Workforce Analysis for the Eagle Ford Shale. October 2012.
12 BCS Incorporated. Colorado’s Energy Industry, Strategic Development Through Collaboration. Prepared for Colorado O� ce of Economic Development and International Trade, Colorado Energy O� ce, Colorado Department of Natural Resources, and Colorado Department of Public Health and Environment. November 2013.
© 2015 IHS 17 June 2015
IHS Economics | Supplying the Unconventional Revolution: Sizing the unconventional oil and gas supply chain—Part II. Workforce readiness
input via the interviews and survey from stakeholders in Pennsylvania, Ohio, Colorado, Texas, Louisiana, Illinois and elsewhere.
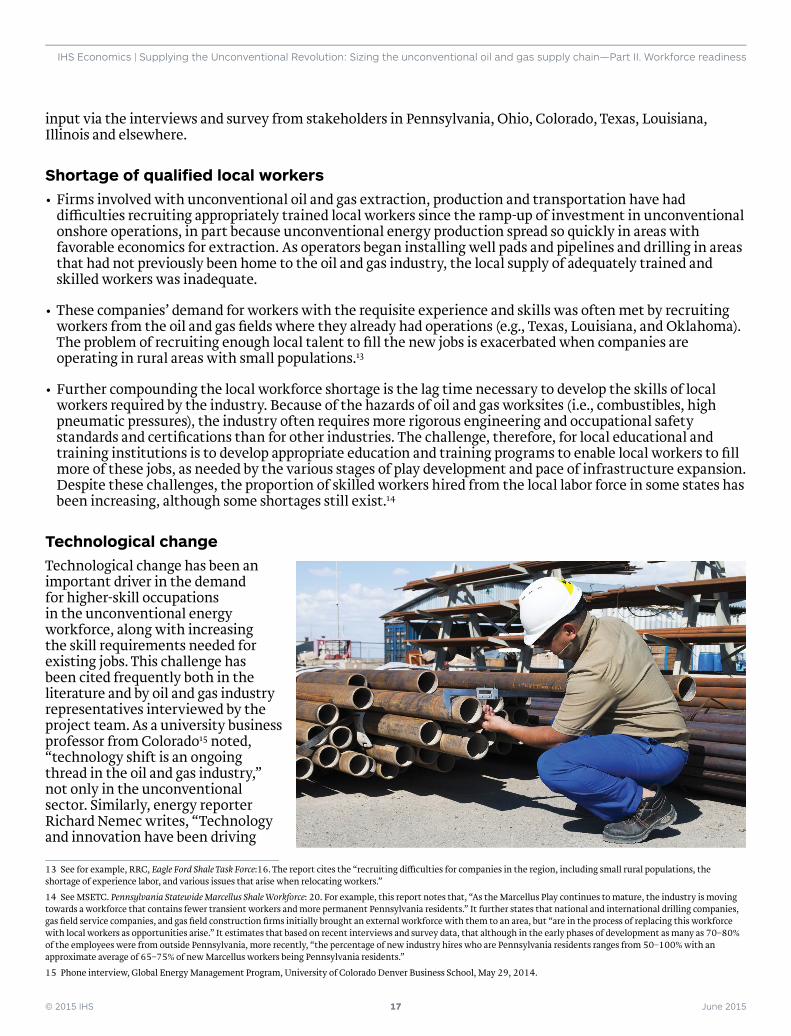
Shortage of qualifi ed local workers• Firms involved with unconventional oil and gas extraction, production and transportation have had
di� culties recruiting appropriately trained local workers since the ramp-up of investment in unconventional onshore operations, in part because unconventional energy production spread so quickly in areas with favorable economics for extraction. As operators began installing well pads and pipelines and drilling in areas that had not previously been home to the oil and gas industry, the local supply of adequately trained and skilled workers was inadequate.
• These companies’ demand for workers with the requisite experience and skills was often met by recruiting workers from the oil and gas fi elds where they already had operations (e.g., Texas, Louisiana, and Oklahoma). The problem of recruiting enough local talent to fi ll the new jobs is exacerbated when companies are operating in rural areas with small populations.13
• Further compounding the local workforce shortage is the lag time necessary to develop the skills of local workers required by the industry. Because of the hazards of oil and gas worksites (i.e., combustibles, high pneumatic pressures), the industry often requires more rigorous engineering and occupational safety standards and certifi cations than for other industries. The challenge, therefore, for local educational and training institutions is to develop appropriate education and training programs to enable local workers to fi ll more of these jobs, as needed by the various stages of play development and pace of infrastructure expansion. Despite these challenges, the proportion of skilled workers hired from the local labor force in some states has been increasing, although some shortages still exist.14
Technological change Technological change has been an important driver in the demand for higher-skill occupations in the unconventional energy workforce, along with increasing the skill requirements needed for existing jobs. This challenge has been cited frequently both in the literature and by oil and gas industry representatives interviewed by the project team. As a university business professor from Colorado15 noted, “technology shift is an ongoing thread in the oil and gas industry,” not only in the unconventional sector. Similarly, energy reporter Richard Nemec writes, “Technology and innovation have been driving
13 See for example, RRC, Eagle Ford Shale Task Force:16. The report cites the “recruiting di� culties for companies in the region, including small rural populations, the shortage of experience labor, and various issues that arise when relocating workers.”
14 See MSETC. Pennsylvania Statewide Marcellus Shale Workforce: 20. For example, this report notes that, “As the Marcellus Play continues to mature, the industry is moving towards a workforce that contains fewer transient workers and more permanent Pennsylvania residents.” It further states that national and international drilling companies, gas fi eld service companies, and gas fi eld construction fi rms initially brought an external workforce with them to an area, but “are in the process of replacing this workforce with local workers as opportunities arise.” It estimates that based on recent interviews and survey data, that although in the early phases of development as many as 70–80% of the employees were from outside Pennsylvania, more recently, “the percentage of new industry hires who are Pennsylvania residents ranges from 50–100% with an approximate average of 65–75% of new Marcellus workers being Pennsylvania residents.”
15 Phone interview, Global Energy Management Program, University of Colorado Denver Business School, May 29, 2014.

© 2015 IHS 18 June 2015
IHS Economics | Supplying the Unconventional Revolution: Sizing the unconventional oil and gas supply chain—Part II. Workforce readiness
the US renaissance.” For example, “everything from welding to coatings and the composition of today’s large diameter pipes involves advanced operations.”16 Gas compression—a critical component at well sites, process plants and along the nation’s network of gas pipelines—is another area of technological advance a� ecting the industry and workforce development needs.17
An oil and gas equipment distributor further states that, “there is no change in this industry except for technology. We have had 40 years of unconventional drilling and fracturing. But it is the technology—such as 3D and seismic technology and horizontal drilling—that allows the industry to fi nd the stu� they couldn’t fi nd before.”18 The head of a Colorado-based community college oil and gas program adds that the industry is “not just looking for laborers. Jobs in this sector require reading gauges, being computer literate, understanding automation and the programming of PLCs (programmable logic controllers) at the wellhead. They also need to know how processes work, ranging from control-room operations to monitoring the wells.”19 In short, workforce education and training programs geared to the unconventional energy sector and its supply chain need to be able to keep up with technological advances.
“Soft skills” and behavioral barriers Even if workers have the technical skills needed, workers must also demonstrate to employers they have “soft skills” and ability to meet behavioral standards. Examples of soft skills include reporting to work on time, knowing how to dress for the workplace, and having the skills to interact with people and to work on a team.20 While this is not unique to the oil and gas industry,21 fi nding workers that have a good mix of technical skills, knowledge, and a strong work ethic remains a challenge for energy and supply chain companies.22
Several people interviewed for this study highlighted a defi ciency of soft skills as a concern for the unconventional energy sector, as it is for the conventional oil and gas industry and for many other industries. As the director of a community college oil and gas program noted, “[The] industry wants us to teach soft skills—be at work on time, know time management and ethics, and team building.”23 Another workforce training expert adds that, “employers see a large skills gap—not just limited to employment in unconventional energy operations, but true for manufacturing, energy and construction. The technical skills (welding, mechanical and electrical systems) and soft skills gap is real, not just perceived.”24
Another behavioral challenge a� ecting employers seeking to hire skilled workers, especially in the oil and gas sector, is the large number of job applicants who are unable pass drug screening tests.25 Several employers and workforce practitioners from the various states indicated that this was an issue for workers they were trying to attract.26 An oil and gas equipment company o� cial from Texas noted that his industry mandates drug tests and background checks because of safety issues.27 These regulations exist, he added, because what the industry does “can seriously injure or kill people or have a major environmental impact.”
16 Nemec, “Innovations in Workplace Training, Education.”
17 Ibid.
18 Phone interview, Wagner Equipment Co., May 14, 2014.
19 Phone interview, Aims Community College Oil & Gas Program, May 29, 2014.
20 Federal Reserve Bank of Cleveland, Outreach Summary, Workforce Development Challenges in Ohio. Cleveland, Ohio (2014):6-7.
21 This comes up for a range of sectors, including, for example, the trucking industry. See for example; Je� rey Short. WHITE PAPER: Analysis of Truck Driver Age Demographics Across Two Decades. Atlanta, GA:American Transportation Research Institute, December 2014:3.
22 MSETC. Pennsylvania Statewide Marcellus Shale Workforce:6.
23 Phone interview, May 29, 2014.
24 Phone interview, Colorado Online Energy Training Consortium, May 15, 2014. Another in that interview suggested that there also may be a generation gap because younger people entering into the industry have not been taught a strong work ethic.
25 Federal Reserve Bank of Cleveland, Outreach Summary:6.
26 However, in at least one case, an interviewee said that it was not an issue in his experience, as most applicants pass the test. Phone interview, June 2, 2014; and phone interview, Career and Technical Education Center (C-TEC) of Licking County, June 3, 2014.
27 Phone interview, Weir Oil & Gas Co., June 5, 2014.
© 2015 IHS 19 June 2015
IHS Economics | Supplying the Unconventional Revolution: Sizing the unconventional oil and gas supply chain—Part II. Workforce readiness
Nevertheless, these and other behavioral screening tests (requiring driving records, performing criminal background checks) have also limited the size of the available workforce. Respondents cited examples of job applicants, despite having the requisite technical skills, being denied employment because of failed drug tests. One workforce program practitioner cited an instance in which drug tests eliminated half the crew from a site.28
Operator qualifi cations (OQ)The behavior restrictions related to the transportation and logistics component of the unconventional supply chain begin with regulations administered by the US Department of Transportation (DOT) and apply to pipeline installation and maintenance as well as interstate truck drivers and railroad operators. The Pipeline and Hazardous Material Safety Administration (PHMSA) administers the regulations in the pipeline sector, which mandate that workers in the industries and activities under its jurisdiction be drug tested and meet operator qualifi cations (OQs). OQ programs establish requirements that employees working on pipelines overseen by PHMSA meet technical competency requirements and be able to react to “abnormal operating conditions,” which in turn necessitates a great deal of training.
The onus of OQ programs regulated by PHMSA is on the large oil and gas companies, who then pass down these requirements to their contractors and suppliers. A common problem, however, is that the oil and gas companies may interpret the qualifi cations di� erently. The result, as oil and gas pipeline contractors explained, is that each company has its own OQ program and no uniform criteria for which a worker must be trained. Workers typically have 15 to 20 days of training for one operator and must undergo additional trainings with each new company.29 OQ has become an important regulatory issue for which the pipeline construction and installation industry seeks resolution.30
Working conditions and burnoutDi� cult working conditions were identifi ed as another constraint on fi nding workers, especially in upstream occupations and in pipeline, road and other construction work in support of oil and gas production. The industry needs workers willing to take jobs that are physically demanding, involve long hours and sustained periods of work, under sometimes harsh weather and environmental conditions, and also willing to be away from home for long periods.
Oil and gas extraction fi rms and their suppliers typically bring people in on a rotational basis: they work continuously for two to three weeks seven days a week, and 12 hours a day, and then are o� for a period of time. One operator observed that the oil and gas industry has always had a culture of mobility,31 but cited the example of workers being fl own in by their company for two weeks at a time to North Dakota to live in “man-camps” near the drilling sites. Meanwhile, their families stayed at home because the remote work was likely to only last for one to two years.32 Because the drilling locations can be in very rural areas, it also has been hard to attract qualifi ed workers from urban areas to relocate to rural counties where there is little else to do.33
These working conditions can be very stressful for workers, leading to burnout and high turnover. At the same time, the shortage of labor puts additional demand on the existing workers to put in additional time on the job. An industry association representative recommended that workers have a more accurate understanding of the demands, the expectations of their companies, and the level of stress in the jobs.34
28 Phone interview, Aims Community College Oil & Gas Program, May 29, 2024.
29 Phone interview, Distribution Contractors Association contractors. May 30, 2014.
30 Phone interview, Distribution Contractors Association industry representative. May 30, 2014. Because the regulation is so broad, “everybody has their own spin on this,” the industry representative observed. Enforcement by regulatory personnel is not uniform. Some states have their own regulatory groups, other have di� erent compliance programs, while still others don’t have any regulations at all. The federal government has its own pipeline safety group. But there is no consistency, and compliance is “specifi c inspector to inspector.”
31 Phone interview, Weir Oil & Gas Co., June 5, 2014.
32 Phone interview, Colorado Oil & Gas Association (COGA), May 22, 2014.
33 Phone interview, Pennsylvania Independent Oil & Gas Association (PIOGA), May 30, 2014.
34 Phone interview, PIOGA, May 30, 2014.

© 2015 IHS 20 June 2015
IHS Economics | Supplying the Unconventional Revolution: Sizing the unconventional oil and gas supply chain—Part II. Workforce readiness
Attracting youth to skilled tradesDi� cult working conditions can also further dampen young peoples’ interest in pursuing work and careers in laborer and skilled trade positions in the unconventional energy sector. The project team interviewed a large number of representatives of companies and industry associations who mentioned the challenge of attracting young people because of what they perceive as “cultural bias” in the United States against skilled trades jobs in certain industries such as manufacturing, construction and even trucking.35 One oil and gas equipment supplier employing machinists and welders noted that “not enough people are moving into the skilled trades areas” because “not enough young people are saying that this is an attractive space.”36
For many students and their parents, and often their high school guidance counselors, there remains a stigma attached to occupations that require vocational education and training. A Federal Reserve Bank in Cleveland report on workforce development in Ohio stated that while “many employers would hire mid-skilled workers who have some secondary school credential that is not a college degree, today’s educational system is primarily oriented toward students who plan to go to college, in terms of both curriculum and counseling resources, not on job or career readiness.”37
However, many of the individuals interviewed agreed that today’s skilled jobs in construction, manufacturing and energy sectors require relatively sophisticated skills, and capabilities in STEM (science, technology, engineering and math) remain important. Thus, there is wide agreement that changing the public perception of employment in skilled trades is critical to attracting more young people to careers in these fi elds.38
An aging workforceThe challenge of maintaining a su� cient workforce for high-demand unconventional supply chain occupations is made more acute by the looming retirement of aging Baby Boomers working in these fi elds, or the Great Crew Change, as it is known within the oil and gas industry.39 Concerns about the aging workforce cut across multiple industry sectors. Workers in manufacturing, utility, and supply tend to be older than the general working population. For example, in the 2009–10 manufacturing workforce, a Massachusetts Institute of Technology study noted that 17.2% were over 55 years old. BLS projections suggest that even when likely drops in aggregate manufacturing employment are accounted for, there will still be large replacement problems as the current generation of production workers retires.40
A National Academy of Sciences study on emerging workforce trends in US energy and mining concurred, noting the “boom in oil and natural gas exploration and production has created a demand for workers and equipment that comes when a large portion of the existing workforce, professional and nonprofessional is less than 5 years from retirement.” In fact, although many of these workers are already at retirement age, they continue employment because of the undersupply of experienced workers.41 For example, half of the oil and natural gas workforce are between the ages of 50 and 60,42 the average American welder is 55 years old,43 and about 40% of US utility workers will be eligible for retirement in the next fi ve years.44 The average age of truck
35 For example, see discussion concerning how decline in vocational education and increased emphasis on academic education will likely draw high school students away from a career as a truck driver: Short. WHITE PAPER: Analysis of Truck Driver Age Demographics:16-17.
36 Phone interview, Weir Oil & Gas Co., June 5, 2014.
37 Federal Reserve Bank of Cleveland. Outreach Summary: 5.
38 Phone interview, industry specialist, Ohio Oil & Gas Energy Education Program (OOGEEP), May 19, 2014. For example, this informant notes that only 21% of young people go on to get a college degree. So there could be an opportunity to reorient people, to attract many of them into vocational training programs in high-skilled trades occupations, which in fact often pay better than many jobs that require a four-year degree (especially in the burgeoning unconventional energy sector).
39 Federal Reserve Bank of Cleveland. Outreach Summary: 5.
40 Berger et al. Making In America: 189.
41 Committee on Emerging Workforce Trends in the US Energy and Mining Industries; Committee on Earth Resources; Board on Earth Sciences and Resources; Division on Earth and Life Studies; Board on Higher Education and Workforce; Policy and Global A� airs; National Research Council of the National Academies (NRC). Emerging Workforce Trends in the US Energy and Mining Industries: A Call to Action. Washington, DC: The National Academies Press, 2013:28.
42 John Kemp. “Have you considered a career in petro-engineering?” Reuters.com (Jan. 18, 2012).
43 Matthew Philips. “Welders, America Needs You.” BloombergBusinessweek (March 20, 2014).
44 PricewaterhouseCoopers. Power and Utilities Changing Workforce, Keeping the lights on. (www.pwc.com) December 2013.
© 2015 IHS 21 June 2015
IHS Economics | Supplying the Unconventional Revolution: Sizing the unconventional oil and gas supply chain—Part II. Workforce readiness
drivers is also reported to be older than the average age of workers in many other sectors of the workforce. For example, more than 31% of trucking employees in 2013 fell into the 45-54 age group, while about 20% fell in the 55-64 age range, and 6% were 65 or older. The latter percentage is greater than that the 20–24 age group (4.9%) employed in the trucking industry.45
The accelerating retirement rates among the energy industry’s skilled workforce, combined with rapidly advancing technology, have increased the pressures on industry training and education programs and resources.46 An oil and gas equipment supply fi rm executive noted the 15–20-year experience gap between older workers and new entrants. He is concerned about how to transfer the knowledge of people who have been in the industry 20–30 years to less experienced workers. The problem of transferring knowledge to younger workers, therefore, is critical for suppliers to consider in maintaining the right skills inventory to stay competitive.47
Competition for skilled workersMany of the industry and workforce professionals interviewed for this report said that the rapid growth of demand for oil and gas industry and supply sector jobs, along with the recovery in the US manufacturing sector, has fostered a fi erce competition for workers with comparable skills. It takes time, sometimes as long as four or fi ve years, to train workers for skilled trades, not to mention professional engineering and management positions. The time lag between ramping up the supply of skilled workers to meet rising demand has increased pressure to “poach” workers from other fi rms within and outside their own industries, often by o� ering much higher pay and incentives.
An Ohio community college program representative noted that workers with the engineering and technical skills required for the unconventional energy value chain are also in demand by manufacturing companies. For example, “if you know and can repair motors and compressors, can operate instrumentation and control systems, are a skilled technician, or know and can repair hydraulic systems, then both the manufacturing and the unconventional energy sectors will want you, and the competition bids up the wage levels.”48 Other interviewees had similar stories. A related concern is that some workers in technical training programs sometimes leave before they have fi nished their coursework, lured by the high wages paid by supply chain and extraction companies.
As the economy recovers and the manufacturing and construction sector improve, new investment in housing, transportation, infrastructure and the energy complex will create increasing competition for workers in the same high-demand occupations. For example, a manufacturing trade association leader noted that, “welders are getting amazing o� ers from drillers,” which refl ects the fi erce competition for talent.49 Another interviewee observed that human resources departments of trucking companies complain of troubles retaining drivers because of competition from energy companies. In the end, the fi erce competition for immediately deployable skilled workers leads to higher labor costs and “poaching” rather than investment in workforce training that benefi ts all sectors.50
45 Short. WHITE PAPER: Analysis of Truck Driver Age Demographics: 10.
46 FMI Incorporated. Skill Shortages:4.
47 Phone interview, Weir Oil & Gas Co., June 5, 2014.
48 Phone interview, Zane State College, June 28, 2014.
49 Phone interview, Ohio Manufacturers’ Association, May 29, 2014.
50 The trucking industry also has been raising concerns about impacts of competition within the industry on availability of drivers. Short. WHITE PAPER: Analysis of Truck Driver Age Demographics:2-3.
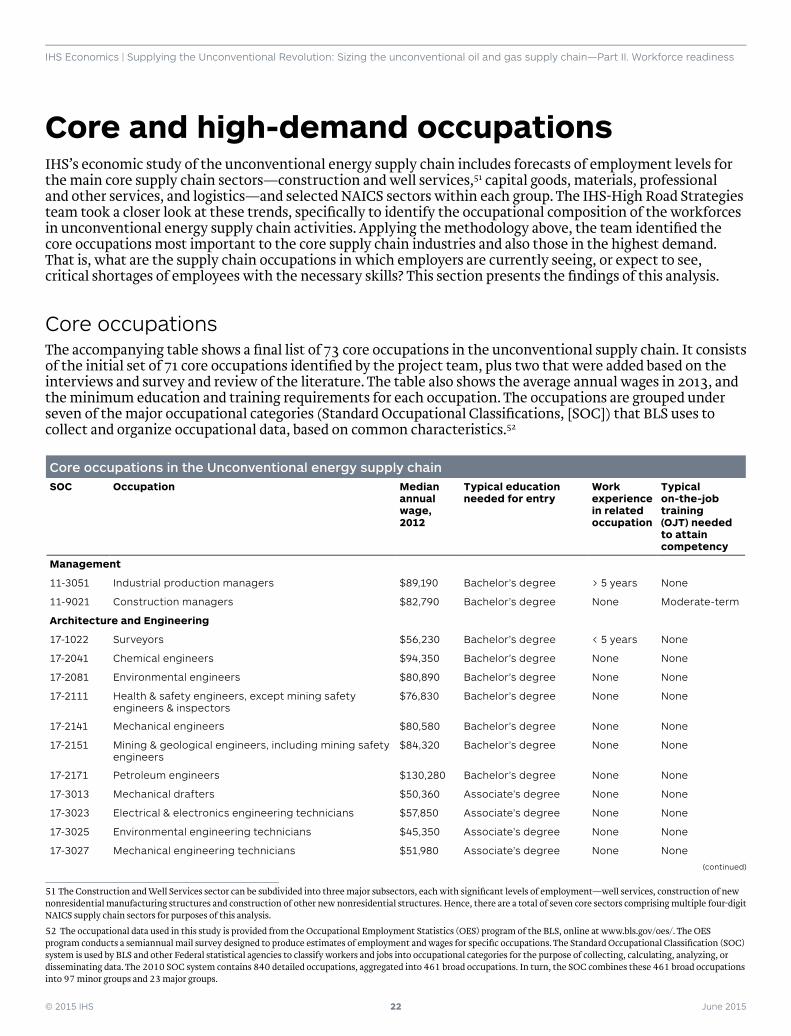
© 2015 IHS 22 June 2015
IHS Economics | Supplying the Unconventional Revolution: Sizing the unconventional oil and gas supply chain—Part II. Workforce readiness
Core and high-demand occupationsIHS’s economic study of the unconventional energy supply chain includes forecasts of employment levels for the main core supply chain sectors—construction and well services,51 capital goods, materials, professional and other services, and logistics—and selected NAICS sectors within each group. The IHS-High Road Strategies team took a closer look at these trends, specifi cally to identify the occupational composition of the workforces in unconventional energy supply chain activities. Applying the methodology above, the team identifi ed the core occupations most important to the core supply chain industries and also those in the highest demand. That is, what are the supply chain occupations in which employers are currently seeing, or expect to see, critical shortages of employees with the necessary skills? This section presents the fi ndings of this analysis.
Core occupationsThe accompanying table shows a fi nal list of 73 core occupations in the unconventional supply chain. It consists of the initial set of 71 core occupations identifi ed by the project team, plus two that were added based on the interviews and survey and review of the literature. The table also shows the average annual wages in 2013, and the minimum education and training requirements for each occupation. The occupations are grouped under seven of the major occupational categories (Standard Occupational Classifi cations, [SOC]) that BLS uses to collect and organize occupational data, based on common characteristics.52
Core occupations in the Unconventional energy supply chainSOC Occupation Median
annual wage, 2012
Typical education needed for entry
Work experience in related occupation
Typical on-the-job training (OJT) needed to attain competency
Management
11-3051 Industrial production managers $89,190 Bachelor’s degree > 5 years None
11-9021 Construction managers $82,790 Bachelor’s degree None Moderate-term
Architecture and Engineering
17-1022 Surveyors $56,230 Bachelor’s degree < 5 years None
17-2041 Chemical engineers $94,350 Bachelor’s degree None None
17-2081 Environmental engineers $80,890 Bachelor’s degree None None
17-2111 Health & safety engineers, except mining safety engineers & inspectors
$76,830 Bachelor’s degree None None
17-2141 Mechanical engineers $80,580 Bachelor’s degree None None
17-2151 Mining & geological engineers, including mining safety engineers
$84,320 Bachelor’s degree None None
17-2171 Petroleum engineers $130,280 Bachelor’s degree None None
17-3013 Mechanical drafters $50,360 Associate’s degree None None
17-3023 Electrical & electronics engineering technicians $57,850 Associate’s degree None None
17-3025 Environmental engineering technicians $45,350 Associate’s degree None None
17-3027 Mechanical engineering technicians $51,980 Associate’s degree None None
51 The Construction and Well Services sector can be subdivided into three major subsectors, each with signifi cant levels of employment—well services, construction of new nonresidential manufacturing structures and construction of other new nonresidential structures. Hence, there are a total of seven core sectors comprising multiple four-digit NAICS supply chain sectors for purposes of this analysis.
52 The occupational data used in this study is provided from the Occupational Employment Statistics (OES) program of the BLS, online at www.bls.gov/oes/. The OES program conducts a semiannual mail survey designed to produce estimates of employment and wages for specifi c occupations. The Standard Occupational Classifi cation (SOC) system is used by BLS and other Federal statistical agencies to classify workers and jobs into occupational categories for the purpose of collecting, calculating, analyzing, or disseminating data. The 2010 SOC system contains 840 detailed occupations, aggregated into 461 broad occupations. In turn, the SOC combines these 461 broad occupations into 97 minor groups and 23 major groups.
(continued)
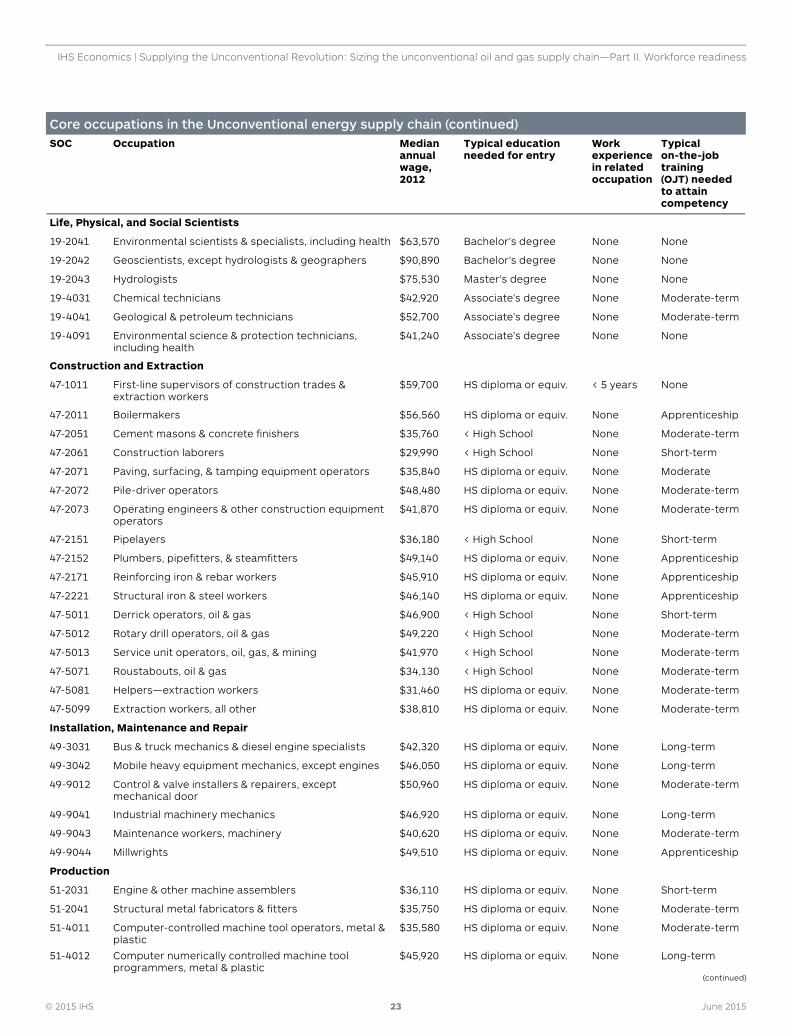
© 2015 IHS 23 June 2015
IHS Economics | Supplying the Unconventional Revolution: Sizing the unconventional oil and gas supply chain—Part II. Workforce readiness
Core occupations in the Unconventional energy supply chain (continued) SOC Occupation Median
annual wage, 2012
Typical education needed for entry
Work experience in related occupation
Typical on-the-job training (OJT) needed to attain competency
Life, Physical, and Social Scientists
19-2041 Environmental scientists & specialists, including health $63,570 Bachelor’s degree None None
19-2042 Geoscientists, except hydrologists & geographers $90,890 Bachelor’s degree None None
19-2043 Hydrologists $75,530 Master’s degree None None
19-4031 Chemical technicians $42,920 Associate’s degree None Moderate-term
19-4041 Geological & petroleum technicians $52,700 Associate’s degree None Moderate-term
19-4091 Environmental science & protection technicians, including health
$41,240 Associate’s degree None None
Construction and Extraction
47-1011 First-line supervisors of construction trades & extraction workers
$59,700 HS diploma or equiv. < 5 years None
47-2011 Boilermakers $56,560 HS diploma or equiv. None Apprenticeship
47-2051 Cement masons & concrete fi nishers $35,760 < High School None Moderate-term
47-2061 Construction laborers $29,990 < High School None Short-term
47-2071 Paving, surfacing, & tamping equipment operators $35,840 HS diploma or equiv. None Moderate
47-2072 Pile-driver operators $48,480 HS diploma or equiv. None Moderate-term
47-2073 Operating engineers & other construction equipment operators
$41,870 HS diploma or equiv. None Moderate-term
47-2151 Pipelayers $36,180 < High School None Short-term
47-2152 Plumbers, pipefi tters, & steamfi tters $49,140 HS diploma or equiv. None Apprenticeship
47-2171 Reinforcing iron & rebar workers $45,910 HS diploma or equiv. None Apprenticeship
47-2221 Structural iron & steel workers $46,140 HS diploma or equiv. None Apprenticeship
47-5011 Derrick operators, oil & gas $46,900 < High School None Short-term
47-5012 Rotary drill operators, oil & gas $49,220 < High School None Moderate-term
47-5013 Service unit operators, oil, gas, & mining $41,970 < High School None Moderate-term
47-5071 Roustabouts, oil & gas $34,130 < High School None Moderate-term
47-5081 Helpers—extraction workers $31,460 HS diploma or equiv. None Moderate-term
47-5099 Extraction workers, all other $38,810 HS diploma or equiv. None Moderate-term
Installation, Maintenance and Repair
49-3031 Bus & truck mechanics & diesel engine specialists $42,320 HS diploma or equiv. None Long-term
49-3042 Mobile heavy equipment mechanics, except engines $46,050 HS diploma or equiv. None Long-term
49-9012 Control & valve installers & repairers, except mechanical door
$50,960 HS diploma or equiv. None Moderate-term
49-9041 Industrial machinery mechanics $46,920 HS diploma or equiv. None Long-term
49-9043 Maintenance workers, machinery $40,620 HS diploma or equiv. None Moderate-term
49-9044 Millwrights $49,510 HS diploma or equiv. None Apprenticeship
Production
51-2031 Engine & other machine assemblers $36,110 HS diploma or equiv. None Short-term
51-2041 Structural metal fabricators & fi tters $35,750 HS diploma or equiv. None Moderate-term
51-4011 Computer-controlled machine tool operators, metal & plastic
$35,580 HS diploma or equiv. None Moderate-term
51-4012 Computer numerically controlled machine tool programmers, metal & plastic
$45,920 HS diploma or equiv. None Long-term
(continued)
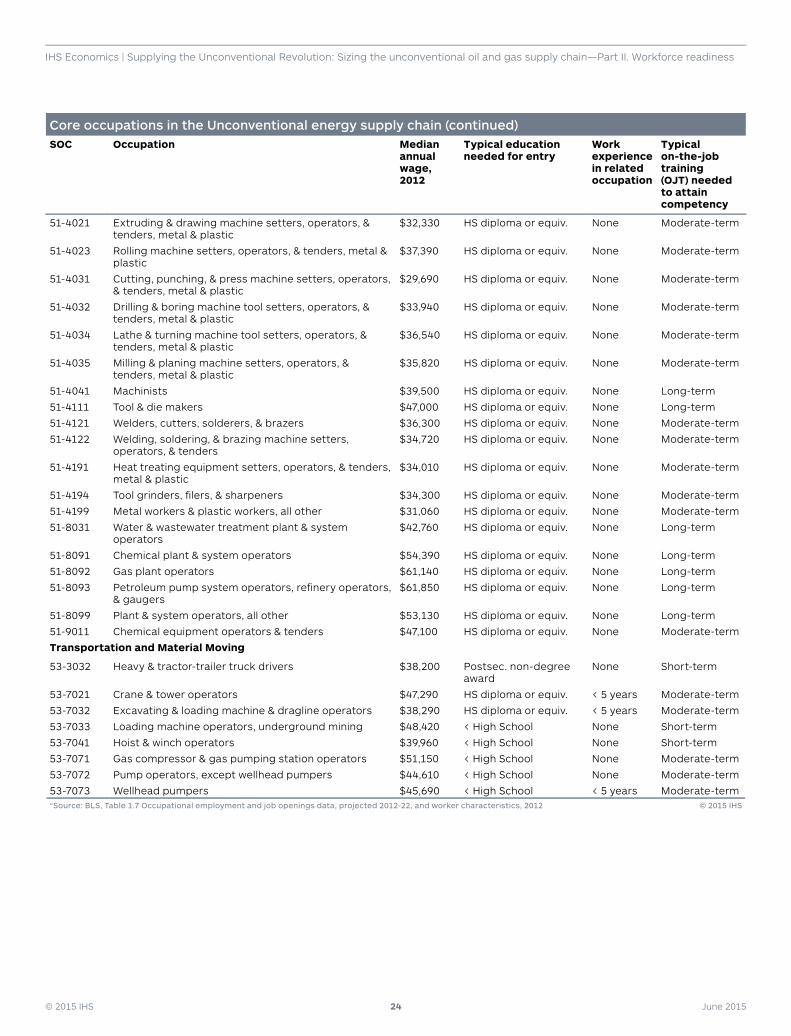
© 2015 IHS 24 June 2015
IHS Economics | Supplying the Unconventional Revolution: Sizing the unconventional oil and gas supply chain—Part II. Workforce readiness
Core occupations in the Unconventional energy supply chain (continued) SOC Occupation Median
annual wage, 2012
Typical education needed for entry
Work experience in related occupation
Typical on-the-job training (OJT) needed to attain competency
51-4021 Extruding & drawing machine setters, operators, & tenders, metal & plastic
$32,330 HS diploma or equiv. None Moderate-term
51-4023 Rolling machine setters, operators, & tenders, metal & plastic
$37,390 HS diploma or equiv. None Moderate-term
51-4031 Cutting, punching, & press machine setters, operators, & tenders, metal & plastic
$29,690 HS diploma or equiv. None Moderate-term
51-4032 Drilling & boring machine tool setters, operators, & tenders, metal & plastic
$33,940 HS diploma or equiv. None Moderate-term
51-4034 Lathe & turning machine tool setters, operators, & tenders, metal & plastic
$36,540 HS diploma or equiv. None Moderate-term
51-4035 Milling & planing machine setters, operators, & tenders, metal & plastic
$35,820 HS diploma or equiv. None Moderate-term
51-4041 Machinists $39,500 HS diploma or equiv. None Long-term
51-4111 Tool & die makers $47,000 HS diploma or equiv. None Long-term
51-4121 Welders, cutters, solderers, & brazers $36,300 HS diploma or equiv. None Moderate-term
51-4122 Welding, soldering, & brazing machine setters, operators, & tenders
$34,720 HS diploma or equiv. None Moderate-term
51-4191 Heat treating equipment setters, operators, & tenders, metal & plastic
$34,010 HS diploma or equiv. None Moderate-term
51-4194 Tool grinders, fi lers, & sharpeners $34,300 HS diploma or equiv. None Moderate-term
51-4199 Metal workers & plastic workers, all other $31,060 HS diploma or equiv. None Moderate-term
51-8031 Water & wastewater treatment plant & system operators
$42,760 HS diploma or equiv. None Long-term
51-8091 Chemical plant & system operators $54,390 HS diploma or equiv. None Long-term
51-8092 Gas plant operators $61,140 HS diploma or equiv. None Long-term
51-8093 Petroleum pump system operators, refi nery operators, & gaugers
$61,850 HS diploma or equiv. None Long-term
51-8099 Plant & system operators, all other $53,130 HS diploma or equiv. None Long-term
51-9011 Chemical equipment operators & tenders $47,100 HS diploma or equiv. None Moderate-term
Transportation and Material Moving
53-3032 Heavy & tractor-trailer truck drivers $38,200 Postsec. non-degree award
None Short-term
53-7021 Crane & tower operators $47,290 HS diploma or equiv. < 5 years Moderate-term
53-7032 Excavating & loading machine & dragline operators $38,290 HS diploma or equiv. < 5 years Moderate-term
53-7033 Loading machine operators, underground mining $48,420 < High School None Short-term
53-7041 Hoist & winch operators $39,960 < High School None Short-term
53-7071 Gas compressor & gas pumping station operators $51,150 < High School None Moderate-term
53-7072 Pump operators, except wellhead pumpers $44,610 < High School None Moderate-term
53-7073 Wellhead pumpers $45,690 < High School < 5 years Moderate-term“Source: BLS, Table 1.7 Occupational employment and job openings data, projected 2012-22, and worker characteristics, 2012 © 2015 IHS
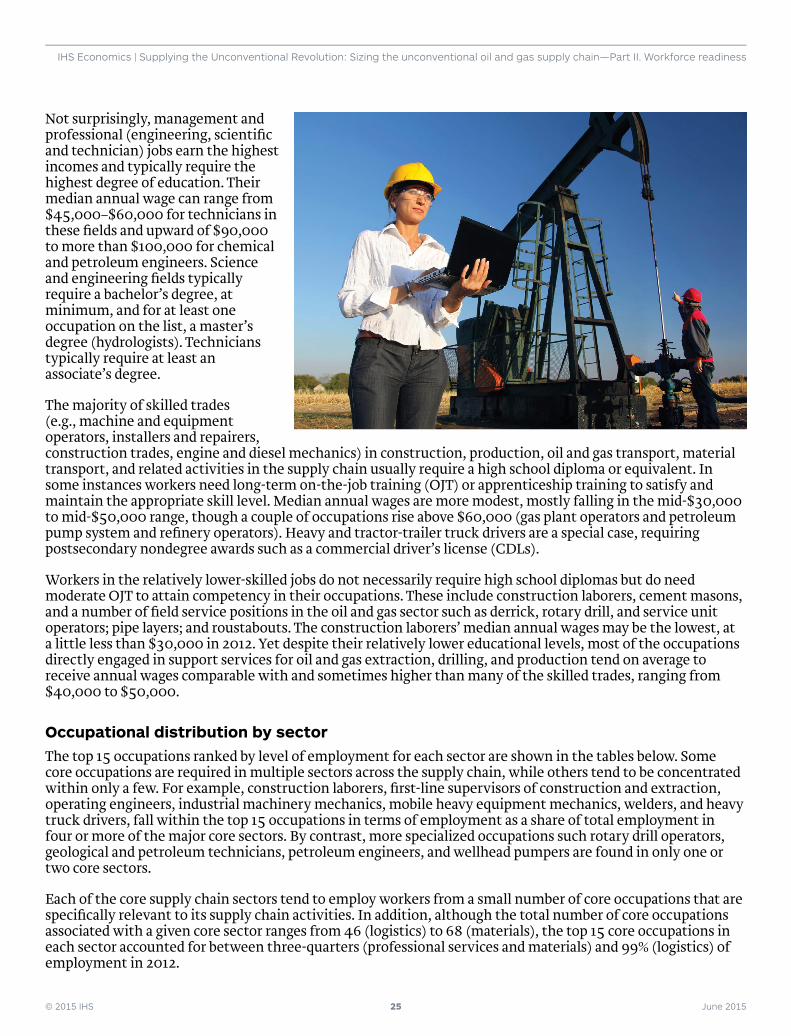
© 2015 IHS 25 June 2015
IHS Economics | Supplying the Unconventional Revolution: Sizing the unconventional oil and gas supply chain—Part II. Workforce readiness
Not surprisingly, management and professional (engineering, scientifi c and technician) jobs earn the highest incomes and typically require the highest degree of education. Their median annual wage can range from $45,000–$60,000 for technicians in these fi elds and upward of $90,000 to more than $100,000 for chemical and petroleum engineers. Science and engineering fi elds typically require a bachelor’s degree, at minimum, and for at least one occupation on the list, a master’s degree (hydrologists). Technicians typically require at least an associate’s degree.
The majority of skilled trades (e.g., machine and equipment operators, installers and repairers, construction trades, engine and diesel mechanics) in construction, production, oil and gas transport, material transport, and related activities in the supply chain usually require a high school diploma or equivalent. In some instances workers need long-term on-the-job training (OJT) or apprenticeship training to satisfy and maintain the appropriate skill level. Median annual wages are more modest, mostly falling in the mid-$30,000 to mid-$50,000 range, though a couple of occupations rise above $60,000 (gas plant operators and petroleum pump system and refi nery operators). Heavy and tractor-trailer truck drivers are a special case, requiring postsecondary nondegree awards such as a commercial driver’s license (CDLs).
Workers in the relatively lower-skilled jobs do not necessarily require high school diplomas but do need moderate OJT to attain competency in their occupations. These include construction laborers, cement masons, and a number of fi eld service positions in the oil and gas sector such as derrick, rotary drill, and service unit operators; pipe layers; and roustabouts. The construction laborers’ median annual wages may be the lowest, at a little less than $30,000 in 2012. Yet despite their relatively lower educational levels, most of the occupations directly engaged in support services for oil and gas extraction, drilling, and production tend on average to receive annual wages comparable with and sometimes higher than many of the skilled trades, ranging from $40,000 to $50,000.
Occupational distribution by sectorThe top 15 occupations ranked by level of employment for each sector are shown in the tables below. Some core occupations are required in multiple sectors across the supply chain, while others tend to be concentrated within only a few. For example, construction laborers, fi rst-line supervisors of construction and extraction, operating engineers, industrial machinery mechanics, mobile heavy equipment mechanics, welders, and heavy truck drivers, fall within the top 15 occupations in terms of employment as a share of total employment in four or more of the major core sectors. By contrast, more specialized occupations such rotary drill operators, geological and petroleum technicians, petroleum engineers, and wellhead pumpers are found in only one or two core sectors.
Each of the core supply chain sectors tend to employ workers from a small number of core occupations that are specifi cally relevant to its supply chain activities. In addition, although the total number of core occupations associated with a given core sector ranges from 46 (logistics) to 68 (materials), the top 15 core occupations in each sector accounted for between three-quarters (professional services and materials) and 99% (logistics) of employment in 2012.
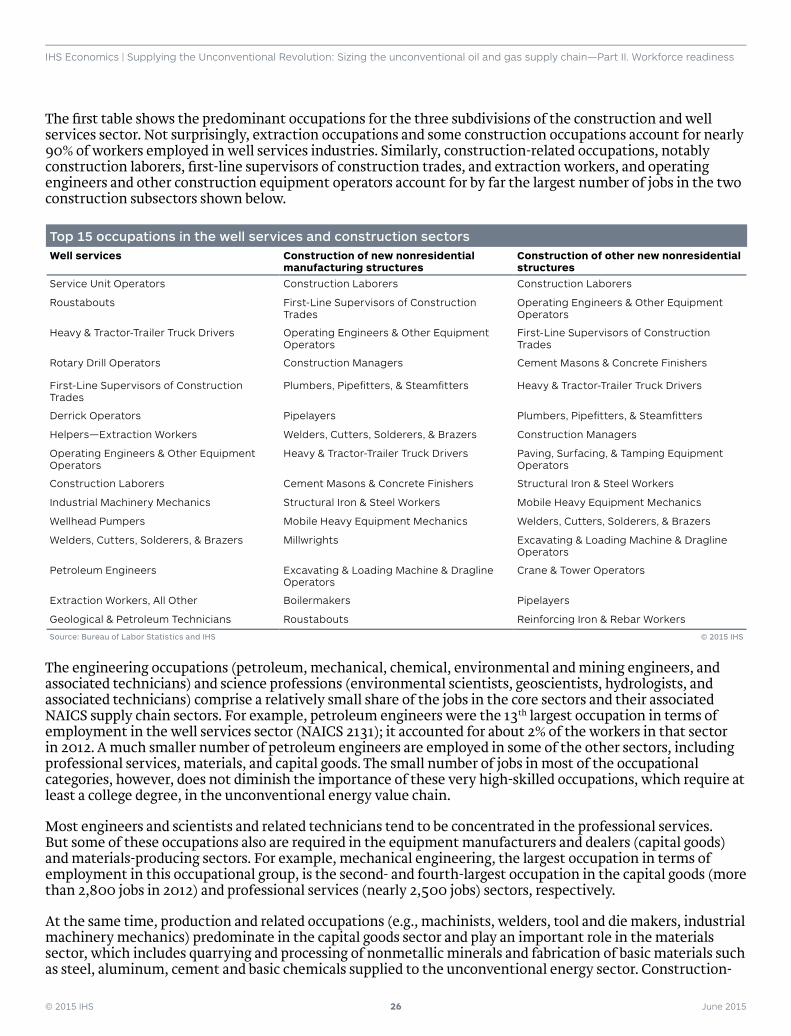
© 2015 IHS 26 June 2015
IHS Economics | Supplying the Unconventional Revolution: Sizing the unconventional oil and gas supply chain—Part II. Workforce readiness
The fi rst table shows the predominant occupations for the three subdivisions of the construction and well services sector. Not surprisingly, extraction occupations and some construction occupations account for nearly 90% of workers employed in well services industries. Similarly, construction-related occupations, notably construction laborers, fi rst-line supervisors of construction trades, and extraction workers, and operating engineers and other construction equipment operators account for by far the largest number of jobs in the two construction subsectors shown below.
Top 15 occupations in the well services and construction sectorsWell services Construction of new nonresidential
manufacturing structuresConstruction of other new nonresidential structures
Service Unit Operators Construction Laborers Construction Laborers
Roustabouts First-Line Supervisors of Construction Trades
Operating Engineers & Other Equipment Operators
Heavy & Tractor-Trailer Truck Drivers Operating Engineers & Other Equipment Operators
First-Line Supervisors of Construction Trades
Rotary Drill Operators Construction Managers Cement Masons & Concrete Finishers
First-Line Supervisors of Construction Trades
Plumbers, Pipefi tters, & Steamfi tters Heavy & Tractor-Trailer Truck Drivers
Derrick Operators Pipelayers Plumbers, Pipefi tters, & Steamfi tters
Helpers—Extraction Workers Welders, Cutters, Solderers, & Brazers Construction Managers
Operating Engineers & Other Equipment Operators
Heavy & Tractor-Trailer Truck Drivers Paving, Surfacing, & Tamping Equipment Operators
Construction Laborers Cement Masons & Concrete Finishers Structural Iron & Steel Workers
Industrial Machinery Mechanics Structural Iron & Steel Workers Mobile Heavy Equipment Mechanics
Wellhead Pumpers Mobile Heavy Equipment Mechanics Welders, Cutters, Solderers, & Brazers
Welders, Cutters, Solderers, & Brazers Millwrights Excavating & Loading Machine & Dragline Operators
Petroleum Engineers Excavating & Loading Machine & Dragline Operators
Crane & Tower Operators
Extraction Workers, All Other Boilermakers Pipelayers
Geological & Petroleum Technicians Roustabouts Reinforcing Iron & Rebar Workers
Source: Bureau of Labor Statistics and IHS © 2015 IHS
The engineering occupations (petroleum, mechanical, chemical, environmental and mining engineers, and associated technicians) and science professions (environmental scientists, geoscientists, hydrologists, and associated technicians) comprise a relatively small share of the jobs in the core sectors and their associated NAICS supply chain sectors. For example, petroleum engineers were the 13th largest occupation in terms of employment in the well services sector (NAICS 2131); it accounted for about 2% of the workers in that sector in 2012. A much smaller number of petroleum engineers are employed in some of the other sectors, including professional services, materials, and capital goods. The small number of jobs in most of the occupational categories, however, does not diminish the importance of these very high-skilled occupations, which require at least a college degree, in the unconventional energy value chain.
Most engineers and scientists and related technicians tend to be concentrated in the professional services. But some of these occupations also are required in the equipment manufacturers and dealers (capital goods) and materials-producing sectors. For example, mechanical engineering, the largest occupation in terms of employment in this occupational group, is the second- and fourth-largest occupation in the capital goods (more than 2,800 jobs in 2012) and professional services (nearly 2,500 jobs) sectors, respectively.
At the same time, production and related occupations (e.g., machinists, welders, tool and die makers, industrial machinery mechanics) predominate in the capital goods sector and play an important role in the materials sector, which includes quarrying and processing of nonmetallic minerals and fabrication of basic materials such as steel, aluminum, cement and basic chemicals supplied to the unconventional energy sector. Construction-
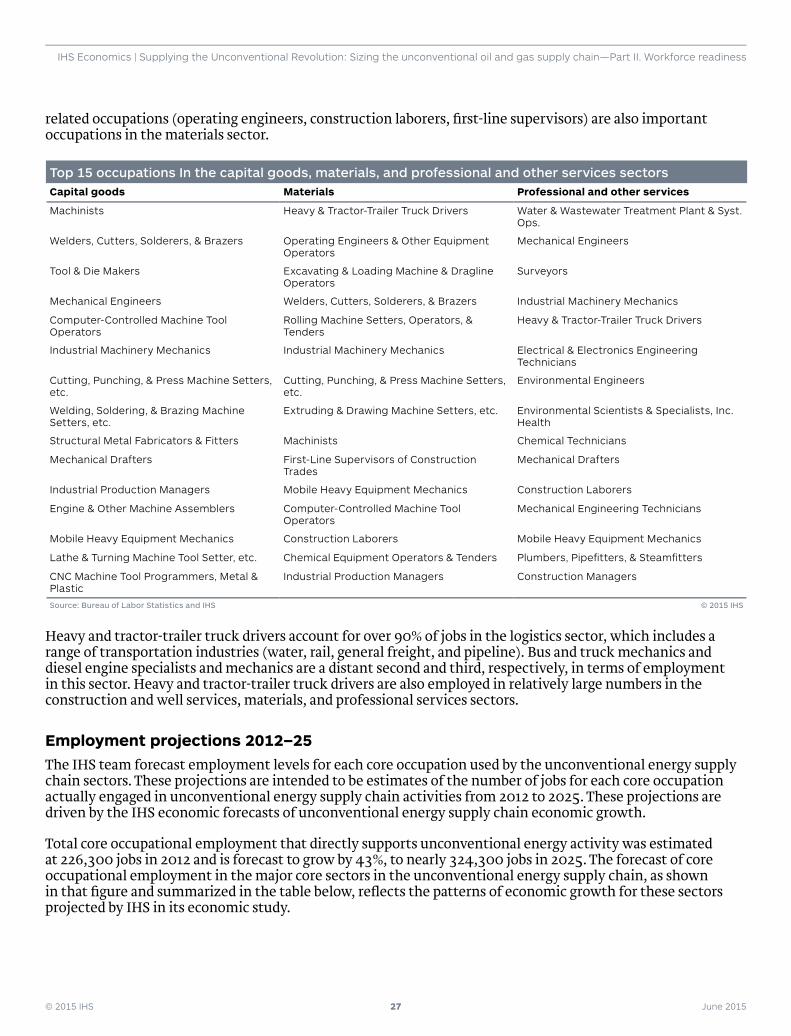
© 2015 IHS 27 June 2015
IHS Economics | Supplying the Unconventional Revolution: Sizing the unconventional oil and gas supply chain—Part II. Workforce readiness
related occupations (operating engineers, construction laborers, fi rst-line supervisors) are also important occupations in the materials sector.
Top 15 occupations In the capital goods, materials, and professional and other services sectorsCapital goods Materials Professional and other services
Machinists Heavy & Tractor-Trailer Truck Drivers Water & Wastewater Treatment Plant & Syst. Ops.
Welders, Cutters, Solderers, & Brazers Operating Engineers & Other Equipment Operators
Mechanical Engineers
Tool & Die Makers Excavating & Loading Machine & Dragline Operators
Surveyors
Mechanical Engineers Welders, Cutters, Solderers, & Brazers Industrial Machinery Mechanics
Computer-Controlled Machine Tool Operators
Rolling Machine Setters, Operators, & Tenders
Heavy & Tractor-Trailer Truck Drivers
Industrial Machinery Mechanics Industrial Machinery Mechanics Electrical & Electronics Engineering Technicians
Cutting, Punching, & Press Machine Setters, etc.
Cutting, Punching, & Press Machine Setters, etc.
Environmental Engineers
Welding, Soldering, & Brazing Machine Setters, etc.
Extruding & Drawing Machine Setters, etc. Environmental Scientists & Specialists, Inc. Health
Structural Metal Fabricators & Fitters Machinists Chemical Technicians
Mechanical Drafters First-Line Supervisors of Construction Trades
Mechanical Drafters
Industrial Production Managers Mobile Heavy Equipment Mechanics Construction Laborers
Engine & Other Machine Assemblers Computer-Controlled Machine Tool Operators
Mechanical Engineering Technicians
Mobile Heavy Equipment Mechanics Construction Laborers Mobile Heavy Equipment Mechanics
Lathe & Turning Machine Tool Setter, etc. Chemical Equipment Operators & Tenders Plumbers, Pipefi tters, & Steamfi tters
CNC Machine Tool Programmers, Metal & Plastic
Industrial Production Managers Construction Managers
Source: Bureau of Labor Statistics and IHS © 2015 IHS
Heavy and tractor-trailer truck drivers account for over 90% of jobs in the logistics sector, which includes a range of transportation industries (water, rail, general freight, and pipeline). Bus and truck mechanics and diesel engine specialists and mechanics are a distant second and third, respectively, in terms of employment in this sector. Heavy and tractor-trailer truck drivers are also employed in relatively large numbers in the construction and well services, materials, and professional services sectors.
Employment projections 2012–25The IHS team forecast employment levels for each core occupation used by the unconventional energy supply chain sectors. These projections are intended to be estimates of the number of jobs for each core occupation actually engaged in unconventional energy supply chain activities from 2012 to 2025. These projections are driven by the IHS economic forecasts of unconventional energy supply chain economic growth.
Total core occupational employment that directly supports unconventional energy activity was estimated at 226,300 jobs in 2012 and is forecast to grow by 43%, to nearly 324,300 jobs in 2025. The forecast of core occupational employment in the major core sectors in the unconventional energy supply chain, as shown in that fi gure and summarized in the table below, refl ects the patterns of economic growth for these sectors projected by IHS in its economic study.
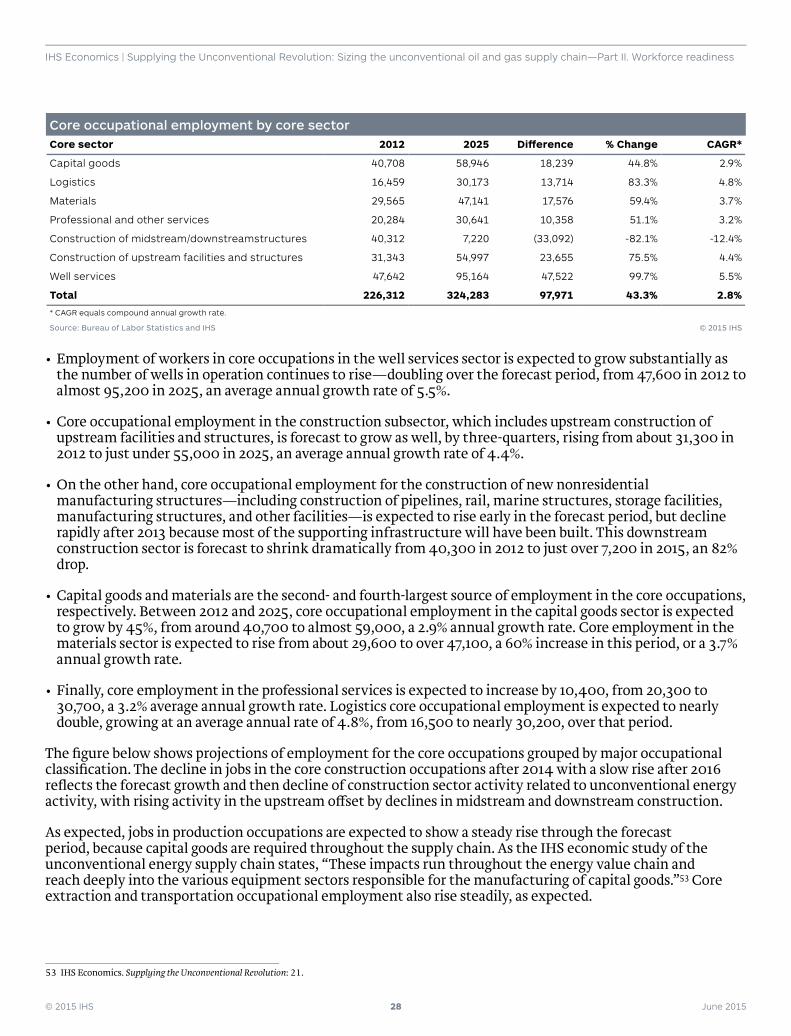
© 2015 IHS 28 June 2015
IHS Economics | Supplying the Unconventional Revolution: Sizing the unconventional oil and gas supply chain—Part II. Workforce readiness
Core occupational employment by core sectorCore sector 2012 2025 Di� erence % Change CAGR*
Capital goods 40,708 58,946 18,239 44.8% 2.9%
Logistics 16,459 30,173 13,714 83.3% 4.8%
Materials 29,565 47,141 17,576 59.4% 3.7%
Professional and other services 20,284 30,641 10,358 51.1% 3.2%
Construction of midstream/downstreamstructures 40,312 7,220 (33,092) -82.1% -12.4%
Construction of upstream facilities and structures 31,343 54,997 23,655 75.5% 4.4%
Well services 47,642 95,164 47,522 99.7% 5.5%
Total 226,312 324,283 97,971 43.3% 2.8%
* CAGR equals compound annual growth rate.
Source: Bureau of Labor Statistics and IHS © 2015 IHS
• Employment of workers in core occupations in the well services sector is expected to grow substantially as the number of wells in operation continues to rise—doubling over the forecast period, from 47,600 in 2012 to almost 95,200 in 2025, an average annual growth rate of 5.5%.
• Core occupational employment in the construction subsector, which includes upstream construction of upstream facilities and structures, is forecast to grow as well, by three-quarters, rising from about 31,300 in 2012 to just under 55,000 in 2025, an average annual growth rate of 4.4%.
• On the other hand, core occupational employment for the construction of new nonresidential manufacturing structures—including construction of pipelines, rail, marine structures, storage facilities, manufacturing structures, and other facilities—is expected to rise early in the forecast period, but decline rapidly after 2013 because most of the supporting infrastructure will have been built. This downstream construction sector is forecast to shrink dramatically from 40,300 in 2012 to just over 7,200 in 2015, an 82% drop.
• Capital goods and materials are the second- and fourth-largest source of employment in the core occupations, respectively. Between 2012 and 2025, core occupational employment in the capital goods sector is expected to grow by 45%, from around 40,700 to almost 59,000, a 2.9% annual growth rate. Core employment in the materials sector is expected to rise from about 29,600 to over 47,100, a 60% increase in this period, or a 3.7% annual growth rate.
• Finally, core employment in the professional services is expected to increase by 10,400, from 20,300 to 30,700, a 3.2% average annual growth rate. Logistics core occupational employment is expected to nearly double, growing at an average annual rate of 4.8%, from 16,500 to nearly 30,200, over that period.
The fi gure below shows projections of employment for the core occupations grouped by major occupational classifi cation. The decline in jobs in the core construction occupations after 2014 with a slow rise after 2016 refl ects the forecast growth and then decline of construction sector activity related to unconventional energy activity, with rising activity in the upstream o� set by declines in midstream and downstream construction.
As expected, jobs in production occupations are expected to show a steady rise through the forecast period, because capital goods are required throughout the supply chain. As the IHS economic study of the unconventional energy supply chain states, “These impacts run throughout the energy value chain and reach deeply into the various equipment sectors responsible for the manufacturing of capital goods.”53 Core extraction and transportation occupational employment also rise steadily, as expected.
53 IHS Economics. Supplying the Unconventional Revolution: 21.
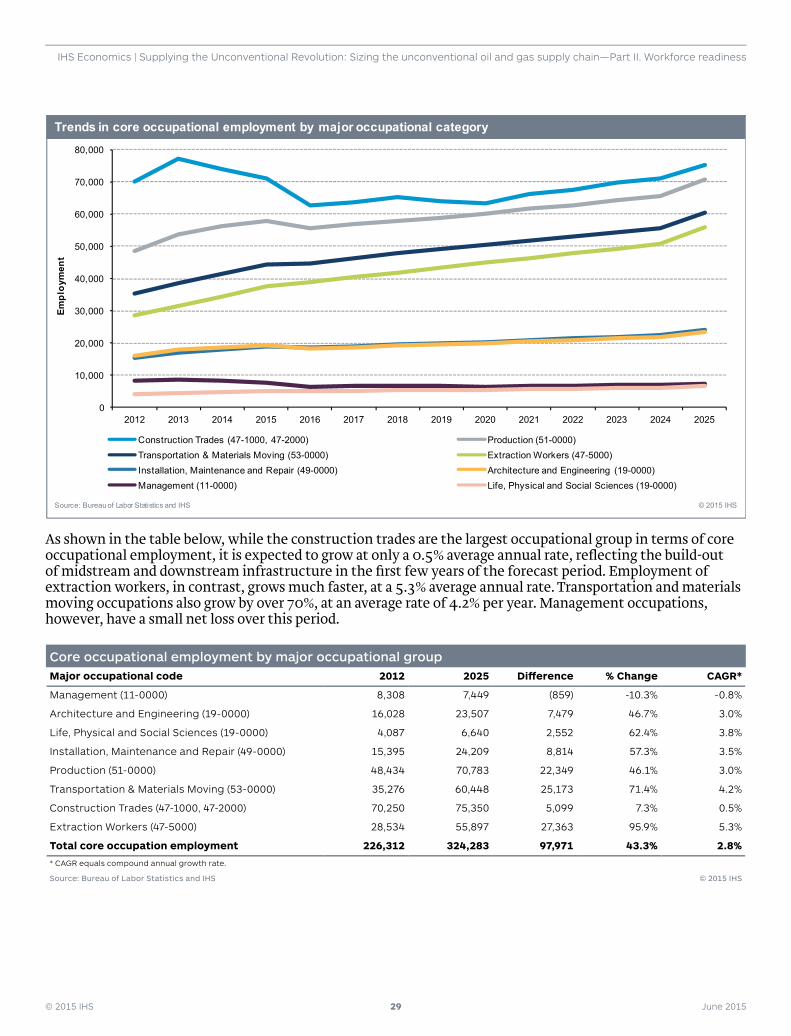
© 2015 IHS 29 June 2015
IHS Economics | Supplying the Unconventional Revolution: Sizing the unconventional oil and gas supply chain—Part II. Workforce readiness
As shown in the table below, while the construction trades are the largest occupational group in terms of core occupational employment, it is expected to grow at only a 0.5% average annual rate, refl ecting the build-out of midstream and downstream infrastructure in the fi rst few years of the forecast period. Employment of extraction workers, in contrast, grows much faster, at a 5.3% average annual rate. Transportation and materials moving occupations also grow by over 70%, at an average rate of 4.2% per year. Management occupations, however, have a small net loss over this period.
Core occupational employment by major occupational groupMajor occupational code 2012 2025 Di� erence % Change CAGR*
Management (11-0000) 8,308 7,449 (859) -10.3% -0.8%
Architecture and Engineering (19-0000) 16,028 23,507 7,479 46.7% 3.0%
Life, Physical and Social Sciences (19-0000) 4,087 6,640 2,552 62.4% 3.8%
Installation, Maintenance and Repair (49-0000) 15,395 24,209 8,814 57.3% 3.5%
Production (51-0000) 48,434 70,783 22,349 46.1% 3.0%
Transportation & Materials Moving (53-0000) 35,276 60,448 25,173 71.4% 4.2%
Construction Trades (47-1000, 47-2000) 70,250 75,350 5,099 7.3% 0.5%
Extraction Workers (47-5000) 28,534 55,897 27,363 95.9% 5.3%
Total core occupation employment 226,312 324,283 97,971 43.3% 2.8%
* CAGR equals compound annual growth rate.
Source: Bureau of Labor Statistics and IHS © 2015 IHS
0
10,000
20,000
30,000
40,000
50,000
60,000
70,000
80,000
2012 2013 2014 2015 2016 2017 2018 2019 2020 2021 2022 2023 2024 2025
Construction Trades (47-1000, 47-2000) Production (51-0000)Transportation & Materials Moving (53-0000) Extraction Workers (47-5000)Installation, Maintenance and Repair (49-0000) Architecture and Engineering (19-0000)Management (11-0000) Life, Physical and Social Sciences (19-0000)
Trends in core occupational employment by major occupational category
© 2015 IHS
Empl
oym
ent
Source: Bureau of Labor Statistics and IHS
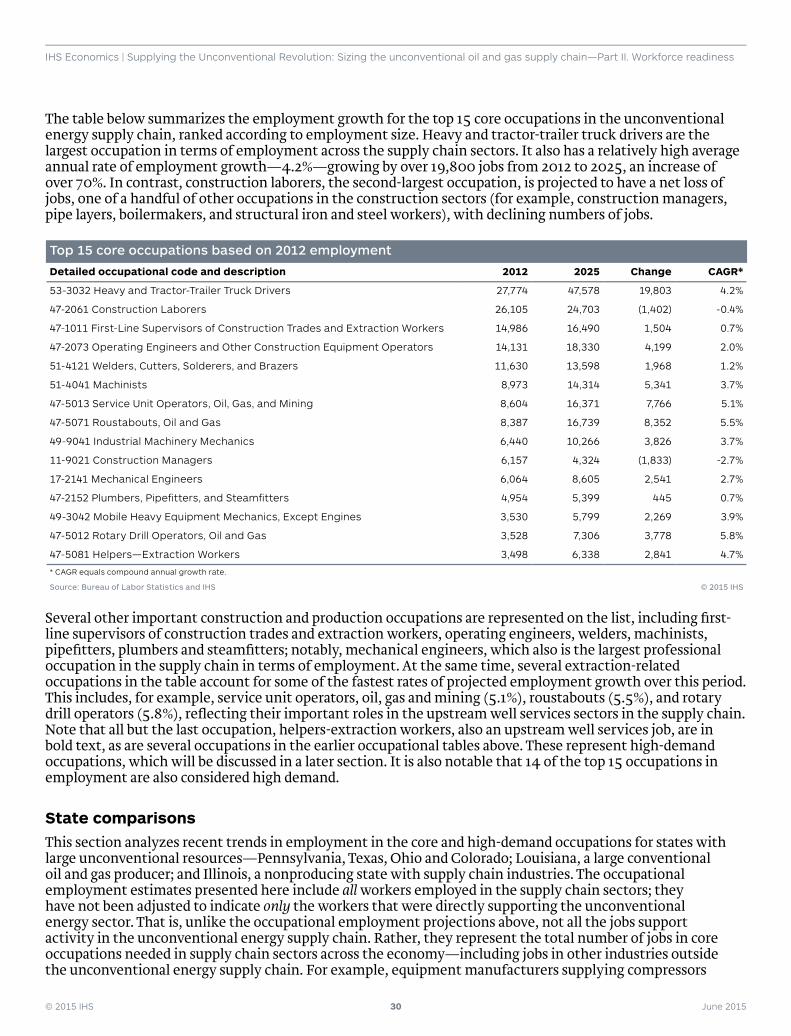
© 2015 IHS 30 June 2015
IHS Economics | Supplying the Unconventional Revolution: Sizing the unconventional oil and gas supply chain—Part II. Workforce readiness
The table below summarizes the employment growth for the top 15 core occupations in the unconventional energy supply chain, ranked according to employment size. Heavy and tractor-trailer truck drivers are the largest occupation in terms of employment across the supply chain sectors. It also has a relatively high average annual rate of employment growth—4.2%—growing by over 19,800 jobs from 2012 to 2025, an increase of over 70%. In contrast, construction laborers, the second-largest occupation, is projected to have a net loss of jobs, one of a handful of other occupations in the construction sectors (for example, construction managers, pipe layers, boilermakers, and structural iron and steel workers), with declining numbers of jobs.
Top 15 core occupations based on 2012 employment
Detailed occupational code and description 2012 2025 Change CAGR*
53-3032 Heavy and Tractor-Trailer Truck Drivers 27,774 47,578 19,803 4.2%
47-2061 Construction Laborers 26,105 24,703 (1,402) -0.4%
47-1011 First-Line Supervisors of Construction Trades and Extraction Workers 14,986 16,490 1,504 0.7%
47-2073 Operating Engineers and Other Construction Equipment Operators 14,131 18,330 4,199 2.0%
51-4121 Welders, Cutters, Solderers, and Brazers 11,630 13,598 1,968 1.2%
51-4041 Machinists 8,973 14,314 5,341 3.7%
47-5013 Service Unit Operators, Oil, Gas, and Mining 8,604 16,371 7,766 5.1%
47-5071 Roustabouts, Oil and Gas 8,387 16,739 8,352 5.5%
49-9041 Industrial Machinery Mechanics 6,440 10,266 3,826 3.7%
11-9021 Construction Managers 6,157 4,324 (1,833) -2.7%
17-2141 Mechanical Engineers 6,064 8,605 2,541 2.7%
47-2152 Plumbers, Pipefi tters, and Steamfi tters 4,954 5,399 445 0.7%
49-3042 Mobile Heavy Equipment Mechanics, Except Engines 3,530 5,799 2,269 3.9%
47-5012 Rotary Drill Operators, Oil and Gas 3,528 7,306 3,778 5.8%
47-5081 Helpers—Extraction Workers 3,498 6,338 2,841 4.7%
* CAGR equals compound annual growth rate.
Source: Bureau of Labor Statistics and IHS © 2015 IHS
Several other important construction and production occupations are represented on the list, including fi rst-line supervisors of construction trades and extraction workers, operating engineers, welders, machinists, pipefi tters, plumbers and steamfi tters; notably, mechanical engineers, which also is the largest professional occupation in the supply chain in terms of employment. At the same time, several extraction-related occupations in the table account for some of the fastest rates of projected employment growth over this period. This includes, for example, service unit operators, oil, gas and mining (5.1%), roustabouts (5.5%), and rotary drill operators (5.8%), refl ecting their important roles in the upstream well services sectors in the supply chain. Note that all but the last occupation, helpers-extraction workers, also an upstream well services job, are in bold text, as are several occupations in the earlier occupational tables above. These represent high-demand occupations, which will be discussed in a later section. It is also notable that 14 of the top 15 occupations in employment are also considered high demand.
State comparisonsThis section analyzes recent trends in employment in the core and high-demand occupations for states with large unconventional resources—Pennsylvania, Texas, Ohio and Colorado; Louisiana, a large conventional oil and gas producer; and Illinois, a nonproducing state with supply chain industries. The occupational employment estimates presented here include all workers employed in the supply chain sectors; they have not been adjusted to indicate only the workers that were directly supporting the unconventional energy sector. That is, unlike the occupational employment projections above, not all the jobs support activity in the unconventional energy supply chain. Rather, they represent the total number of jobs in core occupations needed in supply chain sectors across the economy—including jobs in other industries outside the unconventional energy supply chain. For example, equipment manufacturers supplying compressors
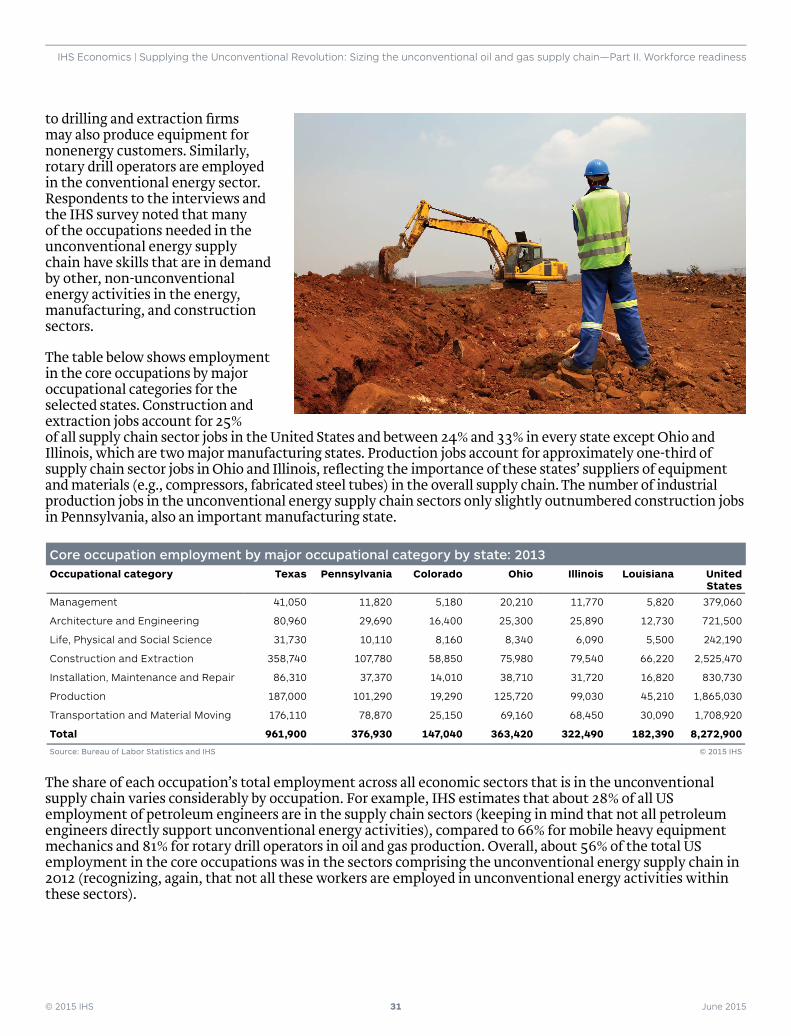
© 2015 IHS 31 June 2015
IHS Economics | Supplying the Unconventional Revolution: Sizing the unconventional oil and gas supply chain—Part II. Workforce readiness
to drilling and extraction fi rms may also produce equipment for nonenergy customers. Similarly, rotary drill operators are employed in the conventional energy sector. Respondents to the interviews and the IHS survey noted that many of the occupations needed in the unconventional energy supply chain have skills that are in demand by other, non-unconventional energy activities in the energy, manufacturing, and construction sectors.
The table below shows employment in the core occupations by major occupational categories for the selected states. Construction and extraction jobs account for 25% of all supply chain sector jobs in the United States and between 24% and 33% in every state except Ohio and Illinois, which are two major manufacturing states. Production jobs account for approximately one-third of supply chain sector jobs in Ohio and Illinois, refl ecting the importance of these states’ suppliers of equipment and materials (e.g., compressors, fabricated steel tubes) in the overall supply chain. The number of industrial production jobs in the unconventional energy supply chain sectors only slightly outnumbered construction jobs in Pennsylvania, also an important manufacturing state.
Core occupation employment by major occupational category by state: 2013Occupational category Texas Pennsylvania Colorado Ohio Illinois Louisiana United
States
Management 41,050 11,820 5,180 20,210 11,770 5,820 379,060
Architecture and Engineering 80,960 29,690 16,400 25,300 25,890 12,730 721,500
Life, Physical and Social Science 31,730 10,110 8,160 8,340 6,090 5,500 242,190
Construction and Extraction 358,740 107,780 58,850 75,980 79,540 66,220 2,525,470
Installation, Maintenance and Repair 86,310 37,370 14,010 38,710 31,720 16,820 830,730
Production 187,000 101,290 19,290 125,720 99,030 45,210 1,865,030
Transportation and Material Moving 176,110 78,870 25,150 69,160 68,450 30,090 1,708,920
Total 961,900 376,930 147,040 363,420 322,490 182,390 8,272,900
Source: Bureau of Labor Statistics and IHS © 2015 IHS
The share of each occupation’s total employment across all economic sectors that is in the unconventional supply chain varies considerably by occupation. For example, IHS estimates that about 28% of all US employment of petroleum engineers are in the supply chain sectors (keeping in mind that not all petroleum engineers directly support unconventional energy activities), compared to 66% for mobile heavy equipment mechanics and 81% for rotary drill operators in oil and gas production. Overall, about 56% of the total US employment in the core occupations was in the sectors comprising the unconventional energy supply chain in 2012 (recognizing, again, that not all these workers are employed in unconventional energy activities within these sectors).
© 2015 IHS 32 June 2015
IHS Economics | Supplying the Unconventional Revolution: Sizing the unconventional oil and gas supply chain—Part II. Workforce readiness
The employment levels of core occupations, and corresponding shares of total employment, vary across the states refl ecting both their industrial composition and scale of the unconventional energy activities. For example, production occupations’ shares of total supply chain sector employment in Pennsylvania, Illinois, and Ohio are larger than those of the other states, refl ecting the relatively larger manufacturing sectors of these industrial heartland states. Construction and extraction employment in the unconventional energy supply chain sectors is relatively higher in Texas, Louisiana, and Colorado, refl ecting in part the more extensive oil and gas production in those states, including unconventional oil and gas production.
State occupational employment trendsAlthough the absolute employment numbers for supply chain core occupations need to be interpreted with some caution, comparing employment trends for the core occupations across the selected states is instructive. The growth of unconventional production in states with large plays has added jobs in core occupations in supply chain sectors, and this growth has contributed to job growth in these sectors overall and to state economies as well. This point is illustrated in the fi gure below, which compares the employment index trends (i.e., employment levels over a time period are indexed to the employment level of a base year, in this instance, 2007) for six states and the United States.
The impact of the Great Recession on employment levels for 2008–10 is clearly evident in the sharp dip in employment in the core occupations over this period in all states. This is hardly surprising, as construction and production, which account for 53% of employment in the core occupations, were the two major occupational categories that su� ered among the most dramatic losses in the recession.
Of particular interest are the growth rates in employment in core occupations in Texas, Louisiana, and Pennsylvania as the economy rebounded. Exploration and production activity in the large plays in these states was a driver of growth in the core occupations. Employment in the core occupations in Louisiana and Texas has come very close to equaling if not surpassing the prerecession peak—the 2007 base year employment level in the following fi gure.
In Ohio, one of the largest manufacturing states in the nation, the manufacturing and construction sectors were hit especially hard by the recession. However, employment in the core occupations, which fell steeply between 2007 and 2010, started a gradual rise in 2011, although the employment level for the core occupations has not yet returned to its prerecession level. Nonetheless, demand for goods and services driven by upstream and midstream capital investment in the Marcellus and Utica shale plays has helped to fuel this trend as development of Ohio’s energy complex expands.
Colorado has been showing a similar rebound in its core occupational jobs, but only over the past two years. However, these jobs could rebound faster and surpass 2007 employment levels over the next few years if the oil and gas industry is allowed to fully develop the Niobrara and other unconventional plays in the state.
The outlier is Illinois, also a manufacturing state that su� ered signifi cant job losses over the last recession. While Illinois is classifi ed as a nonproducing state, Illinois’s employment trends indicate a steady downturn in construction occupations, and stagnant growth in production and transportation and material movement occupations, with relative growth only in the installation and repair jobs. Sharp growth appears only in the combined management and professional occupations in the supply chain.
Job growth among Illinois equipment and goods suppliers to the unconventional energy sector is overshadowed by the larger economic trends in the state. Illinois is the only one of the six states where employment in the core occupations has declined since 2011, suggesting that the aftere� ects of the Great Recession still linger, and the partial o� set to the decline in manufacturing employment is a function of unconventional oil and gas development.
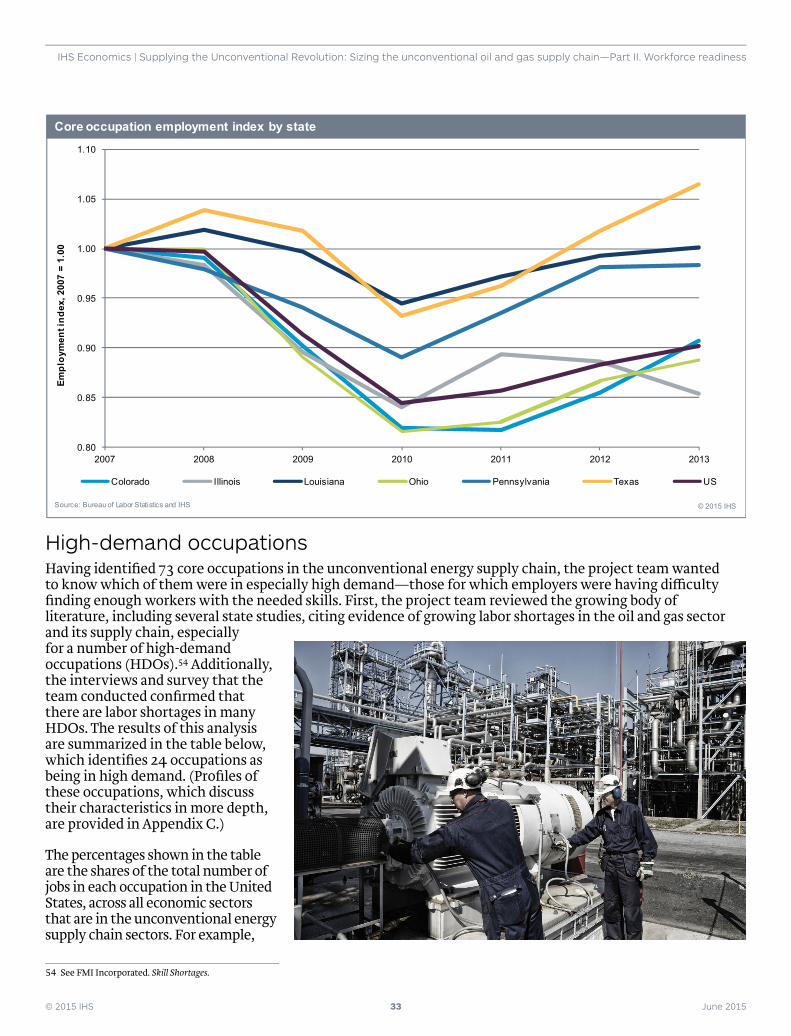
© 2015 IHS 33 June 2015
IHS Economics | Supplying the Unconventional Revolution: Sizing the unconventional oil and gas supply chain—Part II. Workforce readiness
High-demand occupationsHaving identifi ed 73 core occupations in the unconventional energy supply chain, the project team wanted to know which of them were in especially high demand—those for which employers were having di� culty fi nding enough workers with the needed skills. First, the project team reviewed the growing body of literature, including several state studies, citing evidence of growing labor shortages in the oil and gas sector and its supply chain, especially for a number of high-demand occupations (HDOs).54 Additionally, the interviews and survey that the team conducted confi rmed that there are labor shortages in many HDOs. The results of this analysis are summarized in the table below, which identifi es 24 occupations as being in high demand. (Profi les of these occupations, which discuss their characteristics in more depth, are provided in Appendix C.)
The percentages shown in the table are the shares of the total number of jobs in each occupation in the United States, across all economic sectors that are in the unconventional energy supply chain sectors. For example,
54 See FMI Incorporated. Skill Shortages.
0.80
0.85
0.90
0.95
1.00
1.05
1.10
2007 2008 2009 2010 2011 2012 2013
Colorado Illinois Louisiana Ohio Pennsylvania Texas US
Core occupation employment index by state
© 2015 IHS
Empl
oym
ent i
ndex
,200
7 =
1.00
Source: Bureau of Labor Statistics and IHS
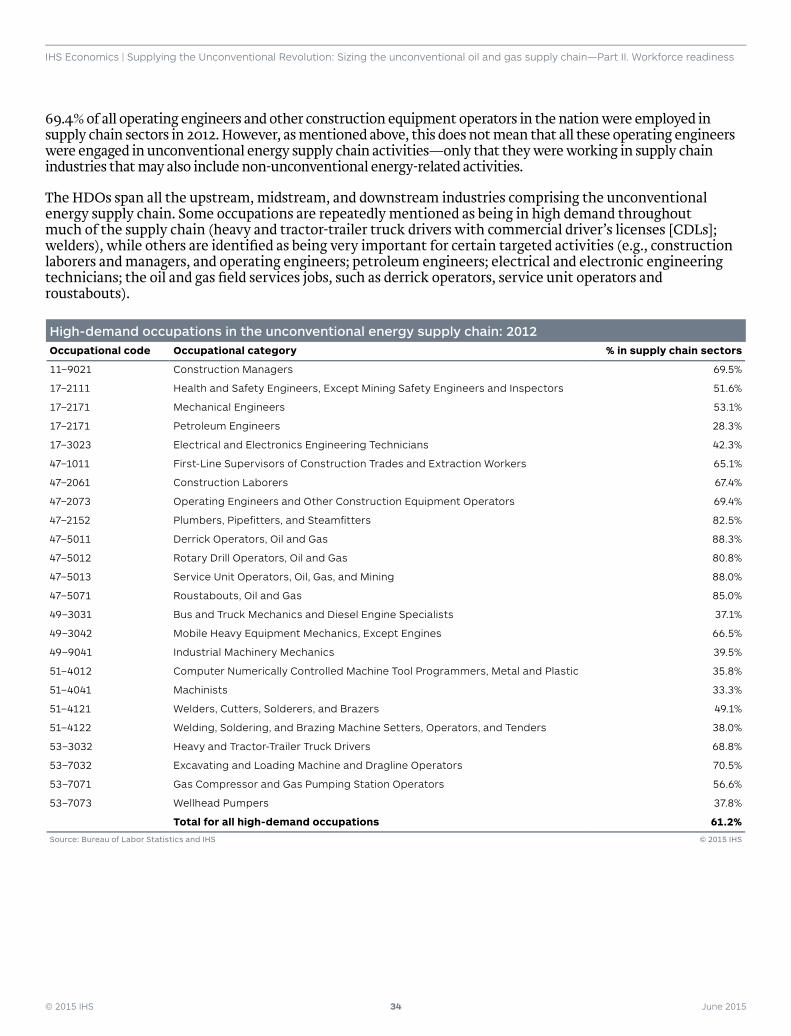
© 2015 IHS 34 June 2015
IHS Economics | Supplying the Unconventional Revolution: Sizing the unconventional oil and gas supply chain—Part II. Workforce readiness
69.4% of all operating engineers and other construction equipment operators in the nation were employed in supply chain sectors in 2012. However, as mentioned above, this does not mean that all these operating engineers were engaged in unconventional energy supply chain activities—only that they were working in supply chain industries that may also include non-unconventional energy-related activities.
The HDOs span all the upstream, midstream, and downstream industries comprising the unconventional energy supply chain. Some occupations are repeatedly mentioned as being in high demand throughout much of the supply chain (heavy and tractor-trailer truck drivers with commercial driver’s licenses [CDLs]; welders), while others are identifi ed as being very important for certain targeted activities (e.g., construction laborers and managers, and operating engineers; petroleum engineers; electrical and electronic engineering technicians; the oil and gas fi eld services jobs, such as derrick operators, service unit operators and roustabouts).
High-demand occupations in the unconventional energy supply chain: 2012 Occupational code Occupational category % in supply chain sectors
11–9021 Construction Managers 69.5%
17–2111 Health and Safety Engineers, Except Mining Safety Engineers and Inspectors 51.6%
17–2171 Mechanical Engineers 53.1%
17–2171 Petroleum Engineers 28.3%
17–3023 Electrical and Electronics Engineering Technicians 42.3%
47–1011 First-Line Supervisors of Construction Trades and Extraction Workers 65.1%
47–2061 Construction Laborers 67.4%
47–2073 Operating Engineers and Other Construction Equipment Operators 69.4%
47–2152 Plumbers, Pipefi tters, and Steamfi tters 82.5%
47–5011 Derrick Operators, Oil and Gas 88.3%
47–5012 Rotary Drill Operators, Oil and Gas 80.8%
47–5013 Service Unit Operators, Oil, Gas, and Mining 88.0%
47–5071 Roustabouts, Oil and Gas 85.0%
49–3031 Bus and Truck Mechanics and Diesel Engine Specialists 37.1%
49–3042 Mobile Heavy Equipment Mechanics, Except Engines 66.5%
49–9041 Industrial Machinery Mechanics 39.5%
51–4012 Computer Numerically Controlled Machine Tool Programmers, Metal and Plastic 35.8%
51–4041 Machinists 33.3%
51–4121 Welders, Cutters, Solderers, and Brazers 49.1%
51–4122 Welding, Soldering, and Brazing Machine Setters, Operators, and Tenders 38.0%
53–3032 Heavy and Tractor-Trailer Truck Drivers 68.8%
53–7032 Excavating and Loading Machine and Dragline Operators 70.5%
53–7071 Gas Compressor and Gas Pumping Station Operators 56.6%
53–7073 Wellhead Pumpers 37.8%
Total for all high-demand occupations 61.2%
Source: Bureau of Labor Statistics and IHS © 2015 IHS
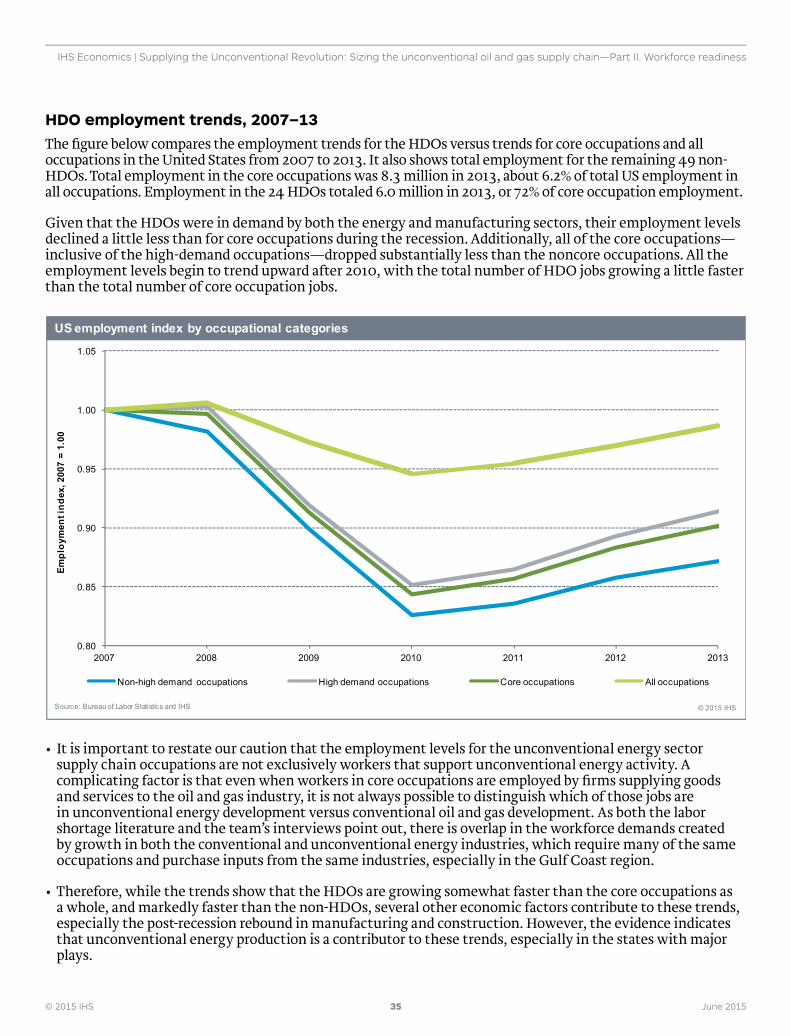
© 2015 IHS 35 June 2015
IHS Economics | Supplying the Unconventional Revolution: Sizing the unconventional oil and gas supply chain—Part II. Workforce readiness
HDO employment trends, 2007–13The fi gure below compares the employment trends for the HDOs versus trends for core occupations and all occupations in the United States from 2007 to 2013. It also shows total employment for the remaining 49 non-HDOs. Total employment in the core occupations was 8.3 million in 2013, about 6.2% of total US employment in all occupations. Employment in the 24 HDOs totaled 6.0 million in 2013, or 72% of core occupation employment.
Given that the HDOs were in demand by both the energy and manufacturing sectors, their employment levels declined a little less than for core occupations during the recession. Additionally, all of the core occupations—inclusive of the high-demand occupations—dropped substantially less than the noncore occupations. All the employment levels begin to trend upward after 2010, with the total number of HDO jobs growing a little faster than the total number of core occupation jobs.
• It is important to restate our caution that the employment levels for the unconventional energy sector supply chain occupations are not exclusively workers that support unconventional energy activity. A complicating factor is that even when workers in core occupations are employed by fi rms supplying goods and services to the oil and gas industry, it is not always possible to distinguish which of those jobs are in unconventional energy development versus conventional oil and gas development. As both the labor shortage literature and the team’s interviews point out, there is overlap in the workforce demands created by growth in both the conventional and unconventional energy industries, which require many of the same occupations and purchase inputs from the same industries, especially in the Gulf Coast region.
• Therefore, while the trends show that the HDOs are growing somewhat faster than the core occupations as a whole, and markedly faster than the non-HDOs, several other economic factors contribute to these trends, especially the post-recession rebound in manufacturing and construction. However, the evidence indicates that unconventional energy production is a contributor to these trends, especially in the states with major plays.
0.80
0.85
0.90
0.95
1.00
1.05
2007 2008 2009 2010 2011 2012 2013
Non-high demand occupations High demand occupations Core occupations All occupations
US employment index by occupational categories
© 2015 IHS
Empl
oym
ent i
ndex
, 200
7 =
1.00
Source: Bureau of Labor Statistics and IHS
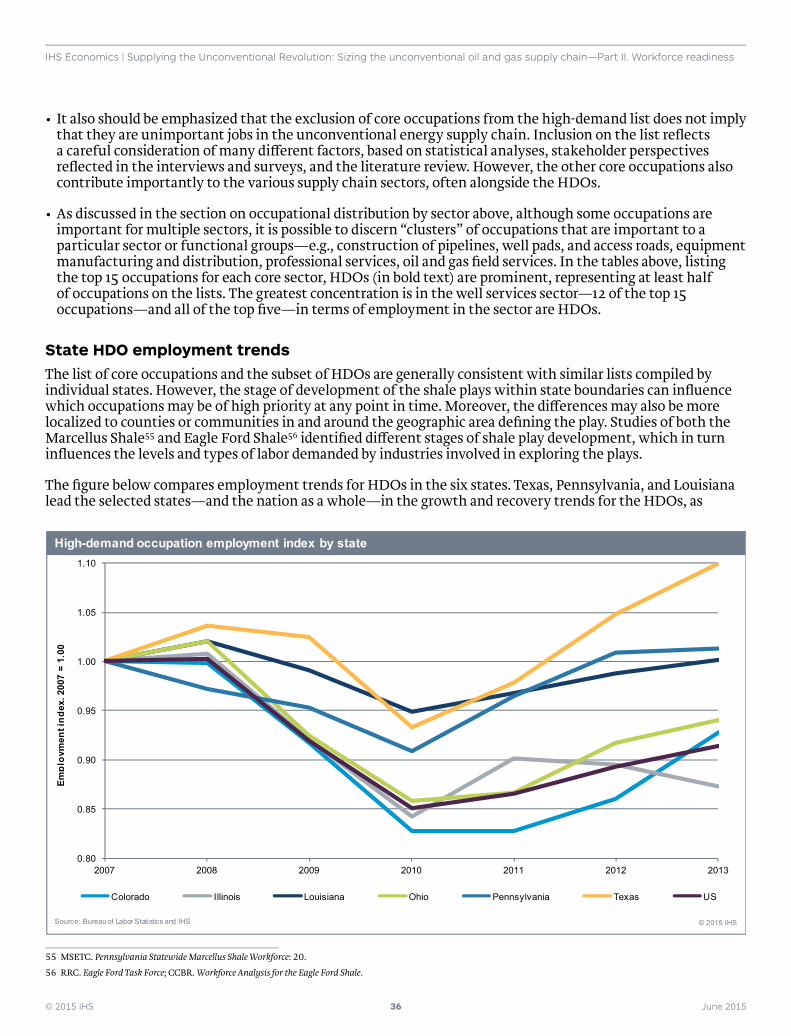
© 2015 IHS 36 June 2015
IHS Economics | Supplying the Unconventional Revolution: Sizing the unconventional oil and gas supply chain—Part II. Workforce readiness
• It also should be emphasized that the exclusion of core occupations from the high-demand list does not imply that they are unimportant jobs in the unconventional energy supply chain. Inclusion on the list refl ects a careful consideration of many di� erent factors, based on statistical analyses, stakeholder perspectives refl ected in the interviews and surveys, and the literature review. However, the other core occupations also contribute importantly to the various supply chain sectors, often alongside the HDOs.
• As discussed in the section on occupational distribution by sector above, although some occupations are important for multiple sectors, it is possible to discern “clusters” of occupations that are important to a particular sector or functional groups—e.g., construction of pipelines, well pads, and access roads, equipment manufacturing and distribution, professional services, oil and gas fi eld services. In the tables above, listing the top 15 occupations for each core sector, HDOs (in bold text) are prominent, representing at least half of occupations on the lists. The greatest concentration is in the well services sector—12 of the top 15 occupations—and all of the top fi ve—in terms of employment in the sector are HDOs.
State HDO employment trendsThe list of core occupations and the subset of HDOs are generally consistent with similar lists compiled by individual states. However, the stage of development of the shale plays within state boundaries can infl uence which occupations may be of high priority at any point in time. Moreover, the di� erences may also be more localized to counties or communities in and around the geographic area defi ning the play. Studies of both the Marcellus Shale55 and Eagle Ford Shale56 identifi ed di� erent stages of shale play development, which in turn infl uences the levels and types of labor demanded by industries involved in exploring the plays.
The fi gure below compares employment trends for HDOs in the six states. Texas, Pennsylvania, and Louisiana lead the selected states—and the nation as a whole—in the growth and recovery trends for the HDOs, as
55 MSETC. Pennsylvania Statewide Marcellus Shale Workforce: 20.
56 RRC. Eagle Ford Task Force; CCBR. Workforce Analysis for the Eagle Ford Shale.
0.80
0.85
0.90
0.95
1.00
1.05
1.10
2007 2008 2009 2010 2011 2012 2013
Colorado Illinois Louisiana Ohio Pennsylvania Texas US
High-demand occupation employment index by state
© 2015 IHS
Empl
oym
ent i
ndex
, 200
7 =
1.00
Source: Bureau of Labor Statistics and IHS
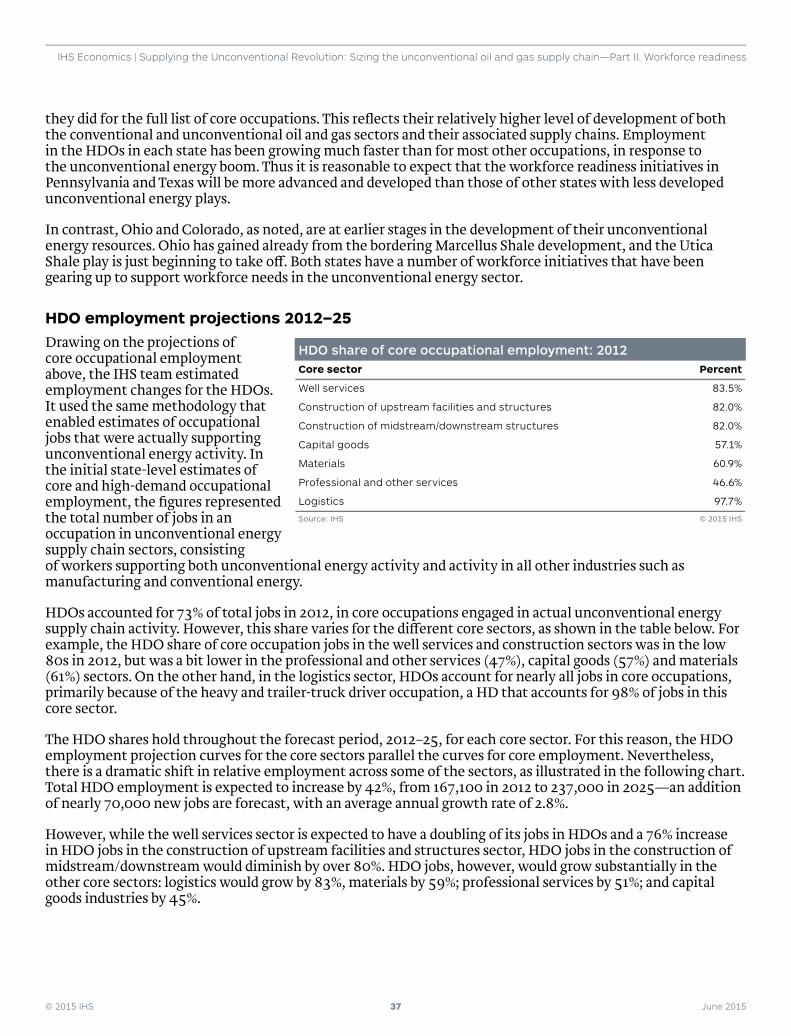
© 2015 IHS 37 June 2015
IHS Economics | Supplying the Unconventional Revolution: Sizing the unconventional oil and gas supply chain—Part II. Workforce readiness
they did for the full list of core occupations. This refl ects their relatively higher level of development of both the conventional and unconventional oil and gas sectors and their associated supply chains. Employment in the HDOs in each state has been growing much faster than for most other occupations, in response to the unconventional energy boom. Thus it is reasonable to expect that the workforce readiness initiatives in Pennsylvania and Texas will be more advanced and developed than those of other states with less developed unconventional energy plays.
In contrast, Ohio and Colorado, as noted, are at earlier stages in the development of their unconventional energy resources. Ohio has gained already from the bordering Marcellus Shale development, and the Utica Shale play is just beginning to take o� . Both states have a number of workforce initiatives that have been gearing up to support workforce needs in the unconventional energy sector.
HDO employment projections 2012–25Drawing on the projections of core occupational employment above, the IHS team estimated employment changes for the HDOs. It used the same methodology that enabled estimates of occupational jobs that were actually supporting unconventional energy activity. In the initial state-level estimates of core and high-demand occupational employment, the fi gures represented the total number of jobs in an occupation in unconventional energy supply chain sectors, consisting of workers supporting both unconventional energy activity and activity in all other industries such as manufacturing and conventional energy.
HDOs accounted for 73% of total jobs in 2012, in core occupations engaged in actual unconventional energy supply chain activity. However, this share varies for the di� erent core sectors, as shown in the table below. For example, the HDO share of core occupation jobs in the well services and construction sectors was in the low 80s in 2012, but was a bit lower in the professional and other services (47%), capital goods (57%) and materials (61%) sectors. On the other hand, in the logistics sector, HDOs account for nearly all jobs in core occupations, primarily because of the heavy and trailer-truck driver occupation, a HD that accounts for 98% of jobs in this core sector.
The HDO shares hold throughout the forecast period, 2012–25, for each core sector. For this reason, the HDO employment projection curves for the core sectors parallel the curves for core employment. Nevertheless, there is a dramatic shift in relative employment across some of the sectors, as illustrated in the following chart. Total HDO employment is expected to increase by 42%, from 167,100 in 2012 to 237,000 in 2025—an addition of nearly 70,000 new jobs are forecast, with an average annual growth rate of 2.8%.
However, while the well services sector is expected to have a doubling of its jobs in HDOs and a 76% increase in HDO jobs in the construction of upstream facilities and structures sector, HDO jobs in the construction of midstream/downstream would diminish by over 80%. HDO jobs, however, would grow substantially in the other core sectors: logistics would grow by 83%, materials by 59%; professional services by 51%; and capital goods industries by 45%.
HDO share of core occupational employment: 2012 Core sector Percent
Well services 83.5%
Construction of upstream facilities and structures 82.0%
Construction of midstream/downstream structures 82.0%
Capital goods 57.1%
Materials 60.9%
Professional and other services 46.6%
Logistics 97.7%
Source: IHS © 2015 IHS
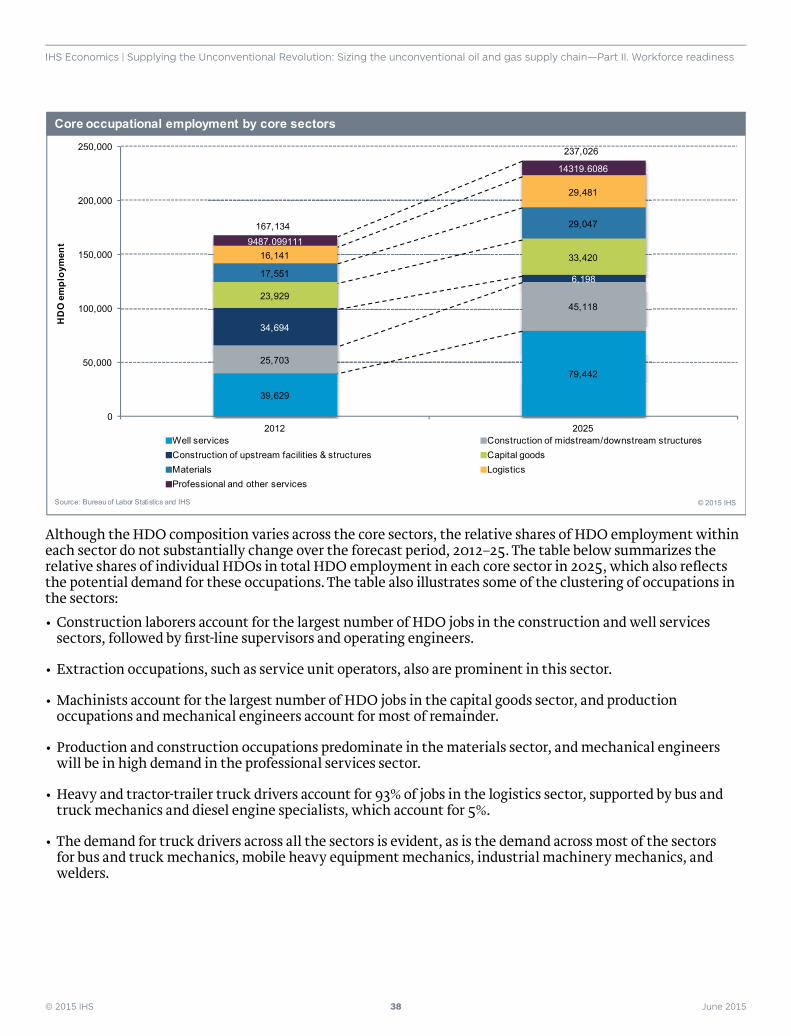
© 2015 IHS 38 June 2015
IHS Economics | Supplying the Unconventional Revolution: Sizing the unconventional oil and gas supply chain—Part II. Workforce readiness
Although the HDO composition varies across the core sectors, the relative shares of HDO employment within each sector do not substantially change over the forecast period, 2012–25. The table below summarizes the relative shares of individual HDOs in total HDO employment in each core sector in 2025, which also refl ects the potential demand for these occupations. The table also illustrates some of the clustering of occupations in the sectors: • Construction laborers account for the largest number of HDO jobs in the construction and well services
sectors, followed by fi rst-line supervisors and operating engineers.
• Extraction occupations, such as service unit operators, also are prominent in this sector.
• Machinists account for the largest number of HDO jobs in the capital goods sector, and production occupations and mechanical engineers account for most of remainder.
• Production and construction occupations predominate in the materials sector, and mechanical engineers will be in high demand in the professional services sector.
• Heavy and tractor-trailer truck drivers account for 93% of jobs in the logistics sector, supported by bus and truck mechanics and diesel engine specialists, which account for 5%.
• The demand for truck drivers across all the sectors is evident, as is the demand across most of the sectors for bus and truck mechanics, mobile heavy equipment mechanics, industrial machinery mechanics, and welders.
39,629
79,44225,703
45,118
34,694
6,198
23,929
33,420
17,551
29,047
16,141
29,481
9487.099111
14319.6086
167,134
237,026
0
50,000
100,000
150,000
200,000
250,000
2012 2025Well services Construction of midstream/downstream structuresConstruction of upstream facilities & structures Capital goods Materials LogisticsProfessional and other services
Core occupational employment by core sectors
© 2015 IHS
HD
O e
mpl
oym
ent
Source: Bureau of Labor Statistics and IHS
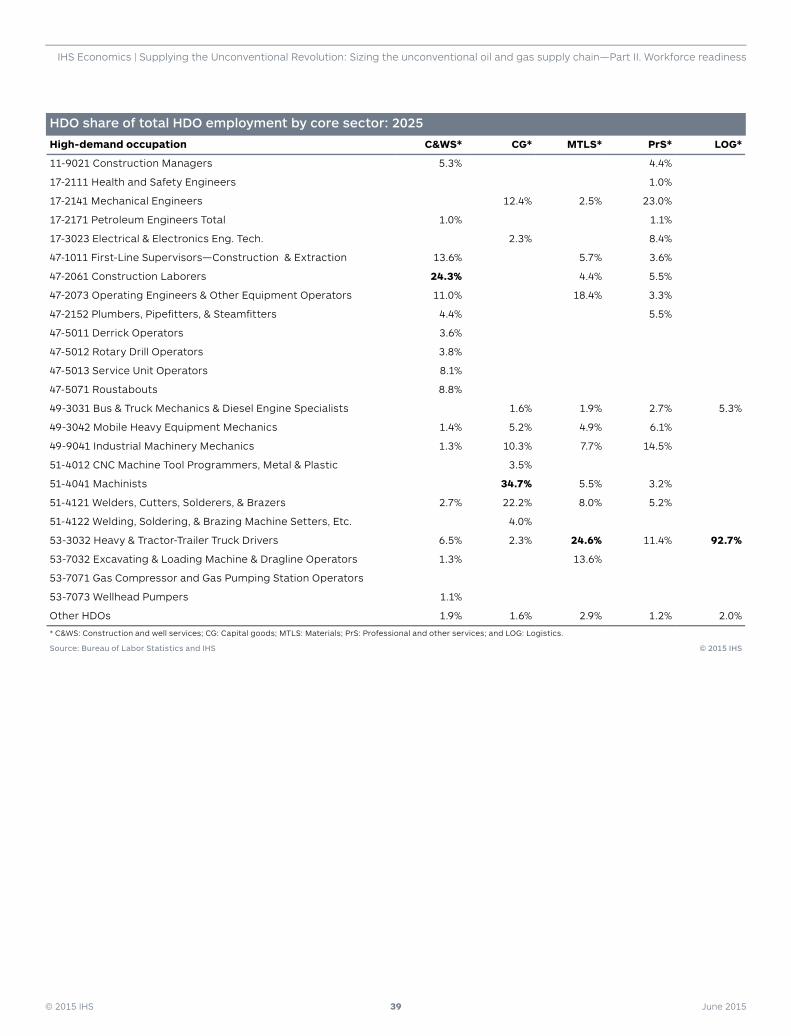
© 2015 IHS 39 June 2015
IHS Economics | Supplying the Unconventional Revolution: Sizing the unconventional oil and gas supply chain—Part II. Workforce readiness
HDO share of total HDO employment by core sector: 2025
High-demand occupation C&WS* CG* MTLS* PrS* LOG*
11-9021 Construction Managers 5.3% 4.4%
17-2111 Health and Safety Engineers 1.0%
17-2141 Mechanical Engineers 12.4% 2.5% 23.0%
17-2171 Petroleum Engineers Total 1.0% 1.1%
17-3023 Electrical & Electronics Eng. Tech. 2.3% 8.4%
47-1011 First-Line Supervisors—Construction & Extraction 13.6% 5.7% 3.6%
47-2061 Construction Laborers 24.3% 4.4% 5.5%
47-2073 Operating Engineers & Other Equipment Operators 11.0% 18.4% 3.3%
47-2152 Plumbers, Pipefi tters, & Steamfi tters 4.4% 5.5%
47-5011 Derrick Operators 3.6%
47-5012 Rotary Drill Operators 3.8%
47-5013 Service Unit Operators 8.1%
47-5071 Roustabouts 8.8%
49-3031 Bus & Truck Mechanics & Diesel Engine Specialists 1.6% 1.9% 2.7% 5.3%
49-3042 Mobile Heavy Equipment Mechanics 1.4% 5.2% 4.9% 6.1%
49-9041 Industrial Machinery Mechanics 1.3% 10.3% 7.7% 14.5%
51-4012 CNC Machine Tool Programmers, Metal & Plastic 3.5%
51-4041 Machinists 34.7% 5.5% 3.2%
51-4121 Welders, Cutters, Solderers, & Brazers 2.7% 22.2% 8.0% 5.2%
51-4122 Welding, Soldering, & Brazing Machine Setters, Etc. 4.0%
53-3032 Heavy & Tractor-Trailer Truck Drivers 6.5% 2.3% 24.6% 11.4% 92.7%
53-7032 Excavating & Loading Machine & Dragline Operators 1.3% 13.6%
53-7071 Gas Compressor and Gas Pumping Station Operators
53-7073 Wellhead Pumpers 1.1%
Other HDOs 1.9% 1.6% 2.9% 1.2% 2.0%
* C&WS: Construction and well services; CG: Capital goods; MTLS: Materials; PrS: Professional and other services; and LOG: Logistics.
Source: Bureau of Labor Statistics and IHS © 2015 IHS
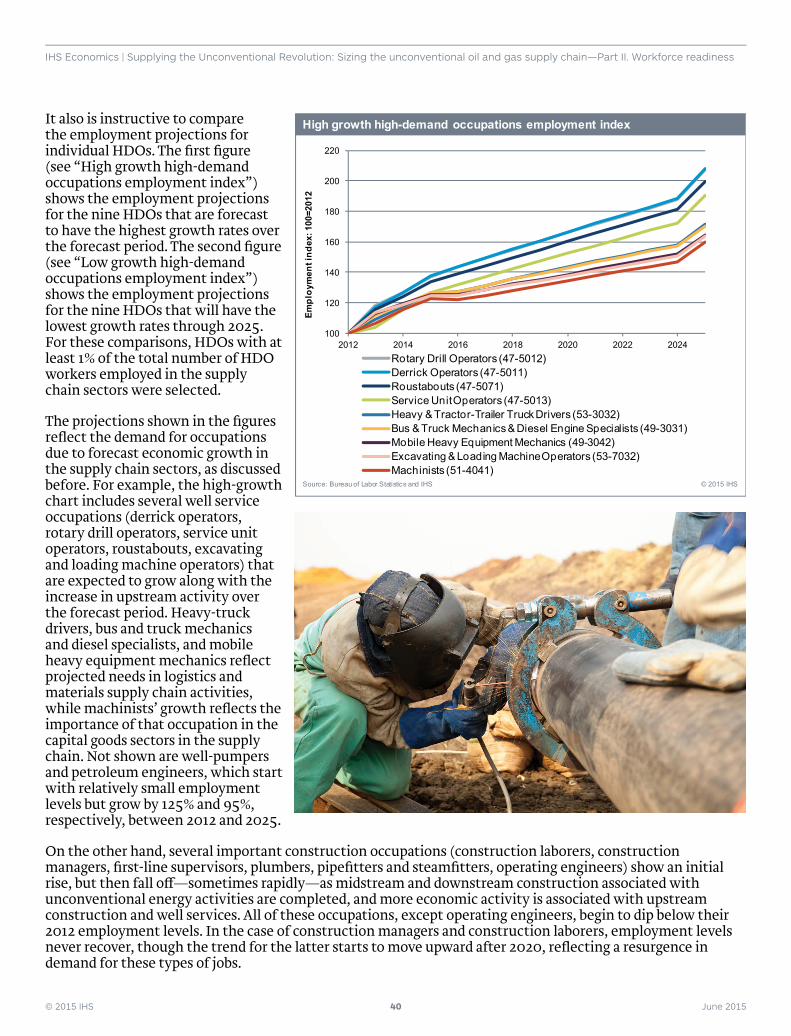
© 2015 IHS 40 June 2015
IHS Economics | Supplying the Unconventional Revolution: Sizing the unconventional oil and gas supply chain—Part II. Workforce readiness
It also is instructive to compare the employment projections for individual HDOs. The fi rst fi gure (see “High growth high-demand occupations employment index”) shows the employment projections for the nine HDOs that are forecast to have the highest growth rates over the forecast period. The second fi gure (see “Low growth high-demand occupations employment index”) shows the employment projections for the nine HDOs that will have the lowest growth rates through 2025. For these comparisons, HDOs with at least 1% of the total number of HDO workers employed in the supply chain sectors were selected.
The projections shown in the fi gures refl ect the demand for occupations due to forecast economic growth in the supply chain sectors, as discussed before. For example, the high-growth chart includes several well service occupations (derrick operators, rotary drill operators, service unit operators, roustabouts, excavating and loading machine operators) that are expected to grow along with the increase in upstream activity over the forecast period. Heavy-truck drivers, bus and truck mechanics and diesel specialists, and mobile heavy equipment mechanics refl ect projected needs in logistics and materials supply chain activities, while machinists’ growth refl ects the importance of that occupation in the capital goods sectors in the supply chain. Not shown are well-pumpers and petroleum engineers, which start with relatively small employment levels but grow by 125% and 95%, respectively, between 2012 and 2025.
On the other hand, several important construction occupations (construction laborers, construction managers, fi rst-line supervisors, plumbers, pipefi tters and steamfi tters, operating engineers) show an initial rise, but then fall o� —sometimes rapidly—as midstream and downstream construction associated with unconventional energy activities are completed, and more economic activity is associated with upstream construction and well services. All of these occupations, except operating engineers, begin to dip below their 2012 employment levels. In the case of construction managers and construction laborers, employment levels never recover, though the trend for the latter starts to move upward after 2020, refl ecting a resurgence in demand for these types of jobs.
100
120
140
160
180
200
220
2012 2014 2016 2018 2020 2022 2024Rotary Drill Operators (47-5012)Derrick Operators (47-5011)Roustabouts (47-5071) Service Unit Operators (47-5013)Heavy & Tractor-Trailer Truck Drivers (53-3032) Bus & Truck Mechanics & Diesel Engine Specialists (49-3031)Mobile Heavy Equipment Mechanics (49-3042) Excavating & Loading Machine Operators (53-7032) Machinists (51-4041)
High growth high-demand occupations employment index
Empl
oym
ent i
ndex
: 100
=201
2
Source: Bureau of Labor Statistics and IHS © 2015 IHS
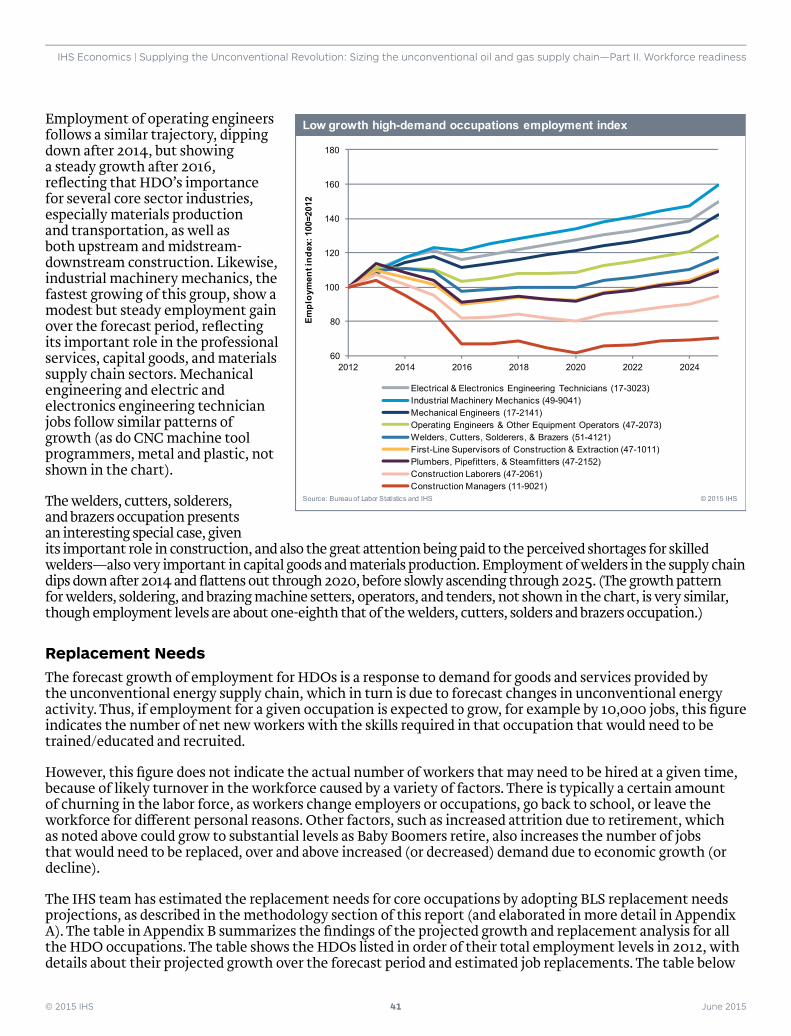
© 2015 IHS 41 June 2015
IHS Economics | Supplying the Unconventional Revolution: Sizing the unconventional oil and gas supply chain—Part II. Workforce readiness
Employment of operating engineers follows a similar trajectory, dipping down after 2014, but showing a steady growth after 2016, refl ecting that HDO’s importance for several core sector industries, especially materials production and transportation, as well as both upstream and midstream-downstream construction. Likewise, industrial machinery mechanics, the fastest growing of this group, show a modest but steady employment gain over the forecast period, refl ecting its important role in the professional services, capital goods, and materials supply chain sectors. Mechanical engineering and electric and electronics engineering technician jobs follow similar patterns of growth (as do CNC machine tool programmers, metal and plastic, not shown in the chart).
The welders, cutters, solderers, and brazers occupation presents an interesting special case, given its important role in construction, and also the great attention being paid to the perceived shortages for skilled welders—also very important in capital goods and materials production. Employment of welders in the supply chain dips down after 2014 and fl attens out through 2020, before slowly ascending through 2025. (The growth pattern for welders, soldering, and brazing machine setters, operators, and tenders, not shown in the chart, is very similar, though employment levels are about one-eighth that of the welders, cutters, solders and brazers occupation.)
Replacement NeedsThe forecast growth of employment for HDOs is a response to demand for goods and services provided by the unconventional energy supply chain, which in turn is due to forecast changes in unconventional energy activity. Thus, if employment for a given occupation is expected to grow, for example by 10,000 jobs, this fi gure indicates the number of net new workers with the skills required in that occupation that would need to be trained/educated and recruited.
However, this fi gure does not indicate the actual number of workers that may need to be hired at a given time, because of likely turnover in the workforce caused by a variety of factors. There is typically a certain amount of churning in the labor force, as workers change employers or occupations, go back to school, or leave the workforce for di� erent personal reasons. Other factors, such as increased attrition due to retirement, which as noted above could grow to substantial levels as Baby Boomers retire, also increases the number of jobs that would need to be replaced, over and above increased (or decreased) demand due to economic growth (or decline).
The IHS team has estimated the replacement needs for core occupations by adopting BLS replacement needs projections, as described in the methodology section of this report (and elaborated in more detail in Appendix A). The table in Appendix B summarizes the fi ndings of the projected growth and replacement analysis for all the HDO occupations. The table shows the HDOs listed in order of their total employment levels in 2012, with details about their projected growth over the forecast period and estimated job replacements. The table below
60
80
100
120
140
160
180
2012 2014 2016 2018 2020 2022 2024
Electrical & Electronics Engineering Technicians (17-3023)Industrial Machinery Mechanics (49-9041)Mechanical Engineers (17-2141)Operating Engineers & Other Equipment Operators (47-2073)Welders, Cutters, Solderers, & Brazers (51-4121) First-Line Supervisors of Construction & Extraction (47-1011)Plumbers, Pipefitters, & Steamfitters (47-2152)Construction Laborers (47-2061)Construction Managers (11-9021)
Low growth high-demand occupations employment index
Empl
oym
ent i
ndex
: 100
=201
2
Source: Bureau of Labor Statistics and IHS © 2015 IHS
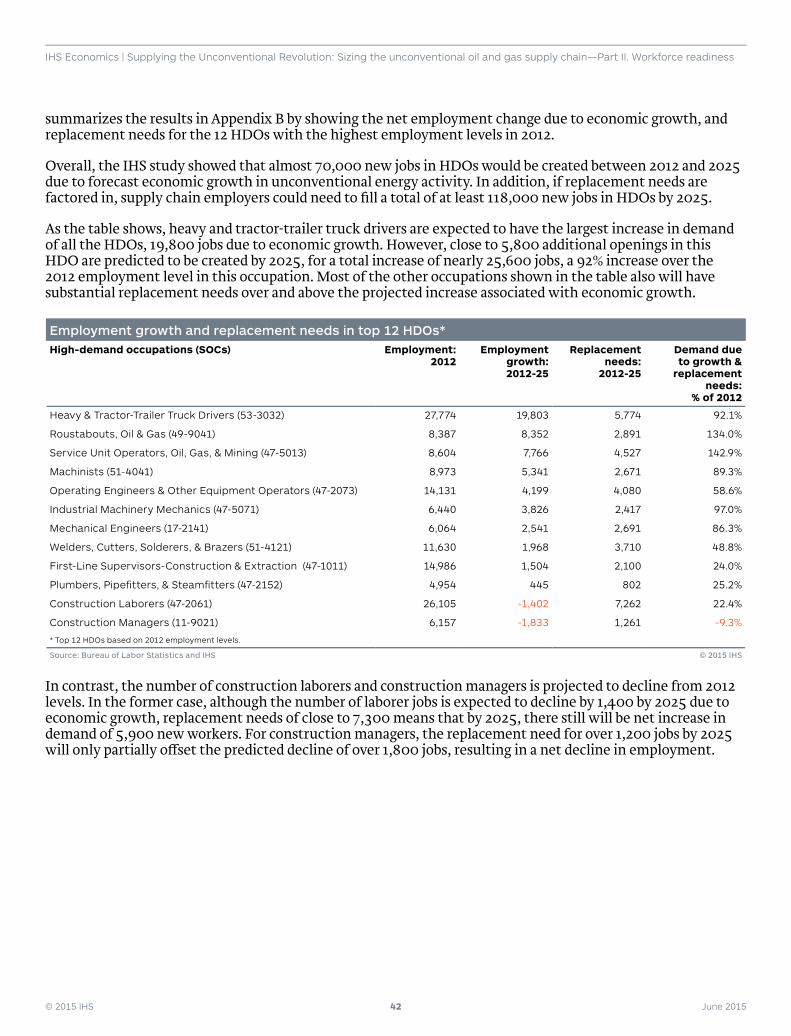
© 2015 IHS 42 June 2015
IHS Economics | Supplying the Unconventional Revolution: Sizing the unconventional oil and gas supply chain—Part II. Workforce readiness
summarizes the results in Appendix B by showing the net employment change due to economic growth, and replacement needs for the 12 HDOs with the highest employment levels in 2012.
Overall, the IHS study showed that almost 70,000 new jobs in HDOs would be created between 2012 and 2025 due to forecast economic growth in unconventional energy activity. In addition, if replacement needs are factored in, supply chain employers could need to fi ll a total of at least 118,000 new jobs in HDOs by 2025.
As the table shows, heavy and tractor-trailer truck drivers are expected to have the largest increase in demand of all the HDOs, 19,800 jobs due to economic growth. However, close to 5,800 additional openings in this HDO are predicted to be created by 2025, for a total increase of nearly 25,600 jobs, a 92% increase over the 2012 employment level in this occupation. Most of the other occupations shown in the table also will have substantial replacement needs over and above the projected increase associated with economic growth.
Employment growth and replacement needs in top 12 HDOs*High-demand occupations (SOCs) Employment:
2012Employment
growth: 2012-25
Replacement needs:
2012-25
Demand due to growth &
replacement needs:
% of 2012
Heavy & Tractor-Trailer Truck Drivers (53-3032) 27,774 19,803 5,774 92.1%
Roustabouts, Oil & Gas (49-9041) 8,387 8,352 2,891 134.0%
Service Unit Operators, Oil, Gas, & Mining (47-5013) 8,604 7,766 4,527 142.9%
Machinists (51-4041) 8,973 5,341 2,671 89.3%
Operating Engineers & Other Equipment Operators (47-2073) 14,131 4,199 4,080 58.6%
Industrial Machinery Mechanics (47-5071) 6,440 3,826 2,417 97.0%
Mechanical Engineers (17-2141) 6,064 2,541 2,691 86.3%
Welders, Cutters, Solderers, & Brazers (51-4121) 11,630 1,968 3,710 48.8%
First-Line Supervisors-Construction & Extraction (47-1011) 14,986 1,504 2,100 24.0%
Plumbers, Pipefi tters, & Steamfi tters (47-2152) 4,954 445 802 25.2%
Construction Laborers (47-2061) 26,105 -1,402 7,262 22.4%
Construction Managers (11-9021) 6,157 -1,833 1,261 -9.3%
* Top 12 HDOs based on 2012 employment levels.
Source: Bureau of Labor Statistics and IHS © 2015 IHS
In contrast, the number of construction laborers and construction managers is projected to decline from 2012 levels. In the former case, although the number of laborer jobs is expected to decline by 1,400 by 2025 due to economic growth, replacement needs of close to 7,300 means that by 2025, there still will be net increase in demand of 5,900 new workers. For construction managers, the replacement need for over 1,200 jobs by 2025 will only partially o� set the predicted decline of over 1,800 jobs, resulting in a net decline in employment.
© 2015 IHS 43 June 2015
IHS Economics | Supplying the Unconventional Revolution: Sizing the unconventional oil and gas supply chain—Part II. Workforce readiness
Meeting the readiness challengeThis section of the report examines whether the unconventional energy supply chain sectors will be able to meet the workforce readiness challenges associated with rising demand and the increasing competition for skilled workers, which results from the expanding investment in unconventional energy production over the next decade. In the analysis above, the IHS-High Road Strategies team identifi ed the core occupations most directly a� ected by economic activity in the unconventional energy supply chain. It then identifi ed 24 occupations that are in especially high demand. Workers in these occupations perform important work in the supply chain sectors—some in fact are considered important across multiple core sectors. Many of these occupations require high levels of training and education to provide the requisite skills needed in the unconventional energy supply chain.
The rapid growth of unconventional energy production across the United States is largely concentrated in states with major shale plays, including Texas, Pennsylvania, Ohio, Colorado, and Louisiana, whose supply chains were examined in this study. In addition, the growth of supply chain activities in support of unconventional plays is being felt in nonproducing states with manufacturing, materials, professional service, and logistics businesses that contribute to the unconventional energy supply chain. Correspondingly, as the demand for critical skilled jobs grows around the nation, and in key producing and nonproducing states in particular, concerns have grown about the readiness of the nation’s workforce education and training system at the national and state levels to adequately meet the skills needs of the supply chain.
These concerns, in addition, must be considered against the backdrop of a long-term, and growing, concern about labor shortages—i.e., “skills gaps”—in overlapping industrial sectors, such as energy, manufacturing, construction, transportation and professional services. These are sectors, in addition, that employ many workers in the same types of professions as the HDOs. Hence, confronted with growing shortages of these skills, the unconventional energy supply chain sectors will be facing sti� ening competition for these types of workers from these other sectors.
Few of the stakeholders interviewed for this study expressed confi dence that there will be an adequate long-term supply of skilled workers, given the demands from the continued investment in unconventional oil and gas activity. The large producing states are in particular challenged to provide the education and training programs needed to support a home-grown pool of trained workers for HDOs to service oil and gas operators and their supply chain. Employers, unions, and educational institutions in the large producing states, as well a few national and multistate collaborations, have responded to the challenge by initiating, expanding and strengthening workforce initiatives designed to increase the supply of skilled workers for the future development of unconventional oil and gas and the various elements of the unconventional supply chain.
These e� orts take many di� erent forms, involving various combinations of private and public sector participation, operating at the local, state, multistate and national levels:
• Community college, technical college and university programs, as well as union apprenticeships, frequently operate in partnership with energy-related companies and business trade associations.
• Most companies do some form of on-the-job training, but count on third-party providers (e.g., apprenticeships, community colleges) to provide basic technical knowledge and skills to qualify candidates prior to hiring.
• Consortia of workforce stakeholders, involving businesses, universities, community colleges, and other education and training providers—both national and state level—have come together to monitor and promote policies and programs to address the workforce challenges.
© 2015 IHS 44 June 2015
IHS Economics | Supplying the Unconventional Revolution: Sizing the unconventional oil and gas supply chain—Part II. Workforce readiness
Below, a number of di� erent initiatives at the national level and in the selected states are briefl y described. The information comes not only from the literature, but also from many of the stakeholder and expert interviews conducted by the IHS team for this study.
Multistate initiativesShaleNET, the nation’s leading and most ambitious initiative, is a consortium of education and training providers and businesses formed to respond to the natural gas industry’s workforce needs. Although its original intent was to create an entry-level training program focused on fi ve HDOs (roustabout, welders’ helper, CDL, fl oor hand and production technician) it now “serves the highest demand occupations in upstream, midstream and downstream activities.”57
The program was launched in 2010 with an initial $4.96 million Community Based Job Training grant awarded to Westmoreland County Community College (WCCC) in Youngwood, Pennsylvania, by the US Department of Labor Employment and Training Administration (ETA). By the close of the grant on June 30, 2013, more than 14,000 people had been served by 20 training providers in four states. It had trained over 5,000 participants with more than 3,400 fi nding employment.
In September 2012, ShaleNET received a follow-on ETA grant of $14.96 million through the Trade Adjustment Assistance Community College and Career Training (TAACCCT)58 program, awarded to the Pennsylvania College of Technology in Williamsport, Pennsylvania. This grant is focused on expanding the initiative’s capacity geographically and incorporating a new stackable credential model of training. Pennsylvania College partners with the Allegheny Conference on Community Development59 to plan and implement the initiative. Other consortium members include Navarro College in Corsicana, Texas; Stark State College in Canton, Ohio; and the Pennsylvania Independent Oil and Gas Association (PIOGA).60 Employers partnering with and supporting the initiative include Chevron, Shell, Anadarko, Petroleum Corp., Chesapeake Energy, XTO, and Encana.61
Gas Compressor Association (GCA) is a professional trade association “dedicated to the enrichment of its members and their industry,” which encompasses products and services for the natural gas compressor market. The association includes compressor, driver, cooler and control panel manufacturers, packagers, and rental fl eet owners located around the United States. Recognizing its members’ need for qualifi ed, well-trained individuals, GCA began partnering with colleges to help develop and maintain programs that will train new mechanics and operators. Using revenues from its annual GCA Expo and Conference, it has awarded $400,000 to its college partners, including Co� eyville Community College, Kansas; Lackawanna College, Pennsylvania; Oklahoma State University Institute of Technology, Oklahoma; Panola College, Texas; San Juan College, New Mexico; Seward County Community College, Kansas; Western Wyoming Community College, West Virginia; and Zane State College, Ohio.62
57 See www.shalenet.org.
58 TAACCCT was authorized in 2009 by Trade Act of 1974 as amended by the American Recovery and Reinvestment Act, and authorized to receive $2 billion over four years by the Health Care and Education Reconciliation Act in 2010. The program provides community colleges and other eligible institutions of higher education with funds to expand and improve their ability to deliver education and career training programs that can be completed in two years or less, to prepare workers for employment in high-wage, high skill occupations. http://www.doleta.gov/taaccct/]
59 See www.alleghenyconference.org. Also a ShaleNET partner, the conference was founded in 1944. With its a� liates—the Greater Pittsburgh Chamber of Commerce, Pennsylvania Economy League of Greater Pittsburgh, and Pittsburgh Regional Alliance (PRA)—the conference works to improve the economy and the quality of life in southwestern Pennsylvania. Its strategic is focus to create a more competitive business climate and marketing for the Pittsburgh region for investment, job creation and talent.
60 See www.pioga.org PIOGA, a partner in ShaleNET, is the principal nonprofi t trade association representing Pennsylvania’s independent oil and natural gas producers, marketers, service companies and related businesses. It represents over 950 members, who drill and operate the majority of the state’s crude oil and natural gas, including the Marcellus Shale. These oil and natural gas producers, drilling contractors, service companies, manufacturers, distributors, professional fi rms and consultants, royalty owners, and other individuals with an interest in Pennsylvania’s oil and gas industry.
61 See www.shalenet.org. In addition, ShaleNET is working with 15 Workforce Investment areas and their One Stops targeting 69 counties across Pennsylvania, West Virginia, Ohio, and New York (if/when the moratorium is lifted).
62 For more about the Gas Compression Association see www.gascompressor.org.
© 2015 IHS 45 June 2015
IHS Economics | Supplying the Unconventional Revolution: Sizing the unconventional oil and gas supply chain—Part II. Workforce readiness
Appalachia Partnership Initiative (API) is a $20 million commitment by Chevron USA, Inc., to improve education and technical training to meet the workforce needs of the energy industry and related manufacturing industries in 27 counties across southwestern Pennsylvania, northern West Virginia, and eastern Ohio. Chevron and its partners will work to improve STEM education and technical training programs to develop a skilled workforce that can meet the needs of the energy industry and related manufacturing industries. Specifi cally, it is expanding its partnership with Project Lead the Way (PLTW), to build STEM programs in K-12 schools in nearly 20 schools in the tristate area in 2014–15. It will work with ShaleNET to develop workforce training programs for the oil and natural gas industry, providing scholarships at four community colleges. Finally, it will fund Carnegie Mellon University to develop an interactive science application to teach middle students about energy resources.63
Union apprenticeship programs play an increasingly important role in providing the skilled labor that oil and gas companies and their supply chains need to meet the growing demand driven by the unconventional boom. The energy companies originating in the Gulf Coast region in particular have historically not looked upon unions with much favor. However, pragmatic considerations and rising pressures to fi nd workers with the requisite skills have increased the willingness of many employers to work with labor unions, especially to strengthen the workforce resources for unconventional energy development. Indeed, many of the employers interviewed have been working with union labor and depend on the unions’ apprenticeship programs to ensure the availability of workers trained and tested in the skills required for the job.
Operating engineers represented by the International Union of Operating Engineers (IUOE) and construction laborers represented by the Laborers’ International Union of North America (LIUNA) go through rigorous training programs run jointly by unions and employers. It is notable, for example, that in 2012, IUOE local unions and their employers invested approximately $107 million in apprenticeship and training programs.64 The system usually combines on-the-job (OJT) and classroom training, and is generally regulated by the Department of Labor’s O� ce of Apprenticeships or through state apprenticeship councils. This is the general workforce development model in place for these workers and for the other construction trades.
In addition to existing union apprenticeship programs, there is growing interest in increasing the number and availability of other types of apprenticeship programs that can help meet the growing demand for skilled workers in the United States. A report of the Center for American Progress argues that apprenticeship programs are “underutilized training tools in the United States.” It notes that the US Department of labor administers a small system of 375,000 registered apprentices with about 100,000 new apprentices per year. By contrast, England starts with about 3 million apprentices per year.65
An important US program is the National Institute for Metalworking Skills (NIMS), which has worked closely with metalworking experts from fi rms and trade associations to develop industry-driven national skills standards and training curriculum for metalworking occupations. Employers can today o� er a NIMS- Certifi ed Registered Apprenticeship Program in 16 occupations, including machinists, toolmakers, and CNC setup programmers,66 all highly relevant occupations for the unconventional energy supply chain.
Private-sector training programs are operated by private fi rms with histories of providing specialized training relevant to the energy sector, including its supply chain. Examples include”
• Hobart Institute of Welding Technology founded in 1930 in Troy, Ohio, is one of the best-recognized training programs for training in welding. The nine-month program graduates 300 students each year, 83% of whom have a job when they leave.67
63 See http://www.chevron.com/articledocuments/latest/news_206085/845c371c-7f48-4f3f-b071-bb509d373081/API-Fact-Sheet.pdf.cvxn.
64 Je� rey Soth. “Testimony submitted by Je� rey Soth, International Union of Operating Engineers to the Natural Gas Caucus, US House of Representatives.” Washington, DC (March 26, 2014); Dan Shingler. “Union’s Dirty Business Grows.” Crain’s Shale (www.SHALEmagazine.com) Spring 2014:18-20.
65 Sarah Ayres, “National Standards for Strong Apprenticeships.” Center for American Progress, Washington, DC. August 26, 2014:2
66 Ibid.:4.
67 Philips. “Welders, America Needs You.” See also the Hobart Institute of Welding Institute website, www.welding.org.
© 2015 IHS 46 June 2015
IHS Economics | Supplying the Unconventional Revolution: Sizing the unconventional oil and gas supply chain—Part II. Workforce readiness
• The Gas Technology Institute (GTI) in Des Plaines, Illinois, is a research, development and training organization addressing energy and environmental challenges. Over its 70-year history, it has trained about 65,000 employees in a broad array of energy topics. GTI o� ers a full curriculum of gas distribution, gas transmission, marketing, and gas supply courses. It also conducts training in some junior colleges throughout North America on shale gas for individual companies and some of their new employees/service companies.68
• Retrain America, founded in 2009, provides technical and safety programs to the oil and gas industry focused on unconventional shale exploration and extraction. This includes training of existing employees (from entry level to engineer) on the latest safety standards and operational procedures, to retraining blue-collar workers and veterans for a new career path. Other programs include certifi cation programs in shale exploration, shale engineering and rig safety.69
There are other initiatives aimed at addressing the need for training and certifying skilled workers more generally. For example, the Manufacturing Institute, an a� liate of the National Association of Manufacturers, has introduced a system of nationally portable, industry-recognized credentials called the Manufacturing Skills Certifi cation System. This initiative involves 12 industry organizations that o� er certifi cation of specifi c skills in areas including machining, welding, fabrication, automation, fl uid power mechatronics, and transportation.70
State programsBusinesses, unions, education and training providers, and government agencies in the large producing states, especially, have responded to the workforce challenges with a variety of initiatives:
• State agencies and university researchers track the growth of the unconventional energy sector, evaluate its economic impacts, and assess the workforce needs and challenges associated with the growing industry.
• Consortia and associations comprising business groups, education and training providers, community and economic development organizations, and other stakeholders have been formed to support initiatives to meet growing workforce demands associated with the development of regional shale plays.
• Businesses and unions have collaborated on strengthening apprenticeship programs in the HDOs needed by industry.
• Career and technical centers, community colleges, and universities have been building up their capacity to provide education and training programs, either as participants in consortia or in partnership with companies and industry organizations.
While the energy-producing states examined in this report are very active in expanding and growing new programs to train workers for core and high-demand occupations, they are at di� erent phases and levels of development with regard to unconventional energy, which is refl ected in the scale and types of workforce readiness initiatives they are engaged in. In any case, several of the more important workforce readiness or related initiatives in the four selected states—Texas, Pennsylvania, Ohio and Colorado—are reviewed, below. In addition, short summaries of the report’s occupational results and workforce readiness initiatives for each state are available in Appendix D.
Texas workforce initiativesShale production has become the largest source of natural gas produced in Texas, rising from 1,264.7 billion cubic feet (Bcf), or 18% of gross natural gas production in 2007, to 4,017.3 Bcf, or 49% of gross natural gas
68 See www.gastechnology.org. GTI has locations in Washington, DC, Texas, Pennsylvania, Alabama, Massachusetts, and California.
69 See www.retrain-america.com.
70 Ayres. “National Standards”:3.
© 2015 IHS 47 June 2015
IHS Economics | Supplying the Unconventional Revolution: Sizing the unconventional oil and gas supply chain—Part II. Workforce readiness
production in 2013.71 The Barnett Shale was the nation’s earliest unconventional play and remains one of the largest producers of natural gas in the United States today. Production of natural gas from horizontal drilling and hydraulic fracturing took o� in 2005, and natural gas production from Barnett wells increased from 380 Bcf to 1,911 Bcf in 2012. However, most of the excitement in Texas over shale energy in the past few years has been around development of the Eagle Ford Shale, which has included a great deal of attention to workforce challenges that could a� ect the full development of the play.
The Eagle Ford play encompasses 14 Texas counties directly and 20 counties indirectly, and is one of the largest oil and gas developments in the world. Assessments of the existing and projected workforce needs for the Eagle Ford have been carried out by Center for Community and Business Research (CCBR), Institute for Economic Development, at the University of Texas at San Antonio (UTSA),72 and as part of a report by the Eagle Ford Task Force convened and chaired by Commissioner David Porter of the Texas Railroad Commission.73
Consistent with the IHS-High Road Strategies project team’s fi ndings, these assessments have noted that most in-demand jobs are for skilled labor or trades, with a signifi cant need for technicians, gas measurement, welders, pipefi tters, oilfi eld services, hydraulic machinery operators, and other service workers. As a Houston Chronicle article reports, “Machine shops, diesel repair shops, tire shops, truck sales, all infrastructure companies, and any company associated with the industry is seeing a major spike in demand for jobs.”74
Industry, government, and the state’s education and training system have responded by building on existing workforce programs as well as starting new initiatives bringing together stakeholders, and numerous community colleges are expanding their programs, all to help remedy potential labor shortages in a variety of high-demand occupations.
The Eagle Ford Shale Task Force was created by Texas Railroad Commissioner David Porter in 2011 to promote economic activity and establish best practices across the play. Throughout 2011 and 2012 it sought to address concerns and challenges that accompany the growing economy across South Texas. The Task Force comprises a diverse group of community leaders, local elected o� cials, water representatives, environmental groups, oil and gas producers, pipeline companies, oil services companies, landowners, mineral owners, and royalty owners. The fi ndings of a report of the group published by the Texas Railroad Commission includes a major chapter on workforce development75
The Eagle Ford Consortium76 comprises South Texans who seek to collaborate and maximize the benefi ts to the region and their communities of the Eagle Ford Shale development. Partners in this project include leaders in education and workforce development, industry, community and economic development, infrastructure and natural resources, community investment, and communications. Its stated objectives include developing and fostering e� ective lines of communications with oil and gas industry and local communities such as public schools, workforce training and education providers, and others; coordinating workforce and education e� orts to improve employment of dislocated and underemployed workers; helping procure public and private resources to benefi t workforce and community development e� orts; and maximizing the economic opportunities to communities in the Eagle Shale region.
Workforce Solutions of the Coastal Bend77 is a collaborative statewide network to assist both employers and employees during the recruitment and hiring process. Its network of partners and providers o� ers a wide range of no-cost and low-cost opportunities for employers and job seekers. One of its important e� orts has connected employers with skilled workers in the Eagle Ford Shale.
71 See http://www.eia.gov/dnav/ng/ng_prod_sum_dcu_stx_a.htm.
72 CCBR. Workforce Analysis for the Eagle Ford Shale.
73 RRC Eagle Ford Task Force.
74 Rebecca Maitland. “Oil and gas industry shows demand for skilled labor.” Houston Chronicle (March 22, 2013). http://www.chron.com/jobs/article/Oil-gas-industry-shows-demand-for-skilled-labor-4377638.php .
75 RCT. Eagle Ford Shale Task Force Report.
76 See.www.eaglefordconsortium.org.
77 See www.workforcesolutionscb.org. Its services include recruitment services, job search assistance, training, child-care support, educational initiatives, and much more.

© 2015 IHS 48 June 2015
IHS Economics | Supplying the Unconventional Revolution: Sizing the unconventional oil and gas supply chain—Part II. Workforce readiness
Texas community colleges are the backbone of the state’s workforce development system (as in many other states). They seek to provide training and credentials to skilled technical and trades workers, with many programs geared toward preparing them for careers in energy. A sampling of these programs includes:
• Alamo Colleges – San Antonio Area o� ers associate degrees, certifi cates and licenses in programs that prepare students for jobs and four-year degrees;78
• Coastal Bend College has partnered with several organizations to provide fi eld training to students who take various petroleum industry training courses, from CDL certifi cation and petroleum safety and environmental hazards, to technology/ technician management and oil spill response.79
• Laredo Community College o� ers degrees and certifi cations in electrical technology, diesel engine mechanics, and an oil and gas industry specialization;80
• Southwest Texas Junior College o� ers associate degrees and technical certifi cations in diesel technology and welding.81
• Del Mar College o� ers various associate degrees, certifi cations, and continuing education, including training in a number of industrial skills.82
• Victoria College o� ers associate degrees and technical certifi cations in business, welding, and instrumentation technology.83
Other community colleges involved in energy sector workforce development include Navarro College, a partner in ShaleNET, and Panola College, an academic partner in the Gas Compressor Association (see above).
Major universities are also involved in training students for professional careers in the oil and gas and related sectors, such as petroleum engineering. These include Texas A&M International University (TAMIU),84 the University of Texas at Austin, and the University of Texas at San Antonio (USTA). USTA also is home to CCBR, which has produced several studies assessing the economic and workforce impacts associated with the Eagle Ford.85
Pennsylvania workforce initiativesThe Marcellus Shale is the largest shale formation in the United States, spanning six northeastern states, including Pennsylvania. Since the fi rst well was drilled in 2004, the Marcellus has helped make Pennsylvania the third-largest natural gas producer in the United States, after Louisiana and Texas. The state’s gross natural gas production mushroomed from 182.3 Bcf in 2007 to 3,259.0 Bcf in 2013, mostly due to the Marcellus; shale gas production in the state rose from zero in 2007 to 3,048.1 Bcf in 2013.86
Concerns about fi nding adequately skilled workers for the burgeoning industry sector has spurred a great deal of activity in the state to monitor employment impacts and trends, identify and assess high-demand occupations associated with Marcellus development, and support workforce education and training in response to the rapid growth in demand for skilled labor. Pennsylvania businesses, universities and community colleges are actively participating in ShaleNET, which got its start at the Westmoreland County Community
78 See www.alamo.edu.
79 See www.coastalbend.edu.
80 See www.laredo.edu.
81 See swtjc.edu.
82 See www.delmar.edu.
83 See www.victoriacollege.edu.
84 See tamiu.edu.
85 See utsa.edu.
86 http://www.eia.gov/dnav/ng/ng_prod_sum_a_EPG0_FGW_mmcf_a.htm.
© 2015 IHS 49 June 2015
IHS Economics | Supplying the Unconventional Revolution: Sizing the unconventional oil and gas supply chain—Part II. Workforce readiness
College and, now centered at the Pennsylvania College of Technology, is run with the help of the Allegheny Conference on Community Development. Other notable programs and initiatives in the state include the following:
Pennsylvania’s Labor and Industry Departments’ Center for Workforce Information and Analysis (CWIA) provides information and performs studies on the workforce requirements of the Marcellus Shale industry, including identifying and tracking supply and wages in key occupations. CWIA prepares an annual update each May on Marcellus Shale key facts, identifying key occupations and industry sectors by a six-digit NAICs code. It also puts out a quarterly publication Marcellus Fast Facts, which provides a quick snapshot of the labor market for Marcellus Shale industries and related economic activity. CWIA is not a job training organization but works closely with organizations such as Workforce Investment Boards, community colleges, etc., including ShaleNet, to supply labor force data that help them in their work.87
Shale Training and Education Center (ShaleTEC) is a collaboration between Pennsylvania College of Technology and Pennsylvania State Extension to serve as a central resource for workforce development and education needs of the community and the oil and natural gas industry. Its central operations are located in the Center for Business and Workforce Development on the main campus of Pennsylvania College in Williamsport. It changed its name from the Marcellus Shale Education and Training Center (MSETC) to ShaleTEC in the fall of 2012, because of the center’s current and future industry expansion into other shale and tight-sand formations. ShaleTEC’s main goals are to provide concise and accurate information for the public; o� er workforce-development services to assist with the anticipated large increase in workforce needs of the industry; and to serve as a central access point for the industry to the resources of Pennsylvania State and Pennsylvania College.88
Pennsylvania College of Technology became an a� liate of the Pennsylvania State University in 1989, after establishing a national reputation for education supporting workforce development, fi rst as a technical institute and later as a community college. Today, Pennsylvania College is committed to applied technology education. Located in Williamsport, Pennsylvania College enrolls nearly 6,000 students in bachelor, associate, and certifi cate programs relating to more than 100 di� erent career areas. It also manages the state’s largest worker training program through its Workforce Development and Continuing Education unit. Pennsylvania College is a founder and partner with Pennsylvania State Extension in ShaleTEC, and a member of ShaleNET.89
Westmoreland County Community College (WCCC), founded in 1970, and located in Youngwood, operates six o� -campus education centers serving all of Westmoreland, Armstrong, Greene, and Indiana counties. Its enrollment includes approximately 6,600 full- and part-time students pursuing associate’s degree, diploma, and certifi cate programs with options that prepare students for careers or transfer to baccalaureate degree programs at four-year institutions. WCCC led the consortium of educators and industry members to create ShaleNET in 2010, with an initial grant of nearly $5 million, for training programs for entry-level jobs in the Marcellus Shale industry.90
Ohio workforce initiativesOhio historically has been a moderate producer of oil and gas.91 Its total annual natural gas production, primarily from conventional wells, peaked at nearly 160 Bcf in the 1980s, but has declined since, to 80–100
87 See www.paworkstats.state.pa.us.
88 See www.shaletec.org. ShaleTEC o� ers several short-term, noncredit, workforce training programs that meet specifi c industry needs and provide opportunities for local residents to train for positions in the industry: Classes include defensive driving; Fit 4 natural gas pre-employment training (roustabout); commercial driver training; API 1104 downhand welding; SafeLand USA; Certifi ed Operations Technician; OSHA Rough Terrain Forklift Training; natural gas development and production overview; and OSHA 10-hour construction.
89 See www.pct.edu.
90 See www.wccc.edu. WCCC’s Public Safety Training Center also has received $3.14 million in federal funding to support a natural gas training program
91 See US Energy Information Administration (EIA) state profi les: http://www.eia.gov/state/?sid=OH. EIA reported that Ohio had the seventh-largest crude oil refi ning capacity in the nation in 2013.

© 2015 IHS 50 June 2015
IHS Economics | Supplying the Unconventional Revolution: Sizing the unconventional oil and gas supply chain—Part II. Workforce readiness
Bcf today.92 Current interest in Ohio oil and gas exploration has shifted to two Ohio shale plays—the Marcellus Shale and the Utica Shale. The Marcellus Formation thins under Ohio, and its impacts are limited to the eastern counties. The Utica covers most of the eastern half of the state and is expected to have a larger impact across Ohio. However, shale oil and gas drilling has only recently begun to accelerate. Natural gas gross withdrawals from Ohio shale gas wells were initially very small (only about 10-17 million cubic feet [Mcf ] between 2007 and 2010), but has recently taken o� , reaching nearly 88 Bcf by 2013.93
While still small, the growth in shale gas production over the past few years is already having economic impacts, opening up thousands of new shale-related jobs, according to the Ohio Department of Job and Family Services (JFS). Compared to Pennsylvania and Texas, public and private sector e� orts to assess and take advantage of these opportunities are only just getting started. As in the other states, state agencies such as JFS have been working closely with workforce investment areas, community colleges, other post-secondary educational institutions, and employers to identify the HDOs needing workers for the unconventional energy sector and to put in place appropriate training programs. Some of the more important of these initiatives are summarized below:
The Ohio Oil and Gas Energy Education Program (OOGEEP) is a statewide education and public outreach program. Created in 1998, OOGEEP provides a variety of programs throughout the state. These primarily focus on teacher workshops, scholarships, student education, fi refi ghter training, industry training, workforce development, research, landowner and guest speaker programs. Providing factual information about the crude oil and natural gas industry, many programs have related curriculum and materials that meet state and national standards. OOGEEP is funded by Ohio’s crude oil and natural gas industry through an assessment on the production of all crude oil and natural gas produced in Ohio.
Zane State College,94 in Zanesville and Cambridge, o� ers a wide variety of two-year associate degree programs, certifi cate programs, workshops, and occupational skills training. Its EPIC program (Energy Exploration, Production, Innovation, Collaboration), launched in 2011, is a collaboration of educational institutions, public and private businesses, and government and community-based organizations with the goal of ensuring that Ohio is adequately prepared to meet the growing workforce needs in the energy fi eld. It o� ers several two-year associates degree programs in technical trade areas, (e.g., oil and gas engineering technology, electrical/electronic engineering technology, welding and fabrication, and industrial maintenance technology), an energy maintenance technician certifi cation, and several short-term certifi cates and courses commonly pursued in energy programs. Zane State is an academic partner of the Gas Compressor Association (see above).
Stark State College,95 in Canton, provides associate degrees, certifi cates, and professional development. A ShaleNET partner, Stark State o� ers training programs in demand by oil and gas companies, along with their suppliers and support systems. These can include a wide range of credit and noncredit training programs, including many one-year certifi cates in ShaleNET programs (e.g., industrial process operation technology, petroleum industrial mechanics technology, petroleum technology, pipeline technician, production technicians). It also o� ers two-year associate degrees and one-year certifi cates in many related fi elds.
Career and Technology Education Center (C-TEC) of Licking County is a state and federally funded one-year career and technical school serving Licking County since 1974. There are 56 schools like C-TEC in Ohio. It o� ers some certifi cate programs for high-demand skilled trade jobs in the unconventional energy and supply chain sectors. C-TEC also receives industry funding. It has a partnership with Ariel Corporation, a privately owned gas compressor manufacturer, to provide training in precision assembly to build natural gas compressors. Ariel has built a new lab and equipment and C-TEC is helping train about 450 of Ariel’s workers in a program for machinists and precision assembly at their company.96
92 Ibid.
93 Ibid.
94 See www.zanestate.edu.
95 See www.starkstate.edu/oilandgas.
96 Phone interview, C-TEC, June 3, 2014.
© 2015 IHS 51 June 2015
IHS Economics | Supplying the Unconventional Revolution: Sizing the unconventional oil and gas supply chain—Part II. Workforce readiness
Central Ohio Technical College (COTC),97 in Newark, o� ers a wide range of degree and certifi cate programs. In response to growing industry demand for skilled workers in the unconventional energy supply chain sector, COTC has expanded its training programs, adding 70 people to its welding program and 50 for machinist training. Certifi cate programs are designed by energy supplier companies that contribute to their costs.
Colorado workforce initiativesColorado’s vast fossil fuel resources include the Niobrara Shale, with resource estimates as high as 2 billion barrels of oil. In 2013 it was the sixth-largest natural gas producer and seventh-largest petroleum producer in the nation. From 2007–13, crude production in the state rose by 146% and marketed natural gas production grew by 29%.98 Much of the crude oil production is reported by the US Energy Information Administration (EIA) to be increasing with the use of horizontal drilling and hydraulic fracturing technologies. However, while total natural gas production also has been growing, only a relatively small fraction of that is from shale gas wells. Of the 1,604.9 Bcf of natural gas produced in Colorado in 2013, only 247.0 Bcf, or 15%, was produced from shale wells. In 2007, 138.3 Bcf was produced, 11% of total gross natural gas withdrawals.99
Energy is one of Colorado’s most signifi cant sources of economic activity with more than 122,000 people employed in the industry in 2012. Oil and natural gas extraction produced more than $12 billion in revenues and created more than 35,000 new jobs from 2003–13.100 However, there does not yet seem to be the same level of concern about being able to fi ll high-demand positions in Colorado’s energy and supply chain sectors as there is in the other states.
Nevertheless, Colorado’s large and expanding oil and gas sector continues to fuel interest in initiatives to increase the supply of skilled workers to meet the workforce needs of the industry. For example, a Colorado energy industry report states, “Colorado’s energy industry has an opportunity to increase the number of ‘homegrown,’ highly educated, skilled workers.” It recommends that the industry partner closely with educational institutions to “encourage the education of a workforce that meets its needs.”101 Several initiatives with a focus on the workforce needs of upstream, midstream, and downstream energy-related industries are summarized below:
Colorado Online Energy Training Consortium (COETC)102 was founded with a grant of $17.3 million from the Trade Adjustment Assistance Community College and Career Training Grant program of the US Department of Labor. The project is led by Community College of Denver and includes 14 other colleges across Colorado.103 The consortium focuses on enhancing current energy-related programs with the goal of training highly qualifi ed workers for businesses. The funds are being used for curricular redesign and technology to bridge the gap between existing workforce skills and emerging energy industry needs. The project also facilitates partnerships among energy-related businesses, community colleges, and local workforce centers to train unemployed and underemployed workers with skills for placement. The Colorado Department of Labor and Employment, representing its 10 regional workforce centers, is supporting the project. Employer partners include Chevron Alaska MidContinent, DCP Midstream, Anadarko Petroleum, Colorado Springs Utilities, San Isabel Electric, Platte River Power Authority, Next Era Energy, and several others.
97 See www.cotc.edu.
98 More than 87% of oil and gas activity in Colorado is concentrated in fi ve counties, and 31 counties represent the remaining 13% of activity. See EIA state profi le for Colorado: http://www.eia.gov/state/?sid=CO.
99 See http://www.eia.gov/dnav/ng/ng_prod_sum_dcu_sco_a.htm.
100 Colorado Department of Natural Resources, Colorado Energy O� ce, and Colorado Department of Public Health and Department. Colorado Energy Report 2014. 2014 Colorado State Energy Plan, Denver, Colorado (www.colorado.gov):5.
101 BCS Incorporated. Colorado’s Energy Industry:21.
102 See https://www.cccs.edu/partnering-for-success/trade-adjustment-assistance/taa-coetc/.
103 These include Aims Community College, Colorado Mountain College, Front Range Community College, Northeastern Junior College, Red Rocks Community College, Trinidad State Junior College, Pueblo Community College, Arapahoe Community College, Community College of Aurora, Community College of Denver, Lamar Community College, Otero Junior College, Morgan Community College, Pikes Peak Community College, and Colorado Northwestern Community College.
© 2015 IHS 52 June 2015
IHS Economics | Supplying the Unconventional Revolution: Sizing the unconventional oil and gas supply chain—Part II. Workforce readiness
Aims Community College, with support of a $2 million grant in 2012 from the Department of Labor, has built and is operating a training facility to teach skills for the oil and gas production industry. Areas of study include oil and gas production; process technology; energy technology; team building; safety and loss prevention. Its advisory committee includes Noble, Encana, Halliburton, Anadarko, some smaller service companies, and the Weld County workforce center.104
Front Range Community College (FRCC)105 o� ers associate degree and certifi cate programs that train students for careers in well-established and emerging industries. This includes Associate of Applied Science degrees and certifi cates in electromechanical and electrical power technology and welding technology. The former involves more than two dozen Colorado businesses and organizations. FRCC also has a welding program and also trains student in entry-level knowledge, job safety, and the “soft skills of teamwork and communication.”
The Global Energy Management (GEM) Program at the University of Colorado Denver Business School is a hybrid-online Master of Science (MS) degree program designed to develop future leaders in the energy industry. Students who want an “energy MBA” enroll in GEM because it o� ers graduate business courses (accounting, fi nance, strategic management, marketing, economics, etc.) focused on the energy industry. The impetus for GEM, which is now 5 years old, was that key companies in Denver (Encana, DCP, etc.) saw potential leadership challenges tied to market growth, baby boomer retirement, and a smaller demographic of people getting into the energy industry.106
Colorado School of Mines, Colorado State University, University of Colorado, and University of Denver, which are the state’s major research institutions, have engineering programs aimed at meeting the Colorado energy industry’s workforce needs. Colorado ranks fi fth in the nation in the share of its workforce engaged in engineering occupations, and the Colorado School of Mines is among the top 10 schools graduating petroleum engineers. In 2010, an estimated 9,288 students graduated with an engineering degree or certifi cate from Colorado academic institutions. In addition to training engineers, these research universities are also doing research relevant to the unconventional energy industry, in which students gain research experience that enables them to go into research and development positions within industry. For example, the Colorado Energy Research Institute at Colorado School of Mines has many student researchers working on developing cleaner solutions to unconventional energy production, including better management of produced water and methane emissions capture and control. 107
104 See www.aims.edu/academics/aet/oil-gas/ The grant runs out at the end of September 2014, however. Phone interview, Aims Community College, May 29, 2014.
105 See www.frontrange.edu. Also, phone interview, May 27, 2014.
106 See www.ucdenver.edu/academics/colleges/business/degrees/ms/gem/Pages/ Overview.aspx. GEM’s hybrid-online delivery method allows professionals from around the world to earn their master’s degree. At the beginning of each quarter, GEM students travel to Denver for four days (Friday-Monday) to meet for classes. Students then return home and complete the remainder of their coursework in online collaboration.
107 Phone interview, May 30, 2014.
© 2015 IHS 53 June 2015
IHS Economics | Supplying the Unconventional Revolution: Sizing the unconventional oil and gas supply chain—Part II. Workforce readiness
Conclusion The IHS study, Sizing the Unconventional Revolution, found that unconventional oil and gas development is projected to grow at unprecedented levels through the next decade. Building on this work, the IHS-High Road Strategies project team examined the workforce implications of this growth, in response to employers across the supply chain increasingly concerned about the di� culty of fi nding workers with the needed skills. In particular, the team identifi ed and evaluated major workforce readiness challenges, the critical occupational and skill shortages confronting employers throughout the supply chain, and the workforce development and training programs—public and private—initiated at the state and federal levels to address these challenges.
Workforce challenges First, the project team identifi ed eight workforce challenges that a� ect the ability of many unconventional oil and gas supply chain employers to fi ll high-demand occupations. The primary challenge is fi nding su� cient numbers of qualifi ed local workers. Although state and local workforce readiness capacity has grown to meet rising demand for upstream skilled workers since energy fi rms fi rst started drilling, a number of challenges still limit the availability of qualifi ed local workers in many key occupations. In addition, as the economy recovers, supply chain employers face increasing competition for skilled workers from employers in other oil and gas and nonenergy-related construction, manufacturing, and transportation industries.
While the list of challenges is consistent across the states examined, the magnitude of the challenges varies in proportion to the stage of unconventional energy development in a producing state. The challenges also vary across industry sectors and occupations in the supply chain. Several challenges are not unique to the unconventional energy sector. Finding workers with “soft skills” and able to meet behavioral criteria, replacing an aging and retiring workforce, and the “cultural bias” in educational attitudes favoring four-year college degrees over career and technical education for trades workers, are commonly reported problems in the energy, construction, manufacturing and transportation, sectors that include key industries in the unconventional energy supply chain. Other challenges are more specifi c to unconventional energy supply chain activity, such as rapid technological change, di� cult working conditions and worker burnout, and the standardization of operator qualifi cations.
Core and high-demand occupationsSecond, the project team identifi ed and evaluated 73 core occupations out of a wide spectrum of occupations throughout the unconventional oil and gas supply chain. These core occupations are defi ned as those most directly a� ected by changes in economic activity in the fi ve core supply chain sectors; they encompass a wide spectrum of skill levels, education and training requirements, and wage and salary levels. While several core occupations are required in multiple sectors across the supply chain, others are concentrated in only a few. At the same time, in each core sector, a small number of occupations specifi cally relevant to its activities account for the bulk its employment.
The project team then identifi ed 24 occupations that pose the greatest skill shortage challenge for supply chain employers. These high-demand occupations (HDOs) span all the upstream, midstream, and downstream industries in the unconventional energy supply chain. They account for most of the top-employing occupations in each of the fi ve core sectors and nearly three-quarters of total jobs in the core occupations, though this share varies widely across sectors. Well services have the greatest concentration of HDOs, including service unit operators, derrick operators, roustabouts, rotary drill operators and fi rst-line supervisors. Some occupations such as heavy and tractor-trailer truck drivers and welders are in high demand throughout the supply chain. Others, such as construction laborers, operating engineers, petroleum engineers, and electrical and electronic engineering technicians, are mainly found in specifi c sectors.
© 2015 IHS 54 June 2015
IHS Economics | Supplying the Unconventional Revolution: Sizing the unconventional oil and gas supply chain—Part II. Workforce readiness
State occupational trends• The composition of the core occupation and HDO lists are consistent nationally and across the states.
However, the project team found that, in comparing states with large unconventional plays—Pennsylvania, Texas, Ohio, Colorado, and Louisiana—and Illinois, a nonproducing state—the employment levels of core and HDOs vary according to the state’s industrial composition and stage of unconventional development. For each state, total HDO employment fell less than non-HDO employment in the recession years, 2007–10, and grew much faster after, 2010-2013. These trends refl ect, fi rst, the impact of the Great Recession on energy, manufacturing, and construction industries, and then the post-recession rebound in these sectors. The growth of unconventional activity clearly contributed to these trends, as well.
• Texas, Pennsylvania, and Louisiana, with higher levels of unconventional energy development, lead the states in core occupation and HDO employment growth.
• HDO employment in Ohio and Colorado, with less developed unconventional energy activity, has grown more slowly, and in Illinois it has never fully recovered from the recession.
• Texas, Louisiana and Colorado have higher employment in core construction and extraction occupations, refl ecting both conventional and unconventional energy activity.
• Production jobs account for the greatest share of unconventional energy supply chain employment in the large manufacturing states of Ohio and Pennsylvania and nonproducing Illinois.
• It should be noted that these trends are for all workers employed in the core upstream supply chain sectors (four-digit NAICS), and not just workers directly engaged in unconventional energy supply-chain activities.
Employment projections and occupational demandThe methodology used by the project team in its employment forecasts over the 2012–25 period allows for a better estimate of occupational employment patterns at the national level than used to calculate recent employment trends, as the estimate refl ects jobs directly engaged in unconventional energy supply chain activities. Total core occupation and HDO employment are each projected to grow by over 40% in the forecast period, the former from about 226,000 to over 324,000 jobs, the latter from about 167,000 to over 237,000 by 2025: an increase in demand for 70,000 new workers in HDOs.
The patterns of core and HDO employment refl ect the patterns of economic growth for the core supply chain sectors projected by the IHS economic study. For example, jobs in well services—primarily extraction and some construction occupations—and in the construction of upstream facilities are expected to grow substantially, as the number of new wells continues to rise. Jobs in the other core supply chain sectors—capital goods, materials, logistics and professional services—will also grow at healthy rates. In contrast, employment in occupations engaged in the construction of pipelines, manufacturing facilities, and other structures is expected to decline after 2016, by over 80%, as most of the supporting infrastructure will have been built.
The employment forecasts for individual HDOs also refl ect the relative demand for these occupations due to economic growth in the core sectors: • Employment for well services, machinists in capital goods and materials, and heavy-truck drivers, bus and
truck mechanics, and mobile heavy equipment mechanics in the logistics and materials sectors are projected to grow at the fastest rates.
• Employment for industrial machinery mechanics, mechanical engineers and electric and electronics engineering technicians—prominent in the capital goods, materials and professional services sectors—are expected to show modest but steady growth.
© 2015 IHS 55 June 2015
IHS Economics | Supplying the Unconventional Revolution: Sizing the unconventional oil and gas supply chain—Part II. Workforce readiness
• Employment for construction managers and construction laborers will initially rise and then fall o� as midstream and downstream construction is completed.
• Employment for operating engineers follows a similar trajectory, but will show a steady growth after 2016, refl ecting that HDO’s importance in several core sectors.
• Employment for welders—important in the construction, capital goods and materials sectors—high initially, falls after 2014, fl attens through 2020, and grows slowly after.
The team’s projections show that demand for most HDO jobs will grow because of replacement needs over the forecast period. Replacement needs is a measure of turnover in the labor force, as workers change employers or occupations, go back to school, retire, or leave the workforce for other reasons. Overall, supply chain employers might need to fi ll at least 118,000 new jobs in HDOs—from economic growth and replacement needs—by 2025. Heavy and tractor-trailer truck drivers would have the largest increase in demand—20,000 jobs due to economic growth and 6,000 openings due to replacement needs. Most other HDOs also will have substantial replacement needs in addition to projected job increases due to economic growth. However, some HDOs today, especially in downstream construction, may not be in high demand by 2025. For example, construction laborer and construction manager jobs are expected to decline, though because of replacement needs the former would see a net increase in demand, but the latter would still fall because of greater economic losses.
Workforce readiness challengeThe projected growth of employment in HDOs, due to both economic growth and replacement needs, raises questions about the capacity of the nation’s workforce education and training system to meet employers’ needs over the next decade. The major unconventional oil and gas producing states are especially challenged to provide the workforce programs needed to support local pools of trained workers in HDOs to service oil and gas fi rms and their supply chain.
A large variety of workforce initiatives have been started, expanded and strengthened, designed to increase the supply of skilled workers to meet current and expected growth in demand for HDOs. These take many forms, involving various private and public combinations in the unconventional energy sector, including employers, trade associations, labor unions, educational institutions, government agencies, and private workforce practitioners. Many are sponsored and operate at local and state levels, some are multistate, and a few are federally supported. Occupations targeted range from professional occupations (petroleum and mechanical engineers), to skilled construction and manufacturing trades (welders, machinists, operating engineers, pipefi tters), to construction and extraction jobs (laborers and service unit operators), to transportation (truck drivers, diesel mechanics).
It was beyond the scope of the current study to evaluate the short, middle, and long-term capabilities of these programs to meet the projected demands for workers across the spectrum of HDOs. While there is a general consensus about the serious workforce challenges confronting unconventional energy supply chain employers, the sector so far appears to be keeping up with the demand. However, it remains unclear whether market forces are su� cient to meet the growing workforce readiness needs of the unconventional energy sector over the next decade, or whether some support from state and federal policies will be required to optimize the economic growth of the unconventional energy sector, which relies on the availability of a high-skilled, well-trained workforce throughout its value chain.


© 2015 IHS 57 June 2015
IHS Economics | Supplying the Unconventional Revolution: Sizing the unconventional oil and gas supply chain—Part II. Workforce readiness
Appendix A: Methodology and approach
Identify core occupationsThe fi rst stage in our analysis was to identify a set of core occupations in the unconventional supply chain, defi ned as those that:
• Perform essential activities within the di� erent economic sectors that comprise the supply chain;
• Directly a� ect a sector’s level of output, as it would be reduced if some of the required jobs are not fi lled; and,
• Have specialized education, training, competencies, or skills, and/or experience requirements.
There is no standard, quantitative method for identifying core occupations because local labor conditions vary across the major unconventional energy formations. Most of the recent assessments of workforce needs in the unconventional energy sector, primarily done at the state level,108 indicate that their lists of relevant occupations are primarily for the core drilling and extraction fi rms, though the assessments also identify some occupations in the upstream part of supply chain, usually referred to as ancillary industries. These assessments also add a caveat that their assessment does not include jobs in midstream industries that supply equipment, materials, or services used by upstream fi rms engaged in unconventional energy drilling, extraction and production.
For example, a 2011 assessment of workforce needs associated with the Marcellus Shale in Pennsylvania by the Marcellus Shale Education and Training Center (now the Shale Training and Education Center, or ShaleTEC) estimated that over 420 workers from nearly 150 di� erent occupations are needed to perform all the operations required to produce gas from a single Marcellus Shale well.109 It then notes that while its estimate may include most of the occupations directly associated with the drilling and completion process, it “does not include many of the indirect jobs that will be created in a variety of other occupations, ranging from providing legal advice to gravel quarrying to steel pipe fabrication.”110 As illustrated in the previous chapters of this study, all of these supplier sectors fi gure prominently across producing and nonproducing states.
Identifying the industries that comprise the supply chain for unconventional oil and gas development therefore was a necessary fi rst step in determining the core occupations employed in those sectors. The list of industry sectors or NAICS codes that constitute the unconventional supply chain are presented in the fi rst section of this study.
As a fi rst step in identifying core occupations, we divided the individual economic sectors comprising the unconventional energy supply chain into nine functional categories based on similarities in the types of goods and services they provide:
1. Construction contractors;
2. Road building contractors;
3. Other transportation and distribution services;
4. Equipment manufacturers and dealers;
108 The exemption is the FMI study of the construction industry, which identifi es occupations, but is broad and international in scope. See FMI Incorporated. Skill Shortages.
109 MSETC. Pennsylvania Statewide Marcellus Shale Workforce: 28
110 Ibid.
© 2015 IHS 58 June 2015
IHS Economics | Supplying the Unconventional Revolution: Sizing the unconventional oil and gas supply chain—Part II. Workforce readiness
5. Material suppliers (steel, aggregates, sand, chemicals, cement);
6. Professional services;
7. Support services;
8. Transportation—crude oil and gas; and
9. Water and wastewater services.
Applying multiple criteria, IHS identifi ed an initial list of 71 detailed occupations (out of 840 US Bureau of Labor Statistics [BLS] occupational categories) as core occupations in the unconventional energy supply chain.
Some occupations required by supply chain economic sectors are not on the core list, primarily because they have a large supply and did not meet the defi nition of core occupations. Most of these occupations are in the services-providing sectors such as lawyers, accountants and sales persons; while they are necessary parts of the supply chain, only small shares of them are directly involved in meeting demands from the unconventional energy supply chain at any one time. There are some localized exceptions, such as specialized legal services for obtaining leases or arranging contracts with land owners.
Interview and survey stakeholdersTo validate and refi ne the initial list of core occupations, IHS solicited feedback from a range of stakeholder organizations through a series of interviews and a short survey. The goal was to draw on the experience and expertise of those organizations directly involved in the supply chain sectors, to
• Identify the most in-demand or high-priority occupations, both nationally and especially in the four states selected for focus in the study—Pennsylvania, Texas, Ohio, and Colorado—because of their large unconventional plays;
• Describe the workforce challenges confronting the supply chain sector; and
• Examine the workforce training and development e� orts and capacity, especially in the selected states, to address growing workforce needs of the unconventional energy supply chain sectors.
Nearly 50 individuals representing over 40 stakeholder groups in the unconventional energy sector and/or its supply chain provided direct input for this analysis. These included business and trade associations, individual companies (such as construction contractors, equipment manufacturers, and distributors), labor unions, workforce education and training providers, government agencies, and others. Over 30 interviews (several involving multiple individuals) were conducted and 33 surveys were completed. While many respondents represented organizations that were national (if not international) in scope, or their organizations operated in multiple states, a large number were also engaged in unconventional energy activities in the four selected states.
The stakeholder interviews included questions designed to probe more deeply into the occupational needs of supply chain sectors, and the availability and adequacy of workforce development programs, especially in selected states, to meet perceived skill challenges. Specifi c questions explored included
• Which industry occupations are the most important, and why?
• What are the associated skills and training required to meet industry criteria?
© 2015 IHS 59 June 2015
IHS Economics | Supplying the Unconventional Revolution: Sizing the unconventional oil and gas supply chain—Part II. Workforce readiness
• Which occupations currently present the greatest challenges for meeting the demand for workers with needed skills, and why?
• What is the pipeline for the core occupations in states with unconventional oil and gas plays?
• What are the strengths and weaknesses of current workforce programs in addressing the gaps in unconventional energy skills?
The survey was designed to supplement the interviews and quantitative analysis. Respondents were asked to review the initial list of core occupations and identify, from their own perspective, which occupations are very important, somewhat important, or not important for the unconventional energy supply chain. They were also asked to identify other occupations they considered important, which were not on the original list.
Review of literature and online resourcesThe IHS team conducted an extensive review of numerous reports, documents, and articles. Of particular value were multiple assessments of occupational needs and employment growth for unconventional oil and gas development in Pennsylvania,111 Ohio,112 Texas113 and Colorado,114 done either by academic research institutes or state agencies, and some sponsored by oil and gas industry associations.
Determine high-demand occupations (HDOs)An important objective was to identify which in the list of core occupations are in especially high demand. The team compared the fi ndings from multiple sources, including: 1) the statistical analyses; 2) interview and survey fi ndings; and 3) the relevant literature, particularly studies evaluating workforce needs in Pennsylvania, Texas, and Ohio.
To provide further insight, the team compared several metrics that could indicate demand for a particular occupation and appeared to be growing within a state. The metrics included trends in employment levels – up, down or stationary; annual growth rates; location quotients; trends in annual wages; and comparisons to trends in noncore occupations. Upward trends are potentially indicative of high demand for certain occupations, but demand for them may also be coming from other industries, such as conventional energy production, manufacturing, and construction.
Increases in average yearly wages for an occupation, especially relative to other occupations, might suggest growing demand—or insu� cient supply of candidates for that job. In the interviews and in some of the literature, it was frequently noted that the demand for some occupations in the unconventional energy sector had risen to such an extent—perhaps also refl ecting di� culties in ramping up the supply for those jobs—that some workers in those positions were seeing dramatic increases in their wages compared to the norm and to other occupations. Again, there could be other factors a� ecting these trends, which also had to be considered.
A complicating factor in the analysis is the evolving nature of the types of unconventional oil and gas exploration and development and the di� erent unconventional energy activities in di� erent states. An academic expert on shale energy in Ohio found it di� cult to respond to the survey because the “state is at a crossroads—moving beyond the initial drilling rush and into the earliest states of the midstream and downstream phases of the play. This requires di� erent types of skills and workers to lay pipeline and operate chemical plants.”115 Another respondent said that Ohio is about two years behind Pennsylvania in the maturity
111 For example, see: MSETC. Pennsylvania Statewide Marcellus Shale Workforce; CWIA. Fast Facts; PIOGA. “Careers in Oil and Natural Gas”; Kaufman and Fisher. Workforce Analysis Report.
112 JFS. Ohio Shale, Quarterly Economic Trends; OOGEEP. Oil and Gas Careers.
113 RRC. Eagle Ford Task Force; CCBR. Workforce Analysis for the Eagle Ford Shale.
114 BCS Incorporated. Colorado’s Energy Industry.
115 Phone interview and survey, Ohio University Voinovich School of Leadership and Public A� airs, June, 4, 2014.
© 2015 IHS 60 June 2015
IHS Economics | Supplying the Unconventional Revolution: Sizing the unconventional oil and gas supply chain—Part II. Workforce readiness
of its unconventional energy sector, which added complications regarding workforce demands and skills in a play that is straddling three levels of development.116
Similarly, the ShaleTEC study of the Marcellus Shale identifi ed three phases of development—a predrilling phase, a drilling phase, and a production phase—each having a di� erent set of occupational needs and levels of employment. Likewise, the Eagle Ford Shale study identifi ed similar distinct developmental phases—exploration, production and processing—creating varying levels of labor demand and evolving types of labor for individual industries. This in turn requires that education and training of workers remain fl exible enough to accommodate the varying needs of industry.117
Employment forecasts for core and high-demand occupationsThis section describes, step by step, the methodology used by High Road Strategies and IHS to forecast US employment in the core and high-demand occupations from 2012 to 2025 in the unconventional energy supply chain sectors.
Derive occupational employment shares by supply chain sectorIHS’s Business Markets Insight (BMI) database has forecasts of occupational employment by four-digit NAICs sectors for the United States. The historic distributions of detailed occupational employment by economic sector in the BMI are based on the Bureau of Labor Statistics (BLS) matrices of occupational employment by four-digit NAICs code. We used these matrices to determine detailed occupational employment shares for all four-digit NAICs codes, including those in the supply chain.
The BMI database generates occupational employment forecasts by industry sector in several steps:
• Annual employment forecasts are prepared by four-digit sector through 2040 that serve as caps that the detailed occupational employment for that sector must equal.
• Historical BLS occupation by industry employment matrices are used to separate out the historic employment estimates for each four-digit NAIS code by detailed occupational code.
• Growth rates for each occupation, which apply across all the economic sectors, are derived using: 1) historical rates from BLS Occupational Employment Statistics (OES) data, and 2) growth rates in BLS recent 10-year occupational forecasts. The consensus occupational growth rates are then used to forecast annual occupational employment for each four-digit sector throughout the forecast period, producing unadjusted occupational employment estimates.
• The unadjusted annual occupational forecasts are then modifi ed to fi t within the annual sector totals determined in step 1.
Employment shares are estimated across all detailed occupations so as to accurately estimate how the future occupational mix within a single supply chain sector will change over time. Since growth rates vary by individual occupations, the relative di� erences between them determine each occupation’s share of the total employment for a single economic sector in a specifi c year. We then calculated, for each four-digit NAICS sector by year, employment shares for all detailed occupational codes.
Forecast occupational employment by supply chain sectorThe economic impact assessment prepared annual employment forecasts for the United States from 2012 through 2025 for the supply chain sectors. Each sector’s annual total employment forecast was then multiplied by the occupational employment shares developed in the step above to derive annual estimates of
116 Phone interview, Zane State College, Ohio, June 26, 2014.
117 CCBR. Workforce Analysis for the Eagle Ford Shale: 11.
© 2015 IHS 61 June 2015
IHS Economics | Supplying the Unconventional Revolution: Sizing the unconventional oil and gas supply chain—Part II. Workforce readiness
detailed occupational employment by supply chain sector by year. Estimates were extracted for the core and high demand occupations.
Estimate employment in supply chain sectors that supports unconventional energy activityThe economic impact assessment also provided estimates of the shares of US employment in 2012 in each supply chain sector that directly supported unconventional energy activity. The shares were derived using purchasing patterns estimated during the economic impact assessment that traced the share of each supply chain sector’s total output that is used by the oil and gas production sector. The primary sources of purchasing patterns included:
• Input/output (I/O) coe� cients, especially from the use table;
• State by state commodity fl ow data from IHS’s Transearch database;
• Results from other recent IHS economic impact analyses of the unconventional energy sector that had described types and shares of intermediate inputs used;
• Assessments of IHS industry and energy experts with detailed knowledge of production process used to extract unconventional energy.
Because the IO coe� cients were from 2007 (i.e., before the unconventional energy sector really began to grow), and also do not separate the oil and gas extraction production sector into conventional and unconventional components, it was necessary to use the sources listed in bullets two, three and four above to estimate purchasing demands attributable to unconventional energy activity.
The shares ranged from under 1% in many of the service providing sectors (e.g., equipment leasing, scientifi c and consulting services, and wholesale trade) to 4–8% in durable manufacturing sectors benefi ting from capital spending, to over 18% in sectors closely connected to the level drilling activity such as 2131 – Support activities for mining. IHS estimates that total US employment in 2012 in the supply chain sectors, across all occupations, that directly supported unconventional energy activity was 532,491 jobs, of which 226,312 jobs were in the core occupations and 167,134 were in the high-demand occupations.
IHS assumed that the shares of 2012 employment in each supply chain sector that directly supported unconventional energy activity would remain constant through 2025. These shares may change over time as the unconventional energy sector matures and becomes more productive (i.e., fewer inputs such as steel, fracturing fl uids, and water are needed per well installed), and as drilling activity plateaus and the required distribution infrastructure is completed. However, estimating how these shares could change is speculative, and in our judgment, the prudent decision is to use the current shares by supply chain sector. The share for each sector was then multiplied by its detailed occupational employment to derive estimates of occupational employment attributable to unconventional energy demands. Finally, the occupational estimates were summed across the supply chain sectors to derive totals by occupation.
For example, the number of jobs in code 11-9021 Construction Managers, one of the 24 high-demand occupations, is forecast to decline from 6,157 jobs in 2012 to 4,324 by 2025 as infrastructure construction to support unconventional energy declines, while employment in code 49-3042 Mobile Heavy Equipment Mechanics is forecast to grow from 3,530 jobs to 5,799 jobs over the same period. Employment in the 24 high-demand occupations is expected to rise from 167,134 jobs in 2012 to 237,026 positions by 2025, a net increase of 69,892 jobs generated by economic growth in the supply chain sectors that use them.
© 2015 IHS 62 June 2015
IHS Economics | Supplying the Unconventional Revolution: Sizing the unconventional oil and gas supply chain—Part II. Workforce readiness
Forecast total demand for employment by occupation considering replacement need While there will be substantial net increases in employment in 22 of the 24 high-demand occupations between 2012 and 2025, additional positions will also have to be fi lled due to replacement needs (e.g., retirements, workers switching to other occupations or dropping out of labor force, etc.). The replacement issue is important because workforce development programs will have train enough workers to meet the gross increase in employment, which is defi ned as the net change due to economic growth plus replacement needs. The project team estimated replacement needs, and then gross employment changes, for the core and high-demand occupations using occupation-specifi c replacements rates produced by the BLS. Their replacement rates between 2012 and 2022 were adjusted to show the percentage of each occupation’s total 2012 employment that would have to be replaced each year; the annualized rates were then used to forecast replacement needs between 2012 and 2025. The total net increase in employment in high-demand occupations would be 69,892 jobs over the forecast period; an additional 48,423 positions would also have to be fi lled due to replacement needs, for a gross employment demand of 118,315 jobs. The fi ve high-demand occupations with largest absolute increases in gross employment are heavy and tractor trailer truck drivers; service unit operators; roustabouts, oil and gas; operating engineers; and machinists (see table in Appendix B).
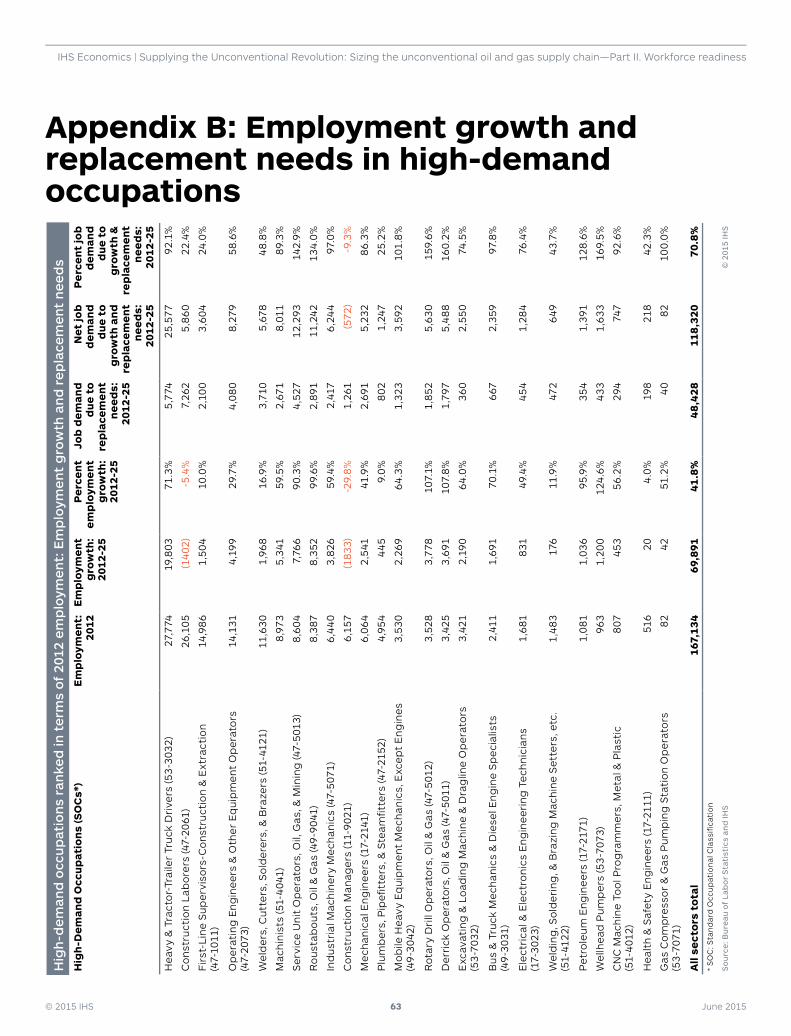
© 2015 IHS 63 June 2015
IHS Economics | Supplying the Unconventional Revolution: Sizing the unconventional oil and gas supply chain—Part II. Workforce readinessH
igh
-de
man
d o
ccu
pat
ion
s ra
nke
d in
te
rms
of
2012
em
plo
yme
nt:
Em
plo
yme
nt
gro
wth
an
d r
ep
lace
me
nt
ne
ed
sH
igh
-De
ma
nd
Occ
up
atio
ns
(SO
Cs*
)E
mp
loym
en
t:
201
2E
mp
loym
en
t g
row
th:
201
2-2
5
Pe
rce
nt
em
plo
yme
nt
gro
wth
: 2
012
-25
Job
de
ma
nd
d
ue
to
re
pla
cem
en
t n
ee
ds:
2
012
-25
Ne
t jo
b
de
ma
nd
d
ue
to
g
row
th a
nd
re
pla
cem
en
t n
ee
ds:
2
012
-25
Pe
rce
nt
job
d
em
an
d
du
e t
o
gro
wth
&
rep
lace
me
nt
ne
ed
s:
201
2-2
5
Hea
vy &
Tra
cto
r-Tr
aile
r Tr
uck
Dri
vers
(53-
3032
)27
,774
19,8
0371
.3%
5,7
7425
,57
792
.1%
Co
nst
ruct
ion
Lab
ore
rs (4
7-20
61)
26,1
05(1
402
)-5
.4%
7,26
25,
860
22.4
%
Fir
st-L
ine
Su
per
viso
rs-C
on
stru
ctio
n &
Ext
ract
ion
(47-
1011
)14
,986
1,50
410
.0%
2,10
03,
604
24.0
%
Op
erat
ing
En
gin
eer
s &
Oth
er E
qu
ipm
ent
Op
erat
ors
(4
7-20
73)
14,1
314,
199
29.7
%4,
08
08,
279
58.6
%
Wel
der
s, C
utt
ers,
So
lder
ers,
& B
raze
rs (5
1-41
21)
11,6
301,
968
16.9
%3,
710
5,67
84
8.8
%
Mac
hin
ists
(51-
40
41)
8,97
35,
341
59.5
%2,
671
8,01
189
.3%
Ser
vice
Un
it O
per
ato
rs, O
il, G
as, &
Min
ing
(47-
5013
)8,
604
7,76
690
.3%
4,52
712
,293
142.
9%
Ro
ust
abo
uts
, Oil
& G
as (4
9-9
041
)8,
387
8,35
29
9.6%
2,89
111
,242
134.
0%
Ind
ust
rial
Mac
hin
ery
Me
chan
ics
(47-
5071
)6
,44
03,
826
59.4
%2,
417
6,2
44
97.0
%
Co
nst
ruct
ion
Man
ager
s (1
1-90
21)
6,1
57(1
833)
-29.
8%1,
261
(572
)-9
.3%
Me
chan
ical
En
gin
eer
s (1
7-21
41)
6,0
64
2,5
4141
.9%
2,69
15,
232
86.3
%
Plu
mb
ers,
Pip
efi t
ters
, & S
team
fi tte
rs (4
7-21
52)
4,95
44
459.
0%8
021,
247
25.2
%
Mo
bile
Hea
vy E
qu
ipm
ent
Me
chan
ics,
Exc
ept
En
gin
es
(49
-30
42)
3,53
02,
269
64.
3%1,
323
3,59
210
1.8%
Ro
tary
Dri
ll O
per
ato
rs, O
il &
Gas
(47-
5012
)3,
528
3,7
7810
7.1%
1,85
25,
630
159.
6%
Der
rick
Op
erat
ors
, Oil
& G
as (4
7-50
11)
3,42
53,
691
107.
8%1,
797
5,4
88
160.
2%
Exc
avat
ing
& L
oad
ing
Mac
hin
e &
Dra
glin
e O
per
ato
rs
(53-
7032
)3,
421
2,19
06
4.0%
360
2,55
074
.5%
Bu
s &
Tru
ck M
ech
anic
s &
Die
sel E
ng
ine
Sp
eci
alis
ts
(49
-303
1)2,
411
1,69
170
.1%
667
2,35
997
.8%
Ele
ctri
cal &
Ele
ctro
nic
s E
ng
ine
erin
g T
ech
nic
ian
s (1
7-30
23)
1,6
8183
149
.4%
454
1,28
476
.4%
Wel
din
g, S
old
erin
g, &
Bra
zin
g M
ach
ine
Set
ters
, etc
. (5
1-41
22)
1,4
8317
611
.9%
472
649
43.7
%
Pet
role
um
En
gin
eer
s (1
7-21
71)
1,0
811,
036
95.9
%35
41,
391
128
.6%
Wel
lhea
d P
um
per
s (5
3-70
73)
963
1,20
012
4.6%
433
1,63
316
9.5%
CN
C M
ach
ine
Too
l Pro
gra
mm
ers,
Met
al &
Pla
stic
(5
1-4
012)
807
453
56.2
%29
474
792
.6%
Hea
lth
& S
afet
y E
ng
ine
ers
(17-
2111
)51
620
4.0%
198
218
42.3
%
Gas
Co
mp
ress
or
& G
as P
um
pin
g S
tati
on
Op
erat
ors
(5
3-70
71)
8242
51.2
%4
082
100.
0%
All
sect
ors
to
tal
167,
13
46
9,8
9141
.8%
48
,42
811
8,3
20
70.8
%*
SO
C: S
tan
dar
d O
ccu
pat
ion
al C
lass
ifi ca
tio
n
So
urc
e: B
ure
au o
f L
abo
r S
tati
stic
s an
d IH
S
© 2
015
IHS
Appendix B: Employment growth and replacement needs in high-demand occupations

© 2015 IHS 64 June 2015
IHS Economics | Supplying the Unconventional Revolution: Sizing the unconventional oil and gas supply chain—Part II. Workforce readiness
Appendix C: High-demand occupation profi les• To provide further insight into HDOs and their role in the unconventional supply chain, selected high-
demand occupations in the unconventional supply chain are briefl y profi led below, with discussion of a few related core occupations that are not necessarily high-demand according to the current analysis.118 These include both national projections and forecast demand for jobs in the unconventional energy supply chain sectors produced by the IHS-High Road Strategies project team.
Professional occupationsThe upstream, midstream, and downstream sectors and many of its suppliers employ a large number of workers from a wide range of di� erent professional occupations, including engineers, scientists, technicians, surveyors, lawyers, accountants and other professional services, most during upstream predrilling and drilling phases of energy production, transportation and refi ning. The equipment manufacturing and materials production sectors also employ many types of scientists, engineers, and technicians.
Petroleum Engineering is one of the most specialized, highly paid, high-demand occupations in the conventional and unconventional oil and gas supply chain. Petroleum engineers analyze oil and gas fi elds, determine drilling methods, monitor drilling and production of oil and gas, design equipment and processes, and oversee other tasks. Over two-thirds of petroleum engineers are directly engaged in oil and gas extraction, though many may work in architectural, engineering, and related services, petroleum and coal products manufacturing, other manufacturing, pipeline transportation, and other professional and business services.
According to the BLS’s Occupational Outlook, petroleum engineers are required to have a minimum of a bachelor’s degree, and received a median annual income of $130,280 in 2012, well above the national average of $46,400 for all occupations. Total US employment in this fi eld was 34,910 in 2013. The total number of petroleum engineers employed in in the supply chain that directly supports unconventional energy activity was forecast by the IHS team to grow from 1,081 jobs in 2012, to 2,118 in 2025, a 96% increase—with replacement needs of 354 jobs. This is substantially greater than the BLS’s projected growth of 26% of US jobs in this occupation between 2012 and 2022 that support all economic sectors, and even greater than the national average increase in jobs, of 11%.
Experts suggest, however, that attracting su� cient people to the fi eld is not its biggest challenge. A report of the Society of Professional Engineers (SPE) notes that, “there may be a talent gap rather than a people shortage in the industry.”119 The number of students enrolled in petroleum engineering educational programs, from undergraduate to doctoral programs, has grown dramatically over the past decade, especially since 2008 when unconventional oil and gas development began to accelerate. Total enrollment in petroleum undergraduate programs in the United States grew fi vefold between 2004 and 2014. A total of 300 bachelor’s degrees in petroleum engineering were awarded in the United States in 2004; in 2014 it is expected to be a near record of 1,527 degrees.120
Over 20 schools o� er undergraduate degrees in petroleum engineering. The top 10 account for three-quarters of all undergraduates.121 The primary workforce concern is attracting and fi lling the number of faculty positions
118 BLS’s Occupational Outlook Handbook website was the source of most of the information in occupational profi les, including the BLS’s employment projections, 2012–22. See http://www.bls.gov/ooh/.
119 R. Chase and C. Reece. “2013 SPE Forum Series: 2020 Foresight—Ensuring Educational Excellence for Upstream Engineering Resources.” Robert Chase is professor of petroleum engineering at Marietta College, Marietta, Ohio; C. Reece is SPE Management and Information Technical Director, ExxonMobil, retired. Chase and Reese were the SPE Forum Series chairpersons.
120 Chase and Reece. “2013 SPE Forum Series.”
121 Ranked in order of total enrollment, they are Texas Tech, Oklahoma, Louisiana State, Colorado College of Mines, Texas A&M, Pennsylvania State, University of Texas, University of Houston, University of Louisiana Lafayette, and University of Tulsa.
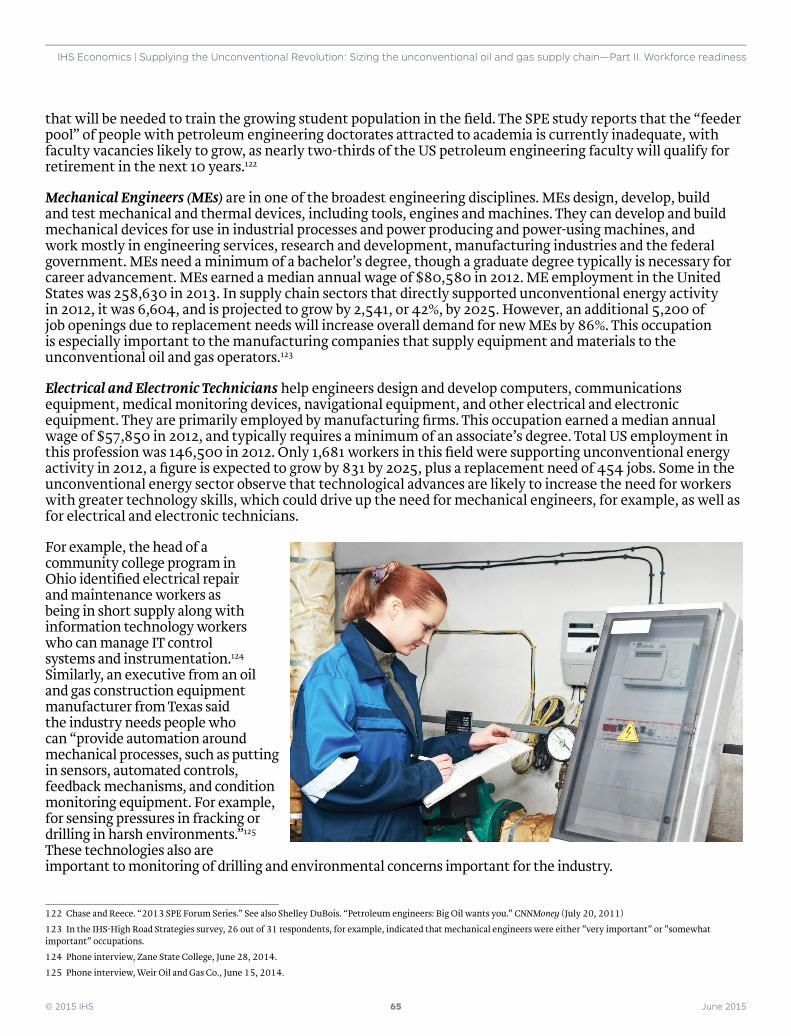
© 2015 IHS 65 June 2015
IHS Economics | Supplying the Unconventional Revolution: Sizing the unconventional oil and gas supply chain—Part II. Workforce readiness
that will be needed to train the growing student population in the fi eld. The SPE study reports that the “feeder pool” of people with petroleum engineering doctorates attracted to academia is currently inadequate, with faculty vacancies likely to grow, as nearly two-thirds of the US petroleum engineering faculty will qualify for retirement in the next 10 years.122
Mechanical Engineers (MEs) are in one of the broadest engineering disciplines. MEs design, develop, build and test mechanical and thermal devices, including tools, engines and machines. They can develop and build mechanical devices for use in industrial processes and power producing and power-using machines, and work mostly in engineering services, research and development, manufacturing industries and the federal government. MEs need a minimum of a bachelor’s degree, though a graduate degree typically is necessary for career advancement. MEs earned a median annual wage of $80,580 in 2012. ME employment in the United States was 258,630 in 2013. In supply chain sectors that directly supported unconventional energy activity in 2012, it was 6,604, and is projected to grow by 2,541, or 42%, by 2025. However, an additional 5,200 of job openings due to replacement needs will increase overall demand for new MEs by 86%. This occupation is especially important to the manufacturing companies that supply equipment and materials to the unconventional oil and gas operators.123
Electrical and Electronic Technicians help engineers design and develop computers, communications equipment, medical monitoring devices, navigational equipment, and other electrical and electronic equipment. They are primarily employed by manufacturing fi rms. This occupation earned a median annual wage of $57,850 in 2012, and typically requires a minimum of an associate’s degree. Total US employment in this profession was 146,500 in 2012. Only 1,681 workers in this fi eld were supporting unconventional energy activity in 2012, a fi gure is expected to grow by 831 by 2025, plus a replacement need of 454 jobs. Some in the unconventional energy sector observe that technological advances are likely to increase the need for workers with greater technology skills, which could drive up the need for mechanical engineers, for example, as well as for electrical and electronic technicians.
For example, the head of a community college program in Ohio identifi ed electrical repair and maintenance workers as being in short supply along with information technology workers who can manage IT control systems and instrumentation.124 Similarly, an executive from an oil and gas construction equipment manufacturer from Texas said the industry needs people who can “provide automation around mechanical processes, such as putting in sensors, automated controls, feedback mechanisms, and condition monitoring equipment. For example, for sensing pressures in fracking or drilling in harsh environments.”125 These technologies also are important to monitoring of drilling and environmental concerns important for the industry.
122 Chase and Reece. “2013 SPE Forum Series.” See also Shelley DuBois. “Petroleum engineers: Big Oil wants you.” CNNMoney (July 20, 2011)
123 In the IHS-High Road Strategies survey, 26 out of 31 respondents, for example, indicated that mechanical engineers were either ”very important” or ”somewhat important” occupations.
124 Phone interview, Zane State College, June 28, 2014.
125 Phone interview, Weir Oil and Gas Co., June 15, 2014.
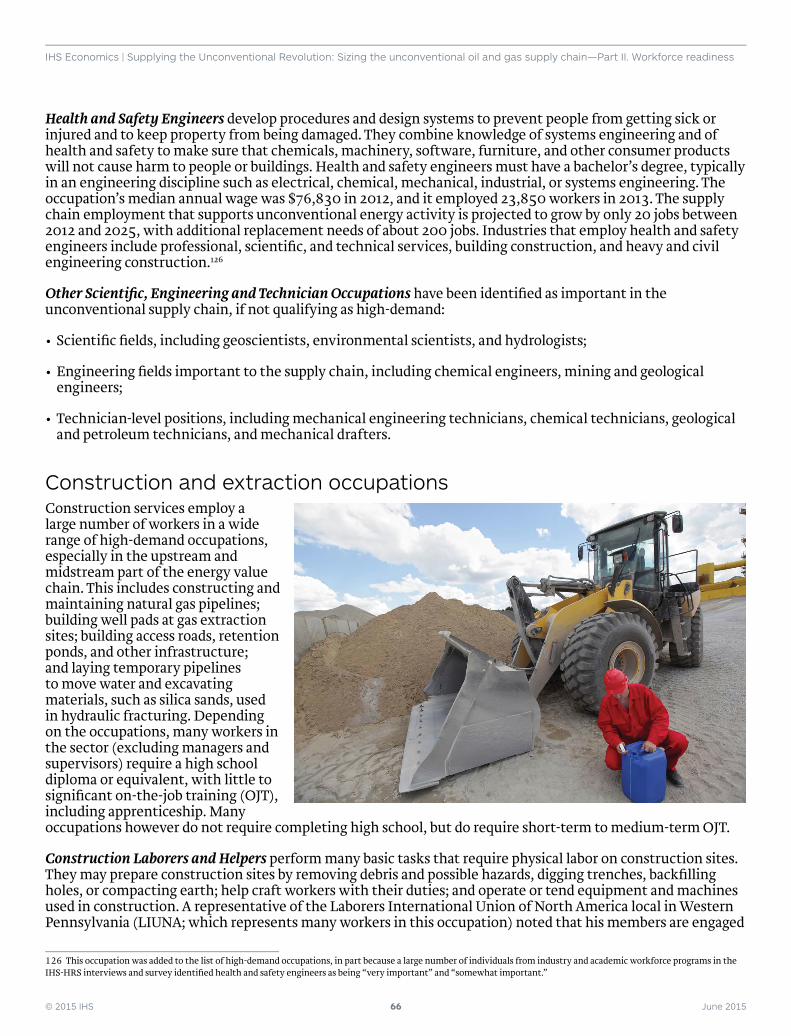
© 2015 IHS 66 June 2015
IHS Economics | Supplying the Unconventional Revolution: Sizing the unconventional oil and gas supply chain—Part II. Workforce readiness
Health and Safety Engineers develop procedures and design systems to prevent people from getting sick or injured and to keep property from being damaged. They combine knowledge of systems engineering and of health and safety to make sure that chemicals, machinery, software, furniture, and other consumer products will not cause harm to people or buildings. Health and safety engineers must have a bachelor’s degree, typically in an engineering discipline such as electrical, chemical, mechanical, industrial, or systems engineering. The occupation’s median annual wage was $76,830 in 2012, and it employed 23,850 workers in 2013. The supply chain employment that supports unconventional energy activity is projected to grow by only 20 jobs between 2012 and 2025, with additional replacement needs of about 200 jobs. Industries that employ health and safety engineers include professional, scientifi c, and technical services, building construction, and heavy and civil engineering construction.126
Other Scientifi c, Engineering and Technician Occupations have been identifi ed as important in the unconventional supply chain, if not qualifying as high-demand:
• Scientifi c fi elds, including geoscientists, environmental scientists, and hydrologists;
• Engineering fi elds important to the supply chain, including chemical engineers, mining and geological engineers;
• Technician-level positions, including mechanical engineering technicians, chemical technicians, geological and petroleum technicians, and mechanical drafters.
Construction and extraction occupationsConstruction services employ a large number of workers in a wide range of high-demand occupations, especially in the upstream and midstream part of the energy value chain. This includes constructing and maintaining natural gas pipelines; building well pads at gas extraction sites; building access roads, retention ponds, and other infrastructure; and laying temporary pipelines to move water and excavating materials, such as silica sands, used in hydraulic fracturing. Depending on the occupations, many workers in the sector (excluding managers and supervisors) require a high school diploma or equivalent, with little to signifi cant on-the-job training (OJT), including apprenticeship. Many occupations however do not require completing high school, but do require short-term to medium-term OJT.
Construction Laborers and Helpers perform many basic tasks that require physical labor on construction sites. They may prepare construction sites by removing debris and possible hazards, digging trenches, backfi lling holes, or compacting earth; help craft workers with their duties; and operate or tend equipment and machines used in construction. A representative of the Laborers International Union of North America local in Western Pennsylvania (LIUNA; which represents many workers in this occupation) noted that his members are engaged
126 This occupation was added to the list of high-demand occupations, in part because a large number of individuals from industry and academic workforce programs in the IHS-HRS interviews and survey identifi ed health and safety engineers as being “very important” and “somewhat important.”
© 2015 IHS 67 June 2015
IHS Economics | Supplying the Unconventional Revolution: Sizing the unconventional oil and gas supply chain—Part II. Workforce readiness
in most of these operations. These include residual work, such as carrying pipes to and from, putting pipes in the ground, sandbagging to protect the coating of the pipes; clearing the right of way; and building roads, which involves shoveling the asphalt or concrete, checking the grade; and cleaning up after the pipe is laid.127 Most laborers work full time. Their work is physically demanding, and they have had relatively higher rates of injuries on the job and illness.
The median annual wage for laborers was $29,160 in 2012. Construction laborer is the largest of the occupational categories in terms of employment. There were 1,284,600 workers employed as laborers in 2012. The supply chain employed 26,105 laborers in 2012 in the unconventional energy sector, but this number is expected to decline by 1,400 by 2025, a loss of about 5%. However, replacement needs of 7,300 push the total net new jobs that would need to be fi lled to 5,800. Most laborers’ positions do not have any specifi c educational requirements, but usually require some OJT. Construction laborers are mostly generalists in their work, though some, especially those who operate machines and equipment, are more likely to specialize. Laying and protecting pipes in the construction of pipelines also requires a higher degree of skill and training.
Operating Engineers (OEs) drive, maneuver, or control heavy machinery used to construct roads, bridges, buildings or other structures. OEs operate one or several types of power construction equipment, such as motor graders, bulldozers, scrapers, compressors, pumps, derricks, shovels, tractors, or front-end loaders to excavate, move and grade earth, erect structures, or pour concrete or other hard surface pavement. They also may repair and maintain loading machines that dig sand, gravel, earth or similar materials, and operate trench excavators, road graders, or similar equipment.
There were 340,950 workers employed as OEs in the United States in 2013; OEs had a median annual wage of $41,870 in 2012. Supply chain employment supporting unconventional energy activity was 14,131 jobs in 2012. The IHS team has projected an employment growth of 4,200 which, combined with replacement needs of 4,080, results in an increased demand for 8,300 new OE jobs. Becoming an OE requires a high school diploma or equivalent, plus moderate-term OJT or three-four-year apprenticeships. After completion of this training they can then go on to become journeymen workers, which o� ers them greater fl exibility and responsibility on the job. Like laborers, a high percentage of OEs belong to a union, the largest being the International Union of Operating Engineers (IUOE).
Construction equipment operators often need a commercial driver’s license (CDL) to haul their equipment to various job sites. Related operator positions include paving and surface equipment operators, who control the machines that spread and level asphalt, and pile-driver operators, who use large machines mounted on skids, barges, or cranes to hammer piles into the ground. Both of the latter two occupations are on the core occupation list, but not identifi ed as high demand.
Welders can work in construction sites and in manufacturing facilities. Their work entails welding and joining metal parts, as well as fi lling holes, indentations, or seams of metal products using hand-held metal joining equipment. Welding is a ubiquitous occupation. A related occupation, also on the core and high-demand occupation lists, is Welding, soldering, and brazing machine setters, operators and tenders, who set up, operate, or tend welding, soldering, or brazing machines or robots.
It is widely agreed that welding is a high-demand occupation for the unconventional supply chain. The domestic oil and gas boom and subsequent build-out of new pipelines has dramatically increased the demand for skilled welders. In addition, a decade of attrition within the trade has left the United States with welders who largely lack the advanced skills needed to meet performance standards required by the oil and gas industry.128
Welders’ median annual wage was $36,300 in 2012. The occupation had 352,250 US employees in 2013. Supply chain employment in the unconventional energy sector was 11,360 welders in 2012, which is projected to grow by 2,000 jobs by 2025, a 17% increase. An additional 3,700 job openings are expected by then due
127 Phone interview, LIUNA, Western Pennsylvania, June 2, 2014.
128 Philips. “Welders, America Needs You.”
© 2015 IHS 68 June 2015
IHS Economics | Supplying the Unconventional Revolution: Sizing the unconventional oil and gas supply chain—Part II. Workforce readiness
to replacement needs, making a total of 5,700 new welder positions to be fi lled by 2025. Welders need at minimum to acquire a high school diploma and varying degrees of OJT. Training can vary from a few weeks of technical school or OJT to several years of combined technical school and OJT. In 2013, manufacturing employed 61% of total welding jobs and construction accounted for 11%.
Plumbers, Pipefi tters and Steamfi tters install and repair pipes that carry liquids or gases to and in businesses, homes and factories. Pipefi tters in particular install and maintain pipes that carry chemicals, acids and gases, mostly used in manufacturing, commercial, and industrial settings. The median annual pay for this group was $49,140 in 2012. A total of 351,380 workers are employed as plumbers, pipefi tters, and steamfi tters. Supply chain employment in unconventional energy was nearly 5,000 in 2012. This fi gure is projected to grow by less than 500 jobs by 2025, however, with replacement needs of an additional 800 workers. The minimum educational requirement is a high school diploma or equivalent plus a four-fi ve-year apprenticeship. This occupation has a higher unionization rate than average, and is mainly represented by the United Association of Journeymen and Apprentices of the Plumbing and Pipe Fitting Industry of the United States and Canada.
Equipment manufacturing, maintenance, and repairThis functional group includes a range of occupations engaged in the construction services industry such as diesel mechanics and the service and repair of heavy equipment, and employees of equipment manufacturers and a number of equipment dealerships, and mechanics working for contractors.
Industrial Machinery Mechanics maintain and repair factory equipment and other industrial machinery, such as conveying systems, production machinery and packaging equipment. They also are called industrial machinery repairers or maintenance machinists, and their job is to keep machines in good working order. It numbered 306,860 employees in 2012, with a median annual wage of $46,920. The supply chain’s employment in this occupation supporting unconventional energy was 6,440 workers in 2012, and is expected to grow by 59%, to about 9,800 by 2025, with additional replacement needs of nearly 2,400 new positions. Industrial machinery mechanics require a minimum of a high school diploma and long-term OJT—they usually need a year or more of education and training after high school, and some complete two-year associates degree programs in industrial maintenance.
Related occupations are machinery maintenance workers, who do basic maintenance and repairs on machines, clean and lubricate them, and perform basic diagnostic tests. Requiring at least a high school diploma or equivalent, employers may o� er onsite training or send workers to local technical schools in addition to OJT. Millwrights, with total US employment of 38,680 in 2012, dismantle, repair, reassemble and move machinery in factories, power plants, and construction sites. This is a highly skilled occupation, which requires a high school diploma or equivalent and a four-year apprenticeship, usually o� ered by employers, local unions, contractor associations, and state labor departments.
Computer-Controlled Machine Tool Operators, Metal and Plastic, develop programs to control machining or processing of metal or plastic parts by automatic machine tools, equipment, or systems. Total US employment in this occupation in 2013 was 24,340 workers. Supply chain employment serving the unconventional energy sector was 807 in 2012, with expected growth of 453 by 2025, and replacement needs of 300 workers. This occupation is represented in several manufacturing-related industries, including machine shops, metal working, other fabricated metal product manufacturing, industrial, and aerospace.
Diesel Service Technicians and Mechanics inspect, repair, or overhaul buses or trucks, or maintain and repair any type of diesel engines. This includes mechanics working primarily with automobile or marine diesel engines. Diesel technicians are employed in motor vehicle, motor vehicle parts and supplies merchant wholesalers, and natural gas distribution industries. Several individuals, including from industry trade associations and companies, identifi ed diesel mechanics as a high-demand occupation in the interviews and survey. For example, an o� -highway equipment manufacturer and dealer in Colorado serving the oil and gas construction industry, considers mobile equipment mechanics and diesel mechanics the most important occupation. An executive from a large equipment distributors association said his “industry’s greatest
© 2015 IHS 69 June 2015
IHS Economics | Supplying the Unconventional Revolution: Sizing the unconventional oil and gas supply chain—Part II. Workforce readiness
need right now is for well-qualifi ed equipment technicians” and noted that all his organization’s “member companies recruit in all these classifi cations.”129
Employment of diesel mechanics, which had a median annual wage of $42,320 in 2012, was 238,150 in 2013. Supply chain jobs in unconventional energy totaled 2,411 in 2012 and are expected to require another 1,700 due to economic growth by 2025, plus an additional 667 workers due to replacement needs. While many mechanics learn informally on the job, employers increasingly prefer applicants who have completed postsecondary training programs in diesel engine repair. Industry certifi cation, while not required, can be an important requirement for hiring. Graduates usually advance to journeyman worker status, which gives them more control and fl exibility in their jobs.
Heavy Vehicle and Mobile Equipment Service Technicians inspect, maintain, and repair vehicles and machinery used in construction, farming, rail transportation, and other industries. Vehicles and mobile equipment are critical to many industrial activities, including construction and railroad transportation. Various types of equipment, such as tractors, cranes, and bulldozers, are used to haul materials, till land, lift beams, and dig earth to pave the way for development and construction. Relevant industries employing these technicians are mining, quarrying, oil and gas extraction, and heavy and civil engineering construction. Compared with workers in all occupations, heavy vehicle and mobile equipment service technicians had a higher share of workers who belonged to a union in 2012.
Mobile Heavy Equipment Mechanics, Except Engines diagnose, adjust, repair or overhaul mobile mechanical, hydraulic, and pneumatic equipment such as cranes, bulldozers, graders, and conveyors, used in construction, logging, and surface mining industry. Principal employers include machinery, equipment, and supplies merchant wholesalers (the largest employer), commercial and industrial and industrial machinery and equipment rental and leasing. There were 116,590 of these mechanics employed in 2013. Supply chain employment in 2012 was 3,530 jobs supporting unconventional energy, with a projected growth of about 2,300 workers by 2025 due to economic growth, and replacement needs of 1,300 workers. The median annual wage for this occupation was $46,050 in 2012.
Machinists use machine tools such as lathes, milling machines, and grinders to produce precision metal parts. There were 391,130 machinists employed in the United States in 2013, who earned a median annual wage of $39,500 in 2012. The supply chain employed nearly 9,000 machinists in 2012 due to unconventional energy demands, which is expected to increase by 60% by 2025, plus an additional 2,700 jobs due to replacement needs. Machinery manufacturing is the largest employer of machinist and related occupations, followed by machine shops and transportation equipment manufacturing. Machinists must have at least a high school diploma or equivalent. More advanced positions, such as those that use computer-controlled machinery, require employees to have basic computer skills. Training is o� ered through employer-sponsored apprenticeship programs, and some community colleges and technical schools have two-year programs to train machinists.
Management and supervisory occupationsSeveral management and supervisory positions, especially in the construction sector, are in high demand, and expected to continue to be in demand as the unconventional energy sector continues to grow.
Construction Managers are fi rst-line supervisors in the construction industry, responsible for planning, coordinating, budgeting and supervising construction projects from development to completion. Construction managers require a bachelor’s degree in a construction-related fi eld, plus construction experience—or alternatively, they can have a high school diploma and many years of work in construction trades. These workers are often called general contractors or project managers. The occupation commanded a median annual wage of $82,790 in 2012, and had 213,720 jobs in 2013. Supply chain employment was 6,157 workers in 2012 related to unconventional energy, with an expected net loss of 1,833 jobs by 2025 due to contraction
129 Phone interview, Associated Equipment Distributors (AED) Foundation, May 16, 2014.
© 2015 IHS 70 June 2015
IHS Economics | Supplying the Unconventional Revolution: Sizing the unconventional oil and gas supply chain—Part II. Workforce readiness
in downstream construction, a 30 percent decline. After replacement needs are accounted for, there is still projected to be a net loss of 572 workers in this occupation across the supply chain.
Building construction, specialty trade contractors, and heavy and civil engineering construction are the largest employers of construction managers. However, construction managers are likely to be needed in larger numbers as overall construction activities increase due to population and business growth, the growing need for infrastructure improvements (roads, bridges, sewer pipe systems upgraded), and construction activity increases to match growing unconventional energy production.
First-line Supervisors of Construction Trades and Extraction Workers directly supervise and coordinate activities of construction or extraction workers. They generally are employed by nonresidential building constructing, building equipment contractors, and other building contractors involved in highway, street and bridge construction, and other heavy and civil engineering construction industries. In the oil and gas area, petroleum and petroleum merchant wholesalers, oil and gas extraction, and pipeline transportation of crude oil also employ these supervisors—and pay them the highest wages. There were 467,130 of these supervisors employed in 2013. Median pay for this occupation was $63,860 in 2012. Supply chain employment was 14,986 workers in 2012 that supported unconventional energy activity, and is expected to grow by 1,500 workers by 2025, with additional replacement needs of 2,100 fi eld supervisors.
Industrial Production Managers is a core occupation not identifi ed as a HDO. These employees plan and direct the activities used to create a wide range of goods, such as cars, computer equipment, or paper products. They oversee the daily operations of manufacturing and related plants. They are employed in various industries such as fabricated metal manufacturing, chemical transportation equipment, machinery and food manufacturing, and earned a median annual rate of $89,190 in 2012.
Transportation and materials moving occupationsThe most important and ubiquitous transportation occupation is heavy and tractor truck-drivers, who are widely considered in high demand. Three important materials moving occupations on the high demand list are excavating and loading machine and dragline operators, wellhead pumpers, and gas compressor and gas pumping station operators. With only one exception, BLS projected these occupations to grow at somewhat higher rates than the US rate for all occupations through 2022.
Heavy and Tractor-trailer Truck Drivers transport goods from one location to another. Most are long-haul drivers and operate trucks with gross vehicle weight capacity exceeding 26,000 pounds, delivering goods over intercity routes, sometimes spanning several states. These truck drivers require a minimum of a post-secondary nondegree award, and must have CDLs. They earned a median annual wage of $38,200 in 2012. This core occupation had by far has the largest number of employees across all sectors, 1,585,300 in 2013. Supply chain employment was 27,773 workers in 2012 supporting unconventional energy activity, with an additional 19,800 new jobs expected by 2025, a jump of 71%, plus replacement needs of about 5,800 workers. According to the BLS job outlook, demand for truck drivers is expected to increase in oil and gas industries as more drivers are needed to transport materials to and from extraction sites.
Excavating and Loading Machine and Dragline Operators operate or tend machinery equipped with scoops, shovels, or buckets to excavate and load loose materials. Industries employing these operators include nonmetallic mineral mining and quarrying, highway street and bridge construction, other specialty trade contractors, natural gas distribution, and pipeline transportation of natural gas. They earned a median annual wage of $42,970 in 2012. Employment was 44,780 in 2013. Supply chain employment in 2012 was 3,411 workers supporting unconventional energy activity. An additional 2,200 jobs would be needed by 2025 due to economic growth, plus replacement needs of 360 workers.
Wellhead Pumpers operate power pumps and auxiliary equipment to produce fl ow of oil or gas from wells in oil fi eld. Employing industries include oil and gas extraction and pipeline transportation of natural gas. There were 13,410 wellhead pumpers employed in US in 2013. Supply chain employment due to unconventional energy
© 2015 IHS 71 June 2015
IHS Economics | Supplying the Unconventional Revolution: Sizing the unconventional oil and gas supply chain—Part II. Workforce readiness
demand was 963 workers in 2012, which is expected to increase by 1,200 workers by 2025, with replacement needs of a little over 400.
Gas Compressor and Gas pumping Station Operators operate steam, gas, electric motor, or internal combustion engine-driven compressors. They transmit, compress, or recover gases such as butane, nitrogen, hydrogen, and natural gas. They contribute to pipeline transportation of natural gas, oil and gas extraction, support activities for mining, and chemical and allied products merchant wholesalers. This is a small occupational group, with only 4,520 US employees in 2013. Supply chain employment in unconventional energy was also small, at 82 employees in 2012, with only an expected increase of 42 workers by 2025, plus replacement needs of 40 jobs.
Oil and gas service occupationsThese are upstream jobs directly associated with oil and gas extraction and related activities. In all cases, the BLS growth rate is substantially higher than the US average for all occupations.
Derrick Operators run rig derrick equipment and operate pumps to circulate mud through drill holes, and extract oil and gas. US employment was 22,400 in 2013. Supply chain employment serving the unconventional energy sector was 3,425 workers in 2012, with an expected growth of 3,700 new positions by 2025 due to economic growth, plus replacement needs of 1,800 new positions
Rotary Drill Operators set up or operate a variety of drills to remove underground oil and gas, or remove core samples for testing during oil and gas exploration. Employers include oil and gas extraction, and petroleum and coal products manufacturing. US employment was 27,130 in 2013. Supply chain employment was 3,528 jobs in 2012 related to unconventional energy, with a projected growth of 2,300 new jobs by 2025, and replacement needs of 1,850.
Service Unit Operators operate equipment to increase oil fl ow from producing wells or to remove stuck pipe, casing, tools, or other obstructions from drilling wells. They may also perform similar services in mining exploration. Principal employers include oil and gas extraction, machinery, equipment, and supplies merchant wholesalers, commercial and industrial machinery equipment rental and leasing industries. It had 59,260 US employees in 2013. Supply chain employment supporting unconventional energy in this occupation was 8,604 jobs in 2012, with projected growth of 7,800 jobs, a 90% increase, and replacement needs of over 4,500 additional new jobs, by 2025.
Roustabouts repair oil fi eld equipment using hand and power tools, and perform other tasks as needed—oil and gas extraction, support activities for mining, machinery, equipment, and supplies merchant wholesalers. It had 68,230 US employees in 2013. The supply chain employed 8,387 roustabouts in 2012 serving the unconventional energy sector, and is expected to add approximately another 8,400 positions, with replacement needs of 2,900, by 2025. Taken together, total job openings due to economic growth and replacement needs will equal over 11,000 jobs over the forecast period, equal to a 140% increase by 2025.
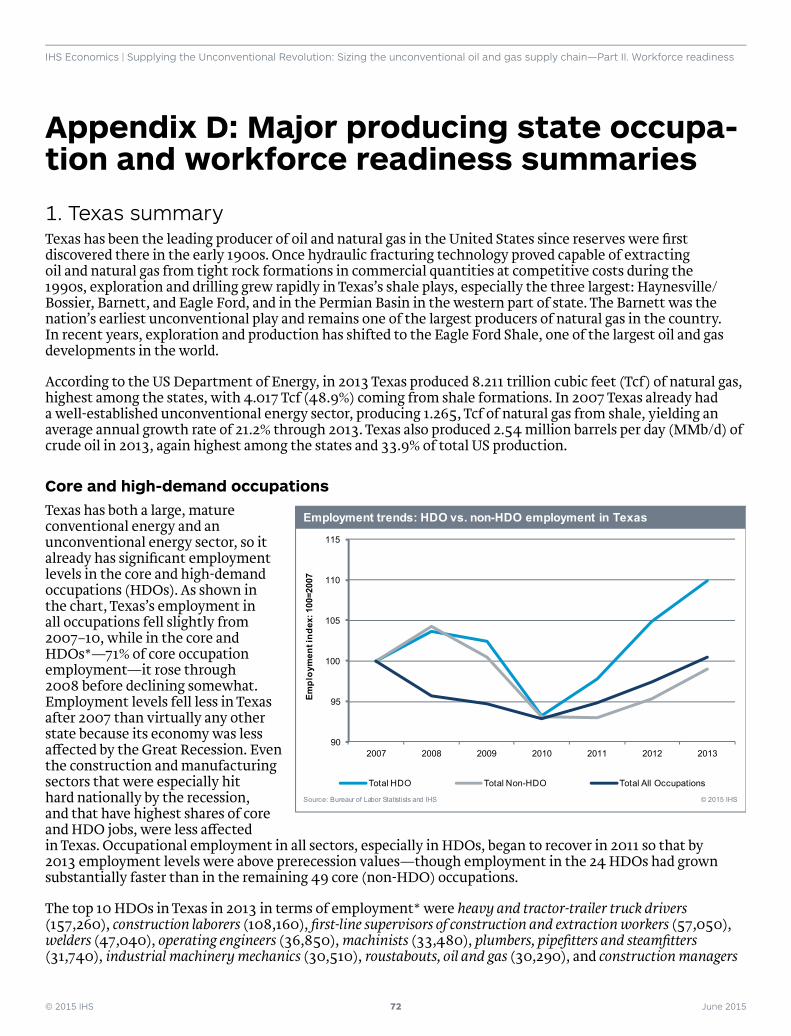
© 2015 IHS 72 June 2015
IHS Economics | Supplying the Unconventional Revolution: Sizing the unconventional oil and gas supply chain—Part II. Workforce readiness
Appendix D: Major producing state occupa-tion and workforce readiness summaries
1. Texas summaryTexas has been the leading producer of oil and natural gas in the United States since reserves were fi rst discovered there in the early 1900s. Once hydraulic fracturing technology proved capable of extracting oil and natural gas from tight rock formations in commercial quantities at competitive costs during the 1990s, exploration and drilling grew rapidly in Texas’s shale plays, especially the three largest: Haynesville/Bossier, Barnett, and Eagle Ford, and in the Permian Basin in the western part of state. The Barnett was the nation’s earliest unconventional play and remains one of the largest producers of natural gas in the country. In recent years, exploration and production has shifted to the Eagle Ford Shale, one of the largest oil and gas developments in the world.
According to the US Department of Energy, in 2013 Texas produced 8.211 trillion cubic feet (Tcf) of natural gas, highest among the states, with 4.017 Tcf (48.9%) coming from shale formations. In 2007 Texas already had a well-established unconventional energy sector, producing 1.265, Tcf of natural gas from shale, yielding an average annual growth rate of 21.2% through 2013. Texas also produced 2.54 million barrels per day (MMb/d) of crude oil in 2013, again highest among the states and 33.9% of total US production.
Core and high-demand occupationsTexas has both a large, mature conventional energy and an unconventional energy sector, so it already has signifi cant employment levels in the core and high-demand occupations (HDOs). As shown in the chart, Texas’s employment in all occupations fell slightly from 2007–10, while in the core and HDOs*—71% of core occupation employment—it rose through 2008 before declining somewhat. Employment levels fell less in Texas after 2007 than virtually any other state because its economy was less a� ected by the Great Recession. Even the construction and manufacturing sectors that were especially hit hard nationally by the recession, and that have highest shares of core and HDO jobs, were less a� ected in Texas. Occupational employment in all sectors, especially in HDOs, began to recover in 2011 so that by 2013 employment levels were above prerecession values—though employment in the 24 HDOs had grown substantially faster than in the remaining 49 core (non-HDO) occupations.
The top 10 HDOs in Texas in 2013 in terms of employment* were heavy and tractor-trailer truck drivers (157,260), construction laborers (108,160), fi rst-line supervisors of construction and extraction workers (57,050), welders (47,040), operating engineers (36,850), machinists (33,480), plumbers, pipefi tters and steamfi tters (31,740), industrial machinery mechanics (30,510), roustabouts, oil and gas (30,290), and construction managers
90
95
100
105
110
115
2007 2008 2009 2010 2011 2012 2013
Chart Title
Total HDO Total Non-HDO Total All Occupations
Employment trends: HDO vs. non-HDO employment in Texas
Source: Bureaur of Labor Statistists and IHS © 2015 IHS
Empl
oym
ent i
ndex
: 100
=200
7
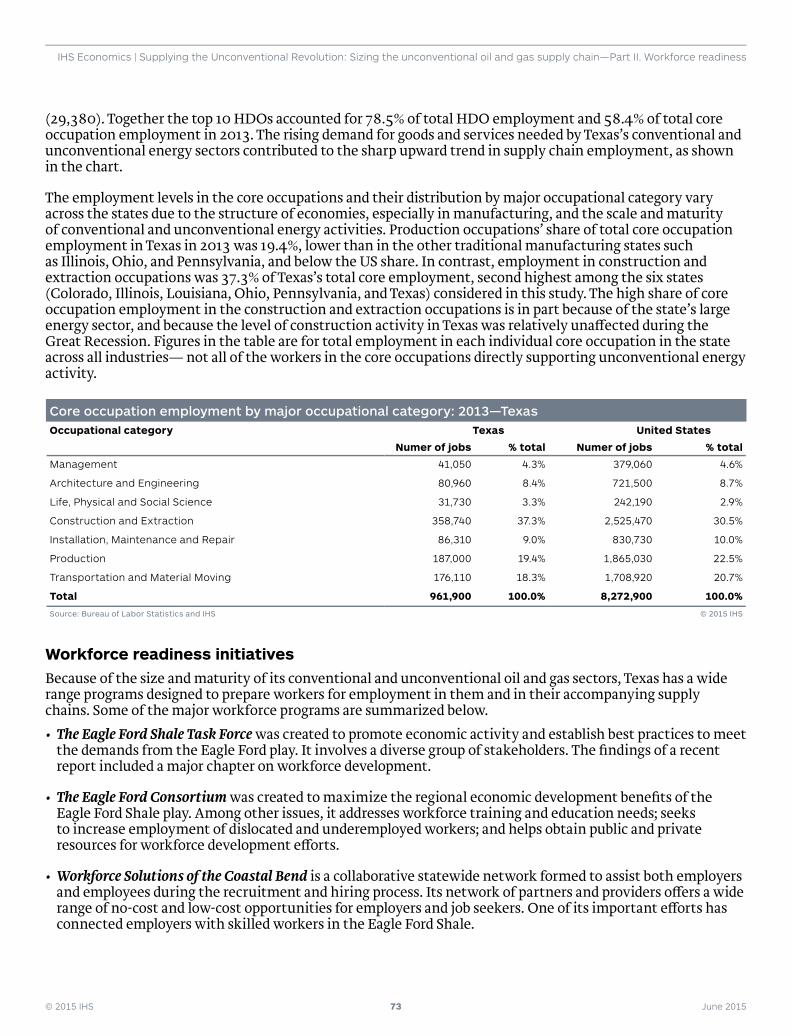
© 2015 IHS 73 June 2015
IHS Economics | Supplying the Unconventional Revolution: Sizing the unconventional oil and gas supply chain—Part II. Workforce readiness
(29,380). Together the top 10 HDOs accounted for 78.5% of total HDO employment and 58.4% of total core occupation employment in 2013. The rising demand for goods and services needed by Texas’s conventional and unconventional energy sectors contributed to the sharp upward trend in supply chain employment, as shown in the chart.
The employment levels in the core occupations and their distribution by major occupational category vary across the states due to the structure of economies, especially in manufacturing, and the scale and maturity of conventional and unconventional energy activities. Production occupations’ share of total core occupation employment in Texas in 2013 was 19.4%, lower than in the other traditional manufacturing states such as Illinois, Ohio, and Pennsylvania, and below the US share. In contrast, employment in construction and extraction occupations was 37.3% of Texas’s total core employment, second highest among the six states (Colorado, Illinois, Louisiana, Ohio, Pennsylvania, and Texas) considered in this study. The high share of core occupation employment in the construction and extraction occupations is in part because of the state’s large energy sector, and because the level of construction activity in Texas was relatively una� ected during the Great Recession. Figures in the table are for total employment in each individual core occupation in the state across all industries— not all of the workers in the core occupations directly supporting unconventional energy activity.
Core occupation employment by major occupational category: 2013—TexasOccupational category Texas United States
Numer of jobs % total Numer of jobs % total
Management 41,050 4.3% 379,060 4.6%
Architecture and Engineering 80,960 8.4% 721,500 8.7%
Life, Physical and Social Science 31,730 3.3% 242,190 2.9%
Construction and Extraction 358,740 37.3% 2,525,470 30.5%
Installation, Maintenance and Repair 86,310 9.0% 830,730 10.0%
Production 187,000 19.4% 1,865,030 22.5%
Transportation and Material Moving 176,110 18.3% 1,708,920 20.7%
Total 961,900 100.0% 8,272,900 100.0%
Source: Bureau of Labor Statistics and IHS © 2015 IHS
Workforce readiness initiativesBecause of the size and maturity of its conventional and unconventional oil and gas sectors, Texas has a wide range programs designed to prepare workers for employment in them and in their accompanying supply chains. Some of the major workforce programs are summarized below. • The Eagle Ford Shale Task Force was created to promote economic activity and establish best practices to meet
the demands from the Eagle Ford play. It involves a diverse group of stakeholders. The fi ndings of a recent report included a major chapter on workforce development.
• The Eagle Ford Consortium was created to maximize the regional economic development benefi ts of the Eagle Ford Shale play. Among other issues, it addresses workforce training and education needs; seeks to increase employment of dislocated and underemployed workers; and helps obtain public and private resources for workforce development e� orts.
• Workforce Solutions of the Coastal Bend is a collaborative statewide network formed to assist both employers and employees during the recruitment and hiring process. Its network of partners and providers o� ers a wide range of no-cost and low-cost opportunities for employers and job seekers. One of its important e� orts has connected employers with skilled workers in the Eagle Ford Shale.
© 2015 IHS 74 June 2015
IHS Economics | Supplying the Unconventional Revolution: Sizing the unconventional oil and gas supply chain—Part II. Workforce readiness
• Texas community colleges, as the backbone of the state’s workforce development system (as in many other states), work especially hard to provide training and credentials to skilled technical and trades workers, with many programs geared toward preparing them for careers in energy. A sampling of these programs includes:
• Alamo Colleges – San Antonio Area o� ers associate degrees, certifi cates and licenses in programs that prepare students for jobs and four year degrees.
• Coastal Bend College has partnered with several organizations to provide fi eld training to students who take various petroleum industry training courses, from CDL certifi cation and petroleum safety and environmental hazards, to technology/ technician management and oil spill response.
• Laredo Community College o� ers degrees and certifi cations in electrical technology, diesel engine mechanics, and an oil and gas industry specialization.
• Southwest Texas Junior College o� ers associate degrees and technical certifi cations in diesel technology, and welding.
• Del Mar College o� ers various associate degrees, certifi cations, and continuing education, including training in a number of industrials skills.
• Victoria College o� ers associate degrees and technical certifi cations in business, welding, and instrumentation technology.
• Other community colleges involved in energy sector workforce development include Navarro College, a partner in ShaleNET and Panola College, an academic partner in the Gas Compressor Association’s national workforce program. Several major universities are also involved in training students for the oil and gas and related sectors, including: Texas A&M International University (TAMIU), the University of Texas at Austin, and the University of Texas at San Antonio (USTA).
2. Pennsylvania summaryThe modern oil industry started in Pennsylvania in 1859 when the fi rst well whose only purpose was to extract oil was successfully drilled near Titusville in Venango County. Pennsylvania produced half of the world’s oil until the discovery of oil in East Texas in 1901. It continues to produce low amounts of conventional crude oil annually through 350,000 wells that have been drilled in the state since 1859, about 60,000 of which are still active. Once hydraulic fracturing technology was developed in the 1990s, energy companies began trying to extract natural gas from shale plays around the country, including the Marcellus Shale Formation, which lies under the western two-thirds of Pennsylvania and portions of New York, Ohio, and West Virginia. The ability to successfully extract natural gas from the Marcellus in commercially signifi cant quantities at a competitive cost using hydraulic fracturing was confi rmed in 2005, and the fi rst unconventional well drilled into the Marcellus began to produce natural gas in 2008. In 2013 Pennsylvania produced 3.1 Tcf of natural gas from the Marcellus Shale and other unconventional energy resources, making it the second-largest producer of natural gas in the United States, behind only Texas.
Core and high-demand occupations Pennsylvania’s unconventional energy industry is more mature that those in adjacent states of Ohio and West Virginia. As exploration and drilling activity began to accelerate in 2007, the demand also grew for workers in the unconventional energy supply chain. As in most states, Pennsylvania’s employment in all occupations fell from 2007–10 during the Great Recession, by 3.2%. Employment* in the core supply chain occupations and in high-demand occupations (HDOs)—about two-thirds of core occupation jobs—fell even more sharply, as shown in the accompanying chart. The construction and manufacturing industries, which account for the largest shares of core and HDO occupation jobs, were especially hit hard by the recession. Employment in Pennsylvania in all sectors, and in core and high-demand occupations, began to recover in 2011. By 2013
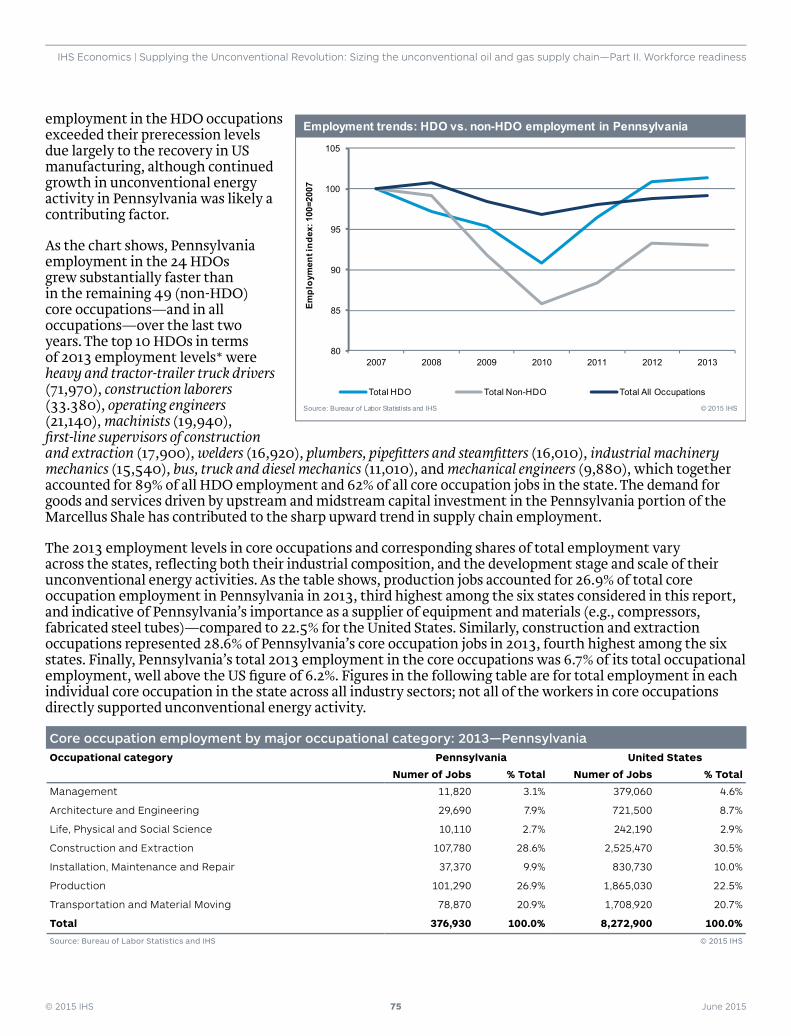
© 2015 IHS 75 June 2015
IHS Economics | Supplying the Unconventional Revolution: Sizing the unconventional oil and gas supply chain—Part II. Workforce readiness
employment in the HDO occupations exceeded their prerecession levels due largely to the recovery in US manufacturing, although continued growth in unconventional energy activity in Pennsylvania was likely a contributing factor.
As the chart shows, Pennsylvania employment in the 24 HDOs grew substantially faster than in the remaining 49 (non-HDO) core occupations—and in all occupations—over the last two years. The top 10 HDOs in terms of 2013 employment levels* were heavy and tractor-trailer truck drivers (71,970), construction laborers (33.380), operating engineers (21,140), machinists (19,940), fi rst-line supervisors of construction and extraction (17,900), welders (16,920), plumbers, pipefi tters and steamfi tters (16,010), industrial machinery mechanics (15,540), bus, truck and diesel mechanics (11,010), and mechanical engineers (9,880), which together accounted for 89% of all HDO employment and 62% of all core occupation jobs in the state. The demand for goods and services driven by upstream and midstream capital investment in the Pennsylvania portion of the Marcellus Shale has contributed to the sharp upward trend in supply chain employment.
The 2013 employment levels in core occupations and corresponding shares of total employment vary across the states, refl ecting both their industrial composition, and the development stage and scale of their unconventional energy activities. As the table shows, production jobs accounted for 26.9% of total core occupation employment in Pennsylvania in 2013, third highest among the six states considered in this report, and indicative of Pennsylvania’s importance as a supplier of equipment and materials (e.g., compressors, fabricated steel tubes)—compared to 22.5% for the United States. Similarly, construction and extraction occupations represented 28.6% of Pennsylvania’s core occupation jobs in 2013, fourth highest among the six states. Finally, Pennsylvania’s total 2013 employment in the core occupations was 6.7% of its total occupational employment, well above the US fi gure of 6.2%. Figures in the following table are for total employment in each individual core occupation in the state across all industry sectors; not all of the workers in core occupations directly supported unconventional energy activity.
Core occupation employment by major occupational category: 2013—PennsylvaniaOccupational category Pennsylvania United States
Numer of Jobs % Total Numer of Jobs % Total
Management 11,820 3.1% 379,060 4.6%
Architecture and Engineering 29,690 7.9% 721,500 8.7%
Life, Physical and Social Science 10,110 2.7% 242,190 2.9%
Construction and Extraction 107,780 28.6% 2,525,470 30.5%
Installation, Maintenance and Repair 37,370 9.9% 830,730 10.0%
Production 101,290 26.9% 1,865,030 22.5%
Transportation and Material Moving 78,870 20.9% 1,708,920 20.7%
Total 376,930 100.0% 8,272,900 100.0%
Source: Bureau of Labor Statistics and IHS © 2015 IHS
80
85
90
95
100
105
2007 2008 2009 2010 2011 2012 2013
Chart Title
Total HDO Total Non-HDO Total All Occupations
Employment trends: HDO vs. non-HDO employment in Pennsylvania
Source: Bureaur of Labor Statistists and IHS © 2015 IHS
Empl
oym
ent i
ndex
: 100
=200
7
© 2015 IHS 76 June 2015
IHS Economics | Supplying the Unconventional Revolution: Sizing the unconventional oil and gas supply chain—Part II. Workforce readiness
Workforce readiness initiativesAs in other states with major unconventional plays, public and private sector e� orts to train workers for the unconventional energy supply chain are well established in Pennsylvania.
ShaleNET is a multistate initiative designed to meet the natural gas industry’s workforce needs. Pennsylvania has participated in ShaleNET since its start in 2010, when a $4.96 million Community Based Job Training grant was awarded by the US Department of Labor to Westmoreland County Community College (WCCC). ShaleNET is now centered at the Pennsylvania College of Technology.
• Pennsylvania’s Labor and Industry Departments’ Center for Workforce Information and Analysis (CWIA) provides information on the workforce requirements of the Marcellus Shale industry. Its annual update each May on Marcellus Shale key facts provides information used by many PA workforce organizations.
• Shale Training and Education Center (ShaleTEC) is a joint program of the Pennsylvania College of Technology in Williamsport and Pennsylvania State Extension to serve as a central resource for workforce development and education needs of the community and the oil and natural gas industry.
• Pennsylvania College of Technology, located in Williamsport in north-central Pennsylvania, has established a national reputation for workforce development. Today, it manages the state’s largest worker training program through its Workforce Development and Continuing Education unit. Pennsylvania College is a founder and partner with Pennsylvania State Extension in ShaleTEC, and a member of ShaleNET.
• Westmoreland County Community College (WCCC) is located in Youngwood in western Pennsylvania and has a current enrollment of about 6,600 full-and part-time students. WCCC led the consortium of educators and industry members to create ShaleNET in 2010, with an initial grant of nearly $5 million, for training programs for entry-level jobs in the Marcellus Shale industry.
3. Ohio summaryOhio historically is a moderate producer of oil and gas. Its annual natural gas production primarily from conventional wells peaked at nearly 160 Bdf in the 1980s, but declined to the range of 70-80 Bcf today. Current interest in Ohio oil and gas exploration is focused on the Marcellus Shale and the Utica Shale. The Marcellus Formation thins under Ohio, and its impacts are limited to eastern counties. The Utica Shale covers most of the state’s eastern half and is expected to have a larger impact across Ohio. Natural gas gross withdrawals from Ohio shale gas wells were initially very small (about 10-17 million cubic feet, 2007-2010), but recently they have taken o� , reaching 88 Bcf by 2013 (US Energy Information Administration). While still small, shale gas production over the past few years is already having economic impacts, opening up thousands of new shale-related jobs.
Core and high-demand occupations While Ohio has gained from the bordering Marcellus Shale development in Pennsylvania, Ohio is at a relatively early stage of development of its Utica play—though it is has been moving beyond the initial drilling rush and into the midstream and downstream phases. As shown in the chart, Ohio’s employment in all occupations fell in 2007–10 during the Great Recession. Employment in the core supply chain occupations*—and in high-demand occupations (HDOs), about two-thirds of core occupation jobs—fell even more sharply. The construction and extraction and especially manufacturing sectors, which account for the largest shares of core supply chain jobs, were especially hit hard by the recession. Employment in all sectors, and especially in core and high-demand occupations, began to recover in 2011, although it has not yet returned to prerecession levels.
It is notable that employment in the supply chain’s 24 HDOs is growing substantially faster than that of the remaining 49 core occupations. The top 10 HDOs in terms of employment* in Ohio are heavy and tractor-trailer truck drivers (65,550 in 2013), machinists (28,100), construction laborers (25,640), industrial machinery
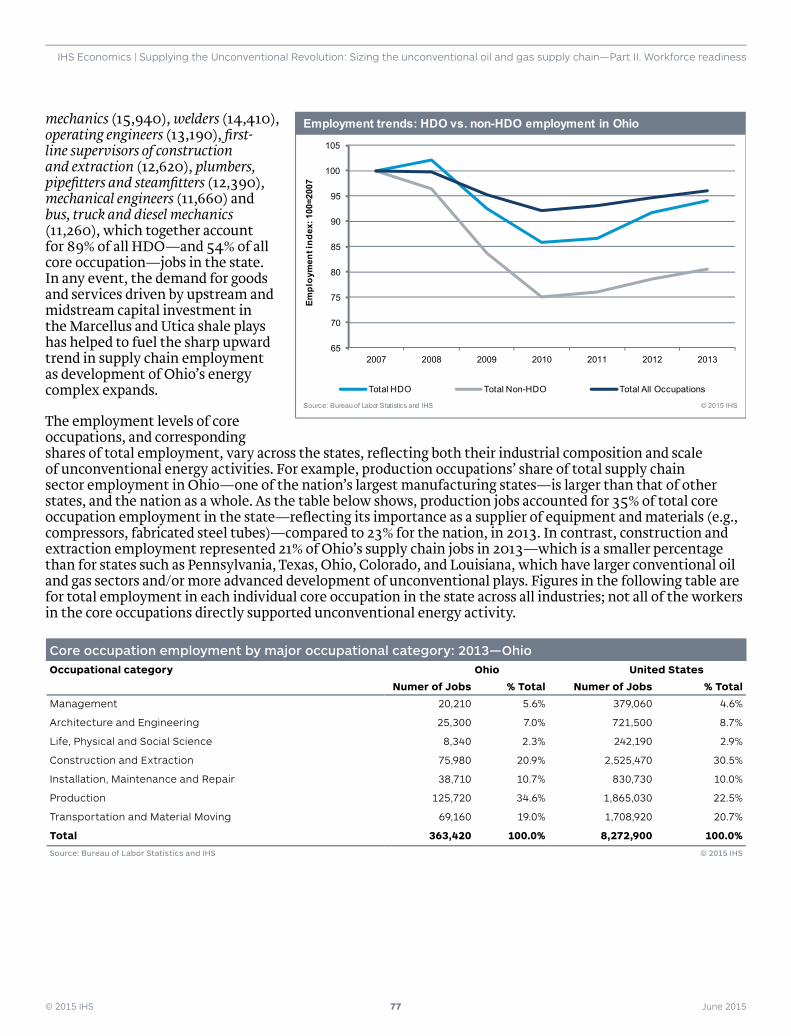
© 2015 IHS 77 June 2015
IHS Economics | Supplying the Unconventional Revolution: Sizing the unconventional oil and gas supply chain—Part II. Workforce readiness
mechanics (15,940), welders (14,410), operating engineers (13,190), fi rst-line supervisors of construction and extraction (12,620), plumbers, pipefi tters and steamfi tters (12,390), mechanical engineers (11,660) and bus, truck and diesel mechanics (11,260), which together account for 89% of all HDO—and 54% of all core occupation—jobs in the state. In any event, the demand for goods and services driven by upstream and midstream capital investment in the Marcellus and Utica shale plays has helped to fuel the sharp upward trend in supply chain employment as development of Ohio’s energy complex expands.
The employment levels of core occupations, and corresponding shares of total employment, vary across the states, refl ecting both their industrial composition and scale of unconventional energy activities. For example, production occupations’ share of total supply chain sector employment in Ohio—one of the nation’s largest manufacturing states—is larger than that of other states, and the nation as a whole. As the table below shows, production jobs accounted for 35% of total core occupation employment in the state—refl ecting its importance as a supplier of equipment and materials (e.g., compressors, fabricated steel tubes)—compared to 23% for the nation, in 2013. In contrast, construction and extraction employment represented 21% of Ohio’s supply chain jobs in 2013—which is a smaller percentage than for states such as Pennsylvania, Texas, Ohio, Colorado, and Louisiana, which have larger conventional oil and gas sectors and/or more advanced development of unconventional plays. Figures in the following table are for total employment in each individual core occupation in the state across all industries; not all of the workers in the core occupations directly supported unconventional energy activity.
Core occupation employment by major occupational category: 2013—OhioOccupational category Ohio United States
Numer of Jobs % Total Numer of Jobs % Total
Management 20,210 5.6% 379,060 4.6%
Architecture and Engineering 25,300 7.0% 721,500 8.7%
Life, Physical and Social Science 8,340 2.3% 242,190 2.9%
Construction and Extraction 75,980 20.9% 2,525,470 30.5%
Installation, Maintenance and Repair 38,710 10.7% 830,730 10.0%
Production 125,720 34.6% 1,865,030 22.5%
Transportation and Material Moving 69,160 19.0% 1,708,920 20.7%
Total 363,420 100.0% 8,272,900 100.0%
Source: Bureau of Labor Statistics and IHS © 2015 IHS
65
70
75
80
85
90
95
100
105
2007 2008 2009 2010 2011 2012 2013
Chart Title
Total HDO Total Non-HDO Total All Occupations
Employment trends: HDO vs. non-HDO employment in Ohio
Source: Bureau of Labor Statistics and IHS © 2015 IHS
Empl
oym
ent i
ndex
: 100
=200
7
© 2015 IHS 78 June 2015
IHS Economics | Supplying the Unconventional Revolution: Sizing the unconventional oil and gas supply chain—Part II. Workforce readiness
Workforce readiness initiativesCompared to other states with major unconventional plays (Pennsylvania, Texas), public and private sector e� orts to assess and take advantage of these opportunities are just getting started. The Ohio Department of Jobs and Family Services (JFS) is working with workforce investment areas, community colleges, other post-secondary educational institutions and employers to identify HDOs in the unconventional energy sector and put in place appropriate training programs. Notable workforce readiness initiatives in Ohio include
• The Ohio Oil and Gas Energy Education Program (OOGEEP) is a statewide education and public organization sponsoring a variety of programs to provide factual information about the crude oil and natural gas industry. Programs include teacher workshops, scholarships, student education, fi refi ghting training, industry training, and workforce development, among others.
• Zane State, in Zanesville and Cambridge, o� ers a variety of two-year associate degree programs, certifi cate programs, and occupational skills training in the energy fi eld and relevant high-demand occupations. Zane is also an academic partner of the Gas Compressor Association.
• Stark State College, in Canton, o� ers associate degrees, certifi cates and professional development in energy high-demand occupations. A member of ShaleNET, a federally supported national workforce training partnership for the oil and natural gas industry, it provides programs in industrial process technology, pipeline technology, petroleum technology and many other related fi elds.
• Career and Technology Education Center (C-TEC) of Licking County, a state and federally funded one-year career and technical school serving Licking County citizens and industry, o� ers certifi cate programs in high-demand conventional and unconventional energy skilled trades.
• Central Ohio Technical College, in Newark, has expanded its training programs, adding 70 people to its welding program and another 50 for machinist training; certifi cate programs designed by energy supplier companies that contribute to the cost.
• Chevron’s Appalachia Partnership Initiative is a $20 million program to improve education and technical training to meet the workforce needs of the energy industry and related manufacturing industries across southwestern Pennsylvania, northern West Virginia and eastern Ohio.
4. Colorado summaryColorado has abundant conventional and unconventional oil and gas resources. Oil production, after declining to under 20 million barrels per year by 2000, began to increase again in 2002, and accelerated rapidly in 2008 as hydraulic fracturing and horizontal drilling technologies proved commercially competitive. By 2012 the state’s oil output surpassed the earlier peak, reaching 49 million barrels per year—and nearly 65 million barrels per year in 2013—coming mainly from the Wattenberg oil fi eld, and from the Niobrara Shale, which is primarily an oil play. The Niobrara play is in the early stage of development. The Green River Formation in the northwest part of the state has some of the richest oil shale deposits in the world, with estimated reserves of 640 billion barrels of oil in Colorado alone.
Natural gas production has grown steadily since 1990. According to the US Department of Energy, in 2013 Colorado produced 1.604 trillion cubic feet (Tcf) of natural gas, seventh highest among the states, but with only 0.247 Tcf (15.4%) coming from shale formations. Between 2007 and 2013 the amount of natural gas that Colorado obtained from shale formations increased at an average annual growth rate of 10.1%. Colorado also produced 178,000 b/d of crude oil in 2013, eighth highest among the states and 2.4% of total US production. Between 2007 and 2013, crude oil production in Colorado increased by 147.2%; a signifi cant share of this growth is attributed by the US Energy Information Administration (EIA) to the increasing use of hydraulic fracturing and horizontal drilling.
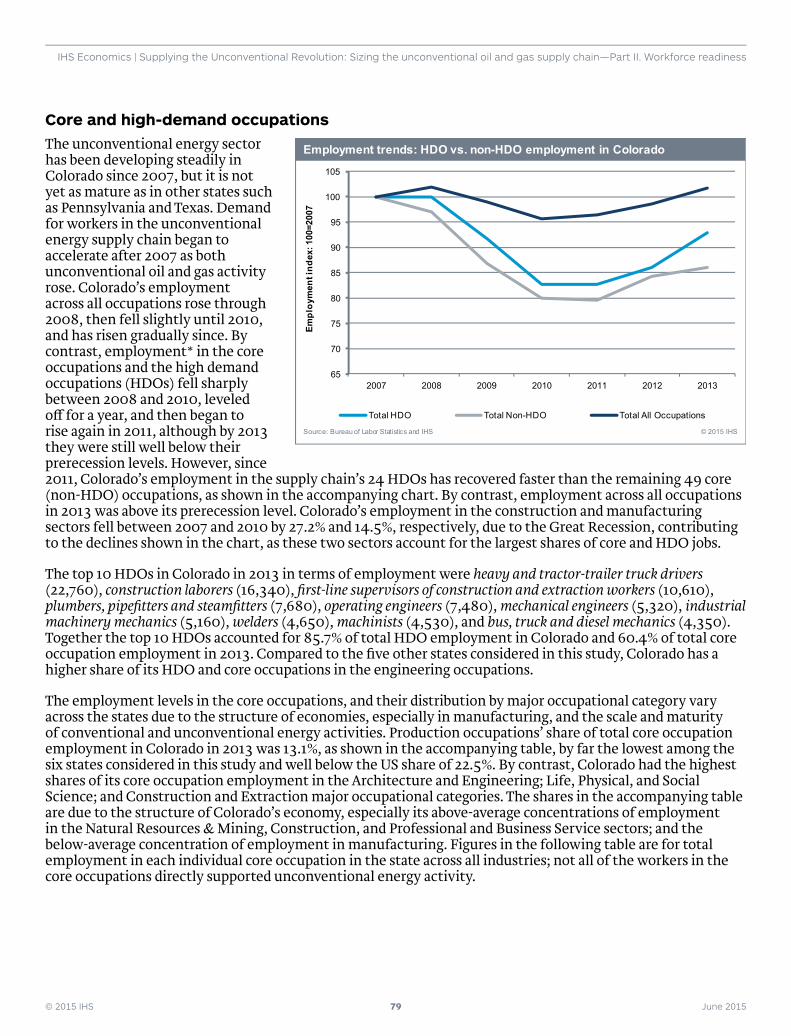
© 2015 IHS 79 June 2015
IHS Economics | Supplying the Unconventional Revolution: Sizing the unconventional oil and gas supply chain—Part II. Workforce readiness
Core and high-demand occupations The unconventional energy sector has been developing steadily in Colorado since 2007, but it is not yet as mature as in other states such as Pennsylvania and Texas. Demand for workers in the unconventional energy supply chain began to accelerate after 2007 as both unconventional oil and gas activity rose. Colorado’s employment across all occupations rose through 2008, then fell slightly until 2010, and has risen gradually since. By contrast, employment* in the core occupations and the high demand occupations (HDOs) fell sharply between 2008 and 2010, leveled o� for a year, and then began to rise again in 2011, although by 2013 they were still well below their prerecession levels. However, since 2011, Colorado’s employment in the supply chain’s 24 HDOs has recovered faster than the remaining 49 core (non-HDO) occupations, as shown in the accompanying chart. By contrast, employment across all occupations in 2013 was above its prerecession level. Colorado’s employment in the construction and manufacturing sectors fell between 2007 and 2010 by 27.2% and 14.5%, respectively, due to the Great Recession, contributing to the declines shown in the chart, as these two sectors account for the largest shares of core and HDO jobs.
The top 10 HDOs in Colorado in 2013 in terms of employment were heavy and tractor-trailer truck drivers (22,760), construction laborers (16,340), fi rst-line supervisors of construction and extraction workers (10,610), plumbers, pipefi tters and steamfi tters (7,680), operating engineers (7,480), mechanical engineers (5,320), industrial machinery mechanics (5,160), welders (4,650), machinists (4,530), and bus, truck and diesel mechanics (4,350). Together the top 10 HDOs accounted for 85.7% of total HDO employment in Colorado and 60.4% of total core occupation employment in 2013. Compared to the fi ve other states considered in this study, Colorado has a higher share of its HDO and core occupations in the engineering occupations.
The employment levels in the core occupations, and their distribution by major occupational category vary across the states due to the structure of economies, especially in manufacturing, and the scale and maturity of conventional and unconventional energy activities. Production occupations’ share of total core occupation employment in Colorado in 2013 was 13.1%, as shown in the accompanying table, by far the lowest among the six states considered in this study and well below the US share of 22.5%. By contrast, Colorado had the highest shares of its core occupation employment in the Architecture and Engineering; Life, Physical, and Social Science; and Construction and Extraction major occupational categories. The shares in the accompanying table are due to the structure of Colorado’s economy, especially its above-average concentrations of employment in the Natural Resources & Mining, Construction, and Professional and Business Service sectors; and the below-average concentration of employment in manufacturing. Figures in the following table are for total employment in each individual core occupation in the state across all industries; not all of the workers in the core occupations directly supported unconventional energy activity.
65
70
75
80
85
90
95
100
105
2007 2008 2009 2010 2011 2012 2013
Chart Title
Total HDO Total Non-HDO Total All Occupations
Employment trends: HDO vs. non-HDO employment in Colorado
Source: Bureau of Labor Statistics and IHS © 2015 IHS
Empl
oym
ent i
ndex
: 100
=200
7
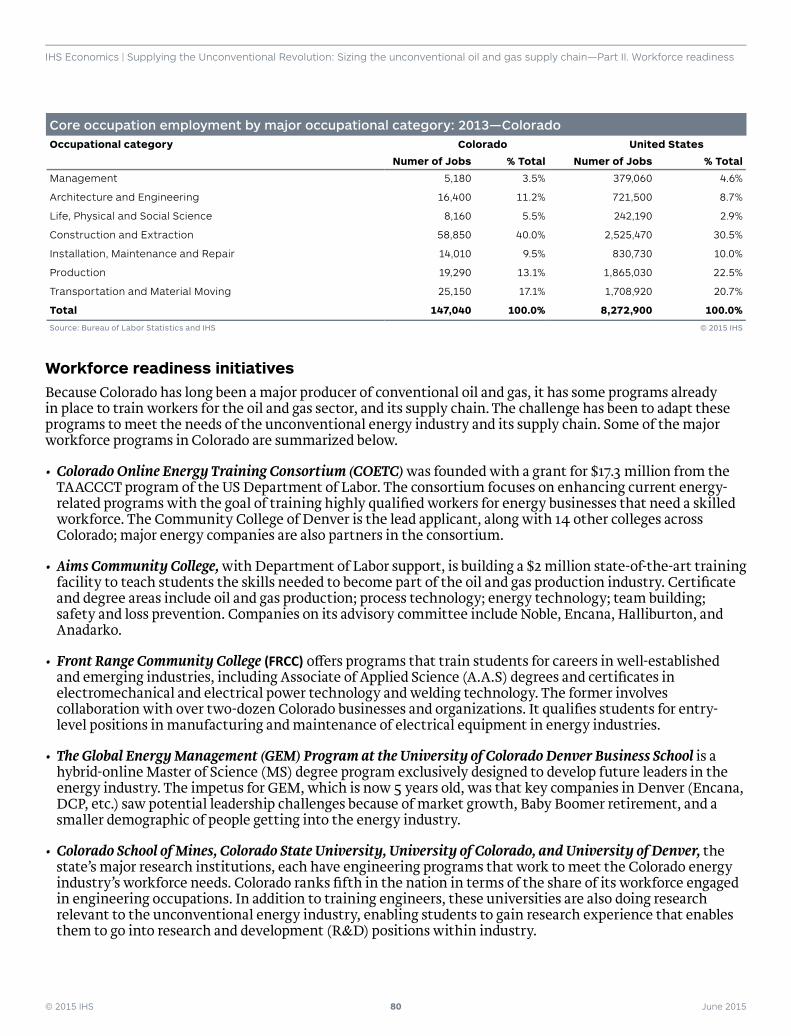
© 2015 IHS 80 June 2015
IHS Economics | Supplying the Unconventional Revolution: Sizing the unconventional oil and gas supply chain—Part II. Workforce readiness
Core occupation employment by major occupational category: 2013—ColoradoOccupational category Colorado United States
Numer of Jobs % Total Numer of Jobs % Total
Management 5,180 3.5% 379,060 4.6%
Architecture and Engineering 16,400 11.2% 721,500 8.7%
Life, Physical and Social Science 8,160 5.5% 242,190 2.9%
Construction and Extraction 58,850 40.0% 2,525,470 30.5%
Installation, Maintenance and Repair 14,010 9.5% 830,730 10.0%
Production 19,290 13.1% 1,865,030 22.5%
Transportation and Material Moving 25,150 17.1% 1,708,920 20.7%
Total 147,040 100.0% 8,272,900 100.0%
Source: Bureau of Labor Statistics and IHS © 2015 IHS
Workforce readiness initiativesBecause Colorado has long been a major producer of conventional oil and gas, it has some programs already in place to train workers for the oil and gas sector, and its supply chain. The challenge has been to adapt these programs to meet the needs of the unconventional energy industry and its supply chain. Some of the major workforce programs in Colorado are summarized below.
• Colorado Online Energy Training Consortium (COETC) was founded with a grant for $17.3 million from the TAACCCT program of the US Department of Labor. The consortium focuses on enhancing current energy-related programs with the goal of training highly qualifi ed workers for energy businesses that need a skilled workforce. The Community College of Denver is the lead applicant, along with 14 other colleges across Colorado; major energy companies are also partners in the consortium.
• Aims Community College, with Department of Labor support, is building a $2 million state-of-the-art training facility to teach students the skills needed to become part of the oil and gas production industry. Certifi cate and degree areas include oil and gas production; process technology; energy technology; team building; safety and loss prevention. Companies on its advisory committee include Noble, Encana, Halliburton, and Anadarko.
• Front Range Community College (FRCC) o� ers programs that train students for careers in well-established and emerging industries, including Associate of Applied Science (A.A.S) degrees and certifi cates in electromechanical and electrical power technology and welding technology. The former involves collaboration with over two-dozen Colorado businesses and organizations. It qualifi es students for entry-level positions in manufacturing and maintenance of electrical equipment in energy industries.
• The Global Energy Management (GEM) Program at the University of Colorado Denver Business School is a hybrid-online Master of Science (MS) degree program exclusively designed to develop future leaders in the energy industry. The impetus for GEM, which is now 5 years old, was that key companies in Denver (Encana, DCP, etc.) saw potential leadership challenges because of market growth, Baby Boomer retirement, and a smaller demographic of people getting into the energy industry.
• Colorado School of Mines, Colorado State University, University of Colorado, and University of Denver, the state’s major research institutions, each have engineering programs that work to meet the Colorado energy industry’s workforce needs. Colorado ranks fi fth in the nation in terms of the share of its workforce engaged in engineering occupations. In addition to training engineers, these universities are also doing research relevant to the unconventional energy industry, enabling students to gain research experience that enables them to go into research and development (R&D) positions within industry.