IHS Chemical Bulletin - Markit · IHS CHEMICAL IHS Chemical Bulletin issue ihs.com/chemical. : / n...
16
IHS CHEMICAL IHS Chemical Bulletin 2016 issue 3 ihs.com/chemical Don’t miss out on future issues of the IHS Chemical Bulletin. Subscribe for free at: www.ihs.com/ chem-bulletin → Insights… . . . . . . . . . . . . . . . . . . . . . . . . . . . . . . . . . . . . . . . . . . . . . . . . . . . . . . . . . . . . . 6 Zero-emission vehicles “fueled” by natural gas → Insights… . . . . . . . . . . . . . . . . . . . . . . . . . . . . . . . . . . . . . . . . . . . . . . . . . . . . . . . . . . . . . 8 Opportunities for Indonesian coal to chemicals industry → Insights… . . . . . . . . . . . . . . . . . . . . . . . . . . . . . . . . . . . . . . . . . . . . . . . . . . . . . . . . . . . . 10 The changing face of the global methanol industry → Insights… . . . . . . . . . . . . . . . . . . . . . . . . . . . . . . . . . . . . . . . . . . . . . . . . . . . . . . . . . . . . 12 Modular construction for petrochemicals: “A utopia just beyond the horizon?” → Insights… . . . . . . . . . . . . . . . . . . . . . . . . . . . . . . . . . . . . . . . . . . . . . . . . . . . . . . . . . . . . 15 Polyols – finding a way through the impending supply glut Paul Pang P3 China’s “new normal”: Slower growth but strong prospects
Transcript of IHS Chemical Bulletin - Markit · IHS CHEMICAL IHS Chemical Bulletin issue ihs.com/chemical. : / n...

IHS CHEMICAL
IHS Chemical Bulletin2016 issue 3 ihs.com/chemical
Don’t miss out on
future issues of the
IHS Chemical Bulletin.
Subscribe for free at:
www.ihs.com/
chem-bulletin
→ Insights… . . . . . . . . . . . . . . . . . . . . . . . . . . . . . . . . . . . . . . . . . . . . . . . . . . . . . . . . . . . . . 6 Zero-emission vehicles “fueled” by natural gas
→ Insights… . . . . . . . . . . . . . . . . . . . . . . . . . . . . . . . . . . . . . . . . . . . . . . . . . . . . . . . . . . . . . 8Opportunities for Indonesian coal to chemicals industry
→ Insights… . . . . . . . . . . . . . . . . . . . . . . . . . . . . . . . . . . . . . . . . . . . . . . . . . . . . . . . . . . . . 10 The changing face of the global methanol industry
→ Insights… . . . . . . . . . . . . . . . . . . . . . . . . . . . . . . . . . . . . . . . . . . . . . . . . . . . . . . . . . . . . 12Modular construction for petrochemicals: “A utopia just beyond the horizon?”
→ Insights… . . . . . . . . . . . . . . . . . . . . . . . . . . . . . . . . . . . . . . . . . . . . . . . . . . . . . . . . . . . . 15Polyols – finding a way through the impending supply glut
Paul Pang P3
China’s “new normal”: Slower growth but strong prospects

IHS Chemical Bulletin
Vision & contents
2 | 2016 issue 3 | www.ihs.com
In this issue
↘ Turmoil in the energy markets, the sluggish global economy, and China’s drive toward self-su�ciency pose immediate challenges to chemical producers resulting from structural changes in investment, the supply chain, and regulation. Capacity additions will decelerate and producers will shift from organic investment to M&A. Demand will broaden worldwide and outpace supply, although the degree of change will vary significantly by value chain. In the near term, overall aggregate industry profits will drop, but they will recover as utilization rates and oil prices rise.
Chemical earnings peaked in 2014 on margins from gas-based produc-tion, but they declined 15% in 2015, mainly in the Americas and Mideast, amid stronger results in Europe and Asia. IHS Chemical expects earnings to decline another 10% this year on the combination of low energy prices and new capacity. However, earnings should improve as demand grows to meet supply during 2017–18 before peaking again as oil recovers late in the decade.
With respect to today’s chemical
© 2016 IHS: All rights reserved. No part of this publication may be reproduced or transmitted, in any form or by any means, electronic, mechanical, photocopying, recording or otherwise, or be stored in any retrieval system of any nature, without prior written permission of IHS Global Limited. Any views or opinions expressed do not necessarily represent the views or opinions of IHS Global Limited or its affiliates. Disclaimer of liability: Whilst every effort has been made to ensure the quality and accuracy of the information contained in this publication at the time of going to press, IHS Global Limited and its affiliates assume no responsibility as to the accuracy or completeness of and, to the extent permitted by law, shall not be liable for any errors or omissions or any loss, damage or expense incurred by reliance on information or any statement contained in this publication. Advertisers are solely responsible for the content of the advertising material which they submit to us and for ensuring that the material complies with applicable laws. IHS Global Limited and its affiliates are not responsible for any error, omission or inaccuracy in any advertisement and will not be liable for any damages arising from any use of products or services or any actions or omissions taken in reliance on information or any statement contained in advertising material. Inclusion of any advertisement is not intended to endorse any views expressed, nor products or services offered, nor the organisations sponsoring the advertisement. Trade marks : IHS Chemical is a trade mark of IHS Global Limited.
Americas: Tel: +1 800 447 2273
Email: [email protected]
Europe, Middle East, Africa: Tel: +44 (0) 1344 328300
Email: [email protected]
Asia Pacific: Tel: +65 6439 6000
Email: [email protected]
Chris Geisler, VP America Consulting, IHS Chemical
→ Feature… . . . . . . . . . . . . . . 3 China’s “new normal”: Slower growth but strong prospects
→ Insights…. . . . . . . . . . . . . . 6 Zero-emission vehicles “fueled” by natural gas
→ Insights…. . . . . . . . . . . . . . 8Opportunities for Indonesian coal to chemicals industry
→ Insights…. . . . . . . . . . . . . 10 The changing face of the global methanol industry
→ Insights… . . . . . . . . . . . . 12Modular construction for petrochemicals: “A utopia just beyond the horizon?”
→ Insights…. . . . . . . . . . . . . 15Polyols – finding a way through the impending supply glut
Cover credit: Shutterstock
Uncertainty heightening structural change
market, economic uncertainty and overcapacity in many areas are delaying deployment of capital for new investment, while severe capital and cash restraints on public and sovereign oil well–to-petrochemical integrated companies who have heretofore been huge investors in new facilities is significantly restrained.
Many of the diversified chemical companies are not su�ering under the same weighty pressures induced by oil and have the balance sheets or share currency to drive M&A. In today’s uncertain environment, many companies seem to be concluding that the risk of synergy capture via M&A is a better way to capture value for shareholders than deploying capital to new builds. A reassessment of capital spending is under way.
This uncertainty is likely to persist until energy markets stabilize and signal more predictable outcomes. High levels of uncertainty around energy and economic fundamentals present planners with di�cult scenarios for identifying the best path forward. During this time of heightened structural change, IHS Chemical Consulting is well placed to provide data, insight and analysis to support capital decisions.
@IHS4Chemicalwww.linkedin.com/company/ihs

www.ihs.com | 2016 issue 3 | 3www.ihs.com | 2016 issue 3 | 3
IHS Chemical Bulletin
Feature
China’s “new normal”: Slower growth but strong prospects
By Paul Pang ↘ Despite its slower economic growth over the past year, China’s chemical industry has actually performed reasonably well, benefiting from low feedstocks prices and strong domestic consumer spending.
China is the world’s largest chemical consuming country, currently accounting for over 30% of the global basic chemicals demand in 2015. China also leads demand growth with demand advancing at a rate of near 10%. This growth is significantly higher than the country’s GDP growth rate of 6.8%. majority of the demand growth is led by real consumption, driven by strong consumer spending and product substitution.
Lower commodity prices have helped stimulate economic growth. This is more apparent in the developed countries as the benefit of low commodity prices has readily been passed onto the consumers. With lower energy prices, consumers have more disposable income to spend, stimulating demand for various commodities including chemicals. This is somewhat less so in China, as lower commodity prices, especially low oil prices, have been largely o�set by higher government taxes and fatter refiner and distributor margins.
Beside higher demand from end consumers, lower chemical prices also spur growth where chemicals substitute against competing materials. With rapid falling chemical prices, consumer product manufac-turers tend to switch to lower-cost materials for cost savings and superior performance. Material substitu-tion is more apparent in China. Since most of Chinese consumer product manufacturers produce medium- to low-end products, they tend to be more cost sensitive. Beside material substitution, another important factor is displacement of recycled materials with primary materials. When primary material prices fall close to prices of recycled materials, manufacturers switch to the primary materials. China is the largest recycled material consuming country. For example,
China consumed around 17 million ton of recycled plastics in 2014. However, this consumption dropped by over 2 million tons in 2015, after a sharp decline in primary plastic prices. The decline in recycled material consumption boosted the demand for primary materials, and therefore boosted the apparent demand.
China will remain to be the key driver for chemical demand growth. Despite increasing costs, China will remain the most cost-e�ective manufacturing hub for the foreseeable future. There is no doubt that some of labor-intensive and lower-end consumer product business will migrate away from China; and some high margin and IP sensitive business will also migrate away from China. However, bulk of the manufacturing business will remain in China and continue to grow.
It has been well-known that the labor cost in China has grown at the highest rate in the world. The average labor cost has increased nearly threefold in the past 10 years. China also has the world’s highest energy prices and taxation is also very heavy. However, most people fail to realize that Chinese labor productivity has also greatly increased during the same period, o�setting most of the cost increase. Automation has become more common, reducing labor required.
Another key factor, the most important one, is industry integration. Manufacturing in China has grown into a highly complex and highly integrated business, starting from raw material manufacturing, logistics, supply, part manufacturing, assembly, to product distribution and services. China has built up a highly e�cient manufacturing cluster since China entered WTO in 2001, The integration has brought a sustainable cost advantage, despite labor cost increases, high utility costs and heavy taxation. China, as a result, will maintain its critical role as the global manufacturing floor. Even more, China will continue to upgrade its manufacturing sector and take market share from high-tech countries, such as Japan, Korea and Europe for higher-end products, including digital products, home appliances, heavy equipment, and high-speed rail.
China will continue to take advantage of its massive market size and cost competitiveness to commoditize high-end products and gain global market share. With growing manufacturing activity, I therefore believe that China will continue to lead the global demand for various raw materials, including chemicals.
China will remain the most cost-effective manufacturing hub for the foreseeable future, and therefore will remain to be the key driver for chemical demand growth
www.ihs.com | 2016 issue 3 | 54 | 2016 issue 3 | www.ihs.com 4 | 2016 issue 3 | www.ihs.com
IHS Chemical Bulletin
Feature
4 | 2016 issue 3 | www.ihs.com
Strong profitabilityMost Asian base chemical producers made a remark-able profit in 2015 and this year so far. While chemical prices have fallen throughout the year, oil prices have fallen faster, widening margins for chemical producers. The benefits of low oil did not uniformly benefit all value chains. Upstream chemicals are generally subject to higher market volatility. Downstream chemicals close to consumer products have much less volatility. As oil prices went down, basic chemical prices also went down but by a much smaller magnitude. Basic chemicals generally performed well as a result.
In China, naphtha crackers have enjoyed a very high margin in the recent history. Lower oil prices have also benefited aromatics makers, but not on the same scale as the naphtha crackers. The profitability for para-xylene improved, but overcapacity continues to depress margins. For chlor-alkali, methanol and ammonia value chains, the benefit of low energy price has been eroded by fast declining product prices. Producers in these value chains continue struggling.
In the intermediate and performance material sectors, some producers have benefited from low oil prices while others have not. Price spread between basic chemicals and intermediates/performance materials widened. In general, the chemicals used for non-durable consumer products are performing relatively well. For example, polyethylene, ethylene
glycol, polyester and styrene chains have performed well. However, those used for infrastructure and durable goods have mostly su�ered from slow demand growth and margin compression. For example, the profitability for PVC, polyurethane, paint and coating, and synthetic rubber chains have deteriorated further due to continuous capacity expansion and weak demand growth.
IHS forecasts that chemical industry will enjoy an extended period of higher-than-historical global aggregated profits in the next five years. However, the profitability will continue to vary highly by value chains and regions. In the near-term, lower crude price will depress the US and Middle East gas-based margins, and benefit Asian naphtha-based producers. However, any recovery in oil price will put pressure on Asian producers in the mid-term. In the long-term, with falling investment in chemical industry, demand will exceed capacity growth and therefore the market will get tighter going forward.
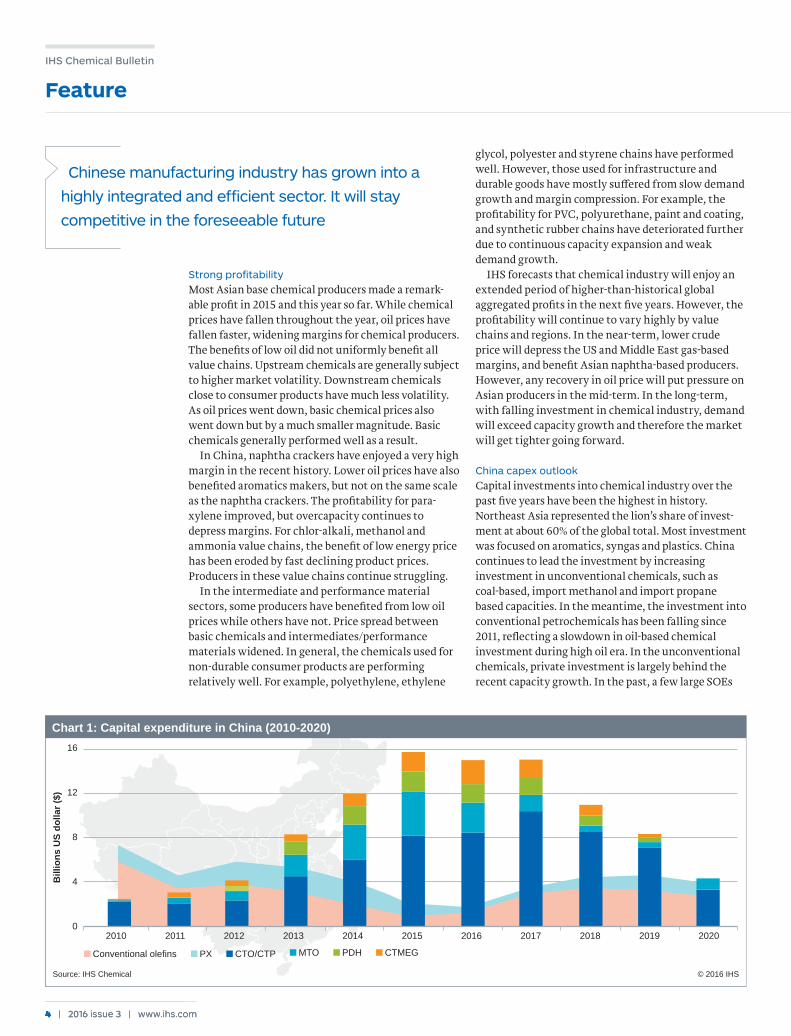
China capex outlookCapital investments into chemical industry over the past five years have been the highest in history. Northeast Asia represented the lion’s share of invest-ment at about 60% of the global total. Most investment was focused on aromatics, syngas and plastics. China continues to lead the investment by increasing investment in unconventional chemicals, such as coal-based, import methanol and import propane based capacities. In the meantime, the investment into conventional petrochemicals has been falling since 2011, reflecting a slowdown in oil-based chemical investment during high oil era. In the unconventional chemicals, private investment is largely behind the recent capacity growth. In the past, a few large SOEs
Source: IHS Chemical © 2016 IHS
16
12
8
4
02010 2011 2012 2013 2014 2015 2016 2017 2018 2019 2020
Bill
ions
US
dolla
r ($)
■ MTO ■ PDH ■ CTMEG■ PX ■ CTO/CTP■ Conventional olefins
Chart 1: Capital expenditure in China (2010-2020)
Chinese manufacturing industry has grown into a
highly integrated and efficient sector. It will stay
competitive in the foreseeable future

www.ihs.com | 2016 issue 3 | 54 | 2016 issue 3 | www.ihs.com www.ihs.com | 2016 issue 3 | 5
IHS Chemical Bulletin
Feature
www.ihs.com | 2016 issue 3 | 5
dominated the Chinese chemical industry, as they control upstream oil production, import, and refining. Recent changes in government policy and emergence of the unconventional chemicals have created an opportunity for non-SOEs to gain market share.
China chemical capital spending will begin to rapidly decelerate in 2016 (see chart 1). The wave of investment in coal chemicals will wind down, as low oil prices challenges the ability of capital return and also water supply constraint limits amount of investment in coal-rich west China. The bubble of investment into MTO and PDH will finally bust as the investors finally realize that these processes are uneconomic.
It is expected that investment in conventional petrochemical will regain momentum post 2019. Private companies will likely become more active in investing in integrated refining and petrochemical complexes. The central government recently relaxed restrictions on crude imports, allowing private companies import crude oil directly, but at a limited quota. With opening up of crude import rights, private investment will gain further market share in China.
Chinese companies continue to become more active
in investing overseas. Both SOEs and private compa-nies have been looking for investment opportunities through greenfield investment or acquisition. The main objective for overseas investment is to access resources, gain global market share, and diversify potential risk in Chinese domestic market. This trend will likely continue in the next five years, and even in the longer term.
Conclusion - New normalThe Chinese economy has slowed down, and will grow at a “new normal” moderate rate. Oil price has hit the bottom and is expected to recover. Low price has benefited some, but not all, of Chinese chemical producers. Investment in chemical industry will fall sharply in the next five years, and therefore will create a tight market toward late this decade. China will remain to be the largest growth market. With more participation by private investment, the Chinese market will become more dynamic and competitive.
Mr. Paul Pang serves as Vice President of IHS Chemical covering Mainland China, Hong Kong and Taiwan. Paul can be contacted at: [email protected].
34th AnnualWorld MethanolConferenceBudapest, HungaryOct. 1, 2016Training Workshop: Sept. 30
Low Oil Prices:Implications for the Global Methanol Industry
Register now! Visit www.ihs.com/wmc2016or contact Lynn Urban on + 1 303 397 2801 or email [email protected]

IHS Chemical Bulletin
Insights
6 | 2016 issue 3 | www.ihs.com
Zero-emission vehicles “fueled” by natural gas
↘ With an adequate supply of natural gas forecast by IHS to be available in North America, natural gas is expected to be the dominant source for both hydrogen and electric power generation in the U.S. Both hydrogen fuel cell and battery electric vehicles will likely be embraced as part of the solution in reducing carbon emissions.
The quest for more environmentally friendly means of transportation requires the shift from consuming liquid hydrocarbons to either gaseous hydrogen or electricity generated from natural gas. (see chart 1) Recent advancements in fuel cell technology and battery storage coupled with governmental incentives have enabled auto companies such as Hyundai, Toyota and Tesla to commercialize their zero emissions vehicles. These types of vehicles produce no carbon emissions at the tail pipe and are both powered by electric motors rather than internal combustion engines (ICE). To completely eliminate greenhouse gas emissions from automobile tail pipes and increase
drivetrain energy e�ciency, fuel cell electric vehicles (FCEV) or battery electric vehicles (BEV) may be the best long term solution.
Hydrogen is primarily used in the refining industry and for the production of ammonia. Using hydrogen as a fuel in the United States has been primarily limited so far to the space industry. While hydrogen can be obtained from various sources such as elec-trolysis of water and reforming of hydrocarbons or biomass, steam reforming of natural gas is the most economical process for hydrogen production. Given that the U.S. natural gas price forecast by IHS is expected to range from $2 to $4 per MMBTU, the cost of hydrogen production at a central location (including 15% return on investment) is estimated to be $1.5 to $1.8 per kg of hydrogen. Based on low heating value, 1 kg of hydrogen is equivalent to 1 gallon of conven-tional gasoline on an energy content basis. This creates opportunities to introduce vehicles that run on hydrogen fuel.
While the U.S. may have a cost advantage in hydrogen production with access to cheap natural gas, manufacturing related costs only account for about 40% of the total retail hydrogen cost. The remaining 60% of the retail cost of hydrogen is related to delivery and handling of hydrogen at a fueling station. Due to low energy density, utilizing hydrogen fuel for vehicular applications requires costly compression, storage and dispensing (CSD). The cost of CSD could account for 40% of the total retail cost of hydrogen, nearly $2 per kg of hydrogen. Including the cost of delivering hydrogen via tube trailers from the central plant, the total retail cost of hydrogen could be $4.5 per kg.
This figure may seem high compared to the price of gasoline today with crude oil prices hovering around $40 per barrel. But the commercially available FCEV vehicles have been reported to have a fuel economy twice as high as the vehicles equipped with ICEs. Toyota’s hydrogen fuel cell vehicle (Mirai) launched in 2015 in the United States has been reported to have a fuel economy of 67 miles per kg, according to the EPA estimates. This puts the cost per mile driven for Mirai around $0.07 per mile, assuming a hydrogen fuel price of $4.5 per kg. (see chart 2) Toyota’s fuel cell vehicle (Mirai) will be available in California under $60K and with rebate the price could be close to $50K. The Toyota Mirai has been reported to be capable of
By Andy Hua Yang
N atural g as
Comp ressed hy d rog en viatub e trailer Pow er transmission
H y drog en produc tion E lec tric ity produc tionW hile steam reforming of natural g as d ominates
hy d rog en p rod uction in the U SA , other p rocesses such as electroly sis of w ater and coal
g asification can b e used as w ell.
N atural g as is ex p ected to b e the d ominant source for electricity g eneration in the near
future, b ut hy d roelectric, nuclear, solar and w ind are viab le alternatives.
Hy d rog en refuelling station B attery charg ing station
Chart 1: N atural g as “ pow ered” z ero em ission v ehic les
Source: IHS Chemical © 2016 IHS

www.ihs.com | 2016 issue 3 | 7
IHS Chemical Bulletin
Insights
traveling close to 300 miles with each fill up. For Hyundai, the fuel cost is slightly higher at $0.09 per mile driven, assuming the same hydrogen fuel price and a fuel economy of 50 miles per kg. (see chart 2)
Most of the hydrogen fueling stations available today are located in California, limiting the wide spread adoption of zero emissions hydrogen fuel cell vehicles. Battery electric cars face a similar infrastruc-ture challenge. There are not enough super charging stations across the U.S. that are capable of recharging electric cars in under an hour. So most electric cars require overnight charging by connecting to the household’s grid. For example, the Tesla Model S equipped with 85 KWh battery capacity and dual chargers can be fully charged in under 5 hours by connecting to the household’s 240 volt circuit outlet. The Model S has a maximum driving range of 265 miles, according to the EPA estimates.
Unlike refueling a hydrogen fuel cell vehicle, recharging batteries always results in a loss of energy in the form of heat. Based on anecdotal evidence, it’s common to lose between 5 to 20% of energy when recharging the EV batteries. For example, if the battery charge e�ciency for an 85 KWh electric vehicle is 80%, it will require 106 KWh to fully charge the electric vehicle, wasting nearly 20 KWh during the charging process. This is an additional cost that must be factored in when estimating the cost per mile driven for battery electric cars.
The cost of electricity produced via combined cycle cogeneration in the U.S. has dropped significantly since natural gas price fell nearly from $9 per MMBTU in 2008 to about $2.5 per MMBTU in 2015. While the cost of electricity may track natural gas price, the average household pays a much higher rate than the whole sale price of electricity, 3 to 4 cents per KWh. The residential price of electricity ranged from 9-21 cents per KWh in most of the 50 states in America in
2015, according to EIA estimates. In addition to paying for the supply of power, the average household also pays a delivery charge that could be as high as the price of electricity. So the actual price of electricity including supply and delivery on the East Coast or California could be between 15 to 21 cents per KWh.
Depending on the battery charge e�ciency and the retail price of electricity (supply + delivery), the cost per mile driven for the BEV can range between $0.04 and $0.14. (see chart 2) If the price of electricity is below $0.16 per KWh, the BEV car will cost less per mile driven than the currently available FCEV cars discussed above. If the price of electricity is between $0.17-0.25 per KWh, then the BEV will be cost competitive to the FCEVs. Above $0.27 per KWh, the BEV will cost more per mile driven than the FCEV cars.
ConclusionZero emissions vehicles are an e¢ective way to reduce the consumption of carbon intensive fuels in favor of less carbon intensive natural gas. As auto companies and governments continue to incentivize the purchase of zero emissions vehicles in the U.S and Japan, the adoption of FCEV will likely increase overtime. Until retail hydrogen refueling infrastructure exists in other parts of the United States, California will remain the main market for fuel cell vehicles. Through its continual study of hydrogen production, economics, supply logistics and infrastructure development, IHS is well-positioned to provide up-to-date thinking on this complex topic.
Andy (Hua) Yang, consultant with IHS Chemical Consulting, is primarily responsible for a significant number of feasibility and market studies, competitive and financial analysis, covering a wide array of commodity and specialty chemical products. Contact Andy at: [email protected].
0. 16
0. 14
0. 12
0. 10
0. 08
0. 06
0. 04
0. 020. 100 0. 130 0. 160 0. 190 0. 220 0. 250 0. 280 0. 310 0. 340
$/m
ile
P ric e of elec tric ity , $/ K W h
■ B EV cost p er mile ■ F CEV cost p er mile at 50 mile/K G ■ F CEV cost p er mile at 67 mile/K G
95% B attery charg e efficiency
80% B attery charg e efficiency
Chart 2: F uel c ost per m ile driv en: F CE V v s BE V
Source: IHS, DOE and EPA © 2016 IHS

IHS Chemical Bulletin
Insights
8 | 2016 issue 3 | www.ihs.com
By Larry Tan ↘ Southeast Asia’s largest economy, Indonesia, is a large importer of energy and petrochemical products notwithstanding that it has a large surplus of coal resource. China has demonstrated that coal to chemicals projects make commercial sense especially when their coal resources are stranded. This article looks at how Indonesia’s abundant coal situation could provide a means towards meeting its insatiable demand for petrochemicals while recognizing their unique challenges.
Indonesia’s coal is oversupplied; prices expected to stay depressed in near term Indonesian coal miners are braced for yet another di�cult year as low prices are set to persist in the near term. Global demand has dropped about 7% to 945 million tons from 2013 when prices were at their peak. Exporting majors like Australia, Indonesia and South Africa have struggled to rein in production in order to counter weak prices. Indonesian miners (the largest exporters of thermal coal) had increased production from 2011-2014 in expectation that China’s imports would increase significantly annually. This unfortu-nately has not been the case: China’s imports of all grades of coal fell 30% in 2015 to 201.4 mil tons having fallen by 38% in the previous year, caused primarily by a 5% decline in steel demand from China’s real estate sector. Imports of coal by India have not increased at the expected rate either. As a result, coal prices delivered into South China have also fallen between 30-34% across the same period with the higher quality materials falling furthest.
Last year was the first time in two decades that
Indonesian coal output has declined. In 2014, output fell slightly before tumbling further to about 452 mil tons in 2015, resulting in a drop of over 40 mil tons in the export market. The industry is now seeking alternative use of its surplus coal supplies. Coal to chemicals opportunity could be a timely opportunity.
Coal to chemical industry is established in ChinaThe traditional route to chemicals from coal gasifica-tion has long been around in China. Products like poly-vinyl chloride from the calcium carbide/acetylene process and benzene from the coking / coal tar process are common. However, it is the new coal gasification to methanol (and then to olefins) technologies in China that has enabled new routes to make petrochemicals (see chart 1) which saw a slew of investments over the last few years in China.
Is there su�cient demand for these petrochemical products in Indonesia? Are the technologies available or suitable for Indonesia’s surplus lower ranked coal? What are the other limitations to pursuing a coal to chemicals strategy in Indonesia? What other aspects from China’s coal to chemicals success can be replicated in Indonesia?
Indonesia has demand shortfall in basic petrochemicalsIndonesia’s total domestic demand for ethylene, propylene and methanol, the petrochemical building blocks that can be made from coal gasification, is forecasted to double to more than 6 mil tons per year by 2030 from current levels. Indonesian companies are already evaluating building another world scale steam cracker in Indonesia to make petrochemical building blocks like olefins and polymers. One is even evaluat-ing the feasibility of relocating a shutdown naphtha cracker from Kaohsiung, Taiwan to Indonesia. IHS believes there is potential for at least one world scale cracker to be built in Indonesia within the next five to ten years’ time frame.
Is Indonesian coal to chemicals cost competitive? Indonesia’s coal to chemicals process has the potential to be cost e�ective. A hypothetical coal to high density polyethlene (HDPE) plant with HDPE delivered into a main Chinese port has a production cost advantage of $10 to $50 per ton compared to Asia naphtha crackers (see Chart 2). Since Indonesia is net importer of basic chemicals, there is a compelling case to develop this concept further, especially for areas
Opportunities for Indonesian coal to chemicals industry
Old coal chemicals
Calcium carbide Syn gas
Crude methanol
MTO/MTP Acetyl
Oxalate esterAcetylene
Coking
Coal tar
PVC Benzene Ammonia Methanol Ethylene Propylene Ethanol MEG
New coal chemicals
Chart 1: China leads in coal to chemical development
© 2016 IHSSource: IHS Chemical

www.ihs.com | 2016 issue 3 | 9
IHS Chemical Bulletin
Insights
with surplus coal resource.
The coal gasification technology is availableThere are three main types of coal gasification technology used in China: fixed-bed, fluidized-bed and entrained coal gasification processes.
The fixed-bed process, the earliest adopted technol-ogy, is the most common technology employed in domestic methanol and ammonia production. Most process equipment used in the fixed-bed gasification process in China are now produced domestically. Other Western-developed fixed-bed gasifiers, such as British Gas Lurgi and Lurgi Dry Ash, are also deployed. Due to the easy access to technology, low capital cost and easy operation and maintenance, this technology may continue to be deployed in some small-sized projects or expansions in the near future despite its significant disadvantages.
In the fluidized-bed process, fine-grained coal is fed continuously into the gasifier. The bed is formed by particles of ash, semi-coke and coal, and is maintained in the fluidized state via upward flow of the gasifica-tion agent. A key advantage of this process is the capability to process various feedstocks, including all grades of low rank coals with relatively high reactivity. This technology can directly process the raw coal powder with a small grain size which significantly reduces the cost for raw coal pretreatment.
In the entrained-flow coal gasification process either a dry pulverized solid, an atomized liquid or a slurry is gasified with oxygen in a co-current flow. Most types of coal are suitable for this type of gasifier due to the high operating temperatures as well as e�cient separation of the coal particles from one another. This technology is currently regarded as the most advanced mainly due to its higher e�ciency and environmental benefits. Di�erent processes developed by various companies that have been commercialized for chemical produc-tion and power generation most recently in China, Vietnam, India and South Korea.
In China, Yueyang Sinopec and Shell Coal Gasifica-tion Co. Ltd. (Dongting) joint venture has been successfully supplying syngas and steam to Baling’s fertilizer plant since 2006. The facility processes 2,000 ton per day of pulverized wide range of commercial coal and produces syngas for urea/fertilizer and caprolactam (nylon). The reliability of the gasifiers have reportedly improved through the years.
The Wison Nanjing plant started commercial production in December 2014. Additionally, Hulun-beier Jinxin (Yuntiahhua Group) will be starting up a Shell bottom-quench gasifier later this year in Inner Mongolia, processing Chinese lignite coal. Other notable lignite coal projects include Lurgi’s lignite to synthetic natural gas in North Dakota, USA and KBR Kemper County, USA’s integrated gasification
combined cycle (IGCC) using lignite for fluidized/transport gasifier.
Indonesian coal is generally found in shallower mines of just several meters deep in some cases (compared to mines in China of hundreds to over 1,000 meters underground). This would require mine fields of much larger physical areas for economic viability. Indonesian coal therefore has higher moisture content: 30-60% versus 20-30% for China’s coal and this impacts its calorific value. This requires additional pre-treatment steps and is a debit on the overall processing economics. The ‘sweet-spot’ for coal to chemicals (and liquid fuels) processing for Indonesia appears to be the 4,000-5,000 kcal/kg GAR type. These are found in large reserves throughout the provinces of East/South Kalimantan (Borneo) and South Sumatra.
SummaryChina’s successful coal to chemicals industry has the potential to be duplicated in Indonesia. The demand for end basic petrochemical products in Indonesia is growing and the shortfall is being met by imports. Coal is expected to remain in oversupply in the short to medium term, leading to lower prices, making the move into chemicals a potential option. Although Indonesian coal has a much higher moisture content than coal from China, IHS’ preliminary assessment shows that Indonesian coal to chemicals have a $20-$70 per ton cost advantage versus naphtha crackers in Asia. The technology is available for the ‘sweet-spot’ of Indonesian coal of 4,000-5,000 kcal/ kg GAR range, however such a relatively unexplored industry in Indonesia is likely to be met with challenges such as large land utilization and transport infrastructure/accessibility which must first be overcome.
Larry Tan is Managing Director, IHS Chemical Consulting (Singapore). Email: [email protected].
Note: Diyana Putri Alan (IHS McCloskey) and Jaclyn Teo (IHS Chemical Consulting) have contributed to this article.
Q1 Q2 Q3 Q4Brent crude price: 52 USD per ton
$/b
bl
Cumulative Capacity (million tons)
N. America PE producers M. East PE producers Indonesia Coal SE Asia PE producers NE. Asia PE producers W. Europe PE producers
0 10 20 30 40 50 600
2000
0 10 20 30 40 50 60
Chart 2: Indonesian coal to polyethylene plant has $10-$50 per ton cost advantage vs naphtha plants in Asia
© 2016 IHSSource: IHS Chemical

IHS Chemical Bulletin
Insights
10 | 2016 issue 3 | www.ihs.com
By Marc Alvarado ↘ The global methanol industry has undergone dramatic changes in the past 15 years. These changes have included a shift in regional demand dominance, the development of new end uses, and the emergence of new production centers. These factors have resulted in new tradeflows, pricing and economic dynamics which have previously not existed in the industry with closer links to other chemical product areas, adding further complexity in determining market direction.
The shift in the demand centerChina has emerged as the dominant country with respect to both methanol capacity and demand owing to its rapid economic growth. China represented just 12% of global methanol demand in 2000 while North America and West Europe represented 33% and 22%, respectively. By 2015, Chinese methanol consumption had grown to 54% of global demand while North American had fallen to 11% and West Europe to 10% (see chart 1). Chinese demand has grown significantly in traditional methanol derivatives, such as formaldehyde and acetic acid, but there has also been large, step like growth into new end uses, such as light olefins production, as well as expanded demand into energy applications, such as DME and direct gasoline blending.
New end uses.Fuel applications for methanol have been relatively minor historically with very limited direct use as a
motor fuel. Chinese direct blending use of methanol into the country’s gasoline pool has seen an average annual growth rate of 25% from 2000 to 2015, resulting in gasoline blending becoming the third largest demand segment for methanol by 2015.
Produced from methanol, DME is primarily used as an aerosol propellant in the West, making for a rather small overall market. However DME can also be used as a fuel, either when used instead of diesel in road vehicles or blended into liquefied petroleum gas (LPG). The latter has been widely seen at the consumer level for home cooking and heating in China. This market segment is large enough that methanol consumption into DME has grown from virtually nothing in 2000 to represent the fourth largest methanol derivative.
A newer and very rapidly growing demand segment for methanol is in the production of light olefins (methanol-to-olefins, MTO). In an MTO unit, merchant methanol is used as a feedstock; it is not a unit which is back integrated to the feedstock for methanol. Such integrated coal-to-olefins (CTO) or gas-to-olefins (GTO) units do not have an impact on the methanol markets as they neither buy nor sell methanol as it is simply an intermediate phase in the overall process. For these reasons, the subsequent comments related to MTO refer to only those units that consume methanol produced by non-associated methanol units. As of 2016, MTO units exist exclu-sively in China with production beginning in late 2011 at very modest levels of methanol consumption. However there has been staggering growth in methanol consumption into this end use with as many as seven MTO units running by the end of 2015, while a stoichiometric relationship that requires three tons of methanol to be consumed for every one ton of olefins produced has resulted in MTO becoming the sixth largest methanol derivative in just four years of commercial existence (see chart 2).
New production centersFeedstock costs for methanol make up as much as 90% of the total cash cost and as such access to low cost feedstocks is key to overall methanol economics. The primary feedstock for methanol has been natural gas, representing as much as 85% of installed global capacity and historically methanol production primarily existed in Europe and North America.
120
100
80
60
40
20
0
2000
2002
2004
2006
2008
2010
2012
2014
2016
2018
2020
■ N.America
■ Africa
■ S.America
■ Middle East
■ W. Europe
■ Indian Subc.
■ C. Europe
■ SE Asia
■ CIS & Baltics
■ NE Asia
Mill
ion
me
tric
to
ns
Source: IHS Chemical © 2016 IHS
Chart 1: World methanol demand by region
The changing face of the globalmethanol industry

www.ihs.com | 2016 issue 3 | 11
IHS Chemical Bulletin
Insights
Other regions with access to low cost natural gas have also seen a surge in methanol capacity additions, such as the Middle East, Africa and South America. With the growth in Chinese demand for methanol and the country’s rich coal reserves, the industry has seen a sharp rise in coal based methanol production beginning in the early 2000s. Currently coal based methanol capacity represents around 35% of installed global capacity.
The capacity additions in regions based on more competitive/stranded gas economics lead to capacity rationalizations in the more mature western markets of North America and Europe in the early 2000s with North American capacity all but extinguished by 2008. However the fairly recent exploitation of unconven-tional natural gas supply through hydraulic fracturing in North America has seen this region regain its position as a methanol production powerhouse, with methanol capacity additions at cash costs close to those of South America. Understanding methanol produc-tion economics requires insight into natural gas prices around the world and coal prices in China.
Price setting mechanismsWest coast, coal-based Chinese methanol capacity has been the marginal ton needed to meet global demand and as such that last increment of production sets the price in China and in the world. As mentioned, there are other low cost regions such as the Middle East with more competitive production; the Middle East acts as a swing supplier to Europe and North America based on the price that China sets. Thus global pricing originates in China and the regions are priced according to freight and duty di¢erentials. The US having closed nearly all of its production capacity in the early 2000s became the highest priced region, having to pay a premium to pull tons from interna-tional markets. However with the re-emergence of a North American production base to a level that will far exceed domestic demand, the region has undergone a dramatic shift from being the highest priced market to the lowest price market with economics and prices now based on export alternatives. Europe has benefited as the North American capacity additions have added supply in the Atlantic basin.
Supply and demand pressures drive methanol pricing, dictating where on the cost curve that last critical increment of production resides. Now that methanol has significant volumes of derivatives that compete as alternatives to crude oil derived products, however the picture becomes significantly more complicated with some methanol derivative a¢ord-abilities dependent on crude oil price fluctuations. The analysis of these requires an understanding of global fuel markets as well as light olefins markets. Understanding the interactions between these
markets and production cost comparisons for olefins from the various manufacturing routes will be key to determining methanol market direction.
What can the industry expect in the next few years?The industry will face more moderate growth rates with respect to demand as direct gasoline blending has matured and the feverish pace of MTO projects begins to moderate. Overall demand during the next five years will grow at an average annual growth rate of almost 7% with MTO due to become the second largest methanol derivative. The new capacity in North America is forecast to turn the region from a net importer to a net exporter by early 2019.
Marc Alvarado is a director of the Methanol Market Advisory Services at IHS Chemical, where he leads research e�orts and serves as a consultant covering the methanol industry in the Americas. Marc will be speaking at the upcoming 34th Annual World Methanol Conference in Budapest on 1st Oct 2016. To find out more visit www.ihs.com/wmc2016. You can also contact Marc directly at: [email protected].
The methanol market is significantly more complicated with some methanol derivative affordabilities dependent on crude oil price fluctuations
10%
6%
29%9%
10%
2%
10%
4%10%
5%
2%3%
Source: IHS Chemical © 2016 IHS
Chart 2: World 2015 methanol demand by end use
■ Methylamines■ Chloro-methanes■ MTO/MTP■ Solvents■ Others/DMT■ Formaldehyde■ Acetic acid■ MTBE
■ Gasoline blending■ MMA
■ Biodiesel■ Dimethyl ether
29%9%
ource: IHS Chemical

IHS Chemical Bulletin
Insights
12 | 2016 issue 3 | www.ihs.com
Modular construction for petrochemicals: “A utopia just beyond the horizon?
By Dr. Richard Charlesworth
↘ Henry A. Kissinger once said, “For other nations, Utopia is a blessed past never to be recovered; For Americans it is just beyond the horizon.” Could a modularization construction provide petrochemical project owners a relief from the rising capital costs seen over the last 15 years?
Modularization is seen in many industries including home and building construction ships and even in orbit with the International Space Station. For the oil, gas and chemical industry, modularization is primar-ily a strategy for the construction stage of the project although needs consideration very early in a project’s life. It was originally developed for the o�shore oil industry but is becoming increasingly popular downstream. Modules are complete preassemblies of equipment, bulk materials and components that are fabricated o�site into a steel structure to be trans-ported by sea and/or land and installed at another location.
Why would one modularize the construction of a project? In some cases it is the only option! For remote upstream projects o�shore and onshore a stick build structure would not be feasible. The most obvious reason to modularize is CAPEX reduction. Cost reductions can be attributed to using o�site labor that can have a lower cost, onsite accommodation costs are reduced, material delivery costs are reduced, and crane usage onsite is reduced. In addition, other cost benefits come because standardized sub-assembly materials can be purchased in bulk, and, through
economies of scale and optimization of the supply chain, lead to lower material costs. A shorter schedule can be attributed to the fact that most of the work can be done under roof, making weather a non-issue and that the conditions are better to develop a work process that is more e�cient.
Apart from these two main drivers of construction, modular construction can also lead to improved quality control, production control, inventory control, labor control, improved work site climate control and even minimize construction waste. Site construction risks associated with location, existing manufactur-ing, congestion, lay-down areas are also minimized.
Many elements that drive overall CAPEX have increased substantially over the last 10 years and these are accounted for in IHS’ Downstream Capital Cost Index (DCCI). This index is made up of six main elements:•Construction labor• Equipment costs• Pipe & steel• Engineering & procurement• Electrical & instrumentation•CivilsAll elements have fallen since the second half of 2014 and the momentum remains downwards for most. Pipe and steel have seen the biggest falls, due to the drop in energy costs. The elements of IHS‘ downstream capital cost index are developed into an overall global petro-chemical capital cost index. For petrochemicals, the overall index is expected to fall 10-15% from the peak in 2014 and not return to the previous peak until the next decade (see Chart 1). Perhaps now is the best time to invest in a new project?
Global capital investment peaked at $125B in 2014, the highest investment level on record. Northeast Asia represented about 60% of the year’s total with most investment focused on aromatics, syngas and plastics, much of this coal-based. 2015 saw residual spillover investment but CAPEX has begun to rapidly decelerate in 2016. Northeast Asia has fallen away most quickly and more than o�setting the build-cycle of shale-related North American supply. Looking forward into 2017-2019, while there are likely yet unannounced builds, it is still apparent that
inde
x (2
000=
100)
2000 2005 2010 2015 2020 2025
300
250
50
150
200
100
Chart 1: P etroc hem ic al dow nstream c apital c ost index f orec ast – nom inal
Source: IHS Chemical © 2016 IHS

www.ihs.com | 2016 issue 3 | 13
IHS Chemical Bulletin
Insights
investment slows appreciably, to the slowest level since the start of the last decade. Indeed IHS sees underlying trends in capital access in the emerging markets as a factor in this trend. As a result, and also due to the slowing in capital programs related to shale, IHS is forecasting the concerns in CAPEX inflation experienced in some markets to abate.
The falling level of investment due to the increase in CAPEX and uncertainty of future petrochemical prices is no surprise. CAPEX clearly a�ects the overall returns of a project. As capital expenditures are at the beginning of a project and present value cash flows are not heavily discounted to the cost of capital, a 20% increase in CAPEX can make a questionable project a non-starter.
There are many di�erent strategies for a project owner at the EPC stage. With a fully Lump Sum Turn Key (LSTK) project, the owner need only a small team for quality control and the prime contractor is responsible for cost, schedule & quality. As the strategy moves more to reimbursable contract the owner becomes more responsible for cost, schedule & quality; whereas the prime contractor provides Project Management Consulting services. Consequently the owner’s risk increases moving from LSTK to fully reimbursable contracts although mitigated with a target price pain/gain share mechanism built in.
The increased risk is only one element that changes. The contracting arrangements going from LSTK to fully reimbursable are very di�erent. With a LSTK, the owner only needs the small team as there is one contract with the contractor who manages all other contracts. With a fully reimbursable contract arrange-ment, the owner needs a large team as it sits in the middle of the contractors, engineering companies and vendors, all of which require controlling and managing.
With LSTK the contractor takes full responsibility in respect of the following:•Cost of completion if it is a lump sum contract
(subject to limited adjustments);• The time for completion (subject to extensions of
time);• The quality of the design and work and achievement
of performance guarantees (subject to any exclusion).
Therefore a Contractor’s LSTK quote will include its “risk premium” which of course makes the project less attractive from a purely financial point-of-view. In addition, Lenders to projects clearly prefer LSTK arrangements due to the lower risk to CAPEX. Could modularization provide the Utopia of lower CAPEX and lower risk to the owner?
In reviewing the drivers for modularization, it is clear that the benefits of modularization must be greater than the price for those benefits and that the Risk of NOT achieving the net benefits is low and
manageable. The focus falls on the DIFFERENTIAL COSTS between stick built and modular execution. The typical module yard costs would be substantially lower than stick built costs (see Chart 2). However modularization will increase costs of the engineering stage, quality assurance, quality control, extra steel and extra steel supports, transportation of modules to site, import/export taxes and duties, and other risk management associated with managing the fabrica-tion yard and moving modules from yard to site. Cost benefits of modularization would be decreased site infrastructure costs through moving labor cost o�site to a cheaper/more productive labor supply, reduction of indirect costs at site as less directs (construction supervision, consumables etc), reduced cost of camp construction due to lower peak, improved productiv-ity (weather, flexible workforce, site accessibility, material flows, etc), reduced schedule reduces construction indirects, a positive impact to NPV if revenue stream begins earlier and even financing. The net benefits can be substantial compared with stick-built costs.
The benefits of moving man-hours o�site to a cheaper location are especially relevant for North American projects (see Chart 3). The chart shows IHS‘ DCCI breakout on a percentage basis. Typically 40 % of the cost of North American projects is in labor. For certain locations e.g. Canada, this is over 50%. Hence there is huge potential in reducing capital costs for North American projects which will clearly improve the potential returns of a project.
There has been much evolution from the first modularized upstream and downstream plants. Through the development of modularization, Fluor has termed the “generation” stages of modularization. • “1st Generation” refers to simple Pipe Racks and
Pre-assembled racks and Vendor assembled racks and units. Although straightforward, this can still take substantial hours o�-site depending on the project.
• “2nd Generation” takes 1st generation to the next
Mill
ions
US
dolla
r ($)
Module
y ard
cost
A d d’ n
eng in
eerin
g
A d d’ n
Q A /QC
A d d’ n
steel/
sup p
orts
A d d n’
trans
p orta
tion
Tax e
s & d u
ties
R isk m
itigati
on
Site in
frastr
uctur
e
Sched
uling
F inanc
ing
Total
mod
ule co
st
B enefi
t
Stick b
uilt c
osts
Chart 2: A re b enef its of m oduraliza tion > pric e f or those b enef its?
Source: IHS Chemical © 2016 IHS

IHS Chemical Bulletin
Insights
14 | 2016 issue 3 | www.ihs.com
level by modularizing major process equipment and pre-dressed vessels. The hours moved o�site vary for the area from 15-25% of instrumentation/electrical to 50% of insulation to 60-70% steel and piping. On average 40% above ground field yards are moved to the module yard
• “3rd Generation” seeks to maximize movement of hours’ o�site. As such Modularization drives the layout rather than layout driving modularization. Designs are standardized rather than customized and collaboration between Owner, Engineer, Procurement, Construction, Project Management and Fabricator is maximized. Fluor has developed a patented 3rd Generation Modular Execution Methodology that can relocate 60-90% of equiva-lent stick-built hours providing the potential for a substantial CAPEX decrease. Recently Fluor completed Shell’s Quest Carbon Capture Project in Alberta, Canada using their 3rd generation modular execution.
There still has not been a rapid uptake of modulariza-tion construction strategy for chemicals. However the ultimate modularization has just been done with Methanex relocating 2 methanol plants from Chile to Geismar, Louisiana. Mammoet was subcontracted by Jacobs to support the reverse modularization of the plant and to assist in the heavy lifts, heavy haul and transport of the methanol plant over a 5,450 mile distance. Methanex, the world’s largest producer and supplier of methanol, made the decision to relocate a second plant from Chile to Louisiana in 2013. Reloca-tion, as compared to a new-build, o�ers capital savings and a reduced project timeframe giving a very attractive IRR
However the modularization of chemical plants is certainly not new. Fluor served as the managing contractor on a 500-acre grassroots ethylene-based petrochemical complex for Saudi Arabia Petrochemi-cal Company (SADAF) at Al-Jubail, Saudi Arabia built in the 1980s. Approximately 40 percent of the complex was completed using modular construction,
and was therefore the largest modular project at the time. About 220 modules, some ranging up to 1,800 tons were constructed for the process plants, utilities, and o�site complexes. Fluor conducted extensive surveys and evaluations before the module contracts were let. The modules were shipped on 30 voyages from fabricators in Japan over a two-year period and the project was completed months ahead of schedule.
There have been modular project announcements already in 2016. Honeywell recently announced that Hyundai Chemical Co. will use Honeywell UOP technology to expand its petrochemicals complex in Daesan Republic, South Korea, allowing it to make its own feedstock material to boost profitability. The facility will use technology as well as modular equipment from Honeywell UOP to allow the plant to make mixed xylenes to produce paraxylene, a building block for synthetic fibers, packaging and plastics that is in high demand in Asia. Back-integrating the facility to make its own feedstock will reduce the plant’s dependence on imports of mixed xylenes and its exposure to the volatile market for the feedstock. The plant currently uses Honeywell UOP technology to produce paraxylene. Much of the project will be modularized which is driven by schedule rather than cost. Using modular equipment for the project ensures that the expansion will be operational sooner as the modules are designed to reduce installation time to provide an earlier startup, further improving project economics.
Ultimately overall project returns drive investment. With just a 10% decrease in CAPEX, projects that were questionable become very much more attractive for investment and increasingly so if the time to market can be reduced by (say) 6 months. It could even make non-starters return cost-of-capital.
The year 2016 marks 500 years since Thomas More wrote his book “Utopia”. A quote from the book is that “You wouldn’t abandon ship in a storm just because you couldn’t control the winds.” Likewise chemical companies cannot control the oil price and would not abandon the industry but look to what is controllable. As such, Modularization can provide the Utopia of lower CAPEX and lower risks to chemicals projects. Even in a low and volatile oil environment, a modularization construction strategy could enable attractive returns for your chemicals projects. As such, from the very early stages of the project, every project owner should be asking themselves “Why shouldn’t we modularize?”
Dr. Richard Charlesworth serves as a Managing Director for Chemical Consulting based in the Dubai Office. Contact Richard at [email protected].
■ L ab or ■ Eq uip ment ■ Steel ■ EPM ■ Electrical & instrumentation ■ Civil & construction
Glob al N . A merica S. A merica W . Europ e E. Europ e M. East A sia
100%
80
0
40
60
20
Chart 3 : D ow nstream c apital c ost index portf olio b reak out*
Source: IHS Chemical
* F ourth q uarter 2015.
© 2016 IHS
www.ihs.com | 2016 issue 3 | 15
IHS Chemical Bulletin
Insights
Polyols – finding a way through the impending supply glut
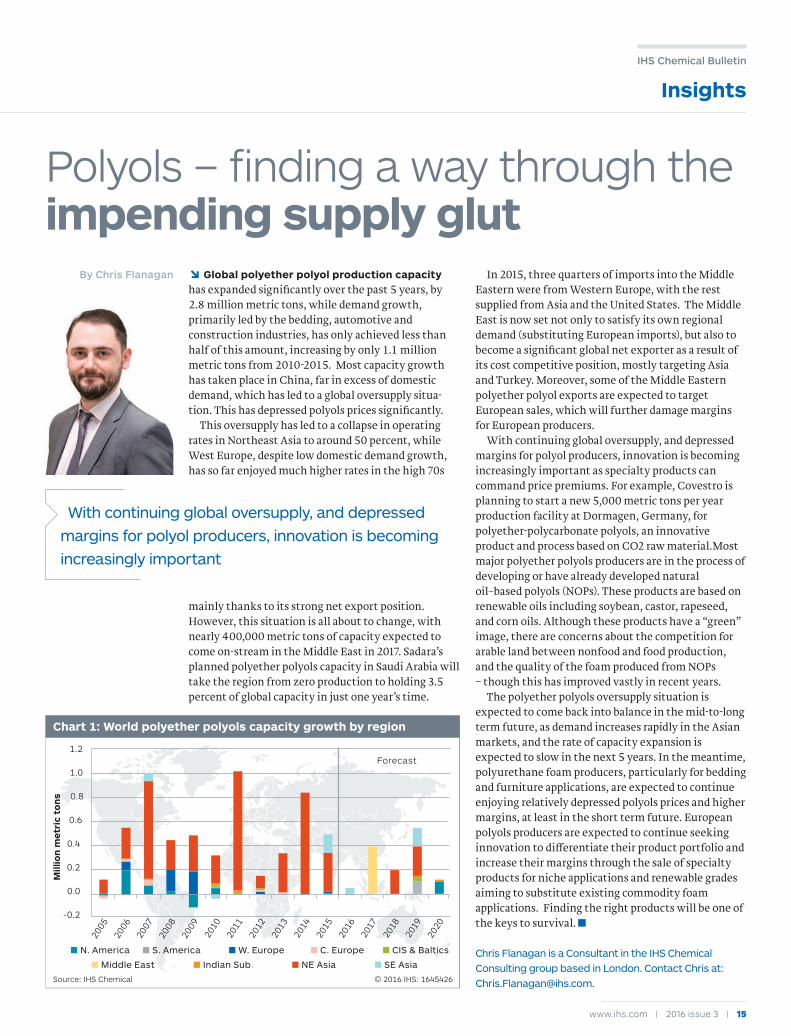
↘ Global polyether polyol production capacity has expanded significantly over the past 5 years, by 2.8 million metric tons, while demand growth, primarily led by the bedding, automotive and construction industries, has only achieved less than half of this amount, increasing by only 1.1 million metric tons from 2010-2015. Most capacity growth has taken place in China, far in excess of domestic demand, which has led to a global oversupply situa-tion. This has depressed polyols prices significantly.
This oversupply has led to a collapse in operating rates in Northeast Asia to around 50 percent, while West Europe, despite low domestic demand growth, has so far enjoyed much higher rates in the high 70s
mainly thanks to its strong net export position. However, this situation is all about to change, with nearly 400,000 metric tons of capacity expected to come on-stream in the Middle East in 2017. Sadara’s planned polyether polyols capacity in Saudi Arabia will take the region from zero production to holding 3.5 percent of global capacity in just one year’s time.
In 2015, three quarters of imports into the Middle Eastern were from Western Europe, with the rest supplied from Asia and the United States. The Middle East is now set not only to satisfy its own regional demand (substituting European imports), but also to become a significant global net exporter as a result of its cost competitive position, mostly targeting Asia and Turkey. Moreover, some of the Middle Eastern polyether polyol exports are expected to target European sales, which will further damage margins for European producers.
With continuing global oversupply, and depressed margins for polyol producers, innovation is becoming increasingly important as specialty products can command price premiums. For example, Covestro is planning to start a new 5,000 metric tons per year production facility at Dormagen, Germany, for polyether-polycarbonate polyols, an innovative product and process based on CO2 raw material.Most major polyether polyols producers are in the process of developing or have already developed natural oil–based polyols (NOPs). These products are based on renewable oils including soybean, castor, rapeseed, and corn oils. Although these products have a “green” image, there are concerns about the competition for arable land between nonfood and food production, and the quality of the foam produced from NOPs – though this has improved vastly in recent years.
The polyether polyols oversupply situation is expected to come back into balance in the mid-to-long term future, as demand increases rapidly in the Asian markets, and the rate of capacity expansion is expected to slow in the next 5 years. In the meantime, polyurethane foam producers, particularly for bedding and furniture applications, are expected to continue enjoying relatively depressed polyols prices and higher margins, at least in the short term future. European polyols producers are expected to continue seeking innovation to di�erentiate their product portfolio and increase their margins through the sale of specialty products for niche applications and renewable grades aiming to substitute existing commodity foam applications. Finding the right products will be one of the keys to survival.
Chris Flanagan is a Consultant in the IHS Chemical Consulting group based in London. Contact Chris at: [email protected].
By Chris Flanagan
With continuing global oversupply, and depressed margins for polyol producers, innovation is becoming increasingly important
■ N. America ■ S. America
■ Middle East
■ W. Europe
■ Indian Sub.
■ C. Europe
■ NE Asia
■ CIS & Baltics
■ SE Asia
Forecast
2005
2006
2007
2008
2009
2010
2011
2012
2013
2014
2015
2016
2017
2018
2019
2020
Mill
ion
me
tric
to
ns
1.2
1.0
0.8
0.6
0.4
0.2
-0.2
0.0
© 2016 IHS: 1645426Source: IHS Chemical
Chart 1: World polyether polyols capacity growth by region

.
IHS .
9355-PB-0216
I
.
IHS.COM
S016_ChemBulletin_062016.indd 16 6/8/16 1:59:12 PM