IHS AUTOMOTIVE The ASEAN Automotive Supplier … AUTOMOTIVE The ASEAN Automotive . Supplier Report....
10
IHS AUTOMOTIVE The ASEAN Automotive Supplier Report SupplierBusiness 2015 edition supplierbusiness.com REGIONAL REPORT Indonesia, Malaysia, Philippines, Thailand, Vietnam Regional supplier reports are sponsored by SAMPLE
Transcript of IHS AUTOMOTIVE The ASEAN Automotive Supplier … AUTOMOTIVE The ASEAN Automotive . Supplier Report....
IHS AUTOMOTIVE
The ASEAN Automotive Supplier ReportSupplierBusiness
2015 edition supplierbusiness.com
REGIONAL REPORT
Indonesia, Malaysia, Philippines, Thailand, Vietnam
Regional supplier reports are sponsored bySAMPLE
© 2015 IHS 2 2015 edition
IHS Automotive | The South Korean Automotive Supplier Report
IHS™ AUTOMOTIVECopyright notice and legal disclaimer© 2015 IHS. No portion of this report may be reproduced, reused, or otherwise distributed in any form without prior written consent, with the exception of any internal client distribution as may be permitted in the license agreement between client and IHS. Content reproduced or redistributed with IHS permission must display IHS legal notices and attributions of authorship. The information contained herein is from sources considered reliable but its accuracy and completeness are not warranted, nor are the opinions and analyses which are based upon it, and to the extent permitted by law, IHS shall not be liable for any errors or omissions or any loss, damage or expense incurred by reliance on information or any statement contained herein. IHS and the IHS logo are trademarks of IHS. For more information, please contact IHS at www.ihs.com/CustomerCare.
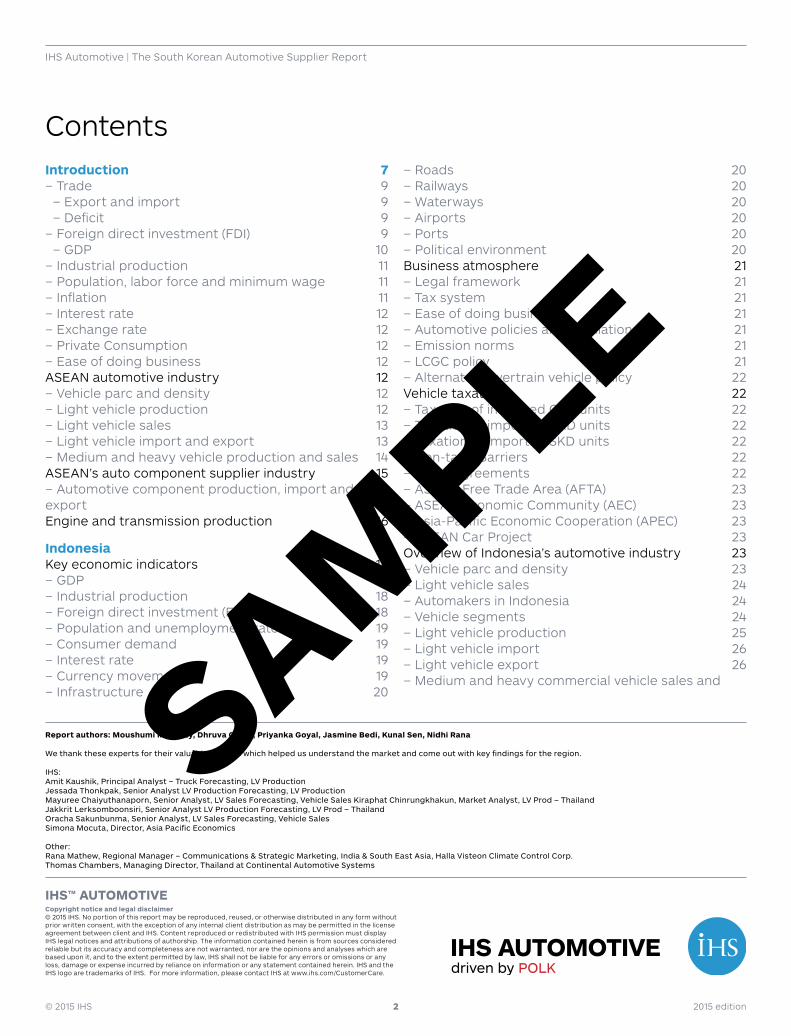
ContentsIntroduction 7
– Trade 9 – Export and import 9 – Deficit 9
– Foreign direct investment (FDI) 9 – GDP 10
– Industrial production 11 – Population, labor force and minimum wage 11 – Inflation 11 – Interest rate 12 – Exchange rate 12 – Private Consumption 12 – Ease of doing business 12
ASEAN automotive industry 12 – Vehicle parc and density 12 – Light vehicle production 12 – Light vehicle sales 13 – Light vehicle import and export 13 – Medium and heavy vehicle production and sales 14
ASEAN’s auto component supplier industry 15 – Automotive component production, import and
export 15Engine and transmission production 16
Indonesia 17Key economic indicators 18
– GDP 18 – Industrial production 18 – Foreign direct investment (FDI) 18 – Population and unemployment rate 19 – Consumer demand 19 – Interest rate 19 – Currency movement 19 – Infrastructure 20
– Roads 20 – Railways 20 – Waterways 20 – Airports 20 – Ports 20 – Political environment 20
Business atmosphere 21 – Legal framework 21 – Tax system 21 – Ease of doing business 21 – Automotive policies and regulations 21 – Emission norms 21 – LCGC policy 21 – Alternate powertrain vehicle policy 22
Vehicle taxation 22 – Taxation of imported CBU units 22 – Taxation of imported CKD units 22 – Taxation of imported SKD units 22 – Non-tariff Barriers 22 – Trade agreements 22 – ASEAN Free Trade Area (AFTA) 23 – ASEAN Economic Community (AEC) 23 – Asia-Pacific Economic Cooperation (APEC) 23 – ASEAN Car Project 23
Overview of Indonesia’s automotive industry 23 – Vehicle parc and density 23 – Light vehicle sales 24 – Automakers in Indonesia 24 – Vehicle segments 24 – Light vehicle production 25 – Light vehicle import 26 – Light vehicle export 26 – Medium and heavy commercial vehicle sales and
Report authors: Moushumi Mohanty, Dhruva Gogoi, Priyanka Goyal, Jasmine Bedi, Kunal Sen, Nidhi Rana
We thank these experts for their valuable insights which helped us understand the market and come out with key findings for the region.
IHS:Amit Kaushik, Principal Analyst – Truck Forecasting, LV ProductionJessada Thonkpak, Senior Analyst LV Production Forecasting, LV ProductionMayuree Chaiyuthanaporn, Senior Analyst, LV Sales Forecasting, Vehicle Sales Kiraphat Chinrungkhakun, Market Analyst, LV Prod – ThailandJakkrit Lerksomboonsiri, Senior Analyst LV Production Forecasting, LV Prod – ThailandOracha Sakunbunma, Senior Analyst, LV Sales Forecasting, Vehicle SalesSimona Mocuta, Director, Asia Pacific Economics
Other:Rana Mathew, Regional Manager – Communications & Strategic Marketing, India & South East Asia, Halla Visteon Climate Control Corp.Thomas Chambers, Managing Director, Thailand at Continental Automotive Systems
SAMPLE
© 2015 IHS 3 2015 edition
IHS Automotive | The ASEAN Automotive Supplier Report
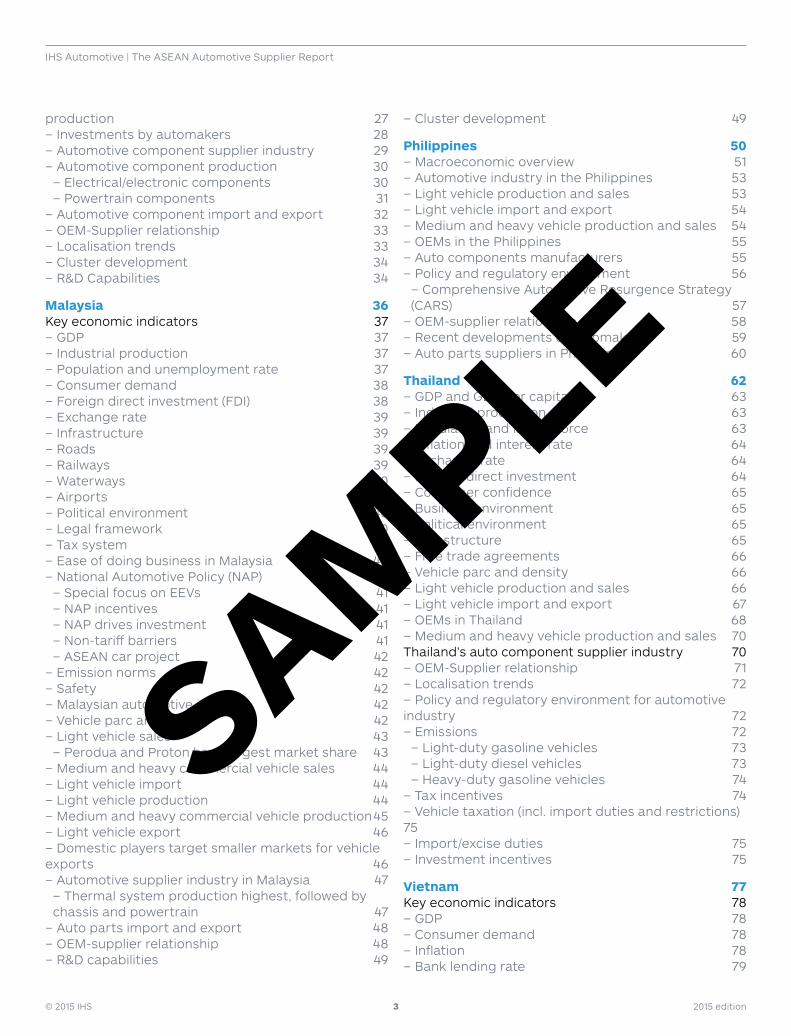
production 27 – Investments by automakers 28 – Automotive component supplier industry 29 – Automotive component production 30
– Electrical/electronic components 30 – Powertrain components 31
– Automotive component import and export 32 – OEM-Supplier relationship 33 – Localisation trends 33 – Cluster development 34 – R&D Capabilities 34
Malaysia 36Key economic indicators 37
– GDP 37 – Industrial production 37 – Population and unemployment rate 37 – Consumer demand 38 – Foreign direct investment (FDI) 38 – Exchange rate 39 – Infrastructure 39 – Roads 39 – Railways 39 – Waterways 40 – Airports 40 – Political environment 40 – Legal framework 40 – Tax system 40 – Ease of doing business in Malaysia 40 – National Automotive Policy (NAP) 40
– Special focus on EEVs 41 – NAP incentives 41 – NAP drives investment 41 – Non-tariff barriers 41 – ASEAN car project 42
– Emission norms 42 – Safety 42 – Malaysian automotive industry 42 – Vehicle parc and density 42 – Light vehicle sales 43
– Perodua and Proton have largest market share 43 – Medium and heavy commercial vehicle sales 44 – Light vehicle import 44 – Light vehicle production 44 – Medium and heavy commercial vehicle production 45 – Light vehicle export 46 – Domestic players target smaller markets for vehicle
exports 46 – Automotive supplier industry in Malaysia 47
– Thermal system production highest, followed by chassis and powertrain 47 – Auto parts import and export 48 – OEM-supplier relationship 48 – R&D capabilities 49
– Cluster development 49
Philippines 50 – Macroeconomic overview 51 – Automotive industry in the Philippines 53 – Light vehicle production and sales 53 – Light vehicle import and export 54 – Medium and heavy vehicle production and sales 54 – OEMs in the Philippines 55 – Auto components manufacturers 55 – Policy and regulatory environment 56
– Comprehensive Automotive Resurgence Strategy (CARS) 57 – OEM-supplier relationship 58 – Recent developments of automakers 59 – Auto parts suppliers in Philippines 60
Thailand 62 – GDP and GDP per capita 63 – Industrial production 63 – Population and labour force 63 – Inflation and interest rate 64 – Exchange rate 64 – Foreign direct investment 64 – Consumer confidence 65 – Business environment 65 – Political environment 65 – Infrastructure 65 – Free trade agreements 66 – Vehicle parc and density 66 – Light vehicle production and sales 66 – Light vehicle import and export 67 – OEMs in Thailand 68 – Medium and heavy vehicle production and sales 70
Thailand’s auto component supplier industry 70 – OEM-Supplier relationship 71 – Localisation trends 72 – Policy and regulatory environment for automotive
industry 72 – Emissions 72
– Light-duty gasoline vehicles 73 – Light-duty diesel vehicles 73 – Heavy-duty gasoline vehicles 74
– Tax incentives 74 – Vehicle taxation (incl. import duties and restrictions)
75 – Import/excise duties 75 – Investment incentives 75
Vietnam 77Key economic indicators 78
– GDP 78 – Consumer demand 78 – Inflation 78 – Bank lending rate 79
SAMPLE
© 2015 IHS 4 2015 edition
IHS Automotive | The ASEAN Automotive Supplier Report
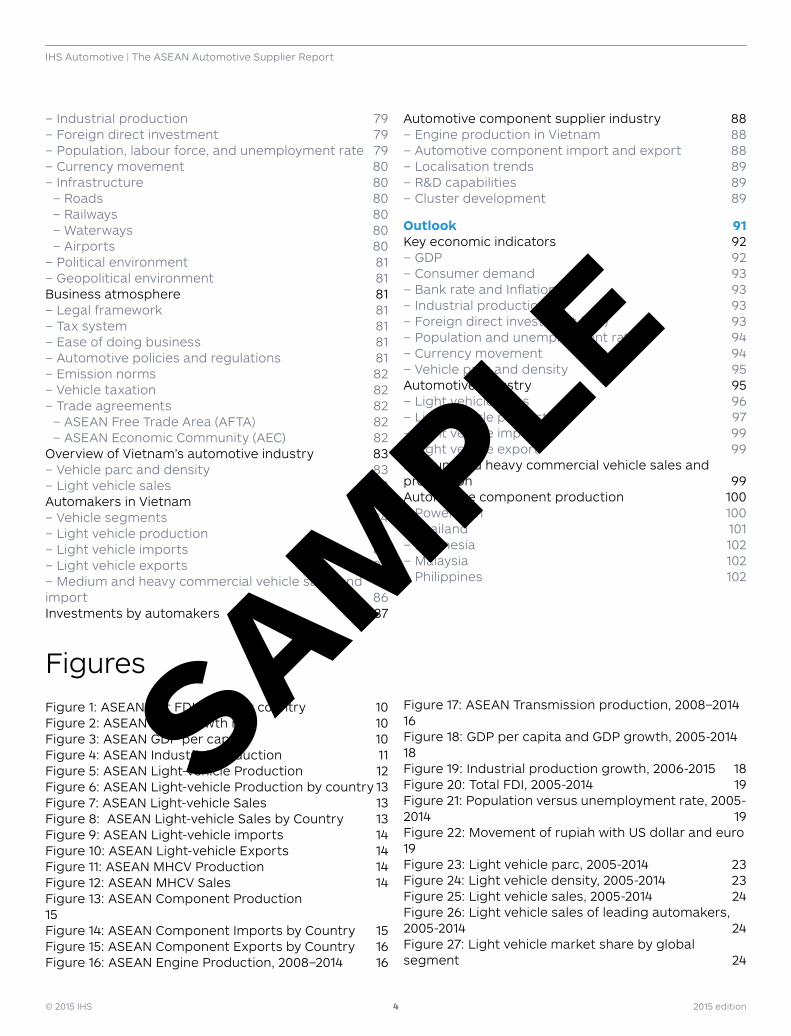
FiguresFigure 1: ASEAN Net FDI inflow by country 10Figure 2: ASEAN GDP Growth rate 10Figure 3: ASEAN GDP per capita 10Figure 4: ASEAN Industrial Production 11Figure 5: ASEAN Light-vehicle Production 12Figure 6: ASEAN Light-vehicle Production by country 13Figure 7: ASEAN Light-vehicle Sales 13Figure 8: ASEAN Light-vehicle Sales by Country 13Figure 9: ASEAN Light-vehicle imports 14Figure 10: ASEAN Light-vehicle Exports 14Figure 11: ASEAN MHCV Production 14Figure 12: ASEAN MHCV Sales 14Figure 13: ASEAN Component Production 15Figure 14: ASEAN Component Imports by Country 15Figure 15: ASEAN Component Exports by Country 16Figure 16: ASEAN Engine Production, 2008–2014 16
Figure 17: ASEAN Transmission production, 2008–2014 16Figure 18: GDP per capita and GDP growth, 2005-2014 18Figure 19: Industrial production growth, 2006-2015 18Figure 20: Total FDI, 2005-2014 19Figure 21: Population versus unemployment rate, 2005-2014 19Figure 22: Movement of rupiah with US dollar and euro 19Figure 23: Light vehicle parc, 2005-2014 23Figure 24: Light vehicle density, 2005-2014 23Figure 25: Light vehicle sales, 2005-2014 24Figure 26: Light vehicle sales of leading automakers, 2005-2014 24Figure 27: Light vehicle market share by global segment 24
– Industrial production 79 – Foreign direct investment 79 – Population, labour force, and unemployment rate 79 – Currency movement 80 – Infrastructure 80
– Roads 80 – Railways 80 – Waterways 80 – Airports 80
– Political environment 81 – Geopolitical environment 81
Business atmosphere 81 – Legal framework 81 – Tax system 81 – Ease of doing business 81 – Automotive policies and regulations 81 – Emission norms 82 – Vehicle taxation 82 – Trade agreements 82
– ASEAN Free Trade Area (AFTA) 82 – ASEAN Economic Community (AEC) 82
Overview of Vietnam’s automotive industry 83 – Vehicle parc and density 83 – Light vehicle sales 83
Automakers in Vietnam 84 – Vehicle segments 84 – Light vehicle production 84 – Light vehicle imports 85 – Light vehicle exports 86 – Medium and heavy commercial vehicle sales and
import 86Investments by automakers 87
Automotive component supplier industry 88 – Engine production in Vietnam 88 – Automotive component import and export 88 – Localisation trends 89 – R&D capabilities 89 – Cluster development 89
Outlook 91Key economic indicators 92
– GDP 92 – Consumer demand 93 – Bank rate and Inflation 93 – Industrial production 93 – Foreign direct investment (FDI) 93 – Population and unemployment rate 94 – Currency movement 94 – Vehicle parc and density 95
Automotive Industry 95 – Light vehicle sales 96 – Light vehicle production 97 – Light vehicle imports 99 – Light vehicle export 99
Medium and heavy commercial vehicle sales and production 99Automotive component production 100
– Powertrain 100 – Thailand 101 – Indonesia 102 – Malaysia 102 – Philippines 102
SAMPLE
© 2015 IHS 5 2015 edition
IHS Automotive | The ASEAN Automotive Supplier Report
Figure 28: Light vehicle production, 2005-2014 25Figure 29: Light vehicle production of leading manufacturers, 2005-2014 25Figure 30: Indonesia - Light vehicle production by segment 25Figure 31: Light vehicle imports, 2005-2014 26Figure 32: Leading light vehicle importers, 2005-2014 26Figure 33: Major light vehicle import source regions 26Figure 34: Light vehicle exports, 2005-2014 27Figure 35: Leading light vehicle exporters, 2005-2014 27Figure 36: Major light vehicle export destinations 27Figure 37: MHCV sales and production, 2005-2014 28Figure 38: Automotive component production, 2013-2017 30Figure 39: Production of electrical/electronic components, 2013-2017 30Figure 40: Engine and transmission production, 2005-2017 31Figure 41: Production of thermal components, 2013-2017 32Figure 42: Malaysia Nominal per-capita GDP & Real GDP growth rate 37Figure 43: Malaysia Industrial production 37Figure 44: Malaysia population & unemployment 38Figure 45: Malaysia Consumption & Net imports 38Figure 46: Malaysia consumer price index 38Figure 47: Malaysia policy interest rate 38Figure 48: Malaysia FDI Inflow and Outflow 39Figure 49: MYR/USD Annual average exchange rate 39Figure 50: Malaysia light vehicle parc 43Figure 51: Malaysia light vehicle density 43Figure 52: Malaysia light vehicle sales 43Figure 53: OEM Malaysia market share for light vehicles in 2010 & 2014 43Figure 54: Malaysia light vehicle sales by automakers 44Figure 55: MHCV sales in Malaysia 44Figure 56: Malaysia light vehicle imports 44Figure 57: Light vehicle production in Malaysia 45Figure 58: Malaysia light vehicle production by OEM 45Figure 59: MHCV production in Malaysia 45Figure 60: Malaysia light vehicle export by automakers 46Figure 61: Malaysia total production of auto parts 47Figure 62: Malaysia automotive components production, 2014 48Figure 63: Malaysia production of thermal components 48Figure 64: Malaysia Total engine & transmissions production (2008-2014) 48Figure 65: Philippines GDP per capita and GDP growth 2008-2014 51Figure 66: Industrial production growth in Philippines, 2005-2014 51
Figure 67: Philippines population versus unemployment Rate, 2007-2014 52Figure 68: Philippines currency movement 52Figure 69: Philippines total FDI, 2005-2014 52Figure 70: Philippines light vehicle parc 2004-2013 53Figure 71: Philippines light vehicle density 2004-2014 53Figure 72: Philippines light vehicle sales and production 2005-2014 54Figure 73: Light vehicle Imports in Philippines 54Figure 74: Philippines medium and heavy vehicle sales and production 2005-2014 54Figure 75: Philippines light vehicle sales by OEM 2011-2014 55Figure 76: Philippines light vehicle production by OEM 2010-2014 55Figure 77: Philippines exports, imports and sales of automotive components 56Figure 78: Thailand GDP Per Capita and GDP Growth, 2007-2014 63Figure 79: Thailand Industrial Production Growth, 2004-2014 63Figure 80: Thailand Population versus Unemployment Rate, 2007-2014 64Figure 81: Thailand movement of Bank Interest Rate with Inflation, Jan 2009-Jan 2015 64Figure 82: Thailand movement of Thai Bhat with US dollar and euro 64Figure 83: Total FDI in Thailand, 2004-2014 65Figure 84: Thailand light vehicle Parc 2004-2014 66Figure 85: Thailand light vehicle density 2004-2014 66Figure 86: Thailand light vehicle production and sales 67Figure 87: Thailand light vehicle exports 67Figure 88: Thailand light vehicle imports 67Figure 89: Thailand light vehicle production by OEM 68Figure 90: Thailand light vehicle sales by OEM 68Figure 91: Thailand MHCV sales and production 70Figure 92: Thailand automotive components sales, exports and imports 70Figure 93: Thailand engine production 72Figure 94: Thailand transmission production 72Figure 95: Vietnam’s GDP per capita and GDP growth, 2008-2014 78Figure 96: Vietnam Average consumer price index, 2005-2014 79Figure 97: Vietnam’s population versus unemployment rate, 2008-2014 79Figure 98: Movement of dong with US dollar and euro, 2008-2014 80Figure 99: Vietnam - Light vehicle density, 2008-2014 83Figure 100: Vietnam - Light vehicle parc, 2008-2014 83Figure 101: Light vehicle sales in Vietnam, 2005-2014 83Figure 102: Market share of leading vehicle manufacturers in Vietnam 84
SAMPLE
© 2015 IHS 6 2015 edition
IHS Automotive | The ASEAN Automotive Supplier Report
TablesTable 1: ASEAN Free Trade Agreementss 8Table 2: Free Trade Agreements under negotiation 9Table 3: Light vehicle assemblers in Indonesia 28Table 4: OEMs investments in Indonesia in 2014 28Table 5: Planned light vehicle production launches in Indonesia, 2015-2020 29Table 6: Major automotive suppliers in Indonesia 30Table 7: Major electrical/electronic components suppliers in Indonesia 31Table 8: Engine manufacturers in Indonesia 31Table 9: Transmission manufacturers in Indonesia 31Table 10: Major thermal components suppliers in Indonesia 32Table 11: Developments in Indonesian supplier industry in 2014 33Table 12: OEM and supplier presence by region 34Table 14: OEM developments in 2014 46Table 16: Major automotive suppliers in Malaysia 47Table 17: Malaysia’s Automotive clusters 49Table 18: Comprehensive Automotive Resurgence Strategy (CARS) 57Table 19: Automotive clusters in Philippines 59
Table 20: Recent developments of automakers in Philippines 59Table 21: Auto parts suppliers in Philippines 60Table 22: OEMs in Thailand 68Table 23: OEM developments in 2014 68Table 24: Suppliers’ developments in 2014 70Table 25: Emissions standards for new light-duty gasoline vehicles 73Table 26: Emissions standards for light-duty diesel vehicles (g/km) 73Table 27: Emissions standards for diesel-fuelled heavy-duty vehicles 74Table 28: Thailand import/excise duties 75Table 29: Light vehicle assemblers in Vietnam 87Table 30: OEM investments in Vietnam in 2014 87Table 31: Planned light vehicle production launches in Vietnam, 2015-2020 88Table 32: Major automotive suppliers in Vietnam 88Table 33: Investments by suppliers in Vietnam in 2014 89Table 34: R&D capabilities of major automotive suppliers in Vietnam 89
Figure 103: Vietnam light vehicle sales of leading automakers, 2005-2015 84Figure 104: Vietnam light vehicle market share by global segment 84Figure 105: Light vehicle production in Vietnam, 2005-2014 85Figure 106: Light vehicle production of leading manufacturers in Vietnam, 2010-2014 85Figure 107: Light vehicle imports in Vietnam, 2008-2014 85Figure 108: Leading light vehicle importers in Vietnam, 2012-2014 86Figure 109: Light vehicle exports from Vietnam, 2005-2014 86Figure 110: Leading light vehicle exporters in Vietnam, 2010-2014 86
Figure 111: MHCV sales in Vietnam, 2005-2014 87Figure 112: ASEAN GDP Per Capita 92Figure 113: ASEAN GDP Growth Rate 92Figure 114: ASEAN Industrial Production 93Figure 115: ASEAN Light-vehicle Parc 95Figure 116: ASEAN Light-vehicle Sales 96Figure 117: ASEAN Light-vehicle Sales by Country 97Figure 118: ASEAN Light-vehicle Production 98Figure 119: ASEAN Light-vehicle Production by Country 98Figure 120: ASEAN MHCV Sales 100Figure 121: ASEAN MHCV Production 100Figure 122: ASEAN Component Production 100Figure 123: ASEAN Engine Production 101Figure 124: ASEAN Transmission Production 101Figure 125: ASEAN Chassis Production 101
SAMPLE

© 2015 IHS 7 2015 edition
IHS Automotive | The ASEAN Automotive Supplier Report
CHAPTER ONE
Introduction
SAMPLE
© 2015 IHS 8 2015 edition
IHS Automotive | The ASEAN Automotive Supplier Report
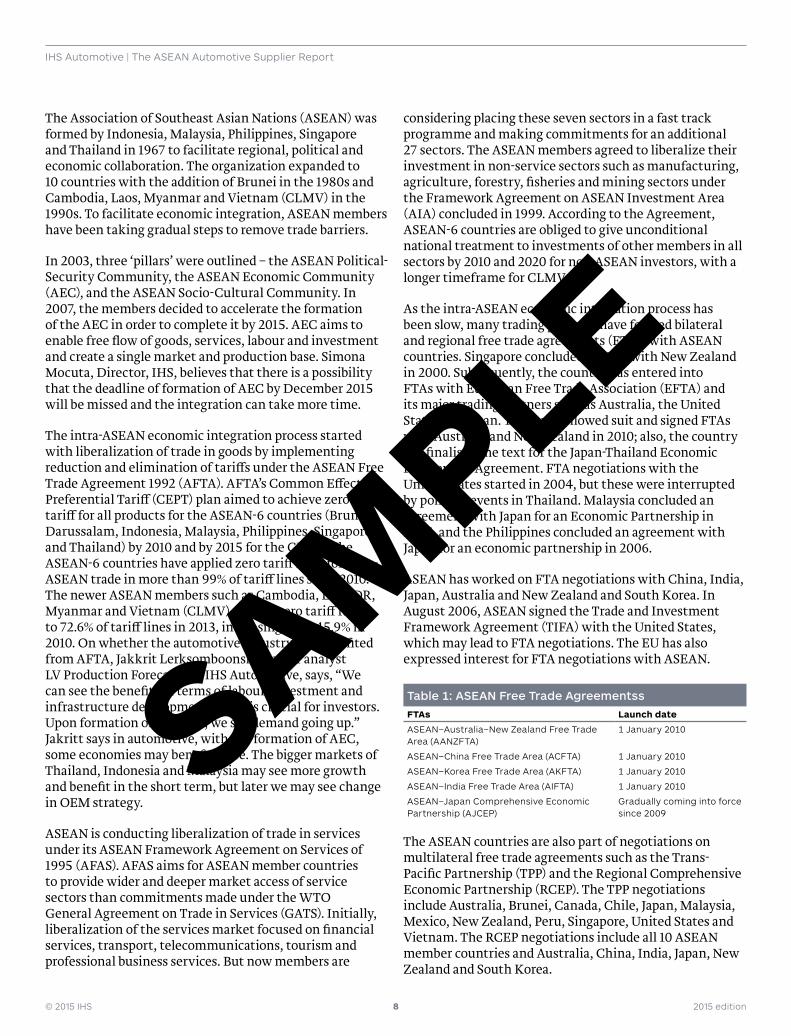
The Association of Southeast Asian Nations (ASEAN) was formed by Indonesia, Malaysia, Philippines, Singapore and Thailand in 1967 to facilitate regional, political and economic collaboration. The organization expanded to 10 countries with the addition of Brunei in the 1980s and Cambodia, Laos, Myanmar and Vietnam (CLMV) in the 1990s. To facilitate economic integration, ASEAN members have been taking gradual steps to remove trade barriers.
In 2003, three ‘pillars’ were outlined – the ASEAN Political-Security Community, the ASEAN Economic Community (AEC), and the ASEAN Socio-Cultural Community. In 2007, the members decided to accelerate the formation of the AEC in order to complete it by 2015. AEC aims to enable free flow of goods, services, labour and investment and create a single market and production base. Simona Mocuta, Director, IHS, believes that there is a possibility that the deadline of formation of AEC by December 2015 will be missed and the integration can take more time.
The intra-ASEAN economic integration process started with liberalization of trade in goods by implementing reduction and elimination of tariffs under the ASEAN Free Trade Agreement 1992 (AFTA). AFTA’s Common Effective Preferential Tariff (CEPT) plan aimed to achieve zero tariff for all products for the ASEAN-6 countries (Brunei Darussalam, Indonesia, Malaysia, Philippines, Singapore and Thailand) by 2010 and by 2015 for the CLMV. The ASEAN-6 countries have applied zero tariff rates for intra-ASEAN trade in more than 99% of tariff lines since 2010. The newer ASEAN members such as Cambodia, Lao PDR, Myanmar and Vietnam (CLMV) applied zero tariff rates to 72.6% of tariff lines in 2013, increasing from 45.9% in 2010. On whether the automotive industry has benefited from AFTA, Jakkrit Lerksomboonsiri, senior analyst LV Production Forecasting, IHS Automotive, says, “We can see the benefits in terms of labour, investment and infrastructure development which is crucial for investors. Upon formation of the AEC, we see demand going up.” Jakritt says in automotive, with the formation of AEC, some economies may benefit more. The bigger markets of Thailand, Indonesia and Malaysia may see more growth and benefit in the short term, but later we may see change in OEM strategy.
ASEAN is conducting liberalization of trade in services under its ASEAN Framework Agreement on Services of 1995 (AFAS). AFAS aims for ASEAN member countries to provide wider and deeper market access of service sectors than commitments made under the WTO General Agreement on Trade in Services (GATS). Initially, liberalization of the services market focused on financial services, transport, telecommunications, tourism and professional business services. But now members are
considering placing these seven sectors in a fast track programme and making commitments for an additional 27 sectors. The ASEAN members agreed to liberalize their investment in non-service sectors such as manufacturing, agriculture, forestry, fisheries and mining sectors under the Framework Agreement on ASEAN Investment Area (AIA) concluded in 1999. According to the Agreement, ASEAN-6 countries are obliged to give unconditional national treatment to investments of other members in all sectors by 2010 and 2020 for non-ASEAN investors, with a longer timeframe for CLMV.
As the intra-ASEAN economic integration process has been slow, many trading partners have formed bilateral and regional free trade agreements (FTAs) with ASEAN countries. Singapore concluded an FTA with New Zealand in 2000. Subsequently, the country has entered into FTAs with European Free Trade Association (EFTA) and its major trading partners such as Australia, the United States and Japan. Thailand followed suit and signed FTAs with Australia and New Zealand in 2010; also, the country has finalised the text for the Japan-Thailand Economic Partnership Agreement. FTA negotiations with the United States started in 2004, but these were interrupted by political events in Thailand. Malaysia concluded an agreement with Japan for an Economic Partnership in 2005, and the Philippines concluded an agreement with Japan for an economic partnership in 2006.
ASEAN has worked on FTA negotiations with China, India, Japan, Australia and New Zealand and South Korea. In August 2006, ASEAN signed the Trade and Investment Framework Agreement (TIFA) with the United States, which may lead to FTA negotiations. The EU has also expressed interest for FTA negotiations with ASEAN.
Table 1: ASEAN Free Trade AgreementssFTAs Launch date
ASEAN–Australia–New Zealand Free Trade Area (AANZFTA)
1 January 2010
ASEAN–China Free Trade Area (ACFTA) 1 January 2010
ASEAN–Korea Free Trade Area (AKFTA) 1 January 2010
ASEAN–India Free Trade Area (AIFTA) 1 January 2010
ASEAN–Japan Comprehensive Economic Partnership (AJCEP)
Gradually coming into force since 2009
The ASEAN countries are also part of negotiations on multilateral free trade agreements such as the Trans-Pacific Partnership (TPP) and the Regional Comprehensive Economic Partnership (RCEP). The TPP negotiations include Australia, Brunei, Canada, Chile, Japan, Malaysia, Mexico, New Zealand, Peru, Singapore, United States and Vietnam. The RCEP negotiations include all 10 ASEAN member countries and Australia, China, India, Japan, New Zealand and South Korea.
SAMPLE
© 2015 IHS 9 2015 edition
IHS Automotive | The ASEAN Automotive Supplier Report
Table 2: Free Trade Agreements under negotiationFTAs Value of bilateral trade in
goods (USD billion) 2011 or latest
Launch date
Trans-Pacific Partnership (TPP)
1,492.2 June 2005
Regional Comprehensive Economic Partnership (RCEP)
1,412.6 November 2012
Source: European Commission
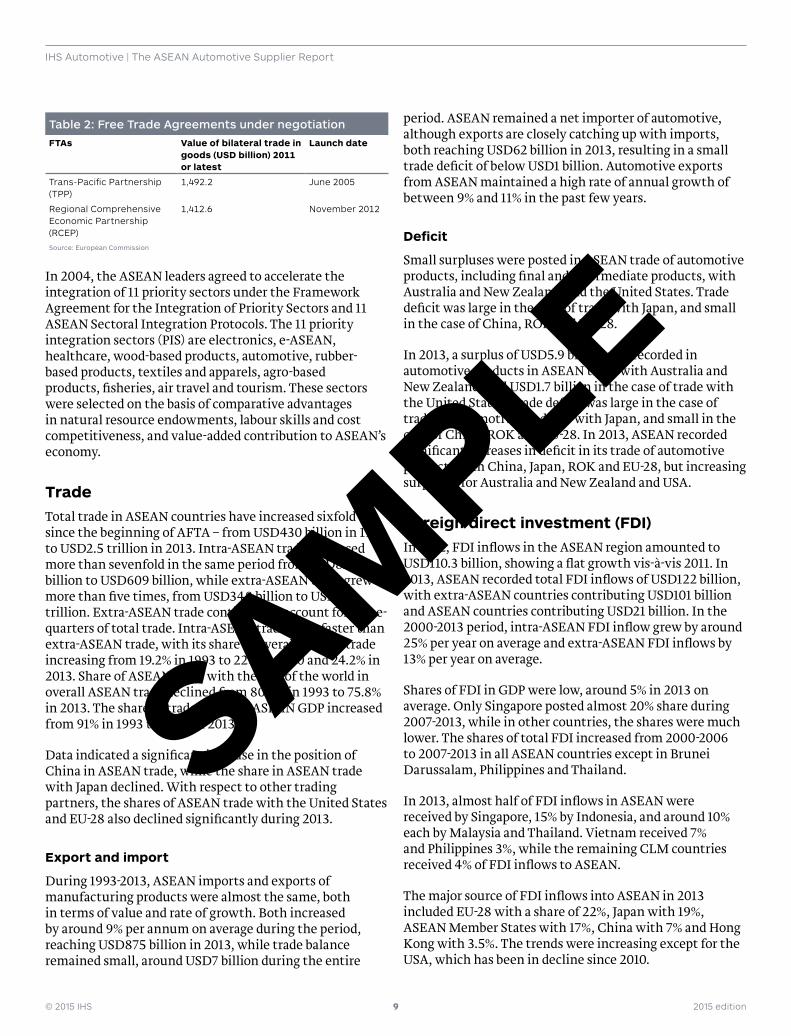
In 2004, the ASEAN leaders agreed to accelerate the integration of 11 priority sectors under the Framework Agreement for the Integration of Priority Sectors and 11 ASEAN Sectoral Integration Protocols. The 11 priority integration sectors (PIS) are electronics, e-ASEAN, healthcare, wood-based products, automotive, rubber-based products, textiles and apparels, agro-based products, fisheries, air travel and tourism. These sectors were selected on the basis of comparative advantages in natural resource endowments, labour skills and cost competitiveness, and value-added contribution to ASEAN’s economy.
TradeTotal trade in ASEAN countries have increased sixfold since the beginning of AFTA – from USD430 billion in 1993 to USD2.5 trillion in 2013. Intra-ASEAN trade increased more than sevenfold in the same period from USD82 billion to USD609 billion, while extra-ASEAN trade grew more than five times, from USD348 billion to USD1.9 trillion. Extra-ASEAN trade continued to account for three-quarters of total trade. Intra-ASEAN trade grew faster than extra-ASEAN trade, with its share in overall ASEAN trade increasing from 19.2% in 1993 to 22% in 2000 and 24.2% in 2013. Share of ASEAN trade with the rest of the world in overall ASEAN trade declined from 80.8% in 1993 to 75.8% in 2013. The share of trade in whole ASEAN GDP increased from 91% in 1993 to 105% in 2013.
Data indicated a significant increase in the position of China in ASEAN trade, while the share in ASEAN trade with Japan declined. With respect to other trading partners, the shares of ASEAN trade with the United States and EU-28 also declined significantly during 2013.
Export and import
During 1993-2013, ASEAN imports and exports of manufacturing products were almost the same, both in terms of value and rate of growth. Both increased by around 9% per annum on average during the period, reaching USD875 billion in 2013, while trade balance remained small, around USD7 billion during the entire
period. ASEAN remained a net importer of automotive, although exports are closely catching up with imports, both reaching USD62 billion in 2013, resulting in a small trade deficit of below USD1 billion. Automotive exports from ASEAN maintained a high rate of annual growth of between 9% and 11% in the past few years.
Deficit
Small surpluses were posted in ASEAN trade of automotive products, including final and intermediate products, with Australia and New Zealand, and the United States. Trade deficit was large in the case of trade with Japan, and small in the case of China, ROK and EU-28.
In 2013, a surplus of USD5.9 billion was recorded in automotive products in ASEAN trade with Australia and New Zealand, and USD1.7 billion in the case of trade with the United States. Trade deficit was large in the case of trade of automotive products with Japan, and small in the case of China, ROK and EU-28. In 2013, ASEAN recorded significant increases in deficit in its trade of automotive products with China, Japan, ROK and EU-28, but increasing surpluses for Australia and New Zealand and USA.
Foreign direct investment (FDI)In 2012, FDI inflows in the ASEAN region amounted to USD110.3 billion, showing a flat growth vis-à-vis 2011. In 2013, ASEAN recorded total FDI inflows of USD122 billion, with extra-ASEAN countries contributing USD101 billion and ASEAN countries contributing USD21 billion. In the 2000-2013 period, intra-ASEAN FDI inflow grew by around 25% per year on average and extra-ASEAN FDI inflows by 13% per year on average.
Shares of FDI in GDP were low, around 5% in 2013 on average. Only Singapore posted almost 20% share during 2007-2013, while in other countries, the shares were much lower. The shares of total FDI increased from 2000-2006 to 2007-2013 in all ASEAN countries except in Brunei Darussalam, Philippines and Thailand.
In 2013, almost half of FDI inflows in ASEAN were received by Singapore, 15% by Indonesia, and around 10% each by Malaysia and Thailand. Vietnam received 7% and Philippines 3%, while the remaining CLM countries received 4% of FDI inflows to ASEAN.
The major source of FDI inflows into ASEAN in 2013 included EU-28 with a share of 22%, Japan with 19%, ASEAN Member States with 17%, China with 7% and Hong Kong with 3.5%. The trends were increasing except for the USA, which has been in decline since 2010.
SAMPLE
© 2015 IHS 10 2015 edition
IHS Automotive | The ASEAN Automotive Supplier Report
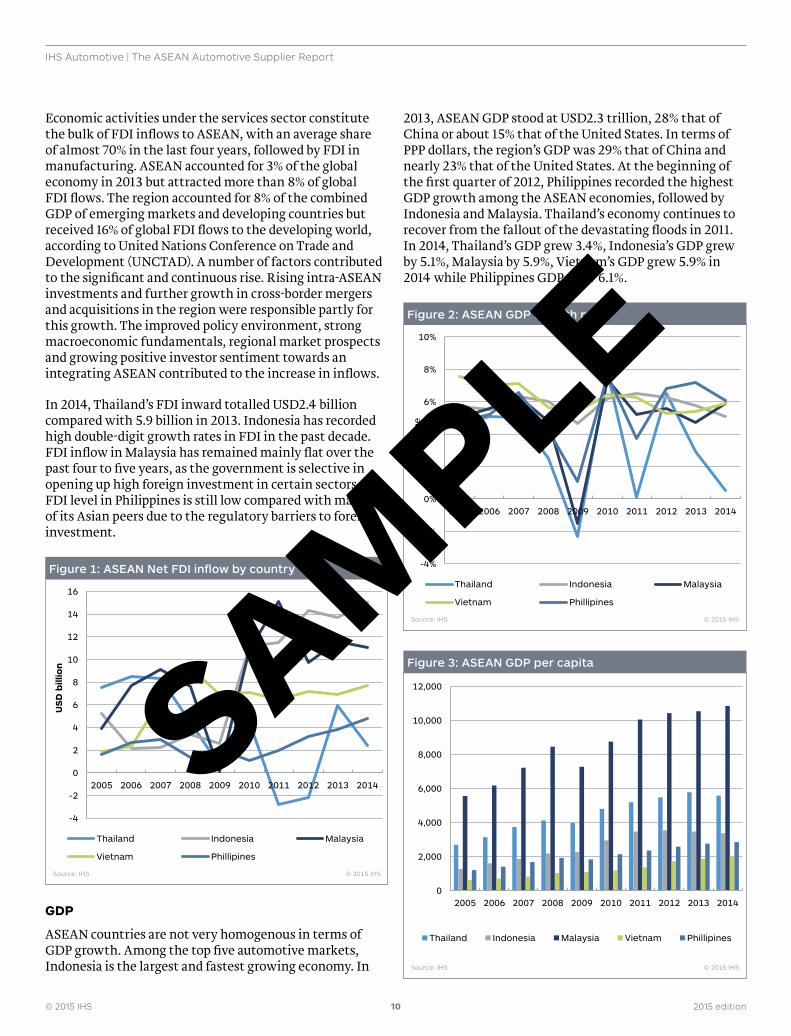
Economic activities under the services sector constitute the bulk of FDI inflows to ASEAN, with an average share of almost 70% in the last four years, followed by FDI in manufacturing. ASEAN accounted for 3% of the global economy in 2013 but attracted more than 8% of global FDI flows. The region accounted for 8% of the combined GDP of emerging markets and developing countries but received 16% of global FDI flows to the developing world, according to United Nations Conference on Trade and Development (UNCTAD). A number of factors contributed to the significant and continuous rise. Rising intra-ASEAN investments and further growth in cross-border mergers and acquisitions in the region were responsible partly for this growth. The improved policy environment, strong macroeconomic fundamentals, regional market prospects and growing positive investor sentiment towards an integrating ASEAN contributed to the increase in inflows.
In 2014, Thailand’s FDI inward totalled USD2.4 billion compared with 5.9 billion in 2013. Indonesia has recorded high double-digit growth rates in FDI in the past decade. FDI inflow in Malaysia has remained mainly flat over the past four to five years, as the government is selective in opening up high foreign investment in certain sectors. FDI level in Philippines is still low compared with many of its Asian peers due to the regulatory barriers to foreign investment.
Figure 1: ASEAN Net FDI inflow by country
-4
-2
0
2
4
6
8
10
12
14
16
2005 2006 2007 2008 2009 2010 2011 2012 2013 2014
Thailand Indonesia Malaysia
Vietnam Phillipines
Source: IHS © 2015 IHS
US
D b
illio
n
GDP
ASEAN countries are not very homogenous in terms of GDP growth. Among the top five automotive markets, Indonesia is the largest and fastest growing economy. In
2013, ASEAN GDP stood at USD2.3 trillion, 28% that of China or about 15% that of the United States. In terms of PPP dollars, the region’s GDP was 29% that of China and nearly 23% that of the United States. At the beginning of the first quarter of 2012, Philippines recorded the highest GDP growth among the ASEAN economies, followed by Indonesia and Malaysia. Thailand’s economy continues to recover from the fallout of the devastating floods in 2011. In 2014, Thailand’s GDP grew 3.4%, Indonesia’s GDP grew by 5.1%, Malaysia by 5.9%, Vietnam’s GDP grew 5.9% in 2014 while Philippines GDP grew 6.1%.
Figure 2: ASEAN GDP Growth rate
-4%
-2%
0%
2%
4%
6%
8%
10%
2005 2006 2007 2008 2009 2010 2011 2012 2013 2014
Thailand Indonesia Malaysia
Vietnam Phillipines
Source: IHS © 2015 IHS
Per
cen
tag
e
Figure 3: ASEAN GDP per capita
0
2,000
4,000
6,000
8,000
10,000
12,000
2005 2006 2007 2008 2009 2010 2011 2012 2013 2014
Thailand Indonesia Malaysia Vietnam Phillipines
Source: IHS © 2015 IHS
SAMPLE