IHA Request from LDEO for Marine Geophysical Survey …€“March 2012 submitted by ... Multibeam...
82
Request by Lamont-Doherty Earth Observatory for an Incidental Harassment Authorization to Allow the Incidental Take of Marine Mammals during a Marine Geophysical Survey by the R/V Marcus G. Langseth in the Commonwealth of the Northern Mariana Islands, February–March 2012 submitted by Lamont-Doherty Earth Observatory 61 Route 9W, P.O. Box 1000 Palisades, NY 10964-8000 to National Marine Fisheries Service Office of Protected Resources 1315 East–West Hwy, Silver Spring, MD 20910-3282 Application Prepared by LGL Limited, environmental research associates 22 Fisher St., POB 280 King City, Ont. L7B 1A6 27 September 2011 LGL Report TA4858-2
Transcript of IHA Request from LDEO for Marine Geophysical Survey …€“March 2012 submitted by ... Multibeam...

Request by Lamont-Doherty Earth Observatory for an Incidental Harassment Authorization to Allow the
Incidental Take of Marine Mammals during a Marine Geophysical Survey by the R/V Marcus G. Langseth
in the Commonwealth of the Northern Mariana Islands, February–March 2012
submitted by
Lamont-Doherty Earth Observatory 61 Route 9W, P.O. Box 1000 Palisades, NY 10964-8000
to
National Marine Fisheries Service Office of Protected Resources
1315 East–West Hwy, Silver Spring, MD 20910-3282
Application Prepared by
LGL Limited, environmental research associates 22 Fisher St., POB 280 King City, Ont. L7B 1A6
27 September 2011
LGL Report TA4858-2

L-DEO IHA Application for the CNMI, 2012 Page ii

Table of Contents
L-DEO IHA Application for the CNMI, 2012 Page iii
TABLE OF CONTENTS Page
SUMMARY ..................................................................................................................................................... 1
I. OPERATIONS TO BE CONDUCTED .............................................................................................................. 1
Overview of the Activity .................................................................................................................... 1
Vessel Specifications .......................................................................................................................... 3
Airgun Description ............................................................................................................................. 4
Acoustic Measurements ...................................................................................................................... 5
Predicted Sound Levels ...................................................................................................................... 7
Description of Operations ................................................................................................................... 7 OBS Description and Deployment ........................................................................................... 8 Multibeam Echosounder and Sub-bottom Profiler................................................................... 8
II. DATES, DURATION, AND REGION OF ACTIVITY....................................................................................... 9
III. SPECIES AND NUMBERS OF MARINE MAMMALS IN AREA ..................................................................... 9
IV. STATUS, DISTRIBUTION AND SEASONAL DISTRIBUTION OF AFFECTED SPECIES OR STOCKS OF MARINE MAMMALS ..................................................................................................................... 11
Mysticetes ......................................................................................................................................... 11
Odontocetes ...................................................................................................................................... 16
V. TYPE OF INCIDENTAL TAKE AUTHORIZATION REQUESTED .................................................................. 25
VI. NUMBERS OF MARINE MAMMALS THAT COULD BE TAKEN................................................................ 25
VII. ANTICIPATED IMPACT ON SPECIES OR STOCKS .................................................................................. 25
Summary of Potential Effects of Airgun Sounds ............................................................................. 26 Tolerance ................................................................................................................................ 26 Masking .................................................................................................................................. 26 Disturbance Reactions ............................................................................................................ 27 Hearing Impairment and Other Physical Effects.................................................................... 31
Possible Effects of Multibeam Echosounder Signals ....................................................................... 37 Masking .................................................................................................................................. 37 Behavioral Responses ............................................................................................................ 37 Hearing Impairment and Other Physical Effects.................................................................... 38
Possible Effects of the Sub-bottom Profiler Signals......................................................................... 39 Masking .................................................................................................................................. 39 Behavioral Responses ............................................................................................................ 39 Hearing Impairment and Other Physical Effects.................................................................... 39
Possible Effects of the Acoustic Release Signals ............................................................................. 39
Numbers of Marine Mammals that could be “Taken by Harassment” ............................................. 39 Basis for Estimating “Take by Harassment” .......................................................................... 40 Potential Number of Marine Mammals Exposed to Airgun Sounds ...................................... 42 Conclusions ............................................................................................................................ 44

Table of Contents
L-DEO IHA Application for the CNMI, 2012 Page iv
VIII. ANTICIPATED IMPACT ON SUBSISTENCE ........................................................................................... 45
IX. ANTICIPATED IMPACT ON HABITAT ..................................................................................................... 45
Effects on Fish .................................................................................................................................. 45 Pathological Effects ............................................................................................................... 46 Physiological Effects .............................................................................................................. 47 Behavioral Effects .................................................................................................................. 47 Effects on Fisheries ................................................................................................................ 48
Effects on Invertebrates .................................................................................................................... 48 Pathological Effects ............................................................................................................... 48 Physiological Effects .............................................................................................................. 49 Behavioral Effects .................................................................................................................. 49
X. ANTICIPATED IMPACT OF LOSS OR MODIFICATION OF HABITAT ON MARINE MAMMALS ................... 50
XI. MITIGATION MEASURES....................................................................................................................... 50
Planning Phase.................................................................................................................................. 50
Proposed Exclusion Zones ............................................................................................................... 51
Mitigation During Operations .......................................................................................................... 52 Power-down Procedures ........................................................................................................ 52 Shut-down Procedures ........................................................................................................... 52 Ramp-up Procedures .............................................................................................................. 52
XII. PLAN OF COOPERATION ...................................................................................................................... 53
XIII. MONITORING AND REPORTING PLAN ................................................................................................ 54
Vessel-based Visual Monitoring ...................................................................................................... 54
Passive Acoustic Monitoring ............................................................................................................ 55
PSO Data and Documentation .......................................................................................................... 56
XIV. COORDINATING RESEARCH TO REDUCE AND EVALUATE INCIDENTAL TAKE .................................. 57
XV. LITERATURE CITED ............................................................................................................................. 57
Marine Mammals and Acoustics ...................................................................................................... 57
Fish, Invertebrates, and Other........................................................................................................... 76

Summary
L-DEO IHA Application for the CNMI, 2012 Page 1
Request by Lamont-Doherty Earth Observatory for an Incidental Harassment Authorization to Allow the
Incidental Take of Marine Mammals during a Marine Geophysical Survey by the R/V Marcus G. Langseth
in the Commonwealth of the Northern Mariana Islands, February–March 2012
SUMMARY
Lamont-Doherty Earth Observatory (L-DEO), with research funding from the National Science Foundation (NSF), plans to conduct a marine seismic survey in the Commonwealth of the Northern Mariana Islands (CNMI), a commonwealth in a political union with the U.S., during February–March 2012. The survey will take place in International Waters and the Exclusive Economic Zone (EEZ) of the U.S. in water depths >2000 m. The seismic study will use a towed array of 36 airguns with a total discharge volume of ~6600 in3. L-DEO requests that it be issued an Incidental Harassment Authorization (IHA) allowing non-lethal takes of marine mammals incidental to the planned seismic survey. This request is submitted pursuant to Section 101 (a) (5) (D) of the Marine Mammal Protection Act (MMPA), 16 U.S.C. § 1371 (a) (5).
Numerous species of marine mammals inhabit the proposed study area in the CNMI. Several of these species are listed as endangered under the U.S. Endangered Species Act (ESA), including the North Pacific right, sperm, humpback, sei, fin, and blue whales. With the exception of humpback and sperm whales, these species are also considered endangered by the International Union for Conservation of Nature and Natural Resources (IUCN) 2011 Red List of Threatened species. Other ESA-listed species that could occur in the area are the endangered leatherback and hawksbill turtles, the threatened green, loggerhead, and olive ridley turtles, and the threatened Newell’s shearwater.
The items required to be addressed pursuant to 50 C.F.R. § 216.104, “Submission of Requests”, are set forth below. They include descriptions of the specific operations to be conducted, the marine mam-mals occurring in the study area, proposed measures to mitigate against any potential injurious effects on marine mammals, and a plan to monitor any behavioral effects of the operations on those marine mammals.
I. OPERATIONS TO BE CONDUCTED A detailed description of the specific activity or class of activities that can be expected to result in inci-dental taking of marine mammals.
Overview of the Activity L-DEO plans to conduct a seismic survey in the CNMI during February–March 2012. Some minor
deviation from these dates is possible, depending on logistics and weather. The survey will take place in the area 16.5–19°N, 146.5–150.5°E, where water depths range from ~2000 to >8000 m (Fig. 1). The seismic survey will be conducted in the U.S. EEZ and in International Waters. The closest that the vessel will approach to any island is ~50 km from Alamagan (Fig. 1).

I. Operations to be C
onducted
FIGURE 1. Study area and proposed seismic transect lines in the Commonwealth of the Northern Mariana Islands for the L-DEO survey planned for February–March 2012.
L-DEO
IHA Application for the CN
MI, 2012
Page 2
LEGEND Manana Trench Manne National Monument
C T.-nOlI Unit
C
Oceln Deplh C<nIour
OBS Locations
a S',,:nl'e.iod • Shortl'eriod 11y) * en::..<l>and(l),)
------
'J
.-----...

I. Operations to be Conducted
L-DEO IHA Application for the CNMI, 2012 Page 3
L-DEO plans to conduct the seismic survey over the Mariana outer forearc, the trench and the outer rise of the subducting and bending Pacific plate. The objective is to understand the water cycle within subduction-zone systems. Subduction systems are where the basic building blocks of continental crust are made and where Earth’s great earthquakes occur. Little is known about either of these processes, but water cycling through the system is thought to be the primary controlling factor in both arc-crust generation and megathrust seismicity.
The source vessel, the R/V Marcus G. Langseth, will deploy an array of 36 airguns as an energy source at a tow depth of 9 m. The acoustic receiving system will consist of a 6-km long hydrophone streamer and ~85 ocean bottom seismometers (OBSs). As the airgun array is towed along the survey lines, the hydrophone streamer will receive the returning acoustic signals and transfer the data to the on-board processing system. The OBSs record the returning acoustic signals internally for later analysis. The OBSs to be used for the 2012 program will be deployed and most (~60) will be retrieved during the cruise, whereas 25 will be left in place for one year.
The planned seismic survey will take place in water depths ranging from ~2000 to >8000 m and consist of ~2800 km of transect lines (including turns) in the CNMI (Fig. 1). This includes one line and parts of three lines shown in Figure 1 that are shot twice at different shot intervals: the westernmost north-south line and the western portions of he three east-west lines. All planned geophysical data acquisition activities will be conducted by L-DEO with on-board assistance by the scientists who have proposed the study. The Principal Investigators (PIs) are Drs. Doug Wiens (Washington University, St. Louis, MO) and Daniel Lizarralde (Woods Hole Oceanographic Institute, Woods Hole, MA). The vessel will be self-contained, and the crew will live aboard the vessel for the entire cruise.
Vessel Specifications
The R/V Marcus G. Langseth will be used as the source vessel. The Langseth will tow the 36-airgun array along predetermined lines (Fig. 1). The Langseth will also tow the hydrophone streamer and deploy and retrieve the OBSs. When the Langseth is towing the airgun array as well as the hydrophone streamer, the turning rate of the vessel while the gear is deployed is limited to five degrees per minute. Thus, the maneuverability of the vessel is limited during operations with the streamer.
The Langseth has a length of 71.5 m, a beam of 17.0 m, and a maximum draft of 5.9 m. The Langseth was designed as a seismic research vessel, with a propulsion system designed to be as quiet as possible to avoid interference with the seismic signals. The ship is powered by two Bergen BRG-6 diesel engines, each producing 3550 hp, which drive the two propellers directly. Each propeller has four blades, and the shaft typically rotates at 750 revolutions per minute (rpm). The vessel also has an 800 hp bow-thruster, which is not used during seismic acquisition. The operation speed during seismic acquisition is typically 7.4–9.3 km/h. When not towing seismic survey gear, the Langseth typically cruises at 18.5 km/h. The Langseth has a range of 25,000 km (the distance the vessel can travel without refueling).
The Langseth will also serve as the platform from which vessel-based protected species observers (PSOs) will watch for marine mammals and sea turtles before and during airgun operations, as described in § XIII, below.
Other details of the Langseth include the following: Owner: National Science Foundation Operator: Lamont-Doherty Earth Observatory of Columbia University Flag: United States of America Date Built: 1991 (Refitted in 2006)

I. Operations to be Conducted
L-DEO IHA Application for the CNMI, 2012 Page 4
Gross Tonnage: 3834 Accommodation Capacity: 55 including ~35 scientists
Airgun Description During the survey, the airgun array to be used will consist of 36 airguns, with a total discharge
volume of ~6600 in3
The four airgun strings will be distributed across an area of ~24×16 m behind the Langseth and will be towed ~140 m behind the vessel. The shot interval will be 37.5 m or 150 m during the study. The shot interval will be relatively short (37.5 m or ~15–18 s) for multichannel seismic (MCS) surveying with the hydrophone streamer (most of the seismic operations), and relatively long (150 m or ~58–73 s) when recording data on the OBSs. During firing, a brief (~0.1 s) pulse of sound is emitted; the airguns will be silent during the intervening periods.
. The airgun array will consist of a mixture of Bolt 1500LL and Bolt 1900LLX airguns. The airguns will be configured as four identical linear arrays or “strings” (Fig. 2). Each string will have ten airguns; the first and last airguns in the strings are spaced 16 m apart. Nine airguns in each string will be fired simultaneously, whereas the tenth is kept in reserve as a spare, to be turned on in case of failure of another airgun.
Because the actual source is a distributed sound source (36 airguns) rather than a single point source, the highest sound levels measurable at any location in the water will be less than the nominal source level. In addition, the effective source level for sound propagating in near-horizontal directions will be substantially lower than the nominal source level applicable to downward propagation because of the directional nature of the sound from the airgun array.
36-Airgun Array Specifications
Energy Source Thirty-six 1900 psi Bolt airguns of 40–360 in3, in four strings each containing nine operating airguns Source output (downward) 0-pk is 84 bar-m (259 dB re 1 μPa · m);
pk-pk is 177 bar · m (265 dB) Air discharge volume ~6600 in3
Dominant frequency components 2–188 Hz
FIGURE 2. One linear airgun array or string with ten airguns, nine of which would be operating.

I. Operations to be Conducted
L-DEO IHA Application for the CNMI, 2012 Page 5
Acoustic Measurements
Received sound levels have been predicted by L-DEO, in relation to distance and direction from the airguns, for the 36-airgun array and for a single 1900LL 40-in3 airgun, which will be used during power downs. Results were reported for propagation measurements of pulses from the 36-airgun array in two water depths (~1600 m and 50 m) in the Gulf of Mexico in 2007–2008 (Tolstoy et al. 2009). However, measurements were not reported for a single airgun, although the sound levels in deep water have been modeled (Fig. 3). A detailed description of the modeling effort is provided in Appendix A of the Environmental Assessment (EA).
The predicted sound contours for the 40-in3 mitigation airgun are shown in Figure 3 as sound exposure levels (SEL) in decibels (dB) re 1 μPa2 · s. SEL is a measure of the received energy in the pulse and represents the sound pressure level (SPL) that would be measured if the pulse energy were spread evenly across a 1-s period. Because actual seismic pulses are less than 1 s in duration in most situations, this means that the SEL value for a given pulse is usually lower than the SPL calculated for the actual duration of the pulse (see Appendix B of the EA). The advantage of working with SEL is that the SEL measure accounts for the total received energy in the pulse, and biological effects of pulsed sounds are believed to depend mainly on pulse energy (Southall et al. 2007). In contrast, SPL for a given pulse depends greatly on pulse duration. A pulse with a given SEL can be long or short depending on the extent to which propagation effects have “stretched” the pulse duration. The SPL will be low if the duration is long and higher if the duration is short, even though the pulse energy (and presumably the biological effects) are the same.
Although SEL is now believed to be a better measure than SPL when dealing with biological effects of pulsed sound, SPL is the measure that has been most commonly used in studies of marine mammal reactions to airgun sounds and in NMFS guidelines concerning levels above which “taking” might occur. SPL is often referred to as rms or “root mean square” pressure, averaged over the pulse duration. As noted above, the rms received levels that are used as impact criteria for marine mammals are not directly comparable to pulse energy (SEL). At the distances where rms levels are 160–190 dB re 1 μPa, the difference between the SEL and SPL values for the same pulse measured at the same location usually average ~10–15 dB, depending on the propagation characteristics of the location (Greene 1997; McCauley et al. 1998, 2000a; Appendix B). In this EA, we assume that rms pressure levels of received seismic pulses will be 10 dB higher than the SEL values predicted by L-DEO’s model. Thus, we assume that 170 dB SEL ≈ 180 dB re 1 μParms. It should be noted that neither the SEL nor the SPL (=rms) measure is directly comparable to the peak or peak-to-peak pressure levels normally used by geophysicists to characterize source levels of airguns. Peak and peak-to-peak pressure levels for airgun pulses are always higher than the rms dB referred to in much of the biological literature (Greene 1997; McCauley et al. 1998, 2000a). For example, a measured received level of 160 dB re 1 μParms in the far field typically would correspond to a peak measurement of ~170–172 dB re 1 µPa, and to a peak-to-peak measurement of ~176–178 dB re 1 μPa, as measured for the same pulse received at the same location (Greene 1997; McCauley et al. 1998, 2000a). (The SEL value for the same pulse would normally be 145–150 dB re 1 µPa2 · s). The precise difference between rms and peak or peak-to-peak values for a given pulse depends on the frequency content and duration of the pulse, among other factors. However, the rms level is always lower than the peak or peak-to-peak level and (for an airgun-type source at the ranges relevant here) higher than the SEL value.

I. Operations to be Conducted
L-DEO IHA Application for the CNMI, 2012 Page 6
FIGURE 3. Modeled received sound levels (SELs) from a single 40-in3 airgun operating in deep water, which is planned for use as a mitigation gun during the survey in the CNMI, 5 February–21 March 2012. Received rms levels (SPLs) are expected to be ~10 dB higher.
"",. All . meters· FOIWaId -> -20 ·10 0 10 <'II
.. ,-- - - - - - - - - --v -: ==:::0:-"
., ."
~
~ I • SEL, dB §
~
",
~
~ ~ ~ ." • " • • ~ • <== '" - meters - FOIward ==>
= = '00 '00 = = ~
- -,"'" :: - -_ _ -I!JO ,
] 1 " " , ro ' "
' , , , , , , , I ' , ' 00 , , , , , , ' , , , , -- --, , -- - .... . -' , , , = , • • • ,
.~ ,
" " " , , ! , , , ,
~ ,
, ,
t
---------~
= '00 '00 = ~

I. Operations to be Conducted
L-DEO IHA Application for the CNMI, 2012 Page 7
Predicted Sound Levels
To determine exclusion zones (EZs) for the airgun array to be used in the CNMI, it would be prudent to use the empirical values that resulted from the propagation measurements in the Gulf of Mexico (Tolstoy et al. 2009). That study showed that radii around the airguns for various received levels varied in deep (~1600 m) and shallow (50 m) water. In addition, propagation varies with array tow depth. The depth of the array was different in the Gulf of Mexico calibration study (6 m) than in the proposed survey (9 m); thus, correction factors have been applied to the distances reported by Tolstoy et al. (2009). The correction factors used were the ratios of the 160-, 180-, and 190-dB distances from the modeled results for the 6600-in3 airgun array towed at 6 m vs. 9 m. For a single airgun, the tow depth has minimal effect on the maximum near-field output and the shape of the frequency spectrum for the single airgun; thus, the predicted safety radii are essentially the same at different tow depths. The L-DEO model does not allow for bottom interactions, and thus is most directly applicable to deep water. A detailed description of the modeling effort is provided in Appendix A of the EA.
Using the corrected measurements (array) or model (single airgun), Table 1 shows the distances at which four rms sound levels are expected to be received from the 36-airgun array and a single airgun. The 180- and 190-dB re 1 μParms distances are the safety criteria as specified by NMFS (2000) and are applicable to cetaceans and pinnipeds, respectively. The 180-dB distance will also be used as the EZ for sea turtles, as required by NMFS in most other recent seismic projects (e.g., Smultea et al. 2004; Holst et al. 2005b; Holst and Beland 2008; Holst and Smultea 2008; Hauser et al. 2008). If marine mammals or turtles are detected within or about to enter the appropriate EZ, the airguns will be powered down (or shut down if necessary) immediately.
Southall et al. (2007) made detailed recommendations for new science-based noise exposure criteria. L-DEO will be prepared to revise its procedures for estimating numbers of mammals “taken”, EZs, etc., as may be required by any new guidelines established by NMFS as a result of these recommendations. Currently the procedures are based on best practices noted by Pierson et al. (1998) and Weir and Dolman (2007), as NMFS has not yet specified a new procedure for determining EZs.
Description of Operations The source vessel, the R/V Marcus G. Langseth, will deploy an array of 36 airguns as an energy source at a tow depth of 9 m. The receiving system for the returning acoustic signals will consist of ~85 OBSs as well as a 6-km hydrophone streamer. As the airgun array is towed along the survey lines, the hydrophone streamer will receive the returning acoustic signals and transfer the data to the on-board processing system. The OBSs record the returning acoustic signals internally for later analysis.
The planned seismic survey will consist of ~2800 km of transect lines (including turns) in the CNMI (Fig. 1). All survey effort will occur in water depths >2000 m deep. There will be additional seismic operations in the survey area associated with airgun testing, and repeat coverage of any areas where initial data quality is sub-standard. In our calculations (§ VII), 25% has been added for those additional operations.

I. Operations to be Conducted
L-DEO IHA Application for the CNMI, 2012 Page 8
TABLE 1. Measured (array) or predicted (single aigun) distances to which sound levels ≥190, 180, and 160 dB re 1 μParms could be received in deep (>1000 m) water during the proposed survey in the CNMI, 5 February–21 March 2012. Measured radii for the array are based on Tolstoy at al. (2009), and predicted radii for a single airgun are based on Figure 3, assuming that received levels on an RMS basis are, numerically, 10 dB higher than the SEL values shown in Figure 3.
Source and Volume
Predicted RMS Distances (m) in deep (>1000 m) water
190 dB 180 dB 160 dB Single Bolt airgun, 40 in3 12 40 385
4 strings, 36 airguns, 6600 in3, tow depth 9 m 400 940 3850
OBS Description and Deployment
Approximately 85 OBSs will be deployed by the R/V Langseth before the survey, in water depths of 3100–8100 m. There are three types of OBS deployments: (1) ~20 broad-band OBSs located on the bottom in a wide 2-dimensional array with a spacing of no more than 100 km, (2) ~5 short-period OBSs tethered in the water column above the trench areas deeper than 6 km, and (3) ~60 short-period OBSs located on the bottom in a 2-D array with a spacing of about 75 km (Fig 1.). The first two types will be left in place for one year for passive recording, and the third type will be retrieved after the seismic operations. OBSs deployed in water deeper than 5500 m will require a tether to keep the instruments at a depth of 5500–6000 m, as the instruments are rated to a maximum depth of 6000 m. The lengths of the tethers will vary from 65–2600 m. The tether will fall to the seafloor when the OBS is released.
Two different types of OBSs may be used during the 2012 program. The Woods Hole Ocean-ographic Institution (WHOI) “D2” OBS has a height of ~1 m and a maximum diameter of 50 cm. The anchor is made of hot-rolled steel and weighs 23 kg. The anchor dimensions are 2.5 × 30.5 × 38.1 cm. The LC4x4 OBS from the Scripps Institution of Oceanography (SIO) has a volume of ~1 m3, with an anchor that consists of a large piece of steel grating (~1 m2
Multibeam Echosounder and Sub-bottom Profiler
). Once an OBS is ready to be retrieved, an acoustic release transponder interrogates the OBS at a frequency of 9–11 kHz, and a response is received at a frequency of 9–13 kHz. The burn-wire release assembly is then activated, and the instrument is released from the anchor to float to the surface.
Along with the airgun operations, two additional acoustical data acquisition systems will be operat-ed from the Langseth continuously during the survey. The ocean floor will be mapped with the Kongsberg EM 122 MBES and a Knudsen Chirp 3260 SBP. These sound sources will be operated from the Langseth continuously throughout the cruise.
The Kongsberg EM 122 MBES operates at 10.5–13 (usually 12) kHz and is hull-mounted on the Langseth. The transmitting beamwidth is 1 or 2° fore–aft and 150° athwartship. The maximum source level is 242 dB re 1 μPa · mrms. Each “ping” consists of eight (in water >1000 m deep) or four (<1000 m) successive fan-shaped transmissions, each ensonifying a sector that extends 1° fore–aft. Continuous-wave (CW) pulses increase from 2 to 15 ms long in water depths up to 2600 m, and frequency-modulated (FM) chirp pulses up to 100 ms long are used in water >2600 m. The successive transmissions span an overall cross-track angular extent of about 150°, with 2-ms gaps between the pulses for successive sectors.

I. Operations to be Conducted
L-DEO IHA Application for the CNMI, 2012 Page 9
The Knudsen Chirp 3260 SBP is normally operated to provide information about the sedimentary features and the bottom topography that is being mapped simultaneously by the MBES. The SBP is capable of reaching depths of 10,000 m. The beam is transmitted as a 27º cone, which is directed downward by a 3.5-kHz transducer in the hull of the Langseth. The nominal power output is 10 kW, but the actual maximum radiated power is 3 kW or 222 dB re 1 μPa ·
Langseth Sub-bottom Profiler Specifications
m. The ping duration is up to 64 ms, and the ping interval is 1 s. A common mode of operation is to broadcast five pings at 1-s intervals followed by a 5-s pause.
Maximum source output (downward) 222 dB re 1 μPa · m Dominant frequency components 3.5 kHz; up to 210 kHz Nominal beam width ~27 degrees Ping duration up to 64 ms
II. DATES, DURATION, AND REGION OF ACTIVITY
The date(s) and duration of such activity and the specific geographical region where it will occur.
The survey will occur in the CNMI in the area 16.5–19°N, 146.5–150.5°E (Fig. 1). The Langseth will depart from Guam on 5 February and return there on 21 March 2012, with a return to port during 2–5 March. Seismic operations will be carried out for 16 days, with the balance of the cruise occupied in transit (~2 days) and in deployment and retrieval of OBSs and maintenance (25 days). Some minor deviation from this schedule is possible, depending on logistics and weather (i.e., the cruise may depart earlier or be extended due to poor weather; there could be additional days (up to 3) of seismic operations if collected data are deemed to be of substandard quality).
III. SPECIES AND NUMBERS OF MARINE MAMMALS IN AREA
The species and numbers of marine mammals likely to be found within the activity area
Twenty-seven cetacean species, including 20 odontocete (dolphins and small- and large-toothed whales) species and 7 mysticetes (baleen whales) are known to occur in the CNMI. Information on the occurrence, distribution, population size, and conservation status for each of the 27 marine mammal species that may occur in the proposed project area is presented in Table 2. The status of these species is based on the ESA, the IUCN Red List of Threatened Species, and the Convention on International Trade in Endangered Species (CITES). Several species are listed under the ESA as endangered: the North Pacific right whale, sperm, humpback, fin, sei, and blue whales.
There are no reported sightings of pinnipeds in the CNMI (e.g., DoN 2005). The dugong (Dugong dugon), also listed under the ESA as endangered, is distributed throughout most of the Indo-Pacific region between ~27º north and south of the equator (Marsh 2002), but it seems unlikely that dugongs have ever inhabited the Mariana Islands (Nishiwaki et al. 1979). There have been some extralimital sightings in Guam, including a single dugong in Cocos Lagoon in 1974 (Randall et al. 1975) and several sightings of an individual in 1985 along the southeastern coast (Eldredge 2003). Since it is very unlikely that dugongs would be present at the survey site, they are not considered further in this analysis.

III. Species and Numbers of Marine Mammals
L-DEO IHA Application for the CNMI, 2012 Page 10
TABLE 2. The habitat, abundance, and conservation status of marine mammals that could occur in or near the proposed seismic survey area in the CNMI.
Species Habitat Regional pop’n
sizea U.S. ESAb IUCNc CITESd
Mysticetes North Pacific right whale Pelagic and coastal a few 100s EN EN I Humpback whale Mainly nearshore, banks 938–1107 e EN LC I Minke whale Pelagic and coastal 25,000 f NL LC I Bryde’s whale Pelagic and coastal 20,000–30,000 NL DD I Sei whale Primarily offshore, pelagic 7260–12,620 g EN EN I Fin whale Continental slope, pelagic 13,620–18,680h EN EN I Blue whale Pelagic and coastal N.A. EN EN I Odontocetes Sperm whale Usually pelagic, deep sea
29,674 i
EN
VU
I
Pygmy sperm whale Deep waters off the shelf N.A. - DD II Dwarf sperm whale Deep waters off the shelf 11,200 j - DD II Cuvier’s beaked whale Pelagic 20,000 j - LC II Longman’s beaked whale Deep water N.A. - DD II Blainville’s beaked whale Pelagic 25,300 k - DD II Ginkgo-toothed beaked whale Pelagic N.A. - DD II Rough-toothed dolphin Deep water 146,000 j - LC II Common bottlenose dolphin Coastal, oceanic, shelf break 243,500 j - LC II Pantropical spotted dolphin Coastal and pelagic 800,000 j - LC II Spinner dolphin Coastal and pelagic 800,000 j - DD II Striped dolphin Off continental shelf 1 million j - LC II Fraser’s dolphin Waters >1000 m 289,000 j - LC II Short-beaked common dolphin Shelf, pelagic, seamounts 3 million j - LC II Risso’s dolphin Water >1000 m, seamounts 175,000 j - LC II Melon-headed whale Oceanic 45,000 j - LC II Pygmy killer whale Deep, pantropical waters 39,000 j - DD II False killer whale Pelagic 40,000 j - DD II Killer whale Widely distributed 8500 j - DD II Short-finned pilot whale Pelagic, high-relief topography 500,000 j - DD II
N.A. - Data not available or species status not assessed. ? indicates uncertainty. a North Pacific (Jefferson et al. 2008) unless otherwise indicated b U.S. Endangered Species Act; EN = Endangered, NL = Not listed
c Codes for IUCN classifications; EN = Endangered; VU = Vulnerable; NT = Near Threatened; LC = Least Concern. Classifications are from the IUCN Red List of Threatened Species (IUCN 2011). d Convention on International Trade in Endangered Species of Wild Fauna and Flora (UNEP-WCMC 2011): Appendix I = Threatened with extinction; Appendix II = not necessarily now threatened with extinction but may become so unless trade is closely controlled. e Western North Pacific (Calambokidis et al. 2008). f Northwest Pacific and Okhotsk Sea (IWC 2010). g North Pacific (Tillman 1977). h North Pacific (Ohsumi and Wada 1974). i Western North Pacific (Whitehead 2002b). j Eastern Tropical Pacific or ETP (Wade and Gerrodette 1993). k ETP; all Mesoplodon spp. (Wade and Gerrodette 1993).

IV. Seasonal Distribution of Affected Species and Stocks
L-DEO IHA Application for the CNMI, 2012 Page 11
IV. STATUS, DISTRIBUTION AND SEASONAL DISTRIBUTION OF AFFECTED SPECIES OR STOCKS OF MARINE MAMMALS
A description of the status, distribution, and seasonal distribution (when applicable) of the affected species or stocks of marine mammals likely to be affected by such activities
Sections III and IV are integrated here to minimize repetition.
Mysticetes North Pacific Right Whale (Eubalaena japonica)
The North Pacific right whale is listed as endangered under the ESA, endangered on the IUCN Red List of Threatened Species (IUCN 2011), and it is listed in CITES Appendix I (UNEP-WCMC 2011) (Table 2). It is considered by NMFS (1991) to be the most endangered baleen whale in the world. Although protected from commercial whaling since 1935, there has been little indication of recovery. The pre-exploitation stock may have exceeded 11,000 animals (NMFS 1991). There are no reliable population estimates for this species. Wada (1973; see also Braham and Rice 1984) provided an estimate of 100–200 right whales in the North Pacific, and Jefferson et al. (2008) indicate that there are “no more than a few hundred right whales alive today”.
North Pacific right whales summer in the northern North Pacific and Bering Sea, apparently feeding off southern and western Alaska from May to September (e.g., Tynan et al. 2001). Wintering areas are unknown, but have been suggested to include the Hawaiian Islands and the Ryukyu Islands (Allen 1942; Banfield 1974; Gilmore 1978; Reeves et al. 1978; Herman et al. 1980). In April 1996, a right whale was sighted off Maui, the first documented sighting of a right whale in Hawaiian waters since 1979 (Herman et al. 1980; Rowntree et al. 1980).
Whaling records indicate that right whales once ranged across the entire North Pacific Ocean north of 35ºN and occasionally occurred as far south as 20ºN. In the western Pacific, most sightings in the 1900s were reported from Japanese waters, followed by the Kuril Islands, and the Okhotsk Sea (Brownell et al. 2001). However, since the 1960s sightings have been relatively rare (e.g., Clapham et al. 2004; Shelden et al. 2005). Nonetheless, in the western Pacific, significant numbers of right whales have been seen in the Okhotsk Sea during the 1990s, suggesting that the adjacent Kuril Islands and Kamchatka coast are a major feeding ground (Brownell et al. 2001). Right whales were also seen near Chichi-jima Island (Bonin Island), Japan, in the 1990s (Mori et al. 1998). Several breeding grounds have been proposed, including the Ryukyu Islands and the Sea of Japan (Omura 1986), offshore waters (Scarff 1991), and off Guangdong province, southern China (Rudolph and Smeenk 2002). The Hawaiian Islands were not a major calving ground for right whales in the last 200 years, but mid-ocean whaling records of right whales during winter suggest that right whales may have wintered and calved far offshore in the Pacific Ocean (Scarff 1986, 1991; Clapham et al. 2004). There are no confirmed right whale records specific to Micronesia, although it is included as part of their range. No right whales were sighted during the January–April 2007 survey in the waters of Guam and the southern CNMI1
____________________________________ 1 The survey area was 10–18ºN and 142–148ºE.
(SRS-Parsons et al. 2007). However, Reeves et al. (1999) indicated a limited possibility of the species occurring in the region.

IV. Seasonal Distribution of Affected Species and Stocks
L-DEO IHA Application for the CNMI, 2012 Page 12
Humpback Whale (Megaptera novaeangliae)
The humpback whale is found throughout all of the oceans of the world (Clapham 2002). The species is listed as endangered under the ESA, least concern on the IUCN Red List of Threatened Species (IUCN 2011), and it is listed in CITES Appendix I (UNEP-WCMC 2011) (Table 2). The worldwide population of humpback whales is divided into northern and southern ocean populations, but genetic analyses suggest some gene flow (either past or present) between the North and South Pacific oceans (e.g., Baker et al. 1993; Caballero et al. 2001). Calambokidis et al. (1997) provided a population estimate of over 6000 for the North Pacific stock, but the IWC (2007a) reported that this population numbers at least 10,000. Based on a collaborative study involving numerous jurisdictions, the North Pacific stock has been recently estimated at 18,302 whales (excluding calves; Calambokidis et al. 2008; IUCN 2009). Overall, the North Pacific stock is considered to be increasing. The western Pacific stock is estimated at 938–1107 (Calambokidis et al. 2008). The low population estimate for the western North Pacific subpopulation is a cause for concern for the IUCN (2009).
Although considered to be mainly a coastal species, humpback whales often traverse deep pelagic areas while migrating. Humpback whales spend spring through fall on mid- or high-latitude feeding grounds, and winter on low-latitude breeding grounds, with limited interchange between regions (Baker et al. 1998; Clapham 2002; Garrigue et al. 2002). On winter breeding grounds, humpback dives have been recorded at depths >100 m (Baird et al. 2000). In summer feeding areas, humpbacks typically forage in the upper 120 m of the water column, with a maximum recorded dive depth of 500 m (Dolphin 1987; Dietz et al. 2002). Humpback whales are often sighted singly or in groups of two or three; however, while on their breeding and feeding ranges, they may occur in groups of up to 15 (Leatherwood and Reeves 1983; Donoghue 1996).
North Pacific humpback whales migrate between summer feeding grounds along the Pacific Rim and the Bering and Okhotsk Seas, and winter calving and breeding areas in subtropical and tropical waters (Pike and MacAskie 1969; Rice 1978). North Pacific humpback whales are known to assemble in three different winter breeding areas: (1) the eastern North Pacific along the coast of Mexico and central America, and near the Revillagigedo Islands; (2) around the main Hawaiian Islands; and (3) in the west Pacific, particularly around Ogasawara and Ryukyu Islands in southern Japan and the northern Philippines (Perry et al. 1999a; Calambokidis et al. 2008).
In the western North Pacific, most humpback whales winter and calve near Okinawa (Ryukyu Island) and Ogasawara (Bonin Islands) (Nishiwaki 1959; Rice 1989). Darling and Mori (1993) reported that the occurrence of humpbacks off Taiwan, the Mariana Islands, and the Marshall Islands is unknown or uncommon. More recently, Calambokidis et al. (2008) included the waters of Taiwan and the Mariana Islands as part of the humpback winter range. During 1987–90, humpbacks were not seen regularly in the Northern Mariana Islands or near Kenting, Taiwan (Darling and Mori 1993). There is potential for the mixing of the western and eastern North Pacific humpback populations, as several individuals have been seen in the wintering areas of Japan and Hawaii in separate years (Darling and Cerchio 1993; Salden et al. 1999; Calambokidis et al. 2001). Whales from these wintering areas have been shown to travel to summer feeding areas in British Columbia, Canada, and Kodiak Island, Alaska (Darling et al. 1996; Calambokidis et al. 2001), but feeding areas in Russian waters may be most important (Calambokidis et al. 2008). There appears to be a very low level of interchange between Asian wintering or feeding areas and those in the eastern and central Pacific (Calambokidis et al. 2008).
Whaling charts indicate a historical concentration of humpbacks in the CNMI (Townsend 1935 in SRS-Parsons et al. 2007). At least five sightings of humpback whales from 1978 to 1996 near Guam,

IV. Seasonal Distribution of Affected Species and Stocks
L-DEO IHA Application for the CNMI, 2012 Page 13
Saipan, or Rota were described in Eldredge (2003). Group sizes were 2–6 and one sighting was of a mother-calf pair. There were no sightings of humpback whales during visual surveys in the Mariana Islands, the Federated States of Micronesia, or Solomon Islands in February–March 1999–2001, but a small number of sightings occurred northwest of the Marianas (Shimada and Miyashita 2001). In other breeding areas during the winter, humpback whales are most often found in insular shelf waters, but are also detected in deeper waters. For example, calls of humpback whales have been detected in an area northeast and east of the Puerto Rican Trench, >6000 m deep and far from banks or islands (Swartz et al. 2002). There were no humpback sightings during the January–April 2007 survey in the waters of Guam and the southern CNMI, but 11 humpbacks were detected acoustically, in both deep and shallow water around and north of Tinian and Saipan, most (10) during 6–25 February. Acoustic detections of singing humpback whales suggest a small wintering population in the region.
Minke Whale (Balaenoptera acutorostrata)
The minke whale has a cosmopolitan distribution that spans polar, temperate, and tropical regions (Jefferson et al. 2008). In the Northern Hemisphere, minke whales are usually seen in coastal areas, but can also be seen in pelagic waters during northward migrations in spring and summer, and southward migration in autumn (Stewart and Leatherwood 1985).
The minke whale is a small baleen whale and tends to be solitary or in groups of 2–3, but can occur in much larger aggregations around prey resources (Jefferson et al. 2008). The small size, inconspicuous blows, and brief surfacing times of minke whales mean that they are easily overlooked in heavy sea states, although they are known to approach vessels in some circumstances (Stewart and Leatherwood 1985). Little is known about the diving behavior of minke whales, but they are not known to make pro-longed deep dives (Leatherwood and Reeves 1983).
In the North Pacific, three stocks of minke whales are currently recognized: the Sea of Japan/East China Sea, the rest of the western Pacific west of 180ºN, and the remainder of the Pacific (Donovan 1991). For the western Pacific stock, one group is thought to breed near the Bonin-Japan Trench during winter and could represent minke whales that may be observed around the Marianas (Smith et al. 2003). No visual records of minke whales near the Marianas are available, but the study area is within the known range of the species. Despite a lack of visual detections (Fulling et al. 2011), the minke whale was the baleen whale species most frequently detected acoustically during the January–April 2007 survey in the waters of Guam and the southern CNMI; there were 29 acoustic detections near the Marianas Trench (SRS-Parsons et al. 2007).
Bryde’s Whale (Balaenoptera edeni/brydei)
Bryde’s whale is found in tropical and subtropical waters throughout the world between 40ºN and 40ºS, generally in waters warmer than 20ºC, but at minimum 15ºC (Reeves et al. 1999; Kato 2002; Kanda et al. 2007). Long confused with sei whales, Balaenoptera edeni was named in 1913 and B. brydei was named in 1950, although it is till uncertain whether the two are distinct species or subspecies. Populations in the western North Pacific, western South Pacific, eastern South Pacific, and eastern Indian Ocean currently show low levels of genetic interchange (Kanda et al. 2007). Here, we follow Kato and Perrin (2009) in recognizing the uncertainty and using Balaenoptera edeni/brydei.
Bryde’s whales are known to occur in both shallow coastal and deeper offshore waters (Jefferson et al. 2008). Some populations show a general pattern of movement toward the equator in winter and toward higher latitudes in summer, though the locations of actual winter breeding grounds are unknown (Reeves et al. 1999; Kato 2002; Kanda et al. 2007). Bryde’s whales are usually solitary or in pairs,

IV. Seasonal Distribution of Affected Species and Stocks
L-DEO IHA Application for the CNMI, 2012 Page 14
although groups of 10–20 are known from feeding grounds (Jefferson et al. 2008). Wade and Gerrodette (1993) reported a mean group size of 1.7 for the ETP. The durations of Bryde’s whale dives are 1–20 min (Cummings 1985).
Bryde’s whales are considered the most common baleen whale in the Marianas region, typically occurring from May to July and possibly August (Eldredge 2003; Kishiro 1996; Miyashita et al. 1996). During winter, Bryde’s whales occur throughout the western North Pacific, including the Mariana, Ogasawara, Kazan, and Philippine Islands (Ohzumi et al. 2002). During February–March visual surveys in 1999–2001, a small number of Bryde’s whale were sighted near the Marianas, but most sightings occurred in the Federated States of Micronesia and Solomon Islands (Shimada and Miyashita 2001). During the January–April 2007 survey in the waters of Guam and the southern CNMI (SRS-Parsons et al. 2007; Fulling et al. 2011), Bryde’s and sei whales were the most frequently encountered baleen whales (18 and 16 sighted, respectively), and another 3 undifferentiated Bryde’s or sei whales were also sighted. Sightings occurred over the Mariana Trench and near the 2500-m and 5000-m isobaths. There were no acoustic detections of Bryde’s whales during the survey.
Sei Whale (Balaenoptera borealis)
The distribution of the sei whale is not well known, but it is found in all oceans and appears to prefer mid-latitude temperate waters (Jefferson et al. 2008). The species is poorly known because of confusion with Bryde’s whale and unpredictable distribution patterns, such that it may be common in an area for several years and then seemingly disappear (Schilling et al. 1992; Jefferson et al. 2008). It is listed as endangered under the U.S. ESA and on the IUCN Red List of Threatened Species (IUCN 2011), and it is listed in CITES Appendix I (UNEP-WCMC 2011) (Table 2). Sei whale populations were depleted by whaling, and their current status is generally uncertain (Horwood 1987). The global population is thought to be ~80,000 (Horwood 2002).
The sei whale is pelagic and generally not found in coastal waters (Harwood and Wilson 2001). It is found in deeper waters characteristic of the continental shelf edge region (Hain et al. 1985) and in other regions of steep bathymetric relief such as seamounts and canyons (Kenney and Winn 1987; Gregr and Trites 2001). On feeding grounds, they associate with oceanic frontal systems (Horwood 1987) such as the cold eastern currents in the North Pacific (Perry et al. 1999a). Sei whales are frequently seen in groups of 2–5 (Jefferson et al. 2008), although larger groups sometimes form on feeding grounds (Gambell 1985a). Sei whales generally do not dive deeply, and dive durations are 15 min or longer (Gambell 1985a). Sei whales migrate from temperate zones occupied in winter to higher latitudes in the summer, where most feeding takes place (Gambell 1985a).
Sei whale migrations are less extensive than those of other baleen whales. In the North Pacific, the sei whale can be found across the Bering Sea and off the coasts of Japan and Korea in the summer. Its winter distribution is concentrated at about 20°N. Sei whales are generally considered uncommon in the Marianas region, although during the January–April 2007 survey in the waters of Guam and the southern CNMI (SRS-Parsons et al. 2007; Fulling et al. 2011), Bryde’s and sei whales were the most frequently encountered baleen whales (18 and 16 sighted, respectively), and another 3 undifferentiated Bryde’s or sei whales were also sighted. All sightings were south of Saipan in water >1000 m deep, with a number of sightings directly over the Mariana Trench. There were four acoustic detections of sei whales during the survey. No breeding grounds have been identified for sei whales; however, calving is thought to occur from September to March. The sei whale may occur in the study area during winter, but it is unlikely to occur there during summer because of its preference for colder temperate waters north of 40° N.

IV. Seasonal Distribution of Affected Species and Stocks
L-DEO IHA Application for the CNMI, 2012 Page 15
Fin Whale (Balaenoptera physalus)
The fin whale is widely distributed in all the world’s oceans (Gambell 1985b), but typically occurs in temperate and polar regions from 20° to 70° north and south of the equator (Perry et al. 1999b). It is listed as endangered under the U.S. ESA and on the IUCN Red List of Threatened Species (IUCN 2011), and it is listed in CITES Appendix I (UNEP-WCMC 2011) (Table 2). Northern and southern fin whale populations are distinct, and are sometimes recognized as different subspecies (Aguilar 2002). The current distribution of fin whales in the western North Pacific is largely unknown.
Fin whales occur in coastal, shelf, and oceanic waters. Sergeant (1977) proposed that fin whales tend to follow steep slope contours, either because they detect them readily or because biological productivity is high along steep contours because of tidal mixing and perhaps current mixing. They can be found as individuals or groups of 2–7, but can form much larger feeding aggregations, sometimes with humpback and minke whales (Jefferson et al. 2008). Foraging fin whales reach mean dive depths and times of 98 m and 6.3 min, respectively, while recorded mean dive depths and times for non-foraging fin whales in the Pacific are 59 m and 4.2 min, respectively (Croll et al. 2001). Dive depths of >150 m coinciding with the diel migration of krill were reported by Panigada et al. (1999).
Fin whales migrate in the open oceans and their winter breeding areas are uncertain. However, they are known to winter in the Yellow, East China, and South China Seas (Parsons et al. 1995; Rudoph and Smeenk 2002). Records also exist for Taiwan (Chou 2004). There are no confirmed records of fin whales in the Marianas region, but this area is considered part of their range. A recent review of fin whale distribution in the North Pacific noted the lack of sightings across the pelagic waters between eastern and western winter areas (Mizroch et al. 2009). No fin whales were sighted or detected acoustically during the January–April 2007 survey in the waters of Guam and the southern CNMI (SRS-Parsons et al. 2007; Fulling et al. 2011).
Blue Whale (Balaenoptera musculus)
The blue whale has a cosmopolitan distribution, and tends to be pelagic, only coming nearshore to feed and possibly to breed (Jefferson et al. 2008). It is listed as endangered under the U.S. ESA and on the IUCN Red List of Threatened Species (IUCN 2011), and it is listed in CITES Appendix I (UNEP-WCMC 2011) (Table 2). All blue whale populations have been exploited commercially, and many have been severely depleted as a result. The worldwide population has been estimated at 15,000, with 10,000 in the Southern Hemisphere (Gambell 1976), 3500 in the North Pacific, and up to 1400 in the North Atlantic (NMFS 1998). Blue whale calls monitored from the U.S. Navy Sound Surveillance System (SOSUS) and other offshore hydrophones suggest that separate populations occur in the eastern and western North Pacific (Stafford et al. 1999, 2001, 2007; Watkins et al. 2000a; Stafford 2003).
Blue whales are typically found singly or in groups of two or three (Yochem and Leatherwood 1985; Jefferson et al. 2008). Wade and Gerrodette (1993) reported a mean group size of 1.5 for the ETP. Croll et al. (2001) reported mean dive depths and times of 140 m and 7.8 min for foraging blue whales, and 68 m and 4.9 min for non-foraging individuals. Dives of up to 300 m were recorded for tagged blue whales (Calambokidis et al. 2003).
Generally, blue whales are seasonal migrants between high latitudes in the summer, where they feed, and low latitudes in the winter, where they mate and give birth (Lockyer and Brown 1981). Some individuals may stay in low or high latitudes throughout the year (Reilly and Thayer 1990; Watkins et al. 2000b). Moore et al. (2002) reported that blue whale calls are received in the North Pacific year-round. Little information is available on blue whale wintering areas (Perry et al. 1999a).

IV. Seasonal Distribution of Affected Species and Stocks
L-DEO IHA Application for the CNMI, 2012 Page 16
The current distribution of blue whales in the western North Pacific is largely unknown. The North Pacific stock of blue whales is reported to winter off Taiwan, Japan, and Korea. There have also been blue whale calls recorded off Midway and Oahu, Hawaii, suggesting that blue whales occur within several hundred kilometers of these islands (NMFS 1998). There is almost no information on the occurrence of blue whales in Micronesia, other than near the Solomon Islands (Reeves et al. 1999). There are no records of blue whales in the Marianas region, but the area is considered to be within their distribution range. No blue whales were sighted or detected acoustically during the January–April 2007 survey in the waters of Guam and the southern CNMI (SRS-Parsons et al. 2007; Fulling et al. 2011).
Odontocetes Sperm Whale (Physeter macrocephalus)
Sperm whales are the largest of the toothed whales, with an extensive worldwide distribution (Rice 1989). The species is listed as endangered under the U.S. ESA, but on a worldwide basis it is abundant and not biologically endangered. It is listed as vulnerable on the IUCN Red List of Threatened Species (IUCN 2011), and it is listed in CITES Appendix I (UNEP-WCMC 2011) (Table 2).
Sperm whale distribution is linked to social structure—mixed groups of adult females and juvenile animals of both sexes generally occur in tropical and subtropical waters, whereas adult males are com-monly found alone or in same-sex aggregations, often occurring in higher latitudes outside the breeding season (Best 1979; Watkins and Moore 1982; Arnbom and Whitehead 1989; Whitehead and Waters 1990). Female and immature sperm whales could occur in the survey area at any time of the year, whereas large male sperm whales likely are not found in the area at all. There currently is no accurate estimate for the size of any sperm whale population (Whitehead 2002a). Best estimates probably are those of Whitehead (2002b), who provided a sperm whale population size estimate of 29,674 for the western North Pacific.
Mature male sperm whales migrate to warmer waters to breed when they are in their late twenties (Best 1979). They spend periods of at least months on the breeding grounds, moving between mixed groups of 20–30 on average (Whitehead 1993, 2003). Wade and Gerrodette (1993) noted a mean group size of 7.9 for the ETP. In the Southern Hemisphere, mating occurs from July to March, with a peak from September to December, and most calves are born between November and March (Rice 1989).
Sperm whales generally are distributed over large areas that have high secondary productivity and steep underwater topography, in waters at least 1000 m deep (Jaquet and Whitehead 1996; Whitehead 2002a). They are often found far from shore, but can be found closer to oceanic islands that rise steeply from deep ocean waters (Whitehead 2002a). They can dive as deep as ~2 km and possibly deeper on rare occasions for periods of over 1 h; however, most of their foraging occurs at depths of ~300–800 m for 30–45 min (Whitehead 2003). During a foraging dive, sperm whales typically travel ~3 km horizontally and 0.5 km vertically (Whitehead 2003). Whales in the Galápagos Islands typically dove for ~40 min and then spent 10 min at the surface (Papastavrou et al. 1989).
Whaling records are consistent with sperm whales occurring year-round around the Marianas (Townsend 1935), and there are two stranding records for Guam (Kami and Lujan 1976; Eldredge 1991, 2003). The sperm whale was the most frequently sighted cetacean (21 sightings) during the January–April 2007 survey in the waters of Guam and the southern CNMI, and acoustic detections were three times higher than visual detections (SRS-Parsons et al. 2007; Fulling et al. 2011). Sperm whales were observed in waters ~800 to 10,000 m deep throughout most of the survey area. During the survey, there were multiple sightings of groups that included calves (SRS-Parsons et al. 2007), and Eldredge (2003)

IV. Seasonal Distribution of Affected Species and Stocks
L-DEO IHA Application for the CNMI, 2012 Page 17
reported a sighting of a group of sperm whales including a newborn calf off the west coast of Guam. Observations were made during the January–April 2007 survey of several large bulls with fresh tooth marks (one male rammed the survey ship), which suggests that these males were engaged in competition for mates (Fulling and Salinas Vega 2009). Hence, there is evidence that this area is used for breeding and calving by sperm whales.
Pygmy and Dwarf Sperm Whales (Kogia breviceps and K. sima)
Pygmy and dwarf sperm whales are distributed widely throughout tropical and temperate seas, but their precise distributions are unknown as most information on these species comes from strandings (McAlpine 2002). They are difficult to sight at sea, perhaps because of their avoidance reactions to ships and behavior changes in relation to survey aircraft (Würsig et al. 1998). The two species are difficult to distinguish from one another when sighted (McAlpine 2002). During sighting surveys and, hence, in population and density estimates, the two species are most often categorized together as Kogia spp. (Waring et al. 2009).
Pygmy sperm whales may inhabit waters beyond the continental shelf edge, whereas dwarf sperm whales are thought to inhabit the shelf-edge and slope waters (Rice 1998). Also, the dwarf sperm whale could prefer warmer waters than the pygmy sperm whale (McAlpine 2002). Pygmy sperm whales feed mainly on various species of squid in the deep zones of the continental shelf and slope (McAlpine et al. 1997). Pygmy sperm whales occur in small groups of up to six, and dwarf sperm whales can form groups of up to 10 (Caldwell and Caldwell 1989). Wade and Gerrodette (1993) noted a mean group size of 1.7 for the dwarf sperm whale in the ETP.
Although there are few useful estimates of abundance for pygmy or dwarf sperm whales anywhere in their range, they are thought to be fairly common in some areas. There were no sightings of either species during the January–April 2007 survey in the waters of Guam and the southern CNMI (SRS-Parsons et al. 2007; Fulling et al. 2011), but there are strandings records for Guam, including five strandings of dwarf sperm whales and one stranding of a pygmy sperm whale (Kami and Lujan 1976; Reeves et al. 1999; Eldredge 1991, 2003).
Cuvier’s Beaked Whale (Ziphius cavirostris)
Cuvier’s beaked whale is probably the most widespread of the beaked whales, although it is not found in polar waters (Heyning 1989). It is rarely observed at sea and is mostly known from strandings. It strands more commonly than any other beaked whale (Heyning 1989). Its inconspicuous blows, deep-diving behavior, and tendency to avoid vessels all help to explain the infrequent sightings (Barlow and Gisner 2006). Adult males of this species usually travel alone, but these whales can be seen in groups of up to 15 individuals, with a mean group size of 2.3 (MacLeod and D’Amico 2006). Wade and Gerrodette (1993) reported a mean group size of 2.2 for the ETP.
Cuvier’s beaked whale is an offshore, deep-diving species that feeds on fish and squid (Heyning 2002). Its dives generally last 30–60 min, but dives of 85 min have been recorded (Tyack et al. 2006).
In the western Pacific, Cuvier’s beaked whales are known to occur in the waters of Japan (Nishiwaki and Oguro 1972 in Wang et al. 1995a) and parts of Southeast Asia (Heyning 1989). Cuvier’s beaked whales occur in bycatch in the Philippines (Perrin et al. 2005). One ziphiid whale not identified to species level was observed in deep water during the January–April 2007 survey in the waters of Guam and the southern CNMI (SRS-Parsons et al. 2007; Fulling et al. 2011). However, Cuvier’s beaked whale

IV. Seasonal Distribution of Affected Species and Stocks
L-DEO IHA Application for the CNMI, 2012 Page 18
has been reported in the Mariana and Bonin islands area (Masaki 1972 in Eldredge 2003), and there was a live stranding at Piti, Guam, in August 2007 (NMFS 2007).
Longman’s Beaked Whale (Indopacetus pacificus)
Until recently, Longman’s beaked whale was thought to be extremely rare, and was known only from two skulls (Pitman et al. 1987). Recent morphometric and genetic analyses of those two original specimens and an additional four specimens have allowed a more detailed characterization of the species (Dalebout et al. 2003). It seems likely that it is, in fact, the cetacean that has been seen in Indo-Pacific waters and called the “tropical bottlenose whale”. Some authorities place the species in the genus Mesoplodon, but there now seems to be sufficient information to afford it status as a separate genus (Dalebout et al. 2003). Records of this species exist within an area from 10ºS to 40ºN.
Longman’s beaked whales have been sighted in waters with temperatures 21–31ºC and have been seen in the tropics every month of the year except June, indicating year-round residency (Pitman et al. 1999; Jefferson et al. 2008). Although widespread throughout the tropical Pacific, the species must still be considered rare because of a scarcity of sightings despite a great deal of survey effort (Pitman et al. 1999). Longman’s beaked whales have been seen alone, but more commonly in groups of at least ten and up to 100, with an average group size of 15–20 (Jefferson et al. 2008). Pitman et al. (1999) reported a mean group size of 18.5 in the tropics. Dives are thought to last 18–33 min (Jefferson et al. 2008).
Sightings of Longman’s beaked whale have occurred at many locations in tropical waters of the Indo-Pacific region (Rudolph and Smeenk 2002; Jefferson et al. 2008). In Southeast Asia and the surrounding area, records for this species exist for Japan (Yamada et al. 2004), the Philippines (Acebes et al. 2005), and Taiwan (Yang et al. 2008). Although there are no records for this species in the Marianas and there were no sightings during the January–April 2007 survey in the waters of Guam and the southern CNMI (SRS-Parsons et al. 2007; Fulling et al. 2011), this area is still considered to be within the known range for this species (DoN 2005).
Mesoplodont Beaked Whales
Two species of mesoplodont whales likely occur in deep waters in the study area: Blainville’s beaked whale (Mesoplodon densirostris) and the gingko-toothed beaked whale (Mesoplodon ginkgodens). No population estimates exist for either of these species in Southeast Asia.
Almost everything that is known regarding most mesoplodont species has come from stranded animals (Pitman 2002). The different mesoplodont species are difficult to distinguish in the field, and are most often categorized during sighting surveys, and therefore in density and population estimates, as Mesoplodon spp. They are all thought to be deep-water animals, only rarely seen over the continental shelf. Typical group sizes range from one to six (Pitman 2002). Because of the scarcity of sightings, most are thought to be rare.
Two Mesoplodon spp. not identified to the species level were observed over the West Mariana Ridge during the January–April 2007 survey in the waters of Guam and the southern CNMI (SRS-Parsons et al. 2007; Fulling et al. 2011). There are no records for either of the species mentioned above in the CNMI, but this area is within the known distribution range for both species (DoN 2005).
Blainville’s beaked whale.—This species is found in tropical and temperate waters of all oceans (Jefferson et al. 2008). Blainville’s beaked whale has the widest distribution throughout the world of all Mesoplodon species (Mead 1989). There is no evidence that Blainville’s beaked whales undergo seasonal
IV. Seasonal Distribution of Affected Species and Stocks
L-DEO IHA Application for the CNMI, 2012 Page 19
migrations. Blainville’s beaked whales are most often found in singles or pairs, but also in groups of 3–7 (Jefferson et al. 2008).
Like other beaked whales, Blainville’s beaked whales are generally found in deep waters 200 m to 1400 m deep (Gannier 2000; Jefferson et al. 2008). Maximum dive depths have been reported as 1251 m (Tyack et al. 2006) and 1408 m (Baird et al. 2006), and dives have lasted as long as 54 min (Baird et al. 2006) to 57 min (Tyack et al. 2006). However, they also can occur in coastal areas and have been known to spend long periods of time at depths <50 m (Jefferson et al. 2008).
Sighting records exist for Blainville’s beaked whale for the East China Sea off mainland China and for the Philippines (Perrin et al. 2005). They are also known to occur off Taiwan (Zhou et al. 1995; Chou 2004; Perrin et al. 2005). There are no occurrence records for this species in the CNMI, but this area is within the known distribution range for this species (DoN 2005).
Ginkgo-toothed beaked whale.—This species is only known from stranding records (Mead 1989; Jefferson et al. 2008). In the South Pacific Ocean, it has stranded in New South Wales, Australia, and the North Island and Chatham Islands, New Zealand (Mead 1989; Baker and van Helden 1999). The ginkgo-toothed whale is hypothesized to occupy tropical and warm temperate waters of the Indian and Pacific oceans (Pitman 2002), although what is known of its range suggests any records in the CNMI would be rare (DoN 2005).
Rough-toothed Dolphin (Steno bredanensis)
The rough-toothed dolphin is widely distributed around the world, but mainly occurs in tropical and warm temperate waters (Miyazaki and Perrin 1994). Rough-toothed dolphins generally occur in deep, oceanic waters, but can be found in shallower coastal waters in some regions (Jefferson et al.2008). Rough-toothed dolphins are deep divers and can dive for up to 15 min (Jefferson et al. 2008). They usually form groups of 10–20, but aggregations of hundreds have been seen (Jefferson et al. 2008). Wade and Gerrodette (1993) reported a mean group size of 14.7 for the ETP.
Rough-toothed dolphins are known to occur in the Philippines and the East and South China seas off China and Taiwan (Perrin et al. 2005), as well as in Hong Kong (Parsons et al. 1995; Jefferson and Hung 2007). There were two sightings of rough-toothed dolphins during the January–April 2007 survey in the waters of Guam and the southern CNMI (SRS-Parsons et al. 2007; Fulling et al. 2011), in groups of 7 and 15 with calves present in one of the sightings. The sightings were in deep (1000–4500 m) water, one off Guguan and the other at the southern edge of the survey area at ~10ºN. One sighting involved a mixed-species group with common bottlenose dolphins and short-finned pilot whales.
In July 2004, there was a sighting of an undetermined smaller number of rough-toothed dolphins mixed in with a school of an estimated 500–700 melon-headed whales at Sasanhayan Bay, Rota, in a water depth of ~75 m (Jefferson et al. 2006).
Common Bottlenose Dolphin (Tursiops truncatus)
The bottlenose dolphin is distributed worldwide. It is found mainly where surface temperatures range from 10–32ºC (Reeves et al. 2002). Generally, there are two distinct bottlenose dolphin types: a shallow water type, mainly found in coastal waters, and a deep water type, mainly found in oceanic waters (Duffield et al. 1983; Hoelzel et al. 1998; Walker et al. 1999). As well as inhabiting different areas, these ecotypes differ in their diving abilities (Klatsky 2004) and prey types (Mead and Potter 1995). Bottlenose dolphins have been reported to regularly dive to depths >450 m for periods of >5 min (Klatsky 2004), and even down to depths of 600–700 m for up to 12 min (Klatsky et al. 2005).

IV. Seasonal Distribution of Affected Species and Stocks
L-DEO IHA Application for the CNMI, 2012 Page 20
In the western Pacific, the bottlenose dolphin is distributed from Japan to Australia and New Zealand. Bottlenose dolphins are known to occur in the Philippines and the Yellow, East and South China seas off China and Taiwan (Perrin et al. 2005), and Hong Kong (Parsons et al. 1995; Jefferson and Hung 2007). Mean group size in the ETP has been estimated at 24 (Smith and Whitehead 1999) and 22.7 (Wade and Gerrodette 1993). The average group size off the Marquesas Islands was 8.2 (Gannier 2002).
Bottlenose dolphins were sighted three times during the January–April 2007 survey in the waters of Guam and the southern CNMI (SRS-Parsons et al. 2007; Fulling et al. 2011). Two of the sightings were in the vicinity of Challenger Deep at the southwest corner of the 2007 survey area, and the other was east of Saipan near the Mariana Trench in water depths 4200–5000 m. One of the sightings near the Challenger Deep was a mixed-species aggregation that included sperm whales (with calves) logging at the surface. Another mixed-species aggregation involved bottlenose dolphins with short-finned pilot whales and rough-toothed dolphins. Bottlenose dolphin group sizes were 3–10, and calves were seen.
There are no stranding records available for this species in the Marianas, and only a mention by Trianni and Kessler (2002) that bottlenose dolphins are seen in coastal waters of Guam. It is possible that bottlenose dolphins do not occur in great numbers in this island chain. Gannier (2002) attributed the fact that large densities of bottlenose dolphins do not occur at the Marquesas Islands to the fact that the area does not have a significant shelf component. A similar situation could be occurring in the Mariana Islands.
Pantropical Spotted Dolphin (Stenella attenuata)
The pantropical spotted dolphin can be found throughout tropical and some subtropical oceans of the world (Perrin and Hohn 1994). The southernmost limit of its range is ~40°S (Perrin 2002a). In the ETP, this dolphin is associated with warm (>25ºC) tropical surface water (Au and Perryman 1985; Reilly 1990; Reilly and Fiedler 1994; Reeves et al. 1999). There are two forms of pantropical spotted dolphin, coastal and offshore forms, although the coastal form occurs mainly in the ETP from Baha California to South America (Jefferson et al. 2008). The offshore form inhabits tropical, equatorial, and southern subtropical water masses (Perrin 2002a). This species is found primarily in deeper waters, and rarely over the continental shelf or continental shelf edge (Davis et al. 1998). Pantropical spotted dolphins are extremely gregarious, forming groups of hundreds or even thousands. Wade and Gerrodette (1993) reported a mean group size of 149.4 for the western/southern stock in the ETP. Pantropical spotted and spinner dolphins are commonly seen together in mixed-species groups, e.g., in the ETP (Au and Perryman 1985), off Hawaii (Psarakos et al. 2003), and off the Marquesas Archipelago (Gannier 2002).
In the western Pacific, pantropical spotted dolphins occur from Japan south to Australia. They are known to occur in the Philippines and in the East and South China seas off China (Perrin et al. 2005), in Taiwan (Parsons et al. 1995; Zhou et al. 1995; Chou 2004), and off Hong Kong (Parsons et al. 1995; Jefferson and Hung 2007). During the January–April 2007 survey in the waters of Guam and the southern CNMI (SRS-Parsons et al. 2007; Fulling et al. 2011), pantropical spotted dolphins were sighted throughout the study area and in waters with a variable bottom depth, ranging from ~100 to 5600 m. Most (11 of 17) sightings were in deep (>3000 m) water, which is consistent with the known preference of this species for oceanic habitat. There was only one shallow-water (113 m) sighting, 2.5 km north of Tinian, during a humpback whale focal study.
Group size was 1–115, and there were multiple sightings that included calves, one mixed-species aggregation with melon-headed whales, and another with an unidentified rorqual. The pantropical spotted

IV. Seasonal Distribution of Affected Species and Stocks
L-DEO IHA Application for the CNMI, 2012 Page 21
dolphins encountered during that survey were identified as the offshore morphotype (SRS-Parsons et al. 2007).
Spinner Dolphin (Stenella longirostris)
The spinner dolphin is distributed in oceanic and coastal tropical waters between 40ºN and 40ºS (Jefferson et al. 2008). In Southeast Asia, spinner dolphins are known to occur in the Philippines and in the East and South China seas off China and Taiwan (Perrin et al. 2005), and Hong Kong (Parsons et al. 1995; Jefferson and Hung 2007). Two subspecies of spinner dolphin occur in the western Pacific: the widespread, offshore spinner dolphin (Stenella longirostris longirostris) and the dwarf spinner dolphin (S. l. roseiventris). There is little or no genetic interchange between the two subspecies (Dizon et al. 1991). S. l. longirostris feeds on small mesopelagic fish and squid, whereas S. l. roseiventris preys on benthic and coral reef fishes and invertebrates (Perrin et al. 1999). S. l. longirostris occurs in the deep inner waters of the Philippines as well as Japan, whereas S. l. roseiventris inhabits the shallow waters of inner Southeast Asia (Perrin et al. 1999).
The spinner dolphin is expected to occur throughout the Mariana Islands, except in Apra Harbor because of likely avoidance of anthropogenic disturbances there (DoN 2005). Spinner dolphins are reported in Saipan Lagoon nearly every year (Trianni and Kessler 2002). In general, spinner dolphins will congregate in lagoons during the day to rest and avoid predation. Spinner dolphins travel among the Mariana island chain (Trianni and Kessler 2002) and have been seen at Farallon de Medinilla (DoN 2001; Trianni and Kessler 2002), Guam (Trianni and Kessler 2002), and Rota (Jefferson et al. 2006).
There was one sighting of spinner dolphins during the January–April 2007 survey in the waters of Guam and the southern CNMI (SRS-Parsons et al. 2007; Fulling et al. 2011). The school was encountered northeast of Saipan in 425 m of water, and was estimated to contain 98 individuals.
Striped Dolphin (Stenella coeruleoalba)
The striped dolphin has a cosmopolitan distribution in tropical to warm temperate waters (Perrin et al. 1994a) and is generally seen south of 43ºN (Archer 2002). It is typically found in waters outside the continental shelf and is often associated with convergence zones and areas of upwelling (Archer 2002). Striped dolphins are fairly gregarious (groups of 20 or more are common) and active at the surface (Whitehead et al. 1998). Wade and Gerrodette (1993) reported a mean group size of 60.9 in the ETP, and Smith and Whitehead (1999) reported a mean group size of 50 in the Galápagos Islands.
A putative population south of 30°N in the western Pacific has been estimated to number about 52,600 (Miyashita 1993), and any animals around the Mariana Islands are probably part of this greater population. Prior to 2007, striped dolphins were only known from one stranding that occurred in July 1985 (Wilson et al. 1987; Eldredge 1991, 2003). Striped dolphins were sighted 10 times during the January–April 2007 survey in the waters of Guam and the southern CNMI (SRS-Parsons et al. 2007; Fulling et al. 2011), in water depths ~2350–7600 m. Group sizes were 7–44, and several groups contained calves. Sightings were throughout the northern (>13ºN) part of the survey area.
Fraser’s Dolphin (Lagenodelphis hosei)
Fraser’s dolphin is a tropical species found between 30°N and 30°S (Dolar 2002). It only occurs rarely in temperate regions, and then only in relation to temporary oceanographic anomalies such as El Niño events (Perrin et al. 1994b). The species typically occurs in deep, oceanic waters. In the ETP, most sightings were 45–100 km from shore in waters 1500–2500 m deep (Dolar 2002). Off Huahine and Tahiti (Society Islands), it was observed in waters 500–1500 m deep (Gannier 2000).

IV. Seasonal Distribution of Affected Species and Stocks
L-DEO IHA Application for the CNMI, 2012 Page 22
Fraser’s dolphins travel in groups ranging from just a few animals to 100 or even 1000 (Perrin et al. 1994b). Wade and Gerrodette (1993) reported a mean group size of 395 for the ETP. In the ETP, its abundance has been estimated at about 289,000 (Wade and Gerrodette 1993). In the eastern Sulu Sea adjacent to the Philippines, the abundance estimate is 8700 (Dolar 1999 in Perrin et al. 2003).
In Southeast Asia, Fraser’s dolphins are known to occur in the Philippines and in the East and South China seas off China and Taiwan (Perrin et al. 2005), as well as Hong Kong (Parsons et al. 1995; Jefferson and Hung 2007). There are no records for Fraser’s dolphin in the Marianas study area, and there were no sightings during the January–April 2007 survey in the waters of Guam and the southern CNMI (SRS-Parsons et al. 2007; Fulling et al. 2011). However, the Mariana Islands are within the distributional range of this species (DoN 2005).
Short-beaked Common Dolphin (Delphinus delphis)
The common dolphin is found in tropical and warm temperate oceans around the world (Perrin 2002b). It ranges as far south as 40°S in the Pacific Ocean, is common in coastal waters 200–300 m deep, and is also associated with prominent underwater topography, such as seamounts (Evans 1994). Off northern New Zealand, it is generally seen at a mean distance <10 km from shore in the summer, and moves further offshore in winter (Neumann 2001). Common dolphins often travel in fairly large groups; schools of hundreds or even thousands are common. Smith and Whitehead (1999) noted that common dolphins were frequently seen in waters near the Galápagos Islands, with a mean group size of 125. Wade and Gerrodette reported a mean group size of 472.8 in the southern portion of the ETP.
There are two species of common dolphins: the short-beaked common dolphin (D. delphis) and the long-beaked common dolphin (D. capensis). The short-beaked common dolphin is the species most likely to occur in the Mariana Islands (Jefferson pers. comm. in DoN 2005). There are no records for this species in the CNMI, but this area is within the known distribution range for this species (DoN 2005).
Risso’s Dolphin (Grampus griseus)
Risso’s dolphin is primarily a tropical and mid-temperate species distributed worldwide. It occurs between 60ºN and 60ºS, where surface water temperatures are at least 10ºC (Kruse et al. 1999). In the northern Gulf of Mexico, Risso’s dolphin usually occurs over steeper sections of the upper continental slope (Baumgartner 1997) in waters 150–2000 m deep (Davis et al. 1998). In Monterey Bay, California, it is most numerous where there is steep bottom topography (Kruse et al. 1999). Risso’s dolphins occur individually or in small to moderate-sized groups, normally ranging from 2 to <250. The majority of groups consist of <50 (Kruse et al. 1999). Wade and Gerrodette (1993) reported a mean group size of 12 in the ETP.
In the western Pacific, Risso’s dolphins range from the Kuril Islands to New Zealand and Australia. They are known to occur in the Philippines, off mainland China in the Yellow, East, and South China seas (Perrin et al. 2005), and around Taiwan and Hong Kong (Parsons et al. 1995). Under the assumption that several stocks exist in the western Pacific, Miyashita (1993) analyzed Japanese survey data to estimate that about 7000 Risso’s dolphins occur in the area to the north of the Mariana Islands. No Risso’s dolphins were sighted during the January–April 2007 survey in the waters of Guam and the southern CNMI (SRS-Parsons et al. 2007; Fulling et al. 2011), but the Mariana Islands are within the distributional range of this species (DoN 2005).

IV. Seasonal Distribution of Affected Species and Stocks
L-DEO IHA Application for the CNMI, 2012 Page 23
Melon-headed Whale (Peponocephala electra)
The melon-headed whale is a pantropical and pelagic species that occurs mainly between 20ºN and 20ºS in offshore waters (Perryman et al. 1994). Melon-headed whales tend to occur in groups of 100–500, but have also been seen in groups of up to 2000 (Jefferson et al. 2008). Wade and Gerrodette (1993) reported a mean group size of 199 for the ETP. Melon-headed whales are commonly seen in mixed groups with other cetaceans (Jefferson and Barros 1997).
Melon-headed whales are known to occur off mainland China in the East and South China seas, off Taiwan, and in the Philippines (Perrin et al. 2005). There was a live stranding on the beach at Inarajan Bay, Guam, in April 1980 (Kami and Hosmer 1982; Donaldson 1983). There have been sightings at Rota and Guam (DoN 2005), including a sighting at Rota of an estimated 500–700 melon-headed whales and an undetermined smaller number of rough-toothed dolphins in water ~75 m deep at Sasanhayan Bay (Jefferson et al. 2006). It has been hypothesized that this event was related to lunar cycles (Mobley et al 2007). However, a subsequent review concluded that there is no such relationship, and that the recent sighting at Sasanhayan Bay should not be considered unusual given how similar those observations are to those from Palmyra Atoll (Brownell et al. in press).
There were two sightings of melon-headed whales with group sizes estimated at 80 and 109 during the January–April 2007 survey in the waters of Guam and the southern CNMI (SRS-Parsons et al. 2007; Fulling et al. 2011). The groups were sighted in water depths ~3200–3900 m, both southwest of Guam.
Pygmy Killer Whale (Feresa attenuata)
The pygmy killer whale is distributed throughout tropical and subtropical oceans worldwide (Ross and Leatherwood 1994; Donahue and Perryman 2002). Little is known about the species in most of its range, but it is sighted frequently in the ETP, off Hawaii, and off Japan (Donahue and Perryman 2002). In warmer water, it is usually seen close to the coast (Wade and Gerrodette 1993), but it is also found in deep waters. In the Marquesas, it was sighted in water 100 m deep (Gannier 2002). Pygmy killer whales tend to travel in groups of 15–50, although herds of a few hundred have been sighted (Ross and Leatherwood 1994). Wade and Gerrodette (1993) reported a mean group size of 27.9 in the ETP.
The pygmy killer whale is known to occur off mainland China in the East China Sea (Perrin et al. 2005), in Taiwan (Zhou et al. 1995; Chou 2004; Wang and Yang 2006), and in the Philippines (Perrin et al. 2005). There was one sighting of a group of six pygmy killer whales during the January–April 2007 survey in the waters of Guam and the southern CNMI (SRS-Parsons et al. 2007; Fulling et al. 2011), south of Guam where the bottom depth was ~4400 m. This is consistent with the known habitat preferences of the species for deep, oceanic waters.
False Killer Whale (Pseudorca crassidens)
The false killer whale is found in all tropical and warmer temperate oceans, especially in deep, off-shore waters (Odell and McClune 1999). It is also known to occur in nearshore areas (e.g., Stacey and Baird 1991). In the ETP, it is usually seen far offshore (Wade and Gerrodette 1993). False killer whales travel in pods of 20–100 (Baird 2002), although groups of several hundred are sometimes observed. Wade and Gerrodette (1993) reported a mean group size of 11.4 in the ETP.
In the west Pacific, the false killer whale is distributed from Japan to Australia. The false killer whale is known to occur in the Philippines and in the Yellow, East and South China seas off China and Taiwan (Perrin et al. 2005), and Hong Kong (Parsons et al. 1995; Jefferson and Hung 2007). In the west

IV. Seasonal Distribution of Affected Species and Stocks
L-DEO IHA Application for the CNMI, 2012 Page 24
Pacific, the false killer whale is distributed from Japan to Australia. Nothing is known of the stock structure of false killer whales in the North Pacific Ocean. However, there are estimated to be about 6000 false killer whales in the area surrounding the Mariana Islands (Miyashita 1993).
There were five sighting of false killer whales during the January–April 2007 survey in the waters of Guam and the southern CNMI (SRS-Parsons et al. 2007; Fulling et al. 2011). Group sizes were 2–26, including some groups that contained calves. False killer whales were sighted in water depths of ~3000–8000 m, and several sightings were made over the Mariana Trench and in the southeast corner of the study area in water depths >5000 m.
Killer Whale (Orcinus orca)
The killer whale is cosmopolitan and globally fairly abundant; it has been observed in all oceans of the world (Ford 2002). It is very common in temperate waters, and also frequents tropical waters, at least seasonally (Heyning and Dahlheim 1988; Reeves et al. 1999). High densities of the species occur in high latitudes, especially in areas where prey is abundant. Although resident in some parts of its range, the killer whale can also be transient. Killer whale movements generally appear to follow the distribution of their prey, which includes marine mammals, fish, and squid. Killer whales are large and conspicuous, often traveling in close-knit matrilineal groups of a few to tens of individuals (Dahlheim and Heyning 1999). Wade and Gerrodette (1993) reported a mean group size of 5.4 in the ETP.
Killer whales are known to occur in the Philippines and off China in the Yellow and East China seas (Perrin et al. 2005) and off Taiwan (e.g., Chou et al. 2007). There are a few sightings (most unconfirmed) of killer whales off Guam (Eldredge 1991), including a sighting ~25 km west of Tinian during January 1997 reported to the NMFS Platforms of Opportunity Program. There was also a badly decomposed killer whale found stranded on Guam in August 1981 (Kami and Hosmer 1982). No killer whales were sighted during the January–April 2007 survey in the waters of Guam and the southern CNMI (SRS-Parsons et al. 2007; Fulling et al. 2011).
Short-finned Pilot Whale (Globicephala macrorhynchus)
The short-finned pilot whale is found in tropical and warm temperate waters (Olson and Reilly 2002); it is seen as far south as ~40ºS, but is more common north of ~35ºS (Olson and Reilly 2002). Pilot whales occur on the shelf break, over the slope, and in areas with prominent topographic features, and are usually seen in groups of 20–90 (Olson and Reilly 2002). Wade and Gerrodette (1993) reported a mean group size of 18.3 in the ETP. Long-finned pilot whales outfitted with time-depth recorders dove to depths up to 828 m, although most of their time was spent above depths of 7 m (Heide-Jørgensen et al. 2002). The species’ maximum recorded dive depth is 971 m (Baird pers. comm. in DoN 2005).
Short-finned pilot whales are known to occur in the Philippines and off mainland China in the South China Sea (Perrin et al. 2005) and off Taiwan (e.g., Chou 2004). Stock structure of short-finned pilot whales has not been adequately studied in the North Pacific, except in Japanese waters, where two stocks have been identified based on pigmentation patterns and head shape differences of adult males (Kasuya et al. 1988). The southern stock of short-finned pilot whales (Kasuya et al. 1988), which is probably the one associated with the Marianas Islands area, has been estimated to number about 18,700 whales in the area south of 30°N (Miyashita 1993).
Prior to 2007, there were a small number of occurrence records for the short-finned pilot whale around the Mariana Islands. Miyashita et al. (1996) reported sightings in the vicinity of the Northern Mariana Islands during February–March 1994, but did not provide the actual sighting coordinates. A
IV. Seasonal Distribution of Affected Species and Stocks
L-DEO IHA Application for the CNMI, 2012 Page 25
group of more than 30 was sighted in late April 1977 near Uruno Point, off the northwest coast of Guam (Birkeland 1977), and a stranding occurred on Guam in July 1980 (Schulz 1980; Kami and Hosmer 1982; Donaldson 1983).
There were four on-effort sightings of short-finned pilot whales during the January–April 2007 survey in the waters of Guam and the southern CNMI (SRS-Parsons et al. 2007; Fulling et al. 2011). Group sizes were 5–43, and no calves were observed. One of the groups was in a mixed-species aggregation of bottlenose dolphins, short-finned pilot whales, and rough-toothed dolphins. Short-finned pilot whales were sighted in water depths of ~900–4500 m. Three sightings were over the West Mariana Ridge (an area of seamounts), and the remaining on-effort sighting was 13 km off the northeast corner of Guam, just inshore of the 3000-m isobath. There was also an off-effort sighting of a group of 6–10 pilot whales near the mouth of Apra Harbor.
V. TYPE OF INCIDENTAL TAKE AUTHORIZATION REQUESTED The type of incidental taking authorization that is being requested (i.e., takes by harassment only, takes by harassment, injury and/or death), and the method of incidental taking.
L-DEO requests an IHA pursuant to Section 101 (a) (5) (D) of the MMPA for incidental take by harassment during its planned seismic survey in the CNMI during February–March 2012.
The operations outlined in § I have the potential to take marine mammals by harassment. Sounds will be generated by the airguns used during the survey, by echosounders, and by general vessel operations. “Takes” by harassment will potentially result when marine mammals near the activities are exposed to the pulsed sounds generated by the airguns or echosounders. The effects will depend on the species of marine mammal, the behavior of the animal at the time of reception of the stimulus, as well as the distance and received level of the sound (see § VII). Disturbance reactions are likely amongst some of the marine mammals near the tracklines of the source vessel. No take by serious injury is anticipated, given the nature of the planned operations and the mitigation measures that are planned (see § XI, MITIGATION MEASURES). No lethal takes are expected.
VI. NUMBERS OF MARINE MAMMALS THAT COULD BE TAKEN
By age, sex, and reproductive condition (if possible), the number of marine mammals (by species) that may be taken by each type of taking identified in [section V], and the number of times such takings by each type of taking are likely to occur.
The material for § VI and § VII has been combined and presented in reverse order to minimize duplication between sections.
VII. ANTICIPATED IMPACT ON SPECIES OR STOCKS
The anticipated impact of the activity upon the species or stock of marine mammal.
The material for § VI and § VII has been combined and presented in reverse order to minimize duplication between sections.

VII. Anticipated Impacts on Species and Stocks
L-DEO IHA Application for the CNMI, 2012 Page 26
• First we summarize the potential impacts on marine mammals of airgun operations, as called for in § VII. A more comprehensive review of the relevant background information appears in Appendix B of the EA.
• Then we discuss the potential impacts of operations by the echosounders. • Finally, we estimate the numbers of marine mammals that could be affected by the proposed
survey in the CNMI during February–March 2012. This section includes a description of the rationale for the estimates of the potential numbers of harassment “takes” during the planned survey, as called for in § VI.
Summary of Potential Effects of Airgun Sounds The effects of sounds from airguns could include one or more of the following: tolerance, masking
of natural sounds, behavioral disturbance, and at least in theory, temporary or permanent hearing impair- ment, or non-auditory physical or physiological effects (Richardson et al. 1995; Gordon et al. 2004; Nowacek et al. 2007; Southall et al. 2007). Permanent hearing impairment, in the unlikely event that it occurred, would constitute injury, but temporary threshold shift (TTS) is not an injury (Southall et al. 2007). Although the possibility cannot be entirely excluded, it is unlikely that the project would result in any cases of temporary or especially permanent hearing impairment, or any significant non-auditory physical or physiological effects. Some behavioral disturbance is expected, but this would be localized and short-term.
Tolerance
Numerous studies have shown that pulsed sounds from airguns are often readily detectable in the water at distances of many kilometers. For a summary of the characteristics of airgun pulses, see Appen-dix B (3) in the EA. Several studies have shown that marine mammals at distances more than a few kilometers from operating seismic vessels often show no apparent response—see Appendix B (5) in the EA. That is often true even in cases when the pulsed sounds must be readily audible to the animals based on measured received levels and the hearing sensitivity of that mammal group. Although various baleen whales and toothed whales, and (less frequently) pinnipeds have been shown to react behaviorally to airgun pulses under some conditions, at other times mammals of all three types have shown no overt reactions. The relative responsiveness of baleen and toothed whales are quite variable.
Masking
Masking effects of pulsed sounds (even from large arrays of airguns) on marine mammal calls and other natural sounds are expected to be limited, although there are very few specific data on this. Because of the intermittent nature and low duty cycle of seismic pulses, animals can emit and receive sounds in the relatively quiet intervals between pulses. However, in exceptional situations, reverberation occurs for much or all of the interval between pulses (e.g., Simard et al. 2005; Clark and Gagnon 2006) which could mask calls. Some baleen and toothed whales are known to continue calling in the presence of seismic pulses, and their calls usually can be heard between the seismic pulses (e.g., Richardson et al. 1986; McDonald et al. 1995; Greene et al. 1999a,b; Nieukirk et al. 2004; Smultea et al. 2004; Holst et al. 2005a,b, 2006; Dunn and Hernandez 2009). However, Clark and Gagnon (2006) reported that fin whales in the northeast Pacific Ocean went silent for an extended period starting soon after the onset of a seismic survey in the area. Similarly, there has been one report that sperm whales ceased calling when exposed to pulses from a very distant seismic ship (Bowles et al. 1994). However, more recent studies found that they continued calling in the presence of seismic pulses (Madsen et al. 2002; Tyack et al. 2003; Smultea

VII. Anticipated Impacts on Species and Stocks
L-DEO IHA Application for the CNMI, 2012 Page 27
et al. 2004; Holst et al. 2006; Jochens et al. 2008). Dolphins and porpoises commonly are heard calling while airguns are operating (e.g., Gordon et al. 2004; Smultea et al. 2004; Holst et al. 2005a,b; Potter et al. 2007). The sounds important to small odontocetes are predominantly at much higher frequencies than are the dominant components of airgun sounds, thus limiting the potential for masking. In general, masking effects of seismic pulses are expected to be minor, given the normally intermittent nature of seismic pulses. Masking effects on marine mammals are discussed further in Appendix B (4) of the EA.
Disturbance Reactions
Disturbance includes a variety of effects, including subtle to conspicuous changes in behavior, movement, and displacement. Based on NMFS (2001, p. 9293), NRC (2005), and Southall et al. (2007), we assume that simple exposure to sound, or brief reactions that do not disrupt behavioral patterns in a potentially significant manner, do not constitute harassment or “taking”. By potentially significant, we mean “in a manner that might have deleterious effects to the well-being of individual marine mammals or their populations”.
Reactions to sound, if any, depend on species, state of maturity, experience, current activity, repro-ductive state, time of day, and many other factors (Richardson et al. 1995; Wartzok et al. 2004; Southall et al. 2007; Weilgart 2007). If a marine mammal does react briefly to an underwater sound by changing its behavior or moving a small distance, the impacts of the change are unlikely to be significant to the individual, let alone the stock or population. However, if a sound source displaces marine mammals from an important feeding or breeding area for a prolonged period, impacts on individuals and populations could be significant (e.g., Lusseau and Bejder 2007; Weilgart 2007). Given the many uncertainties in predicting the quantity and types of impacts of noise on marine mammals, it is common practice to estimate how many marine mammals would be present within a particular distance of industrial activities and/or exposed to a particular level of industrial sound. In most cases, this approach likely overestimates the numbers of marine mammals that would be affected in some biologically-important manner.
The sound criteria used to estimate how many marine mammals might be disturbed to some biologically-important degree by a seismic program are based primarily on behavioral observations of a few species. Detailed studies have been done on humpback, gray, bowhead, and sperm whales. Less detailed data are available for some other species of baleen whales, small toothed whales, and sea otters, but for many species there are no data on responses to marine seismic surveys.
Baleen Whales.—Baleen whales generally tend to avoid operating airguns, but avoidance radii are quite variable. Whales are often reported to show no overt reactions to pulses from large arrays of airguns at distances beyond a few kilometers, even though the airgun pulses remain well above ambient noise levels out to much longer distances. However, as reviewed in Appendix B (5) of the EA, baleen whales exposed to strong noise pulses from airguns often react by deviating from their normal migration route and/or interrupting their feeding and moving away. In the cases of migrating gray and bowhead whales, the observed changes in behavior appeared to be of little or no biological consequence to the animals. They simply avoided the sound source by displacing their migration route to varying degrees, but within the natural boundaries of the migration corridors.
Studies of gray, bowhead, and humpback whales have shown that seismic pulses with received levels of 160–170 dB re 1 µParms seem to cause obvious avoidance behavior in a substantial fraction of the animals exposed (Richardson et al. 1995). In many areas, seismic pulses from large arrays of airguns diminish to those levels at distances ranging from 4 to 15 km from the source. A substantial proportion of the baleen whales within those distances may show avoidance or other strong behavioral reactions to the airgun array. Subtle behavioral changes sometimes become evident at somewhat lower received levels, and studies

VII. Anticipated Impacts on Species and Stocks
L-DEO IHA Application for the CNMI, 2012 Page 28
summarized in Appendix B (5) of the EA have shown that some species of baleen whales, notably bowhead and humpback whales, at times show strong avoidance at received levels lower than 160–170 dB re 1 µParms.
Responses of humpback whales to seismic surveys have been studied during migration, on summer feeding grounds, and on Angolan winter breeding grounds; there has also been discussion of effects on the Brazilian wintering grounds. McCauley et al. (1998, 2000a) studied the responses of humpback whales off Western Australia to a full-scale seismic survey with a 16-airgun, 2678-in3 array, and to a single 20-in3 airgun with source level 227 dB re 1 µPa·mp–p. McCauley et al. (1998) documented that avoidance reactions began at 5–8 km from the array, and that those reactions kept most pods ~3–4 km from the operating seismic boat. McCauley et al. (2000a) noted localized displacement during migration of 4–5 km by traveling pods and 7–12 km by more sensitive resting pods of cow-calf pairs. Avoidance distances with respect to the single airgun were smaller but consistent with the results from the full array in terms of the received sound levels. The mean received level for initial avoidance of an approaching airgun was 140 dB re 1 µParms for humpback pods containing females, and at the mean closest point of approach (CPA) distance the received level was 143 dB re 1 µParms. The initial avoidance response generally occurred at distances of 5–8 km from the airgun array and 2 km from the single airgun. However, some individual humpback whales, especially males, approached within distances of 100–400 m, where the maximum received level was 179 dB re 1 µParms
Data collected by observers during several seismic surveys in the Northwest Atlantic showed that sighting rates of humpback whales were significantly greater during non-seismic periods compared with periods when a full array was operating (Moulton and Holst 2010). In addition, humpback whales were more likely to swim away and less likely to swim towards a vessel during seismic vs. non-seismic periods (Moulton and Holst 2010).
.
Humpback whales on their summer feeding grounds in southeast Alaska did not exhibit persistent avoidance when exposed to seismic pulses from a 1.64-L (100-in3) airgun (Malme et al. 1985). Some humpbacks seemed “startled” at received levels of 150–169 dB re 1 µPa. Malme et al. (1985) concluded that there was no clear evidence of avoidance, despite the possibility of subtle effects, at received levels up to 172 re 1 µPa on an approximate rms basis. However, Moulton and Holst (2010) reported that humpback whales monitored during seismic surveys in the Northwest Atlantic had lower sighting rates and were most often seen swimming away from the vessel during seismic periods compared with periods when airguns were silent.
It has been suggested that South Atlantic humpback whales wintering off Brazil may be displaced or even strand upon exposure to seismic surveys (Engel et al. 2004). The evidence for this was circum-stantial and subject to alternative explanations (IAGC 2004). Also, the evidence was not consistent with subsequent results from the same area of Brazil (Parente et al. 2006), or with direct studies of humpbacks exposed to seismic surveys in other areas and seasons. After allowance for data from subsequent years, there was “no observable direct correlation” between strandings and seismic surveys (IWC 2007:236).
There are no data on reactions of right whales to seismic surveys, but results from the closely-related bowhead whale show that their responsiveness can be quite variable depending on their activity (migrating vs. feeding). Bowhead whales migrating west across the Alaskan Beaufort Sea in autumn, in particular, are unusually responsive, with substantial avoidance occurring out to distances of 20–30 km from a medium-sized airgun source at received sound levels of around 120–130 dB re 1 µParms [Miller et al. 1999; Richardson et al. 1999; see Appendix B (5) of the EA]. However, more recent research on bowhead whales (Miller et al. 2005; Harris et al. 2007) corroborates earlier evidence that, during the

VII. Anticipated Impacts on Species and Stocks
L-DEO IHA Application for the CNMI, 2012 Page 29
summer feeding season, bowheads are not as sensitive to seismic sources. Nonetheless, subtle but statistically significant changes in surfacing–respiration–dive cycles were evident upon statistical analysis (Richardson et al. 1986). In summer, bowheads typically begin to show avoidance reactions at received levels of about 152–178 dB re 1 µParms (Richardson et al. 1986, 1995; Ljungblad et al. 1988; Miller et al. 2005).
Reactions of migrating and feeding (but not wintering) gray whales to seismic surveys have been studied. Malme et al. (1986, 1988) studied the responses of feeding eastern Pacific gray whales to pulses from a single 100-in3 airgun off St. Lawrence Island in the northern Bering Sea. They estimated, based on small sample sizes, that 50% of feeding gray whales stopped feeding at an average received pressure level of 173 dB re 1 µPa on an (approximate) rms basis, and that 10% of feeding whales interrupted feeding at received levels of 163 dB re 1 µParms
Various species of Balaenoptera (blue, sei, fin, and minke whales) have occasionally been seen in areas ensonified by airgun pulses (Stone 2003; MacLean and Haley 2004; Stone and Tasker 2006), and calls from blue and fin whales have been localized in areas with airgun operations (e.g., McDonald et al. 1995; Dunn and Hernandez 2009; Castellote et al. 2010). Sightings by observers on seismic vessels off the United Kingdom from 1997 to 2000 suggest that, during times of good sightability, sighting rates for mysticetes (mainly fin and sei whales) were similar when large arrays of airguns were shooting vs. silent (Stone 2003; Stone and Tasker 2006). However, these whales tended to exhibit localized avoidance, remaining significantly further (on average) from the airgun array during seismic operations compared with non-seismic periods (Stone and Tasker 2006). Castellote et al. (2010) reported that singing fin whales in the Mediterranean moved away from an operating airgun array.
. Those findings were generally consistent with the results of experiments conducted on larger numbers of gray whales that were migrating along the California coast (Malme et al. 1984; Malme and Miles 1985), and western Pacific gray whales feeding off Sakhalin Island, Russia (Würsig et al. 1999; Gailey et al. 2007; Johnson et al. 2007; Yazvenko et al. 2007a,b), along with data on gray whales off British Columbia, Canada (Bain and Williams 2006).
Ship-based monitoring studies of baleen whales (including blue, fin, sei, minke, and humpback whales) in the Northwest Atlantic found that overall, this group had lower sighting rates during seismic vs. non-seismic periods (Moulton and Holst 2010). Baleen whales as a group were also seen significantly farther from the vessel during seismic compared with non-seismic periods, and they were more often seen to be swimming away from the operating seismic vessel (Moulton and Holst 2010). Blue and minke whales were initially sighted significantly farther from the vessel during seismic operations compared to non-seismic periods; the same trend was observed for fin whales (Moulton and Holst 2010). Minke whales were most often observed to be swimming away from the vessel when seismic operations were underway (Moulton and Holst 2010).
Data on short-term reactions by cetaceans to impulsive noises are not necessarily indicative of long-term or biologically significant effects. It is not known whether impulsive sounds affect repro-ductive rate or distribution and habitat use in subsequent days or years. However, gray whales have continued to migrate annually along the west coast of North America with substantial increases in the population over recent years, despite intermittent seismic exploration (and much ship traffic) in that area for decades (Appendix A in Malme et al. 1984; Richardson et al. 1995; Allen and Angliss 2010). The western Pacific gray whale population did not seem affected by a seismic survey in its feeding ground during a previous year (Johnson et al. 2007). Similarly, bowhead whales have continued to travel to the eastern Beaufort Sea each summer, and their numbers have increased notably, despite seismic exploration in their summer and autumn range for many years (Richardson et al. 1987; Allen and Angliss 2010).

VII. Anticipated Impacts on Species and Stocks
L-DEO IHA Application for the CNMI, 2012 Page 30
Toothed Whales.—Little systematic information is available about reactions of toothed whales to sound pulses. Few studies similar to the more extensive baleen whale/seismic pulse work summarized above and (in more detail) in Appendix B of the EA have been reported for toothed whales. However, there are recent systematic studies on sperm whales (e.g., Gordon et al. 2006; Madsen et al. 2006; Winsor and Mate 2006; Jochens et al. 2008; Miller et al. 2009), and there is an increasing amount of information about responses of various odontocetes to seismic surveys based on monitoring studies (e.g., Stone 2003; Smultea et al. 2004; Moulton and Miller 2005; Bain and Williams 2006; Holst et al. 2006; Stone and Tasker 2006; Potter et al. 2007; Hauser et al. 2008; Holst and Smultea 2008; Weir 2008; Barkaszi et al. 2009; Richardson et al. 2009; Moulton and Holst 2010).
Seismic operators and marine mammal observers on seismic vessels regularly see dolphins and other small toothed whales near operating airgun arrays, but in general there is a tendency for most delphinids to show some avoidance of operating seismic vessels (e.g., Goold 1996a,b,c; Calambokidis and Osmek 1998; Stone 2003; Moulton and Miller 2005; Holst et al. 2006; Stone and Tasker 2006; Weir 2008; Barkaszi et al. 2009; Richardson et al. 2009; Moulton and Holst 2010). Some dolphins seem to be attracted to the seismic vessel and floats, and some ride the bow wave of the seismic vessel even when large arrays of airguns are firing (e.g., Moulton and Miller 2005). Nonetheless, small toothed whales more often tend to head away, or to maintain a somewhat greater distance from the vessel, when a large array of airguns is operating than when it is silent (e.g., Stone and Tasker 2006; Weir 2008; Barry et al. 2010; Moulton and Holst 2010). In most cases the avoidance radii for delphinids appear to be small, on the order of 1 km less, and some individuals show no apparent avoidance. The beluga is a species that (at least at times) shows long-distance avoidance of seismic vessels. Aerial surveys conducted in the south-eastern Beaufort Sea during summer found that sighting rates of beluga whales were significantly lower at distances 10–20 km compared with 20–30 km from an operating airgun array, and observers on seismic boats in that area rarely see belugas (Miller et al. 2005; Harris et al. 2007).
Captive bottlenose dolphins and beluga whales exhibited changes in behavior when exposed to strong pulsed sounds similar in duration to those typically used in seismic surveys (Finneran et al. 2000, 2002, 2005). However, the animals tolerated high received levels of sound before exhibiting aversive behaviors.
Results for porpoises depend on species. The limited available data suggest that harbor porpoises show stronger avoidance of seismic operations than do Dall’s porpoises (Stone 2003; MacLean and Koski 2005; Bain and Williams 2006; Stone and Tasker 2006). Dall’s porpoises seem relatively tolerant of airgun operations (MacLean and Koski 2005; Bain and Williams 2006), although they too have been observed to avoid large arrays of operating airguns (Calambokidis and Osmek 1998; Bain and Williams 2006). This apparent difference in responsiveness of these two porpoise species is consistent with their relative responsiveness to boat traffic and some other acoustic sources (Richardson et al. 1995; Southall et al. 2007).
Most studies of sperm whales exposed to airgun sounds indicate that the sperm whale shows considerable tolerance of airgun pulses (e.g., Stone 2003; Moulton et al. 2005, 2006a; Stone and Tasker 2006; Weir 2008). In most cases the whales do not show strong avoidance, and they continue to call (see Appendix B of the EA for review). However, controlled exposure experiments in the Gulf of Mexico indicate that foraging behavior was altered upon exposure to airgun sound (Jochens et al. 2008; Miller et al. 2009; Tyack 2009).
There are almost no specific data on the behavioral reactions of beaked whales to seismic surveys. However, some northern bottlenose whales remained in the general area and continued to produce high-
VII. Anticipated Impacts on Species and Stocks
L-DEO IHA Application for the CNMI, 2012 Page 31
frequency clicks when exposed to sound pulses from distant seismic surveys (Gosselin and Lawson 2004; Laurinolli and Cochrane 2005; Simard et al. 2005). Most beaked whales tend to avoid approaching vessels of other types (e.g., Würsig et al. 1998). They may also dive for an extended period when approached by a vessel (e.g., Kasuya 1986), although it is uncertain how much longer such dives may be as compared to dives by undisturbed beaked whales, which also are often quite long (Baird et al. 2006; Tyack et al. 2006). Based on a single observation, Aguilar-Soto et al. (2006) suggested that foraging efficiency of Cuvier’s beaked whales may be reduced by close approach of vessels. In any event, it is likely that most beaked whales would also show strong avoidance of an approaching seismic vessel, although this has not been documented explicitly. In fact, Moulton and Holst (2010) reported 15 sightings of beaked whales during seismic studies in the Northwest Atlantic; seven of those sightings were made at times when at least one airgun was operating. There was little evidence to indicate that beaked whale behavior was affected by airgun operations; sighting rates and distances were similar during seismic and non-seismic periods (Moulton and Holst 2010).
There are increasing indications that some beaked whales tend to strand when naval exercises involving mid-frequency sonar operation are ongoing nearby (e.g., Simmonds and Lopez-Jurado 1991; Frantzis 1998; NOAA and USN 2001; Jepson et al. 2003; Hildebrand 2005; Barlow and Gisiner 2006; see also the “Strandings and Mortality” subsection, later). These strandings are apparently at least in part a disturbance response, although auditory or other injuries or other physiological effects may also be involved. Whether beaked whales would ever react similarly to seismic surveys is unknown (see “Strand-ings and Mortality”, below). Seismic survey sounds are quite different from those of the sonars in operation during the above-cited incidents.
Odontocete reactions to large arrays of airguns are variable and, at least for delphinids and Dall’s porpoises, seem to be confined to a smaller radius than has been observed for the more responsive of the mysticetes, belugas, and harbor porpoises (Appendix B of the EA). A ≥170 dB re 1 μPa disturbance criterion (rather than ≥160 dB) is considered appropriate for delphinids (and pinnipeds), which tend to be less responsive than the more responsive cetaceans.
Pinnipeds.—Pinnipeds are not likely to show a strong avoidance reaction to the airgun array. Visual monitoring from seismic vessels has shown only slight (if any) avoidance of airguns by pinnipeds, and only slight (if any) changes in behavior—see Appendix B (5) of the EA. In the Beaufort Sea, some ringed seals avoided an area of 100 m to (at most) a few hundred meters around seismic vessels, but many seals remained within 100–200 m of the trackline as the operating airgun array passed by (e.g., Harris et al. 2001; Moulton and Lawson 2002; Miller et al. 2005). Ringed seal sightings averaged somewhat farther away from the seismic vessel when the airguns were operating than when they were not, but the difference was small (Moulton and Lawson 2002). Similarly, in Puget Sound, sighting distances for harbor seals and California sea lions tended to be larger when airguns were operating (Calambokidis and Osmek 1998). Previous telemetry work suggests that avoidance and other behavioral reactions may be stronger than evident to date from visual studies (Thompson et al. 1998).
Hearing Impairment and Other Physical Effects
Temporary or permanent hearing impairment is a possibility when marine mammals are exposed to very strong sounds. TTS has been demonstrated and studied in certain captive odontocetes and pinnipeds exposed to strong sounds (reviewed in Southall et al. 2007). However, there has been no specific docu-mentation of TTS let alone permanent hearing damage, i.e., permanent threshold shift (PTS), in free-ranging marine mammals exposed to sequences of airgun pulses during realistic field conditions. Current

VII. Anticipated Impacts on Species and Stocks
L-DEO IHA Application for the CNMI, 2012 Page 32
NMFS policy regarding exposure of marine mammals to high-level sounds is that cetaceans and pinnipeds should not be exposed to impulsive sounds with received levels ≥180 dB and 190 dB re 1 µParms
• the 180-dB criterion for cetaceans is probably quite precautionary, i.e., lower than necessary to avoid temporary auditory impairment let alone permanent auditory injury, at least for delphinids.
, respectively (NMFS 2000). These criteria have been used in establishing the exclusion (=shut-down) zones planned for the proposed seismic survey. However, those criteria were established before there was any information about minimum received levels of sounds necessary to cause auditory impairment in marine mammals. As discussed in Appendix B (6) of the EA and summarized here,
• TTS is not injury and does not constitute “Level A harassment” in U.S. MMPA terminology.
• the minimum sound level necessary to cause permanent hearing impairment (“Level A harass-ment”) is higher, by a variable and generally unknown amount, than the level that induces barely-detectable TTS.
• the level associated with the onset of TTS is often considered to be a level below which there is no danger of permanent damage. The actual PTS threshold is likely to be well above the level causing onset of TTS (Southall et al. 2007).
Recommendations for science-based noise exposure criteria for marine mammals, frequency-weighting procedures, and related matters were published by Southall et al. (2007). Those recom-mendations have not, as of autumn 2011, been formally adopted by NMFS for use in regulatory processes and during mitigation programs associated with seismic surveys. However, some aspects of the recom-mendations have been taken into account in certain environmental impact statements and small-take authorizations. NMFS has indicated that it may issue new noise exposure criteria for marine mammals that account for the now-available scientific data on TTS, the expected offset between the TTS and PTS thresholds, differences in the acoustic frequencies to which different marine mammal groups are sensitive (e.g., M-weighting or generalized frequency weightings for various groups of marine mammals, allowing for their functional bandwidths), and other relevant factors. Preliminary information about possible changes in the regulatory and mitigation requirements, and about the possible structure of new criteria, was given by Wieting (2004) and NMFS (2005).
Several aspects of the planned monitoring and mitigation measures for this project are designed to detect marine mammals occurring near the airgun array, and to avoid exposing them to sound pulses that might, at least in theory, cause hearing impairment (see § XI and § XIII). In addition, many marine mammals and (to a limited degree) sea turtles show some avoidance of the area where received levels of airgun sound are high enough such that hearing impairment could potentially occur. In those cases, the avoidance responses of the animals themselves will reduce or (most likely) avoid any possibility of hearing impairment.
Non-auditory physical effects may also occur in marine mammals exposed to strong underwater pulsed sound. Possible types of non-auditory physiological effects or injuries that might (in theory) occur in mammals close to a strong sound source include stress, neurological effects, bubble formation, and other types of organ or tissue damage. It is possible that some marine mammal species (i.e., beaked whales) may be especially susceptible to injury and/or stranding when exposed to strong transient sounds. However, as discussed below, there is no definitive evidence that any of these effects occur even for marine mammals in close proximity to large arrays of airguns. It is unlikely that any effects of these types would occur during the present project given the brief duration of exposure of any given mammal, the deep water in the study area, and the planned monitoring and mitigation measures (see below). The

VII. Anticipated Impacts on Species and Stocks
L-DEO IHA Application for the CNMI, 2012 Page 33
following subsections discuss in somewhat more detail the possibilities of TTS, PTS, and non-auditory physical effects.
Temporary Threshold Shift.—TTS is the mildest form of hearing impairment that can occur during exposure to a strong sound (Kryter 1985). While experiencing TTS, the hearing threshold rises and a sound must be stronger in order to be heard. At least in terrestrial mammals, TTS can last from minutes or hours to (in cases of strong TTS) days. For sound exposures at or somewhat above the TTS threshold, hearing sensitivity in both terrestrial and marine mammals recovers rapidly after exposure to the noise ends. Few data on sound levels and durations necessary to elicit mild TTS have been obtained for marine mammals, and none of the published data concern TTS elicited by exposure to multiple pulses of sound. Available data on TTS in marine mammals are summarized in Southall et al. (2007). Based on these data, the received energy level of a single seismic pulse (with no frequency weighting) might need to be ~186 dB re 1 µPa2 · s (i.e., 186 dB SEL or ~196–201 dB re 1 µParms) in order to produce brief, mild TTS2. Exposure to several strong seismic pulses that each have received levels near 190 dB re 1 µParms might result in cumulative exposure of ~186 dB SEL and thus slight TTS in a small odontocete assuming the TTS threshold is (to a first approximation) a function of the total received pulse energy; however, this ‘equal-energy’ concept is an oversimplification. The distances from the Langseth’s airguns at which the received energy level (per pulse, flat-weighted) would be expected to be ≥190 dB re 1 µParms are estimated in Table 1. Levels ≥190 dB re 1 µParms are expected to be restricted to radii no more than 400 m (Table 1). For an odontocete closer to the surface, the maximum radius with ≥190 dB re 1 µParms
The above TTS information for odontocetes is derived from studies on the bottlenose dolphin and beluga. For the one harbor porpoise tested, the received level of airgun sound that elicited onset of TTS was lower (Lucke et al. 2009). If these results from a single animal are representative, it is inappropriate to assume that onset of TTS occurs at similar received levels in all odontocetes (cf. Southall et al. 2007). Some cetaceans apparently can incur TTS at considerably lower sound exposures than are necessary to elicit TTS in the beluga or bottlenose dolphin.
would be smaller.
For baleen whales, there are no data, direct or indirect, on levels or properties of sound that are required to induce TTS. The frequencies to which baleen whales are most sensitive are assumed to be lower than those to which odontocetes are most sensitive, and natural background noise levels at those low frequencies tend to be higher. As a result, auditory thresholds of baleen whales within their frequency band of best hearing are believed to be higher (less sensitive) than are those of odontocetes at their best frequencies (Clark and Ellison 2004). From this, it is suspected that received levels causing TTS onset may also be higher in baleen whales (Southall et al. 2007). In any event, no cases of TTS are expected given three considerations: (1) the low abundance of baleen whales in the planned study area at the time of the survey; (2) the strong likelihood that baleen whales would avoid the approaching airguns (or vessel) before being exposed to levels high enough for TTS to occur; and (3) the mitigation measures that are planned.
In pinnipeds, TTS thresholds associated with exposure to brief pulses (single or multiple) of underwater sound have not been measured. Initial evidence from more prolonged (non-pulse) exposures suggested that some pinnipeds (harbor seals in particular) incur TTS at somewhat lower received levels
____________________________________ 2 If the low frequency components of the watergun sound used in the experiments of Finneran et al. (2002) are
downweighted as recommended by Miller et al. (2005) and Southall et al. (2007) using their Mmf-weighting curve, the effective exposure level for onset of mild TTS was 183 dB re 1 μPa2 · s (Southall et al. 2007).

VII. Anticipated Impacts on Species and Stocks
L-DEO IHA Application for the CNMI, 2012 Page 34
than do small odontocetes exposed for similar durations (Kastak et al. 1999, 2005; Ketten et al. 2001). The TTS threshold for pulsed sounds has been indirectly estimated as being an SEL of ~171 dB re 1 μPa2 · s (Southall et al. 2007), which would be equivalent to a single pulse with received level ~181–186 dB re 1 μParms,
NMFS (1995, 2000) concluded that cetaceans and pinnipeds should not be exposed to pulsed underwater noise at received levels exceeding, respectively, 180 and 190 dB re 1 µPa
or a series of pulses for which the highest rms values are a few dB lower. Corresponding values for California sea lions and northern elephant seals are likely to be higher (Kastak et al. 2005).
rms. Those sound levels are not considered to be the levels above which TTS might occur. Rather, they were the received levels above which, in the view of a panel of bioacoustics specialists convened by NMFS before TTS measurements for marine mammals started to become available, one could not be certain that there would be no injurious effects, auditory or otherwise, to marine mammals. As summarized above and in Southall et al. (2007), data that are now available imply that TTS is unlikely to occur in most odontocetes (and probably mysticetes as well) unless they are exposed to a sequence of several airgun pulses stronger than 190 dB re 1 µParms. For the harbor seal and any species with similarly low TTS thresholds, TTS may occur upon exposure to one or more airgun pulses whose received level equals the NMFS “do not exceed” value of 190 dB re 1 μParms. That criterion corresponds to a single-pulse SEL of 175–180 dB re 1 μPa2 · s in typical conditions, whereas TTS is suspected to be possible (in harbor seals) with a cumulative SEL of ~171 dB re 1 μPa2
Permanent Threshold Shift.—When PTS occurs, there is physical damage to the sound receptors in the ear. In severe cases, there can be total or partial deafness, whereas in other cases, the animal has an impaired ability to hear sounds in specific frequency ranges (Kryter 1985).
· s.
There is no specific evidence that exposure to pulses of airgun sound can cause PTS in any marine mammal, even with large arrays of airguns. However, given the possibility that mammals close to an airgun array might incur at least mild TTS, there has been further speculation about the possibility that some individuals occurring very close to airguns might incur PTS (e.g., Richardson et al. 1995, p. 372ff; Gedamke et al. 2008). Single or occasional occurrences of mild TTS are not indicative of permanent auditory damage, but repeated or (in some cases) single exposures to a level well above that causing TTS onset might elicit PTS.
Relationships between TTS and PTS thresholds have not been studied in marine mammals, but are assumed to be similar to those in humans and other terrestrial mammals. PTS might occur at a received sound level at least several decibels above that inducing mild TTS if the animal were exposed to strong sound pulses with rapid rise time—see Appendix B (6) of the EA. Based on data from terrestrial mammals, a precautionary assumption is that the PTS threshold for impulse sounds (such as airgun pulses as received close to the source) is at least 6 dB higher than the TTS threshold on a peak-pressure basis, and probably >6 dB (Southall et al. 2007). On an SEL basis, Southall et al. (2007:441-4) estimated that received levels would need to exceed the TTS threshold by at least 15 dB for there to be risk of PTS. Thus, for cetaceans they estimate that the PTS threshold might be an M-weighted SEL (for the sequence of received pulses) of ~198 dB re 1 μPa2 · s (15 dB higher than the Mmf-weighted TTS threshold, in a beluga, for a watergun impulse), where the SEL value is cumulated over the sequence of pulses. Additional assumptions had to be made to derive a corresponding estimate for pinnipeds, as the only available data on TTS-thresholds in pinnipeds pertain to non-impulse sound. Southall et al. (2007) estimate that the PTS threshold could be a cumulative Mpw-weighted SEL of ~186 dB re 1 μPa2 · s in the harbor seal exposed to impulse sound. The PTS threshold for the California sea lion and northern elephant seal would probably be higher, given the higher TTS thresholds in those species.

VII. Anticipated Impacts on Species and Stocks
L-DEO IHA Application for the CNMI, 2012 Page 35
Southall et al. (2007) also note that, regardless of the SEL, there is concern about the possibility of PTS if a cetacean received one or more pulses with peak pressure exceeding 230 or 218 dB re 1 μPa (peak), respectively. Thus, PTS might be expected upon exposure of cetaceans to either SEL ≥198 dB re 1 μPa2 · s or peak pressure ≥ 230 dB re 1 μPa. Corresponding pro posed dual criteria for pinnipeds (at least harbor seals) are ≥ 186 dB SEL and ≥ 218 dB peak pressure (Southall et al. 2007). These estimates are all first approximations, given the limited underlying data, assumptions, species differences, and evidence that the “equal energy” model may not be entirely correct. A peak pressure of ≥230 dB re 1 μPa (3.2 bar · m, 0-pk) would only be found within a few meters of the largest (360-in3
Given the higher level of sound necessary to cause PTS as compared with TTS, it is considerably less likely that PTS would occur. Baleen whales generally avoid the immediate area around operating seismic vessels, as do some other marine mammals and sea turtles. The planned monitoring and mitigation measures, including visual monitoring, passive acoustic monitoring (PAM) to complement visual observations, power downs, and shut downs of the airguns when mammals are seen within or approaching the “exclusion zones”, will further reduce the probability of exposure of marine mammals to sounds strong enough to induce PTS.
) airguns in the planned airgun array (e.g., Caldwell and Dragoset 2000). A peak pressure of 218 dB re 1 μPa could be received somewhat farther away; to estimate that specific distance, one would need to apply a model that accurately calculates peak pressures in the near-field around an array of airguns.
Stranding and Mortality.—Marine mammals close to underwater detonations of high explosives can be killed or severely injured, and the auditory organs are especially susceptible to injury (Ketten et al. 1993; Ketten 1995). However, explosives are no longer used for marine waters for commercial seismic surveys or (with rare exceptions) for seismic research; they have been replaced entirely by airguns or related non-explosive pulse generators. Airgun pulses are less energetic and have slower rise times, and there is no specific evidence that they can cause serious injury, death, or stranding even in the case of large airgun arrays. However, the association of strandings of beaked whales with naval exercises and, in one case, an L-DEO seismic survey (Malakoff 2002; Cox et al. 2006), has raised the possibility that beaked whales exposed to strong “pulsed” sounds may be especially susceptible to injury and/or behavioral reactions that can lead to stranding (e.g., Hildebrand 2005; Southall et al. 2007). Appendix B (6) of the EA provides additional details.
Specific sound-related processes that lead to strandings and mortality are not well documented, but may include (1) swimming in avoidance of a sound into shallow water; (2) a change in behavior (such as a change in diving behavior) that might contribute to tissue damage, gas bubble formation, hypoxia, cardiac arrhythmia, hypertensive hemorrhage or other forms of trauma; (3) a physiological change such as a vestibular response leading to a behavioral change or stress-induced hemorrhagic diathesis, leading in turn to tissue damage; and (4) tissue damage directly from sound exposure, such as through acoustically mediated bubble formation and growth or acoustic resonance of tissues. Some of these mechanisms are unlikely to apply in the case of impulse sounds. However, there are increasing indications that gas-bubble disease (analogous to “the bends”), induced in supersaturated tissue by a behavioral response to acoustic exposure, could be a pathologic mechanism for the strandings and mortality of some deep-diving cetaceans exposed to sonar. The evidence for this remains circumstantial and associated with exposure to naval mid-frequency sonar, not seismic surveys (Cox et al. 2006; Southall et al. 2007).
Seismic pulses and mid-frequency sonar signals are quite different, and some mechanisms by which sonar sounds have been hypothesized to affect beaked whales are unlikely to apply to airgun pul-ses. Sounds produced by airgun arrays are broadband impulses with most of the energy below 1 kHz.
VII. Anticipated Impacts on Species and Stocks
L-DEO IHA Application for the CNMI, 2012 Page 36
Typical military mid-frequency sonars emit non-impulse sounds at frequencies of 2–10 kHz, generally with a relatively narrow bandwidth at any one time. A further difference between seismic surveys and naval exercises is that naval exercises can involve sound sources on more than one vessel. Thus, it is not appropriate to assume that there is a direct connection between the effects of military sonar and seismic surveys on marine mammals. However, evidence that sonar signals can, in special circumstances, lead (at least indirectly) to physical damage and mortality (e.g., Balcomb and Claridge 2001; NOAA and USN 2001; Jepson et al. 2003; Fernández et al. 2004, 2005; Hildebrand 2005; Cox et al. 2006) suggests that caution is warranted when dealing with exposure of marine mammals to any high-intensity “pulsed” sound.
There is no conclusive evidence of cetacean strandings or deaths at sea as a result of exposure to seismic surveys, but a few cases of strandings in the general area where a seismic survey was ongoing have led to speculation concerning a possible link between seismic surveys and strandings. Suggestions that there was a link between seismic surveys and strandings of humpback whales in Brazil (Engel et al. 2004) were not well founded (IAGC 2004; IWC 2007). In Sept. 2002, there was a stranding of two Cuvier’s beaked whales in the Gulf of California, Mexico, when the L-DEO vessel R/V Maurice Ewing was operating a 20-airgun, 8490-in3
Non-auditory Physiological Effects.—Non-auditory physiological effects or injuries that theoret-ically might occur in marine mammals exposed to strong underwater sound include stress, neurological effects, bubble formation, resonance, and other types of organ or tissue damage (Cox et al. 2006; Southall et al. 2007). Studies examining such effects are limited. However, resonance effects (Gentry 2002) and direct noise-induced bubble formation (Crum et al. 2005) are implausible in the case of exposure to an impulsive broadband source like an airgun array. If seismic surveys disrupt diving patterns of deep-diving species, this might perhaps result in bubble formation and a form of “the bends”, as speculated to occur in beaked whales exposed to sonar. However, there is no specific evidence of this upon exposure to airgun pulses.
airgun array in the general area. The link between the stranding and the seismic surveys was inconclusive and not based on any physical evidence (Hogarth 2002; Yoder 2002). Nonetheless, the Gulf of California incident plus the beaked whale strandings near naval exercises involving use of mid-frequency sonar suggests a need for caution in conducting seismic surveys in areas occupied by beaked whales until more is known about effects of seismic surveys on those species (Hildebrand 2005). No injuries of beaked whales are anticipated during the proposed study because of (1) the high likelihood that any beaked whales nearby would avoid the approaching vessel before being exposed to high sound levels, (2) the proposed monitoring and mitigation measures, and (3) differences between the sound sources operated by L-DEO and those involved in the naval exercises associated with strandings.
In general, very little is known about the potential for seismic survey sounds (or other types of strong underwater sounds) to cause non-auditory physical effects in marine mammals. Such effects, if they occur at all, would presumably be limited to short distances and to activities that extend over a prolonged period. The available data do not allow identification of a specific exposure level above which non-auditory effects can be expected (Southall et al. 2007), or any meaningful quantitative predictions of the numbers (if any) of marine mammals that might be affected in those ways. Marine mammals that show behavioral avoidance of seismic vessels, including most baleen whales, some odontocetes, and some pinnipeds, are especially unlikely to incur non-auditory physical effects. Also, the planned mitigation measures (§ XI), including shut downs of the airguns, will reduce any such effects that might otherwise occur.

VII. Anticipated Impacts on Species and Stocks
L-DEO IHA Application for the CNMI, 2012 Page 37
Possible Effects of Multibeam Echosounder Signals The Kongsberg EM 122 MBES will be operated from the source vessel during the planned study.
Information about this equipment was provided in § I. Sounds from the MBES are very short signals, occurring for 2–15 ms once every 5–20 s, depending on water depth. Most of the energy in the signals emitted by this MBES is at frequencies near 12 kHz, and the maximum source level is 242 dB re 1 μParms
· mrms
Navy sonars that have been linked to avoidance reactions and stranding of cetaceans (1) generally have a longer signal duration than the Kongsberg EM 122, and (2) are often directed close to horizontally vs. more downward for the MBES. The area of possible influence of the MBES is much smaller—a narrow band below the source vessel. The duration of exposure for a given marine mammal can be much longer for a naval sonar. During L-DEO’s operations, the individual pings will be very short, and a given mammal would not receive many of the downward-directed pings as the vessel passes by. Possible effects of an MBES on marine mammals are outlined below.
. The beam is narrow (1–2º) in fore-aft extent and wide (150º) in the cross-track extent. Each ping consists of eight (in water >1000 m deep) or four (<1000 m deep) successive fan-shaped transmissions (segments) at different cross-track angles. Any given mammal at depth near the trackline would be in the main beam for only one or two of the nine segments. Also, marine mammals that encounter the Kongsberg EM 122 are unlikely to be subjected to repeated pings because of the narrow fore–aft width of the beam and will receive only limited amounts of energy because of the short pings. Animals close to the ship (where the beam is narrowest) are especially unlikely to be ensonified for more than one 2–15 ms pings (or two pings if in the overlap area). Similarly, Kremser et al. (2005) noted that the probability of a cetacean swimming through the area of exposure when an MBES emits a ping is small. The animal would have to pass the transducer at close range and be swimming at speeds similar to the vessel in order to receive the multiple pings that might result in sufficient exposure to cause TTS.
Masking
Marine mammal communications will not be masked appreciably by the MBES signals given the low duty cycle of the echosounder and the brief period when an individual mammal is likely to be within its beam. Furthermore, in the case of baleen whales, the MBES signals (12 kHz) do not overlap with the predominant frequencies in the calls, which would avoid any significant masking.
Behavioral Responses
Behavioral reactions of free-ranging marine mammals to sonars, echosounders, and other sound sources appear to vary by species and circumstance. Observed reactions have included silencing and dispersal by sperm whales (Watkins et al. 1985), increased vocalizations and no dispersal by pilot whales (Rendell and Gordon 1999), and the previously-mentioned beachings by beaked whales. During exposure to a 21–25 kHz “whale-finding” sonar with a source level of 215 dB re 1 μPa ·
Captive bottlenose dolphins and a white whale exhibited changes in behavior when exposed to 1-s tonal signals at frequencies similar to those that will be emitted by the MBES used by L-DEO, and to shorter broadband pulsed signals. Behavioral changes typically involved what appeared to be deliberate
m, gray whales reacted by orienting slightly away from the source and being deflected from their course by ~200 m (Frankel 2005). When a 38-kHz echosounder and a 150-kHz acoustic Doppler current profiler were transmitting during studies in the Eastern Tropical Pacific (ETP), baleen whales showed no significant responses, while spotted and spinner dolphins were detected slightly more often and beaked whales less often during visual surveys (Gerrodette and Pettis 2005).

VII. Anticipated Impacts on Species and Stocks
L-DEO IHA Application for the CNMI, 2012 Page 38
attempts to avoid the sound exposure (Schlundt et al. 2000; Finneran et al. 2002; Finneran and Schlundt 2004). The relevance of those data to free-ranging odontocetes is uncertain, and in any case, the test sounds were quite different in duration as compared with those from an MBES.
Very few data are available on the reactions of pinnipeds to echosounder sounds at frequencies similar to those used during seismic operations. Hastie and Janik (2007) conducted a series of behavioral response tests on two captive gray seals to determine their reactions to underwater operation of a 375-kHz multibeam imaging echosounder that included significant signal components down to 6 kHz. Results indicated that the two seals reacted to the signal by significantly increasing their dive durations. Because of the likely brevity of exposure to the MBES sounds, pinniped reactions are expected to be limited to startle or otherwise brief responses of no lasting consequence to the animals. However, pinnipeds are not expected to occur in the study area.
Hearing Impairment and Other Physical Effects
Given recent stranding events that have been associated with the operation of naval sonar, there is concern that mid-frequency sonar sounds can cause serious impacts to marine mammals (see above). However, the MBES proposed for use by L-DEO is quite different than sonars used for navy operations. Ping duration of the MBES is very short relative to the naval sonars. Also, at any given location, an individual marine mammal would be in the beam of the MBES for much less time given the generally downward orientation of the beam and its narrow fore-aft beamwidth; navy sonars often use near-horizontally-directed sound. Those factors would all reduce the sound energy received from the MBES rather drastically relative to that from the sonars used by the navy.
Given the maximum source level of 242 dB re 1 µPa · mrms (see § I), the received level for an animal within the MBES beam 100 m below the ship would be ~202 dB re 1 µParms, assuming 40 dB of spreading loss over 100 m (circular spreading). Given the narrow beam, only one ping is likely to be received by a given animal as the ship passes overhead. The received energy level from a single ping of duration 15 ms would be ~184 dB re 1 µPa2 · s, i.e., 202 dB + 10 log (0.015 s). That is below the TTS threshold for a cetacean receiving a single non-impulse sound (195 dB re 1 μPa2 · s) and even further below the anticipated PTS threshold (215 dB re 1 μPa2 · s) (Southall et al. 2007). In contrast, an animal that was only 10 m below the MBES when a ping is emitted would be expected to receive a level ~20 dB higher, i.e., 204 dB re 1 μPa2 ·
In the harbor seal, the TTS threshold for non-impulse sounds is about 183 dB re 1 μPa
s in the case of the EM120. That animal might incur some TTS (which would be fully recoverable), but the exposure would still be below the anticipated PTS threshold for cetaceans. As noted by Burkhardt et al. (2008), cetaceans are very unlikely to incur PTS from operation of scientific sonars on a ship that is underway.
2 · s, as compared with ~195 dB re 1 μPa2 · s in odontocetes (Kastak et al. 2005; Southall et al. 2007). TTS onset occurs at higher received energy levels in the California sea lion and northern elephant seal than in the harbor seal. A harbor seal as much as 100 m below the Langseth could receive a single MBES ping with received energy level of ≥184 dB re 1 µPa2 · s (as calculated in the toothed whale subsection above) and thus could incur slight TTS. Species of pinnipeds with higher TTS thresholds would not incur TTS unless they were closer to the transducers when a ping was emitted. However, the SEL criterion for PTS in pinnipeds (203 dB re 1 µPa2 · s) might be exceeded for a ping received within a few meters of the transducers, although the risk of PTS is higher for certain species (e.g., harbor seal). Given the inter-mittent nature of the signals and the narrow MBES beam, only a small fraction of the pinnipeds below

VII. Anticipated Impacts on Species and Stocks
L-DEO IHA Application for the CNMI, 2012 Page 39
(and close to) the ship would receive a ping as the ship passed overhead. However, pinnipeds are not expected to occur in the study area.
Possible Effects of the Sub-bottom Profiler Signals An SBP will also be operated from the source vessel during the planned study. Details about this
equipment were provided in § I. Sounds from the SBP are very short pings, occurring for up to 64 ms once every second. Most of the energy in the pings emitted by the SBP is at 3.5 kHz, and the beam is directed downward. The sub-bottom profiler on the Langseth has a maximum source level of 222 dB re 1 µPa·m (see § I). Kremser et al. (2005) noted that the probability of a cetacean swimming through the area of exposure when a bottom profiler emits a ping is small―even for an SBP more powerful than that on the Langseth―if the animal was in the area, it would have to pass the transducer at close range and in order to be subjected to sound levels that could cause TTS.
Masking
Marine mammal communications will not be masked appreciably by the SBP signals given the directionality of the signal and the brief period when an individual mammal is likely to be within its beam. Furthermore, in the case of most baleen whales, the SBP signals do not overlap with the predominant frequencies in the calls, which would avoid significant masking.
Behavioral Responses
Marine mammal behavioral reactions to other sound sources are discussed above, and responses to the SBP are likely to be similar to those for other non-impulse sources if received at the same levels. However, the signals from the SBP are considerably weaker than those from the MBES. Therefore, behavioral responses are not expected unless marine mammals are very close to the source.
Hearing Impairment and Other Physical Effects
It is unlikely that the SBP produces sound levels strong enough to cause hearing impairment or other physical injuries even in an animal that is (briefly) in a position near the source. The SBP is usually operated simultaneously with other higher-power acoustic sources, including airguns. Many marine mammals will move away in response to the approaching higher-power sources or the vessel itself before the mammals would be close enough for there to be any possibility of effects from the less intense sounds from the SBP. In the case of mammals that do not avoid the approaching vessel and its various sound sources, mitigation measures that would be applied to minimize effects of other sources (see § XI) would further reduce or eliminate any minor effects of the SBP.
Possible Effects of the Acoustic Release Signals The acoustic release transponder used to communicate with the OBSs uses frequencies of 9–
13 kHz. These signals will be used very intermittently. It is unlikely that the acoustic release signals would have a significant effect on marine mammals through masking, disturbance, or hearing impairment. Any effects likely would be negligible given the brief exposure at presumable low levels.
Numbers of Marine Mammals that could be “Taken by Harassment” All anticipated takes would be “takes by harassment”, involving temporary changes in behavior.
The mitigation measures to be applied will minimize the possibility of injurious takes. (However, as noted earlier, there is no specific information demonstrating that injurious “takes” would occur even in

VII. Anticipated Impacts on Species and Stocks
L-DEO IHA Application for the CNMI, 2012 Page 40
the absence of the planned mitigation measures.) In the sections below, we describe methods to estimate the number of potential exposures to various received sound levels and present estimates of the numbers of marine mammals that could be affected during the proposed seismic program. The estimates are based on a consideration of the number of marine mammals that could be disturbed appreciably by operations with the 36-airgun array to be used during ~2800 km of seismic surveys in the CNMI. The sources of distributional and numerical data used in deriving the estimates are described in the next subsection.
It is assumed that, during simultaneous operations of the airgun array and the other sources, any marine mammals close enough to be affected by the MBES and SBP would already be affected by the airguns. However, whether or not the airguns are operating simultaneously with the other sources, marine mammals are expected to exhibit no more than short-term and inconsequential responses to the MBES and SBP given their characteristics (e.g., narrow downward-directed beam) and other considerations described in § I. Such reactions are not considered to constitute “taking” (NMFS 2001). Therefore, no additional allowance is included for animals that could be affected by sound sources other than airguns.
Basis for Estimating “Take by Harassment”
The only systematic marine mammal survey conducted in the CNMI was a ship-based survey conducted for the U.S. Navy during January–April 2007 in four legs: 16 January–2 February, 6–25 February, 1–20 March, and 24 March–12 April (SRS-Parsons et al. 2007; Fulling et al. 2011). The cruise area was defined by the boundaries 10–18°N 142–148°E, encompassing an area ~585,000 km2 including the islands of Guam and the southern CNMI almost as far north as Pagan3
We used the densities calculated in Fulling et al. (2011) for the 12 species sighted in that survey. For eight species not sighted in that survey but expected to occur in the CNMI, relevant densities are available for the “outer EEZ stratum” of Hawaiian waters, based on a 13,500-km survey conducted by NMFS SWFSC in August–November 2002 (Barlow 2006). Another potential source of relevant densities are the SWFSC surveys conducted in the ETP during summer/fall 1986–1996 (Ferguson and Barlow 2001, 2003). However, for five of the remaining seven species that could occur in the survey area, there were no sightings in offshore tropical strata during those surveys, and for another (the humpback whale), there was only one sighting in more than 50 offshore tropical (<20º latitude) 5º x 5º strata. The short-beaked common dolphin was sighted in a number of offshore tropical strata, so its density was calculated as the effort-weighted mean of densities in the 17 offshore 5º x 5º strata between 10ºN and 20ºN (Ferguson and Barlow 2003).
. The systematic line-transect survey effort was conducted from the flying bridge (10.5 m above sea level) of the 56-m long M/V Kahana using standard line-transect protocols developed by NMFS Southwest Fisheries Science Center (SWFSC). Observers visually surveyed 11,033 km of trackline, mostly in high sea states (88% of the time in Beaufort Sea states 4–6).
Table 3 gives the estimated densities for each cetacean species that could occur in the proposed survey area. The densities mentioned above had been corrected, by the original authors, for detectability bias, and in two of the three areas, for availability bias. Detectability bias is associated with diminishing sight-ability with increasing lateral distance from the track line [f(0)]. Availability bias refers to the fact that there is less-than 100% probability of sighting an animal that is present along the survey track line , and it is measured by g(0). Fulling et al. (2011) did not correct the Marianas densities for g(0), which, for all but large (>20) groups of dolphins (where g(0) = 1), resulted in underestimates of density.
____________________________________ 3 The survey area includes the southwest part of the proposed seismic survey area.
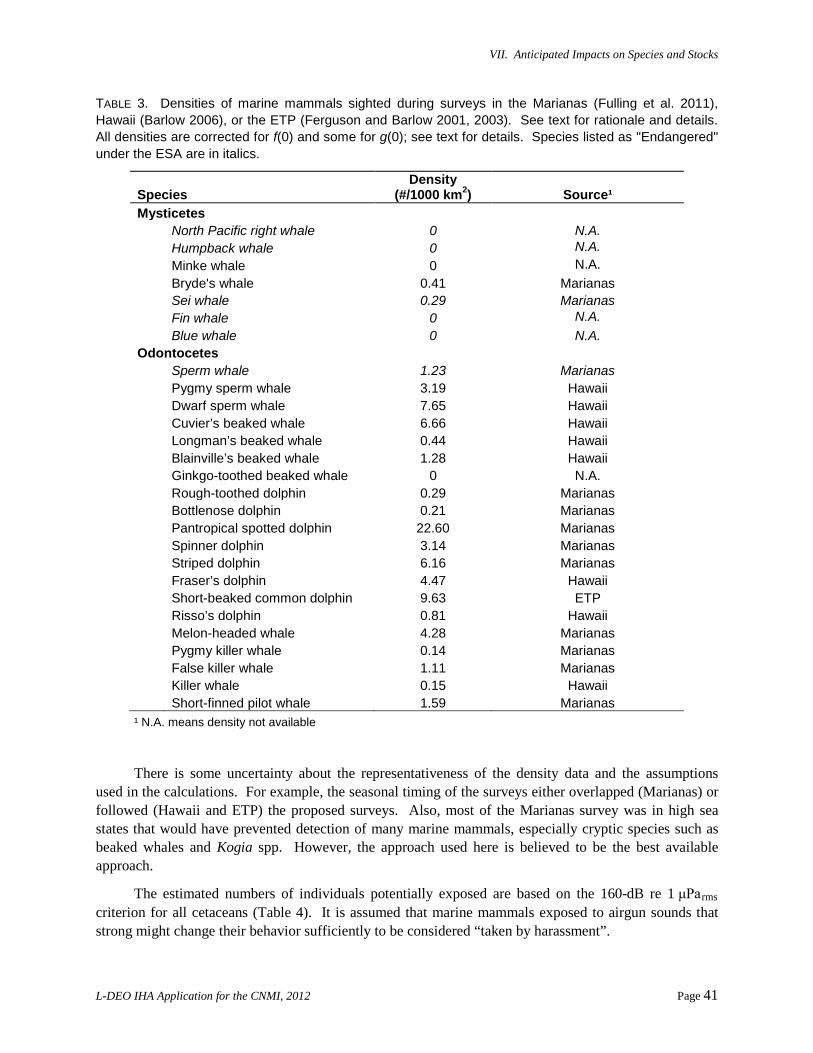
VII. Anticipated Impacts on Species and Stocks
L-DEO IHA Application for the CNMI, 2012 Page 41
TABLE 3. Densities of marine mammals sighted during surveys in the Marianas (Fulling et al. 2011), Hawaii (Barlow 2006), or the ETP (Ferguson and Barlow 2001, 2003). See text for rationale and details. All densities are corrected for f(0) and some for g(0); see text for details. Species listed as "Endangered" under the ESA are in italics.
Species Density
(#/1000 km2) Source¹ Mysticetes North Pacific right whale 0 N.A. Humpback whale 0 N.A. Minke whale 0 N.A. Bryde's whale 0.41 Marianas Sei whale 0.29 Marianas Fin whale 0 N.A. Blue whale 0 N.A. Odontocetes Sperm whale 1.23 Marianas Pygmy sperm whale 3.19 Hawaii Dwarf sperm whale 7.65 Hawaii Cuvier’s beaked whale 6.66 Hawaii Longman’s beaked whale 0.44 Hawaii Blainville’s beaked whale 1.28 Hawaii Ginkgo-toothed beaked whale 0 N.A. Rough-toothed dolphin 0.29 Marianas Bottlenose dolphin 0.21 Marianas Pantropical spotted dolphin 22.60 Marianas Spinner dolphin 3.14 Marianas Striped dolphin 6.16 Marianas Fraser’s dolphin 4.47 Hawaii Short-beaked common dolphin 9.63 ETP Risso’s dolphin 0.81 Hawaii Melon-headed whale 4.28 Marianas Pygmy killer whale 0.14 Marianas False killer whale 1.11 Marianas Killer whale 0.15 Hawaii Short-finned pilot whale 1.59 Marianas ¹ N.A. means density not available
There is some uncertainty about the representativeness of the density data and the assumptions used in the calculations. For example, the seasonal timing of the surveys either overlapped (Marianas) or followed (Hawaii and ETP) the proposed surveys. Also, most of the Marianas survey was in high sea states that would have prevented detection of many marine mammals, especially cryptic species such as beaked whales and Kogia spp. However, the approach used here is believed to be the best available approach.
The estimated numbers of individuals potentially exposed are based on the 160-dB re 1 μParms criterion for all cetaceans (Table 4). It is assumed that marine mammals exposed to airgun sounds that strong might change their behavior sufficiently to be considered “taken by harassment”.

VII. Anticipated Impacts on Species and Stocks
L-DEO IHA Application for the CNMI, 2012 Page 42
It should be noted that the following estimates of exposures to various sound levels assume that the surveys will be completed; in fact, the ensonified areas calculated using the planned number of line-kilometers have been increased by 25% to accommodate lines that may need to be repeated, equipment testing, etc. As is typical during offshore ship surveys, inclement weather and equipment malfunctions are likely to cause delays and may limit the number of useful line-kilometers of seismic operations that can be undertaken. Furthermore, any marine mammal sightings within or near the designated exclusion zones will result in the power down or shut down of seismic operations as a mitigation measure. Thus, the following estimates of the numbers of marine mammals potentially exposed to 160-dB re 1 μParms
Furthermore, as summarized in “Summary of Potential Airgun Effects”, above, and Appendix B (5), delphinids seem to be less responsive to airgun sounds than are some mysticetes. The 160-dB (rms) criterion currently applied by NMFS, on which the following estimates are based, was developed based primarily on data from gray and bowhead whales. A ≥170 dB re 1 μPa disturbance criterion (rather than ≥160 dB) is considered appropriate for delphinids (and pinnipeds), which tend to be less responsive than the more responsive cetaceans. The estimates of “takes by harassment” of delphinids given below are thus considered precautionary.
sounds are precautionary, and probably overestimate the actual numbers of marine mammals that might be involved. These estimates assume that there will be no weather, equipment, or mitigation delays, which is highly unlikely.
Potential Number of Marine Mammals Exposed to Airgun Sounds
The number of different individual cetaceans that could be exposed to airgun sounds with received levels ≥160 dB re 1 μParms on one or more occasions can be estimated by considering the expected density of animals in the area along with the total marine area that would be within the 160-dB radius around the operating airgun array on at least one occasion. The number of possible exposures (including repeated exposures of the same individuals) can be estimated by considering the total marine area that would be within the 160-dB radius around the operating airguns, including areas of overlap. In the proposed survey, the seismic lines are widely spaced in the survey area, so an individual mammal would most likely not be exposed numerous times during the survey; the area including overlap is 1.4 x the area excluding overlap, so a marine mammal that stayed in the survey area during the entire survey could be exposed ~2 times, on average. However, it is unlikely that a particular animal would stay in the area during the entire survey.
The numbers of different individuals potentially exposed to ≥160 dB re 1 µParms
• the expected species density, times
were calculated by multiplying
• the anticipated area to be ensonified to that level during airgun operations excluding overlap. The area expected to be ensonified was determined by entering the planned survey lines into a
MapInfo Geographic Information System (GIS), using the GIS to identify the relevant areas by “drawing” the applicable 160-dB buffer (see Table 1) around each seismic line, and then calculating the total area within the buffers. Areas of overlap were included only once when estimating the number of individuals exposed.

VII. Anticipated Impacts on Species and Stocks
L-DEO IHA Application for the CNMI, 2012 Page 43
TABLE 4. Estimates of the possible numbers of marine mammals exposed to sound levels ≥160 dB re 1 µPa (rms, averaged over pulse duration), consistent with NMFS’ practice, during L-DEO’s proposed seismic survey in the CNMI during February–March 2012. The proposed sound source is a 36-airgun array with a total discharge volume of ~6600 in³. Not all marine mammals will change their behavior when exposed to these sound levels, but some may alter their behavior at higher or lower received levels (see text). Species in italics are listed under the ESA as endangered.
Species
Number of Individuals Exposed to Sound Levels
>160 dB
Number
% of Regional
Pop'n1
Requested Take
Authorization Mysticetes North Pacific right whale 0 0 0 Humpback whale 0 0 0 Minke whale 0 0 32 Bryde's whale 8 0.03 8 Sei whale 6 0.06 6 Fin whale 0 0 0 Blue whale 0 0 0 Odontocetes Sperm whale 24 0.08 24 Pygmy sperm whale 62 N.A. 62 Dwarf sperm whale 150 1.34 150 Cuvier’s beaked whale 131 0.65 131 Longman's beaked whale 9 N.A. 183 Blainville’s beaked whale 25 0.10 25 Ginkgo-toothed beaked whale 0 0 0 Rough-toothed dolphin 6 <0.01 93 Bottlenose dolphin 4 <0.01 4 Pantropical spotted dolphin 443 0.06 443 Spinner dolphin 62 0.01 983 Striped dolphin 121 0.01 121 Fraser's dolphin 88 0.03 2863 Short-beaked common dolphin 189 0.01 189 Risso’s dolphin 16 0.01 16 Melon-headed whale 84 0.19 953 Pygmy killer whale 3 0.01 63 False killer whale 22 0.05 22 Killer whale 3 0.03 53 Short-finned pilot whale 31 0.01 31
1 Regional population sizes are from Table 3. 2 Requested Take Authorization increased to mean group size from Jefferson et al. (2008). 3 Requested Take Authorization increased to mean group size from density sources in Table 4.

VII. Anticipated Impacts on Species and Stocks
L-DEO IHA Application for the CNMI, 2012 Page 44
Applying the approach described above, ~15,685 km2 (19,607 km2 including the 25% contingency) would be within the 160-dB isopleth on one or more occasions during the survey. Because this approach does not allow for turnover in the mammal populations in the study area during the course of the survey, the actual number of individuals exposed could be underestimated. In addition, the approach assumes that no cetaceans will move away from or toward the trackline as the Langseth approaches in response to increasing sound levels prior to the time the levels reach 160 dB, which will result in overestimates for those species known to avoid seismic vessels.
Table 4 shows estimates of the number of different individual marine mammals that potentially could be exposed to ≥160 dB re 1 μParms
The estimate of the number of individual cetaceans that could be exposed to seismic sounds with received levels ≥160 dB re 1 µPa
during the seismic survey if no animals moved away from the survey vessel. The Requested Take Authorization, given in the far right column of Table 4, has been increased to the mean group size for the particular species in cases where the calculated number of individuals exposed was between 1 and the mean group size. Mean group sizes are from the same source as densities (see Table 3). For the minke whale, which was not sighted during the January–April 2007 survey in the waters of Guam and the southern CNMI but was the baleen whale species most frequently detected acoustically, the Requested Take Authorization, given in the far right column of Table 5, has also been increased to the mean group size.
rms
In addition, 24 sperm whales (also listed as Endangered under the ESA) or 0.08% of the regional population could be exposed during the survey, and 165 beaked whales including Cuvier’s, Longman’s, and Blainville’s beaked whales (Table 4). Most (72.1%) of the cetaceans potentially exposed are del-phinids; pantropical spotted, short-beaked common, striped, and Fraser’s dolphins and melon-headed whales are estimated to be the most common species in the area, with estimates of 443 (0.06% of the regional population), 189 (0.01%), 121 (0.01%), 88 (0.03%), and 84 (0.19%) exposed to ≥160 dB re 1 μPa
during the proposed survey is 1487 (Table 4). That total includes 14 baleen whales, 6 of which are Endangered sei whales, or 0.06% of the regional population (Table 4).
rms
Conclusions
, respectively.
The proposed seismic survey will involve towing an airgun array that introduces pulsed sounds into the ocean, along with simultaneous operation of an MBES and SBP. The survey will employ a 36-airgun array similar to the airgun arrays used for typical high-energy seismic surveys. The total airgun discharge volume is ~6600 in3
Cetaceans.—Several species of mysticetes show strong avoidance reactions to seismic vessels at ranges up to 6–8 km and occasionally as far as 20–30 km from the source vessel when medium-large airgun arrays have been used. However, reactions at the longer distances appear to be atypical of most species and situations. If mysticetes are encountered, the numbers estimated to occur within the 160-dB isopleth in the survey area are expected to be relatively low.
. Routine vessel operations, other than the proposed airgun operations, are conven-tionally assumed not to affect marine mammals sufficiently to constitute “taking”. No “taking” of marine mammals is expected in association with echosounder operations given the considerations discussed in § I, i.e., sounds are beamed downward, the beam is narrow, and the pulses are extremely short.
Odontocete reactions to seismic pulses, or at least the reactions of delphinids, are expected to extend to lesser distances than are those of mysticetes. Odontocete low-frequency hearing is less sen-sitive than that of mysticetes, and dolphins are often seen from seismic vessels. In fact, there are docu-

VII. Anticipated Impacts on Species and Stocks
L-DEO IHA Application for the CNMI, 2012 Page 45
mented instances of dolphins approaching active seismic vessels. However, delphinids (along with other cetaceans) sometimes show avoidance responses and/or other changes in behavior when near operating seismic vessels.
Taking into account the mitigation measures that are planned (see § XI), effects on cetaceans are generally expected to be limited to avoidance of the area around the seismic operation and short-term changes in behavior, falling within the MMPA definition of “Level B harassment”.
Estimates of the numbers of marine mammals that might be exposed to strong airgun sounds during the proposed program have been presented. The requested “take authorization” for each species is based on the estimated number of individuals that could be exposed to ≥160 dB re 1 µParms
The many cases of apparent tolerance by cetaceans of seismic exploration, vessel traffic, and some other human activities show that co-existence is possible. Mitigation measures such as look outs, ramp ups, and power downs or shut downs when marine mammals are seen within defined ranges, as well as special mitigation measures for right whales, should further reduce short-term reactions, and avoid or minimize any effects on hearing sensitivity. In all cases, the effects are expected to be short-term, with no lasting biological consequence.
. Those figures likely overestimate the actual number of animals that will be exposed to and will react to the seismic sounds. The reasons for that conclusion are outlined above. The relatively short-term exposures are unlikely to result in any long-term negative consequences for the individuals or their populations.
VIII. ANTICIPATED IMPACT ON SUBSISTENCE
The anticipated impact of the activity on the availability of the species or stocks of marine mammals for subsistence uses.
There is no legal subsistence hunting for marine mammals in the CNMI, so the proposed activities will not have any impact on the availability of the species or stocks for subsistence users.
IX. ANTICIPATED IMPACT ON HABITAT
The anticipated impact of the activity upon the habitat of the marine mammal populations, and the likelihood of restoration of the affected habitat.
The proposed seismic survey will not result in any permanent impact on habitats used by marine mammals, or to the food sources they use. The main impact issue associated with the proposed activity will be temporarily elevated noise levels and the associated direct effects on marine mammals, as discussed in § VII, above. The following sections briefly review effects of airguns on fish and invertebrates, and more details are included in Appendices C and D of the EA, respectively.
Effects on Fish One reason for the adoption of airguns as the standard energy source for marine seismic surveys is
that, unlike explosives, they have not been associated with large-scale fish kills. However, existing information on the impacts of seismic surveys on marine fish populations is limited (see Appendix D of the EA). There are three types of potential effects of exposure to seismic surveys: (1) pathological, (2) physiological, and (3) behavioral. Pathological effects involve lethal and temporary or permanent sub-lethal injury. Physiological effects involve temporary and permanent primary and secondary stress responses, such as changes in levels of enzymes and proteins. Behavioral effects refer to temporary and

IX. Anticipated Impact on Habitat
L-DEO IHA Application for the CNMI, 2012 Page 46
(if they occur) permanent changes in exhibited behavior (e.g., startle and avoidance behavior). The three categories are interrelated in complex ways. For example, it is possible that certain physiological and behavioral changes could potentially lead to an ultimate pathological effect on individuals (i.e., mortality).
The specific received sound levels at which permanent adverse effects to fish potentially could occur are little studied and largely unknown. Furthermore, the available information on the impacts of seismic surveys on marine fish is from studies of individuals or portions of a population; there have been no studies at the population scale. The studies of individual fish have often been on caged fish that were exposed to airgun pulses in situations not representative of an actual seismic survey. Thus, available information provides limited insight on possible real-world effects at the ocean or population scale. This makes drawing conclusions about impacts on fish problematic because, ultimately, the most important issues concern effects on marine fish populations, their viability, and their availability to fisheries.
Hastings and Popper (2005), Popper (2009), and Popper and Hastings (2009a,b) provided recent critical reviews of the known effects of sound on fish. The following sections provide a general synopsis of the available information on the effects of exposure to seismic and other anthropogenic sound as relevant to fish. The information comprises results from scientific studies of varying degrees of rigor plus some anecdotal information. Some of the data sources may have serious shortcomings in methods, analysis, interpretation, and reproducibility that must be considered when interpreting their results (see Hastings and Popper 2005). Potential adverse effects of the program’s sound sources on marine fish are then noted.
Pathological Effects
The potential for pathological damage to hearing structures in fish depends on the energy level of the received sound and the physiology and hearing capability of the species in question (see Appendix D of the EA). For a given sound to result in hearing loss, the sound must exceed, by some substantial amount, the hearing threshold of the fish for that sound (Popper 2005). The consequences of temporary or permanent hearing loss in individual fish on a fish population are unknown; however, they likely depend on the number of individuals affected and whether critical behaviors involving sound (e.g., predator avoidance, prey capture, orientation and navigation, reproduction, etc.) are adversely affected.
Little is known about the mechanisms and characteristics of damage to fish that may be inflicted by exposure to seismic survey sounds. Few data have been presented in the peer-reviewed scientific literature. As far as we know, there are only two papers with proper experimental methods, controls, and careful pathological investigation implicating sounds produced by actual seismic survey airguns in causing adverse anatomical effects. One such study indicated anatomical damage, and the second indicated TTS in fish hearing. The anatomical case is McCauley et al. (2003), who found that exposure to airgun sound caused observable anatomical damage to the auditory maculae of “pink snapper” (Pagrus auratus). This damage in the ears had not been repaired in fish sacrificed and examined almost two months after exposure. On the other hand, Popper et al. (2005) documented only TTS (as determined by auditory brainstem response) in two of three fish species from the Mackenzie River Delta. This study found that broad whitefish (Coregonus nasus) that received a sound exposure level of 177 dB re 1 µPa2 · s showed no hearing loss. During both studies, the repetitive exposure to sound was greater than would have occurred during a typical seismic survey. However, the substantial low-frequency energy produced by the airguns [less than ~400 Hz in the study by McCauley et al. (2003) and less than ~200 Hz in Popper et al. (2005)] likely did not propagate to the fish because the water in the study areas was very shallow (~9 m in the former case and <2

IX. Anticipated Impact on Habitat
L-DEO IHA Application for the CNMI, 2012 Page 47
m in the latter). Water depth sets a lower limit on the lowest sound frequency that will propagate (the “cutoff frequency”) at about one-quarter wavelength (Urick 1983; Rogers and Cox 1988).
Wardle et al. (2001) suggested that in water, acute injury and death of organisms exposed to seismic energy depends primarily on two features of the sound source: (1) the received peak pressure and (2) the time required for the pressure to rise and decay. Generally, as received pressure increases, the period for the pressure to rise and decay decreases, and the chance of acute pathological effects increases. According to Buchanan et al. (2004), for the types of seismic airguns and arrays involved with the proposed program, the pathological (mortality) zone for fish would be expected to be within a few meters of the seismic source. Numerous other studies provide examples of no fish mortality upon exposure to seismic sources (Falk and Lawrence 1973; Holliday et al. 1987; La Bella et al. 1996; Santulli et al. 1999; McCauley et al. 2000a,b, 2003; Bjarti 2002; Thomsen 2002; Hassel et al. 2003; Popper et al. 2005; Boeger et al. 2006).
Some studies have reported, some equivocally, that mortality of fish, fish eggs, or larvae can occur close to seismic sources (Kostyuchenko 1973; Dalen and Knutsen 1986; Booman et al. 1996; Dalen et al. 1996). Some of the reports claimed seismic effects from treatments quite different from actual seismic survey sounds or even reasonable surrogates. However, Payne et al. (2009) reported no statistical differences in mortality/morbidity between control and exposed groups of capelin eggs or monkfish larvae. Saetre and Ona (1996) applied a ‘worst-case scenario’ mathematical model to investigate the effects of seismic energy on fish eggs and larvae. They concluded that mortality rates caused by exposure to seismic surveys are so low, as compared to natural mortality rates, that the impact of seismic surveying on recruitment to a fish stock must be regarded as insignificant.
Physiological Effects
Physiological effects refer to cellular and/or biochemical responses of fish to acoustic stress. Such stress potentially could affect fish populations by increasing mortality or reducing reproductive success. Primary and secondary stress responses of fish after exposure to seismic survey sound appear to be temporary in all studies done to date (Sverdrup et al. 1994; Santulli et al. 1999; McCauley et al. 2000a,b). The periods necessary for the biochemical changes to return to normal are variable and depend on numerous aspects of the biology of the species and of the sound stimulus (see Appendix D of the EA).
Behavioral Effects
Behavioral effects include changes in the distribution, migration, mating, and catchability of fish populations. Studies investigating the possible effects of sound (including seismic survey sound) on fish behavior have been conducted on both uncaged and caged individuals (e.g., Chapman and Hawkins 1969; Pearson et al. 1992; Santulli et al. 1999; Wardle et al. 2001; Hassel et al. 2003). Typically, in these studies fish exhibited a sharp “startle” response at the onset of a sound followed by habituation and a return to normal behavior after the sound ceased.
In general, any adverse effects on fish behavior or fisheries attributable to seismic testing may depend on the species in question and the nature of the fishery (season, duration, fishing method). They may also depend on the age of the fish, its motivational state, its size, and numerous other factors that are difficult, if not impossible, to quantify at this point, given such limited data on effects of airguns on fish, particularly under realistic at-sea conditions.
IX. Anticipated Impact on Habitat
L-DEO IHA Application for the CNMI, 2012 Page 48
Effects on Fisheries
It is possible that the Langseth’s streamer may become entangled with fishing gear. L-DEO will employ avoidance tactics as necessary to prevent conflict. It is not expected that L-DEO’s operations will have a significant impact on fisheries in the CNMI. Nonetheless, L-DEO will minimize the potential to have a negative impact on the fisheries by avoiding areas where fishing is actively underway.
There is general concern about potential adverse effects of seismic operations on fisheries, namely a potential reduction in the “catchability” of fish involved in fisheries. Although reduced catch rates have been observed in some marine fisheries during seismic testing, in a number of cases the findings are confounded by other sources of disturbance (Dalen and Raknes 1985; Dalen and Knutsen 1986; Løkkeborg 1991; Skalski et al. 1992; Engås et al. 1996). In other airgun experiments, there was no change in catch per unit effort (CPUE) of fish when airgun pulses were emitted, particularly in the immediate vicinity of the seismic survey (Pickett et al. 1994; La Bella et al. 1996). For some species, reductions in catch may have resulted from a change in behavior of the fish, e.g., a change in vertical or horizontal distribution, as reported in Slotte et al. (2004).
Effects on Invertebrates The existing body of information on the impacts of seismic survey sound on marine invertebrates is
very limited. However, there is some unpublished and very limited evidence of the potential for adverse effects on invertebrates, thereby justifying further discussion and analysis of this issue. The three types of potential effects of exposure to seismic surveys on marine invertebrates are pathological, physiological, and behavioral. Based on the physical structure of their sensory organs, marine invertebrates appear to be specialized to respond to particle displacement components of an impinging sound field and not to the pressure component (Popper et al. 2001; see also Appendix E of the EA).
The only information available on the impacts of seismic surveys on marine invertebrates involves studies of individuals; there have been no studies at the population scale. Thus, available information provides limited insight on possible real-world effects at the regional or ocean scale. The most important aspect of potential impacts concerns how exposure to seismic survey sound ultimately affects invertebrate populations and their viability, including availability to fisheries.
Literature reviews of the effects of seismic and other underwater sound on invertebrates were provided by Moriyasu et al. (2004) and Payne et al. (2008). The following sections provide a synopsis of available information on the effects of exposure to seismic survey sound on species of decapod crustaceans and cephalopods, the two taxonomic groups of invertebrates on which most such studies have been conducted. The available information is from studies with variable degrees of scientific soundness and from anecdotal information. A more detailed review of the literature on the effects of seismic survey sound on invertebrates is provided in Appendix E of the EA.
Pathological Effects
In water, lethal and sub-lethal injury to organisms exposed to seismic survey sound appears to depend on at least two features of the sound source: (1) the received peak pressure, and (2) the time required for the pressure to rise and decay. Generally, as received pressure increases, the period for the pressure to rise and decay decreases, and the chance of acute pathological effects increases. For the type of airgun array planned for the proposed program, the pathological (mortality) zone for crustaceans and cephalopods is expected to be within a few meters of the seismic source, at most; however, very few specific data are available on levels of seismic signals that might damage these animals. This premise is

IX. Anticipated Impact on Habitat
L-DEO IHA Application for the CNMI, 2012 Page 49
based on the peak pressure and rise/decay time characteristics of seismic airgun arrays currently in use around the world.
Some studies have suggested that seismic survey sound has a limited pathological impact on early developmental stages of crustaceans (Pearson et al. 1994; Christian et al. 2003; DFO 2004). However, the impacts appear to be either temporary or insignificant compared to what occurs under natural conditions. Controlled field experiments on adult crustaceans (Christian et al. 2003, 2004; DFO 2004) and adult cephalopods (McCauley et al. 2000a,b) exposed to seismic survey sound have not resulted in any significant pathological impacts on the animals. It has been suggested that giant squid strandings were caused by exposure to commercial seismic survey activities (Guerra et al. 2004), but there was little evidence to support the claim. André et al. (2011) exposed cephalopods, primarily cuttlefish, to continuous 50–400 Hz sinusoidal wave sweeps for two hours while captive in relatively small tanks, and reported morphological and ultrastructural evidence of massive acoustic trauma (i.e., permanent and substantial alterations of statocyst sensory hair cells). The received SPL was reported as 157±5 dB re 1µPa, with peak levels at 175 dB re 1µPa. As in the McCauley et al. (2003) paper on sensory hair cell damage in pink snapper as a result of exposure to seismic sound, the cephalopods were subjected to higher sound levels than they would be under natural conditions, and they were unable to swim away from the sound source.
Physiological Effects
Physiological effects refer mainly to biochemical responses by marine invertebrates to acoustic stress. Such stress potentially could affect invertebrate populations by increasing mortality or reducing reproductive success. Primary and secondary stress responses (i.e., changes in haemolymph levels of enzymes, proteins, etc.) of crustaceans have been noted several days or months after exposure to seismic survey sounds (Payne et al. 2007). The periods necessary for these biochemical changes to return to normal are variable and depend on numerous aspects of the biology of the species and of the sound stimulus.
Behavioral Effects
There is increasing interest in assessing the possible direct and indirect effects of seismic and other sounds on invertebrate behavior, particularly in relation to the consequences for fisheries. Changes in behavior could potentially affect such aspects as reproductive success, distribution, susceptibility to predation, and catchability by fisheries. Studies investigating the possible behavioral effects of exposure to seismic survey sound on crustaceans and cephalopods have been conducted on both uncaged and caged animals. In some cases, invertebrates exhibited startle responses (e.g., squid in McCauley et al. 2000a,b). In other cases, no behavioral impacts were noted (e.g., crustaceans in Christian et al. 2003, 2004; DFO 2004). There have been anecdotal reports of reduced catch rates of shrimp shortly after exposure to seismic surveys; however, other studies have not observed any significant changes in shrimp catch rate (Andriguetto-Filho et al. 2005). Similarly, Parry and Gason (2006) did not find any evidence that lobster catch rates were affected by seismic surveys. Any adverse effects on crustacean and cephalopod behavior or fisheries attributable to seismic survey sound depend on the species in question and the nature of the fishery (season, duration, fishing method).

X. Anticipated Impact of Loss on Habitat
L-DEO IHA Application for the CNMI, 2012 Page 50
X. ANTICIPATED IMPACT OF LOSS OR MODIFICATION OF HABITAT ON MARINE MAMMALS
The anticipated impact of the loss or modification of the habitat on the marine mammal populations involved.
The proposed activity is not expected to have any habitat-related effects that could cause signif-
icant or long-term consequences for individual marine mammals or their populations. However, a small minority of the marine mammals that are present near the proposed activity may be temporarily displaced as much as a few kilometers by the planned activity.
A total of ~85 OBSs will be deployed during the study. Scripps LC4x4 OBSs and WHOI “D2” OBSs will be used. The Scripps OBS has a volume of ~1 m3, with an anchor that consists of a large piece of steel grating (~1 m2
The proposed activity is not expected to have any habitat-related effects that could cause signif-icant or long-term consequences for individual marine mammals or their populations, because operations at the various sites will be limited in duration.
). The WHOI OBS anchor is made of hot-rolled steel and weighs 23 kg; the anchor dimensions are 2.5×30.5×38.1 cm. OBS anchors will be left behind upon equipment recovery. Although OBS placement will disrupt a very small area of seafloor habitat and could disturb benthic invertebrates, the impacts are expected to be localized and transitory.
XI. MITIGATION MEASURES The availability and feasibility (economic and technological) of equipment, methods, and manner of con-ducting such activity or other means of effecting the least practicable adverse impact upon the affected species or stocks, their habitat, and on their availability for subsistence uses, paying particular attention to rookeries, mating grounds, and areas of similar significance.
Marine mammals and sea turtles are known to occur in the proposed study area. To minimize the likelihood that impacts will occur to the species and stocks, airgun operations will be conducted in accordance with the MMPA and the ESA, including obtaining permission for incidental harassment or incidental ‘take’ of marine mammals and other ESA-listed species.
The following subsections provide more detailed information about the mitigation measures that are an integral part of the planned activities. The procedures described here are based on protocols used during previous L-DEO seismic research cruises as approved by NMFS, and on best practices recommended in Richardson et al (1995), Pierson et al. (1998), and Weir and Dolman (2007).
Planning Phase This survey was originally proposed for 2010. U.S. National Environmental Policy Act (NEPA)
documentation was prepared for the proposed survey and was posted for public comment. No public comments were received by NSF in response to the public comment period during that process. Because of ship maintenance issues, weather, and timing constraints of the IHA process, the proposed survey was unable to be supported on the Langseth in 2010 as proposed, and as a result the survey was deferred to a future time when the ship would be able to support the effort. An IHA application was submitted to NMFS for the proposed 2010 survey, however it was withdrawn when it became apparent the ship would not be able to support the survey. An ESA Section 7 consultation request that was also initiated with NMFS was withdrawn.

XI. Mitigation Measures
L-DEO IHA Application for the CNMI, 2012 Page 51
Subsequently, the PIs worked with L-DEO and NSF to identify potential time periods to carry out the survey taking into consideration key factors such as environmental conditions (i.e., the seasonal presence of marine mammals, sea turtles, and seabirds), weather conditions, equipment, and optimal timing for other proposed seismic surveys using the R/V Langseth. Most marine mammal species are expected to occur in the area year-round, so altering the timing of the proposed project likely would result in no net benefits for those species. After considering what energy source level was necessary to achieve the research goals, the PIs determined the use of the 36-airgun array with a total volume of ~6600 in3 would be required. Given the research goals, location of the survey and associated deep water, this energy source level was viewed appropriate. The draft NEPA documentation prepared for the proposed 2010 survey forms the basis for this assessment; however, it has been updated to reflect current scientific information and any revisions to the proposed survey and timing. NEPA documentation for the proposed 2012 survey will also be open for a public comment period, and ESA Section 7 consultation will be requested.
Proposed Exclusion Zones Received sound levels have been predicted by L-DEO, in relation to distance and direction from
the airguns, for the 36-airgun array and for a single 1900LL 40-in3 airgun, which will be used during power downs. Results were recently reported for propagation measurements of pulses from the 36-airgun array in two water depths (~1600 m and 50 m) in the Gulf of Mexico in 2007–2008 (Tolstoy et al. 2009). It would be prudent to use the empirical values that resulted to determine exclusion zones for the airgun array. Results of the propagation measurements showed that radii around the airguns for various received levels varied with water depth (Tolstoy et al. 2009). In addition, propagation varies with array tow depth. The empirical values that resulted from Tolstoy et al. (2009) are used here to determine exclusion zones for the 36-airgun array. However, the depth of the array was different in the Gulf of Mexico calibration study (6 m) than in the proposed survey (9 m); thus, correction factors have been applied to the distances reported by Tolstoy et al. (2009). The correction factors used were the ratios of the 160-, 180-, and 190-dB distances from the modeled results for the 6600-in3 airgun array towed at 6 m vs. 9 m, from LGL (2008): 1.285; 1.338; and 1.364, respectively.
Measurements were not reported for a single airgun, so model results will be used. The L-DEO model does not allow for bottom interactions, and thus is most directly applicable to deep water. A detailed description of the modeling effort is provided in Appendix A of the EA.
Using the corrected measurements (array) or model (single airgun), Table 1 shows the distances at which three rms sound levels are expected to be received from the 36-airgun array and a single airgun. The 180- and 190-dB re 1 μParms distances are the safety criteria as specified by NMFS (2000) and are applicable to cetaceans and pinnipeds, respectively. The 180-dB distance will also be used as the exclus-ion zone for sea turtles, as required by NMFS in most other recent seismic projects (e.g., Smultea et al. 2004; Holst et al. 2005b; Holst and Beland 2008; Holst and Smultea 2008; Hauser et al. 2008). If marine mammals or turtles are detected within or about to enter the appropriate exclusion zone, the airguns will be powered down (or shut down if necessary) immediately.
Detailed recommendations for new science-based noise exposure criteria were published in 2008 (Southall et al. 2007). L-DEO will be prepared to revise its procedures for estimating numbers of mammals “taken”, EZs, etc., as may be required by any new guidelines that result. As yet, NMFS has not specified a new procedure for determining EZs.

XI. Mitigation Measures
L-DEO IHA Application for the CNMI, 2012 Page 52
Mitigation During Operations Mitigation measures that will be adopted during the survey include (1) power-down procedures, (2)
shut-down procedures, and (3) ramp-up procedures.
Power-down Procedures
A power down involves decreasing the number of airguns in use such that the radius of the 180-dB (or 190-dB) zone is decreased to the extent that marine mammals or turtles are no longer in or about to enter the EZ. A power down of the airgun array can also occur when the vessel is moving from one seismic line to another. During a power down for mitigation, one airgun will be operated. The continued operation of one airgun is intended to alert marine mammals and turtles to the presence of the seismic vessel in the area. In contrast, a shut down occurs when all airgun activity is suspended.
If a marine mammal or turtle is detected outside the EZ but is likely to enter the EZ, the airguns will be powered down before the animal is within the EZ. Likewise, if a mammal or turtle is already within the safety zone when first detected, the airguns will be powered down immediately. During a power down of the airgun array, the 40-in3
Following a power down, airgun activity will not resume until the marine mammal or turtle has cleared the safety zone. The animal will be considered to have cleared the safety zone if
airgun will be operated. If a marine mammal or turtle is detected within or near the smaller EZ around that single airgun (Table 1), it will be shut down (see next subsection).
• it is visually observed to have left the EZ, or • it has not been seen within the zone for 15 min in the case of small odontocetes (or pinnipeds), or • it has not been seen within the zone for 30 min in the case of mysticetes and large odontocetes,
including sperm, pygmy sperm, dwarf sperm, and beaked whales, or • the vessel has moved outside the exclusion zone for turtles, e.g., if a turtle is sighted close to the
vessel and the ship speed is 7.4 km/h, it would take the vessel ~8 min to leave the turtle behind. During airgun operations following a shut down whose duration has exceeded the time limits
specified above, the airgun array will be ramped up gradually. Ramp-up procedures are described below.
Shut-down Procedures
The operating airgun(s) will be shut down if a marine mammal or turtle is seen within or approaching the EZ for the single airgun. Shut downs will be implemented if (1) an animal enters the EZ of the single airgun after a power down has been initiated, or (2) an animal is initially seen within the EZ of the single airgun when more than one airgun (typically the full array) is operating. Airgun activity will not resume until the marine mammal or turtle has cleared the safety zone, or until the PSO is confident that the animal has left the vicinity of the vessel. Criteria for judging that the animal has cleared the safety zone will be as described in the preceding subsection.
Considering the conservation status for North Pacific right whales, the airgun(s) will be shut down immediately in the unlikely event that this species is observed, regardless of the distance from the Langseth. Ramp up will only begin if the right whale has not been seen for 30 min.
Ramp-up Procedures
During past R/V Langseth marine geophysical surveys, following an extended power-down period, the seismic source followed ramp-up procedures to return to the full seismic source level. Under a power-down scenario however a single mitigation airgun still would be operating to alert and warn animals of

XI. Mitigation Measures
L-DEO IHA Application for the CNMI, 2012 Page 53
the on-going activity. Further, under these circumstances, ramp-up procedures may unnecessarily extend the length of the survey time needed to collect seismic data. LDEO, NSF and NMFS have discussed this mitigation practice and have concluded that a ramp-up procedure following an extended power down is not necessary. This assessment therefore does not include this practice as part of the monitoring and mitigation plan.
A ramp-up procedure will be followed when the airgun array begins operating after a specified period without airgun operations or when a shut down has exceeded that period. It is proposed that, for the present cruise, this period would be ~8 min. This period is based on the 180-dB radius for the 36-airgun array (940 m) in relation to the minimum planned speed of the Langseth while shooting (7.4 km/h). Similar periods (~8–10 min) were used during previous L-DEO surveys. Ramp up will not occur if a marine mammal or sea turtle has not cleared the safety zone as described earlier. Ramp up will begin with the smallest airgun in the array (40 in3
If the complete EZ has not been visible for at least 30 min prior to the start of operations in either daylight or nighttime, ramp up will not commence unless at least one airgun (40 in
). Airguns will be added in a sequence such that the source level of the array will increase in steps not exceeding 6 dB per 5-min period over a total duration of ~35 min. During ramp up, the PSOs will monitor the EZ, and if marine mammals or turtles are sighted, a power down or shut down will be implemented as though the full array were operational.
3
XII. PLAN OF COOPERATION
or similar) has been operating during the interruption of seismic survey operations. Given these provisions, it is likely that the airgun array will not be ramped up from a complete shut down at night or in thick fog, because the outer part of the safety zone for that array will not be visible during those conditions. If one airgun has operated during a power-down period, ramp up to full power will be permissible at night or in poor visibility, on the assumption that marine mammals and turtles will be alerted to the approaching seismic vessel by the sounds from the single airgun and could move away. Ramp up of the airguns will not be initiated if a sea turtle or marine mammal is sighted within or near the applicable EZs during the day or night.
Where the proposed activity would take place in or near a traditional Arctic subsistence hunting area and/or may affect the availability of a species or stock of marine mammal for Arctic subsistence uses, the applicant must submit either a plan of cooperation or information that identifies what measures have been taken and/or will be taken to minimize any adverse effects on the availability of marine mammals for subsistence uses. A plan must include the following:
(i) A statement that the applicant has notified and provided the affected subsistence community with a draft plan of cooperation;
(ii) A schedule for meeting with the affected subsistence communities to discuss proposed activities and to resolve potential conflicts regarding any aspects of either the operation or the plan of cooperation;
(iii) A description of what measures the applicant has taken and/or will take to ensure that proposed activities will not interfere with subsistence whaling or sealing; and
(iv) What plans the applicant has to continue to meet with the affected communities, both prior to and while conducting activity, to resolve conflicts and to notify the communities of any changes in the operation.
Not applicable. The proposed activity will take place in the CNMI, and no activities will take place in or near a traditional Arctic subsistence hunting area.

XIII. Monitoring and Reporting Plan
L-DEO IHA Application for the CNMI, 2012 Page 54
XIII. MONITORING AND REPORTING PLAN The suggested means of accomplishing the necessary monitoring and reporting that will result in increased knowledge of the species, the level of taking or impacts on populations of marine mammals that are expected to be present while conducting activities and suggested means of minimizing burdens by coordinating such reporting requirements with other schemes already applicable to persons conducting such activity. Monitoring plans should include a description of the survey techniques that would be used to determine the movement and activity of marine mammals near the activity site(s) including migration and other habitat uses, such as feeding...
L-DEO proposes to sponsor marine mammal monitoring during the present project, in order to implement the proposed mitigation measures that require real-time monitoring, and to satisfy the anticip-ated monitoring requirements of the IHA.
L-DEO’s proposed Monitoring Plan is described below. L-DEO understands that this Monitoring Plan will be subject to review by NMFS and that refinements may be required.
The monitoring work described here has been planned as a self-contained project independent of any other related monitoring projects that may be occurring simultaneously in the same regions. L-DEO is prepared to discuss coordination of its monitoring program with any related work that might be done by other groups insofar as this is practical and desirable.
Vessel-based Visual Monitoring Observations by PSOs will take place during daytime airgun operations and nighttime start ups of
the airguns. PSOs will also watch for marine mammals and turtles near the seismic vessel for at least 30 minutes prior to the start of airgun operations after an extended shut down. When feasible, PSOs will also observe during daytime periods when the seismic system is not operating for comparison of sighting rates and behavior with vs. without airgun operations. Based on PSO observations, the airguns will be powered down or shut down when marine mammals or turtles are observed within or about to enter a designated EZ [see § XI above]. The EZ is a region in which a possibility exists of adverse effects on animal hearing or other physical effects.
During seismic operations, at least four visual PSOs will be based aboard the Langseth. PSOs will be appointed by L-DEO with NMFS concurrence. During the majority of seismic operations, two PSOs will monitor for marine mammals and turtles around the seismic vessel. Use of two simultaneous observers will increase the effectiveness of detecting animals around the source vessel. However, during meal times, only one PSO may be on duty. PSO(s) will be on duty in shifts of duration no longer than 4 h. Other crew will also be instructed to assist in detecting marine mammals and turtles and implementing mitigation requirements. Before the start of the seismic survey, the crew will be given additional instruction regarding how to do so.
The Langseth is a suitable platform for marine mammal and turtle observations. When stationed on the observation platform, the eye level will be ~21.5 m above sea level, and the PSO will have a good view around the entire vessel. During daytime, the PSO(s) will scan the area around the vessel system-atically with reticle binoculars (e.g., 7×50 Fujinon), Big-eye binoculars (25×150), and with the naked eye. During darkness, night vision devices (NVDs) will be available (ITT F500 Series Generation 3 binocular-image intensifier or equivalent), when required. Laser rangefinding binoculars (Leica LRF 1200 laser rangefinder or equivalent) will be available to assist with distance estimation. Those are useful in training

XIII. Monitoring and Reporting Plan
L-DEO IHA Application for the CNMI, 2012 Page 55
observers to estimate distances visually, but are generally not useful in measuring distances to animals directly; that is done primarily with the reticles in the binoculars.
Passive Acoustic Monitoring PAM will take place to complement the visual monitoring program. Visual monitoring typically is
not effective during periods of poor visibility or at night, and even with good visibility, is unable to detect marine mammals when they are below the surface or beyond visual range. Acoustical monitoring can be used in addition to visual observations to improve detection, identification, and localization of cetaceans. The acoustic monitoring will serve to alert visual observers (if on duty) when vocalizing cetaceans are detected. It is only useful when marine mammals call, but it can be effective either by day or by night, and does not depend on good visibility. It will be monitored in real time so that the visual observers can be advised when cetaceans are detected.
The PAM system consists of hardware (i.e., hydrophones) and software. The “wet end” of the system consists of a towed hydrophone array that is connected to the vessel by a tow cable. The tow cable is 250 m long, and the hydrophones are fitted in the last 10 m of cable. A depth gauge is attached to the free end of the cable, and the cable is typically towed at depths <20 m. The array will be deployed from a winch located on the back deck. A deck cable will connect the tow cable to the electronics unit in the main computer lab where the acoustic station, signal conditioning, and processing system will be located. The acoustic signals received by the hydrophones are amplified, digitized, and then processed by the Pamguard software. The system can detect marine mammal vocalizations at frequencies up to 250 kHz.
One acoustic PSO or PSAO (Protected Species Acoustic Observer), in addition to the 4 visual PSOs, will be on board. The towed hydrophones will ideally be monitored 24 h per day while at the seismic survey area during airgun operations, and during most periods when the Langseth is underway while the airguns are not operating. However, PAM may not be possible if damage occurs to the array or back-up systems during operations. One PSAO will monitor the acoustic detection system at any one time, by listening to the signals from two channels via headphones and/or speakers and watching the real-time spectrographic display for frequency ranges produced by cetaceans. The PSAO monitoring the acoustical data will be on shift for 1–6 h at a time. All observers are expected to rotate through the PAM position, although the most experienced with acoustics will be on PAM duty more frequently.
When a vocalization is detected while visual observations are in progress, the acoustic PSAO will contact the visual PSO immediately, to alert him/her to the presence of cetaceans (if they have not already been seen), and to allow a power down or shut down to be initiated, if required. The information regarding the call will be entered into a database. The data to be entered include an acoustic encounter identification number, whether it was linked with a visual sighting, date, time when first and last heard and whenever any additional information was recorded, position and water depth when first detected, bearing if determinable, species or species group (e.g., unidentified dolphin, sperm whale), types and nature of sounds heard (e.g., clicks, continuous, sporadic, whistles, creaks, burst pulses, strength of signal, etc.), and any other notable information. The acoustic detection can also be recorded for further analysis.
XIII. Monitoring and Reporting Plan
L-DEO IHA Application for the CNMI, 2012 Page 56
PSO Data and Documentation PSOs will record data to estimate the numbers of marine mammals and turtles exposed to various
received sound levels and to document apparent disturbance reactions or lack thereof. Data will be used to estimate numbers of animals potentially ‘taken’ by harassment (as defined in the MMPA). They will also provide information needed to order a power down or shut down of the airguns when a marine mammal or sea turtle is within or near the EZ.
When a sighting is made, the following information about the sighting will be recorded:
1. Species, group size, age/size/sex categories (if determinable), behavior when first sighted and after initial sighting, heading (if consistent), bearing and distance from seismic vessel, sighting cue, apparent reaction to the airguns or vessel (e.g., none, avoidance, approach, paralleling, etc.), and behavioral pace.
2. Time, location, heading, speed, activity of the vessel, sea state, visibility, and sun glare.
The data listed under (2) will also be recorded at the start and end of each observation watch, and during a watch whenever there is a change in one or more of the variables.
All observations and power downs or shut downs will be recorded in a standardized format. Data will be entered into an electronic database. The accuracy of the data entry will be verified by computer-ized data validity checks as the data are entered and by subsequent manual checking of the database. These procedures will allow initial summaries of data to be prepared during and shortly after the field program, and will facilitate transfer of the data to statistical, graphical, and other programs for further processing and archiving.
Results from the vessel-based observations will provide
1. The basis for real-time mitigation (airgun power down or shut down).
2. Information needed to estimate the number of marine mammals potentially taken by harass-ment, which must be reported to NMFS.
3. Data on the occurrence, distribution, and activities of marine mammals and turtles in the area where the seismic study is conducted.
4. Information to compare the distance and distribution of marine mammals and turtles relative to the source vessel at times with and without seismic activity.
5. Data on the behavior and movement patterns of marine mammals and turtles seen at times with and without seismic activity.
A report will be submitted to NMFS and NSF within 90 days after the end of the cruise. The report will describe the operations that were conducted and sightings of marine mammals and turtles near the operations. The report will provide full documentation of methods, results, and interpretation pertaining to all monitoring. The 90-day report will summarize the dates and locations of seismic operations, and all marine mammal and turtle sightings (dates, times, locations, activities, associated seismic survey activities). The report will also include estimates of the number and nature of exposures that could result in “takes” of marine mammals by harassment or in other ways.

XIV. Coordinating Research
L-DEO IHA Application for the CNMI, 2012 Page 57
XIV. COORDINATING RESEARCH TO REDUCE AND EVALUATE INCIDENTAL TAKE Suggested means of learning of, encouraging, and coordinating research opportunities, plans, and activities relating to reducing such incidental taking and evaluating its effects.
L-DEO and NSF will coordinate the planned marine mammal monitoring program associated with the seismic survey in the CNMI (as summarized in § XI and XIII) with other parties that may have interest in the area and/or be conducting marine mammal studies in the same region during the proposed seismic survey. L-DEO and NSF have coordinated, and will continue to coordinate, with other applicable agencies, and will comply with their requirements. Actions of this type that are underway include (but are not limited to) the following:
• contact Army Corps of Engineers (ACE), to confirm that no permits will be required by ACE for the proposed survey.
• contact CNMI historic preservation office (HPO) regarding the National Historic Preservation Act (NHPA).
• contact the CNMI Coastal Resources Management (CRM) office and submit a Scientific Research Permit application.
• contact U.S. Navy Pacific Fleet Environmental and Geo-Marine Inc. for recent information on cetacean surveys in the area.
XV. LITERATURE CITED
Marine Mammals and Acoustics Acebes, J.M.V., A.L. Bautista, T.K. Yamada, L. Dolar, and F. Perrin. 2005. Stranding of Indopacetus pacificus in
Davao, Philippines. Abstr, 16th
Aguilar, A. 2002. Fin whale Balaenoptera physalus. p. 435-438 In: W.F. Perrin, B. Würsig, and J.G.M. Thewissen (eds.), Encyclopedia of marine mammals. Academic Press, San Diego, CA. 1414 p.
Bienn. Conf. Biol Mar. Mamm., San Diego, CA, 12–16 December 2005.
Aguilar-Soto, N., M. Johnson, P.T. Madsen, P.L. Tyack, A. Bocconcelli, and J.F. Borsani. 2006. Does intense ship noise disrupt foraging in deep-diving Cuvier’s beaked whales (Ziphius cavirostris)? Mar. Mamm. Sci. 22(3):690-699.
Allen, G.M. 1942. Extinct and vanishing mammals of the Western Hemisphere with the marine species of all oceans. Spec. Publ. Am. Comm. Int. Wildl. Protection No.11. 620 p.
Allen, B.M. and R.P. Angliss. 2010. Alaska marine mammal stock assessments, 2009. U.S. Dep. Commer., NOAA Tech. Memo. NMFS-AFSC-206. 276 p.
Archer, F.I. 2002. Striped dolphin Stenella coeruleoalba. p. 1201-1203 In: W.F. Perrin, B. Würsig, and J.G.M. Thewissen (eds.), Encyclopedia of marine mammals. Academic Press, San Diego, CA. 1414 p.
Arnbom, T. and H. Whitehead. 1989. Observations on the composition and behaviour of groups of female sperm whale near the Galápagos Islands. Can. J. Zool. 67(1):1-7.
Au, D.K.W. and W.L. Perryman. 1985. Dolphin habitats in the eastern tropical Pacific. Fish. Bull. 83(4):623-643.
Bain, D.E. and R. Williams. 2006. Long-range effects of airgun noise on marine mammals: responses as a function of received sound level and distance. Working Pap. SC/58/E35. Int. Whal. Comm., Cambridge, U.K. 13 p.

XV. Literature Cited
L-DEO IHA Application for the CNMI, 2012 Page 58
Baird, R.W. 2002. False killer whale. p. 411-412 In: W.F. Perrin, B. Würsig and J.G.M. Thewissen (eds.), Encyclopedia of marine mammals. Academic Press, San Diego, CA. 1414 p.
Baird, R.W., A.D. Ligon, and S.K. Hooker. 2000. Sub-surface and night-time behavior of humpback whales off Maui, Hawaii: a preliminary report. Report prepared under Contract #40ABNC050729 from the Hawaiian Islands Humpback Whale National Marine Sanctuary, Kihei, HI, to the Hawaii Wildlife Fund, Paia, HI.
Baird, R.W., D.L. Webster, D.J. McSweeney, A.D. Ligon, G.S. Schorr, and J. Barlow. 2006. Diving behavior and ecology of Cuvier’s (Ziphius cavirostris) and Blainville’s (Mesoplodon densirostris) beaked whales in Hawaii. Can. J. Zool. 84(8):1120-1128.
Baker, A.N. and A.L. van Helden. 1999. New records of beaked whales, genus Mesoplodon, from New Zealand (Cetacea: Ziphiidae). J. Roy. Soc. New Zealand 29(3):235-244.
Baker, C.S., A. Perry, J.L. Bannister, M.T Weinrich, R.B. Abernethy, J. Calambokidis, J. Lien, R.H. Lambertsen, J. Urbán Ramirez, O. Vasquez, P.J. Clapham, A. Alling, S.J. O'Brien, and S.R. Palumbi. 1993. Abundant mitochondrial DNA variation and world-wide population structure in humpback whales. Proc. Nat. Acad. Sci. USA 90:8239-8243.
Baker, C.S., L. Flórez-González, B. Abernethy, H.C. Rosenbaum, R.W. Slade, J. Capella, and J.L. Bannister. 1998. Mitochondrial DNA variation and maternal gene flow among humpback whales of the Southern Hemisphere. Mar. Mamm. Sci. 14(4):721-737.
Balcomb, K.C., III and D.E. Claridge. 2001. A mass stranding of cetaceans caused by naval sonar in the Bahamas. Bahamas J. Sci. 8(2):2-12.
Banfield, A.W.F. 1974. The mammals of Canada. Univ. Toronto Press, Toronto, Ont. 438 p.
Barkaszi, M.J., D.M. Epperson, and B. Bennett. 2009. Six-year compilation of cetacean sighting data collected during commercial seismic survey mitigation observations throughout the Gulf of Mexico, USA. p. 24-25 In: Abstr. 18th
Barlow, J. and R. Gisiner. 2006. Mitigating, monitoring and assessing the effects of anthropogenic sound on beaked whales. J. Cetac. Res. Manage. 7(3):239-249.
Bienn. Conf. Biol. Mar. Mamm., Québec, Canada, Oct. 2009. 306 p.
Barry, S.B., A.C. Cucknell, and N. Clark. 2010. A direct comparison of bottlenose and common dolphin behaviour during seismic surveys when airguns are and are not being utilized. Abstract In: 2nd
Baumgartner, M.F. 1997. The distribution of Risso’s dolphin (Grampus griseus) with respect to the physiography of the Northern Gulf of Mexico. Mar. Mamm. Sci. 13(4):614-638.
Int. Conf. Effects Noise Aquat. Life, Cork, Ireland, 15–20 August 2010.
Best, P.B. 1979. Social organization in sperm whales, Physeter macrocephalus. p. 227-289 In: H.E. Winn and B.L. Olla (eds.), Behavior of marine animals, Vol. 3. Plenum, New York, NY.
Birkeland, C. 1977. Surrounded by whales. Press Release: Islander, 12 June. p. 13-15.
Braham, H.W. and D.W. Rice. 1984. The right whale, Balaena glacialis. Mar. Fish. Rev. 46(4):38-44.
Brownell, R.L., Jr., P.J. Clapham, T. Miyashita, and T. Kasuya. 2001. Conservation status of North Pacific right whales. J. Cetac. Res. Manage. Spec. Iss. 2:269-286.
Brownell, Jr., R.L.B., K. Ralls, S. Baumann-Pickering, and M.M. Poole. In press. Behavior of melon-headed whales, Peponocephala electra, near oceanic islands. Mar. Mamm. Sci.
Burkhardt, E., O. Boebel, H. Bornemann, and C. Ruholl. 2007. Risk assessment of scientific sonars. Poster Paper, Int. Conf, Effects of Noise on Aquatic Life, 13–17 August 2007, Nyborg, Denmark.
Burkhardt, E., O. Boebel, H. Bornemann, and C. Ruholl. 2008. Risk assessment of scientific sonars. Bioacoustics 17:235-237.

XV. Literature Cited
L-DEO IHA Application for the CNMI, 2012 Page 59
Caballero, S., H. Hamilton, C. Jaramillo, J. Capella, L. Flórez-González, C. Olavarria, H. Rosenbaum, F. Guhl, and C.S. Baker. 2001. Genetic characterisation of the Colombian Pacific coast humpback whale population using RAPD and mitochondrial DNA sequences. Mem. Queensl. Mus. 47(2):459-464.
Calambokidis, J. and S.D. Osmek. 1998. Marine mammal research and mitigation in conjunction with air gun operation for the USGS ‘SHIPS’ seismic surveys in 1998. Rep. from Cascadia Research, Olympia, WA, for U.S. Geol. Surv., Nat. Mar. Fish. Serv., and Minerals Manage. Serv.
Calambokidis, J., G.H. Steiger, J.M. Straley, T. Quinn, L.M. Herman, S. Cerchio, D.R. Salden, M. Yamaguchi, F. Sato, J.R. Urban, J. Jacobsen, O. von Ziegesar, K.C. Balcomb, C.M. Gabriele, M.E. Dahlheim, N. Higashi, S. Uchida, J.K.B. Ford, Y. Miyamura, P. Ladron de Guevara, S.A. Mizroch, L. Schlender, and K. Rasmussen. 1997. Abundance and population structure of humpback whales in the North Pacific basin. Final Contract Report 50ABNF500113 to Southwest Fish. Sci. Center, La Jolla, CA, 92038. 72 p.
Calambokidis, J., G.H. Steiger, J.M. Straley, L.M. Herman, S. Cerchio, D.R. Salden, J. Urbán R., J.K. Jacobsen, O. von Ziegesar, K.C. Balcomb, C.M. Gabrielle, M.E. Dahlheim, S. Uchida, G. Ellis, Y. Miyamura, P.L. de Guevara P., M. Yamaguchi, F. Sato, S.A. Mizroch, L. Schlender, K. Rasmussen, J. Barlow, and T.J. Quinn II. 2001. Movements and population structure of humpback whales in the North Pacific. Mar. Mamm. Sci 17(4):769-794.
Calambokidis, J., T. Chandler, L. Schlender, G.H. Steiger, and A. Douglas. 2003. Research on humpback and blue whales off California, Oregon, and Washington in 2002. Final Rep. from Cascadia Research, Olympia, WA, to Southwest Fish. Sci. Center, La Jolla, CA. 47 p.
Calambokidis, J., E.A. Falcone, T.J. Quinn, A.M Burdin, P.J. Clapham, J.K.B. Ford, C.M. Gabriele, R. LeDuc, D. Mattila, L. Rojas-Bracho, J.M. Straley, B.L. Taylor, J. Urban R., D. Weller, B.H. Witteveen, M. Yamaguchi, A. Bendlin, D. Camacho, K. Flynn, A. Havron, J. Huggins, and N. Maloney. 2008. SPLASH: Structure of populations, levels of abundance and status of humpback whales in the North Pacific. Rep. AB133F-03-RP-0078 for U.S. Dept. of Comm., Seattle, WA.
Caldwell, D.K. and M.C. Caldwell. 1989. Pygmy sperm whale Kogia breviceps (de Blainville, 1838): dwarf sperm whale Kogia simus Owen, 1866. p. 235-260 In: S.H. Ridgway and R. Harrison (eds.), Handbook of marine mammals, Vol. 4: River dolphins and the larger toothed whales. Academic Press, San Diego, CA. 444 p.
Caldwell, J. and W. Dragoset. 2000. A brief overview of seismic air-gun arrays. The Leading Edge 19(8, Aug.):898-902.
Castellote, M., C.W. Clark, and M.O. Lammers. 2010. Acoustic compensation to shipping and airgun noise by Mediterranean fin whales (Balaenoptera physalus). Abstr. In: 2nd
Chou, L.-S. 2004. History of the marine mammal study in Taiwan. p. 129-138 In: S. Akiyama et al. (eds.) Proceedings of the 5
Int. Conf. Effects Noise Aquat. Life, Cork, Ireland, 15–20 August 2010.
th and 6th
Clapham, P.J. 2002. Humpback whale. p. 589-592 In: W.F. Perrin, B. Würsig, and J.G.M. Thewissen (eds.), Encyclopedia of marine mammals. Academic Press, San Diego, CA. 1414 p.
Symposium on Collection Building and Natural History Studies in Asia and the Pacific Rim. National Science Museum Monographs 24:129-138.
Clapham, P.J., C. Good, S.E. Quinn, R.R. Reeves, J.E. Scarff, and R.L. Brownell Jr. 2004. Distribution of North Pacific right whales (Eubalaena japonica) as shown by 19th and 20th
Clark, C.W. and W.T. Ellison. 2004. Potential use of low-frequency sounds by baleen whales for probing the environment: evidence from models and empirical measurements. p. 564-582 In: J.A. Thomas, C.F. Moss, and M. Vater (eds.), Echolocation in bats and dolphins. Univ. Chicago Press, Chicago, IL.
century whaling catch and sighting records. J. Cetac. Res. Manage. 6(1):1-6.
Clark, C.W. and G.C. Gagnon. 2006. Considering the temporal and spatial scales of noise exposures from seismic surveys on baleen whales. Working Pap. SC/58/E9. Int. Whal. Comm., Cambridge, U.K. 9 p.

XV. Literature Cited
L-DEO IHA Application for the CNMI, 2012 Page 60
Cox, T.M., T.J. Ragen, A.J. Read, E. Vos, R.W. Baird, K. Balcomb, J. Barlow, J. Caldwell, T. Cranford, L. Crum, A. D’Amico, G. D’Spain, A. Fernández, J. Finneran, R. Gentry, W. Gerth, F. Gulland, J. Hildebrand, D. Houser, T. Hullar, P.D. Jepson, D. Ketten, C.D. MacLeod, P. Miller, S. Moore, D.C. Mountain, D. Palka, P. Ponganis, S. Rommel, T. Rowles, B. Taylor, P. Tyack, D. Wartzok, R. Gisiner, J. Mead, and L. Benner. 2006. Understanding the impacts of anthropogenic sound on beaked whales. J. Cetac. Res. Manage. 7(3):177-187.
Croll, D.A., A. Acevedo-Gutiérrez, B. Tershy, and J. Urbán-Ramírez. 2001. The diving behavior of blue and fin whales: is dive duration shorter than expected based on oxygen stores? Comp. Biochem. Physiol. 129A:797-809.
Crum, L.A., M.R. Bailey, J. Guan, P.R. Hilmo, S.G. Kargl, and T.J. Matula. 2005. Monitoring bubble growth in supersaturated blood and tissue ex vivo and the relevance to marine mammal bioeffects. Acoustic Res. Lett. Online 6(3):214-220.
Cummings, W.C. 1985. Bryde’s whale Balaenoptera edeni (Anderson, 1878). p. 137-154 In: S.H. Ridgway and R. Harrison (eds.) Handbook of marine mammals, Vol. 3: The sirenians and baleen whales. Academic Press, London, U.K. 362 p.
Dahlheim, M.E. and J.E. Heyning. 1999. Killer whale Orcinus orca (Linnaeus, 1758). p. 281-322 In: S.H. Ridgway and R. Harrison (eds.), Handbook of marine mammals, Vol. 6: The second book of dolphins and the porpoises. Academic Press, San Diego, CA. 486 p.
Dalebout, M.L., G.J.B. Ross, C.S. Baker, R.C. Anderson, P.B. Best, V.G. Cockcroft, H.L. Hinsz, V. Peddemors, and R.L. Pitman. 2003. Appearance, distribution, and genetic distinctiveness of Longman's beaked whale, Indopacetus pacificus. Mar. Mamm. Sci. 19(3):421-461.
Darling, J.D. and S. Cerchio. 1993. Movement of a humpback whale (Megaptera novaeangliae) between Japan and Hawaii. Mar. Mamm. Sci. 9:84-89.
Darling, J.D. and K. Mori. 1993. Recent observations of humpback whales (Megaptera novaeangliae) in Japanese waters off Ogasawara and Okinawa. Can. J. Zool. 71:325-333.
Darling, J.D., J. Calambokidis, K.C. Balcomb, P. Bloedel, K. Flynn, A. Mochizuki, K. Mori, F. Sato, H. Suganuma, and M. Yamaguchi. 1996. Movement of a humpback whale (Megaptera novaeangliae) from Japan to British Columbia and return. Mar. Mamm. Sci. 12(2):281-287.
Davis, R.W., G.S. Fargion, N. May, T.D. Leming, M. Baumgartner, W.E. Evans, L.J. Hansen, and K. Mullin. 1998. Physical habitat of cetaceans along the continental slope in the north-central and western Gulf of Mexico. Mar. Mamm. Sci. 14(3):490-507.
Dietz, R., J. Teilmann, M.P. Jørgensen, and M.V. Jensen. 2002. Satellite tracking of humpback whales in West Greenland. NERI Tech. Rep. No. 411. National Environmental Research Institute, Roskilde, Denmark. 40 p.
Dizon, A.E., S.O. Southern, and W.F. Perrin. 1991. Molecular analuysis of mtDNA typies in exploited populations of spinner dophins (Stenella longirostris). Rep. Int. Whal. Comm. Spec. Iss. 15:355-363.
Dolar, M.L.L. 2002. Fraser’s dolphin Lagenodelphis hosei. p. 485-487 In: W.F. Perrin, B. Würsig, and J.G.M. Thewissen (eds.), Encyclopedia of marine mammals. Academic Press, San Diego, CA. 1414 p.
Dolphin, W.F. 1987. Dive behavior and foraging of humpback shales in Southeast Alaska. Can. J. Zool. 65:354-362.
DoN (U.S. Department of the Navy). 2005. Marine resources assessment for the Marianas Operating Area. Pacific Division, Naval Facilities Engineering Command, Pearl Harbor, Hawaii. Contract No. N62470-02-D-9997, CTO 0027. Prepared by Geo-Marine, Inc., Plano, TX.
Donahue, M.A. and W.L. Perryman. 2002. Pygmy killer whale. p. 1009-1010 In: W.F. Perrin, B. Würsig, and J.G.M. Thewissen (eds.), Encyclopedia of marine mammals. Academic Press, San Diego, CA. 1414 p.

XV. Literature Cited
L-DEO IHA Application for the CNMI, 2012 Page 61
Donaldson, T.J. 1983. Further investigations of the whales Peponocephala electra and Globicephala macro-rhynchus reported from Guam. Micronesica 19(1-2):173-181.
Donoghue, M.F. 1996. New Zealand, progress report on cetacean research, April 1994 to March 1995. Rep. Int. Whal. Comm. 46:265-269.
Donovan, G.P. 1991. A review of IWC stock boundaries. Rep. Int. Whal. Comm. Spec. Iss. 13:39-63.
Duffield, D.A., S.H. Ridgway, and L.H. Cornell. 1983. Hematology distinguishes coastal and offshore forms of dolphins (Tursiops). Can. J. Zool. 61(4):930-933.
Dunn, R.A. and O. Hernandez. 2009. Tracking blue whales in the eastern tropical Pacific with an ocean-bottom seismometer and hydrophone array. J. Acoust. Soc. Am. 126(3):1084-1094.
Eldredge, LG. 1991. Annotated checklist of the marine mammals of Micronesia. Micronesica 24(2):217-230.
Eldredge, L.G. 2003. The marine reptiles and mammals of Guam. Micronesica 35-36:653-660.
Engel, M.H., M.C.C. Marcondes, C.C.A. Martins, F.O. Luna, R.P. Lima, and A. Campos. 2004. Are seismic surveys responsible for cetacean strandings? An unusual mortality of adult humpback whales in Abrolhos Bank, northeastern coast of Brazil. Working Paper SC/56/E28. Int. Whal. Comm., Cambridge, U.K. 8 p.
Evans, W.E. 1994. Common dolphin, white-bellied porpoise Delphinus delphis Linnaeus, 1758. p. 191-224 In: S.H. Ridgway and R. Harrison (eds.), Handbook of marine mammals, Vol. 5: The first book of dolphins. Academic Press, San Diego, CA. 416 p.
Ferguson, M.C. and J. Barlow. 2001. Spatial distribution and density of cetaceans in the eastern tropical Pacific Ocean based on summer/fall research vessel surveys in 1986–96. Admin. Rep. LJ-01-04, Nat. Mar. Fish. Serv., Southwest Fish. Sci. Center, La Jolla, CA. 61 p.
Ferguson, M.C. and J. Barlow. 2003. Addendum: Spatial distribution and density of cetaceans in the eastern tropical Pacific Ocean based on summer/fall research vessel surveys in 1986–96. Admin. Rep. LJ-01-04, Nat. Mar. Fish. Serv., Southwest Fish. Sci. Center, La Jolla, CA. 120 p.
Fernández, A., M. Arbelo, R. Deaville, I.A.P. Patterson, P. Castro, J.R. Baker, E. Degollada, H.M. Ross, P. Herráez, A.M. Pocknell, E. Rodríguez, F.E. Howie, A. Espinosa, R.J. Reid, J.R. Jaber, V. Martin, A.A. Cunningham, and P.D. Jepson. 2004. Pathology: whales, sonar and decompression sickness (reply). Nature 428(6984):1.
Fernández, A., J.F. Edwards, F. Rodriquez, A.E. de los Monteros, P. Herráez, P. Castro, J.R. Jaber, V. Martin, and M. Arbelo. 2005. “Gas and fat embolic syndrome” involving a mass stranding of beaked whales (Family Ziphiidae) exposed to anthropogenic sonar signals. Vet. Pathol. 42(4):446-457.
Finneran, J.J. and C.E. Schlundt. 2004. Effects of intense pure tones on the behavior of trained odontocetes. Tech. Rep. 1913. Space and Naval Warfare (SPAWAR) Systems Center, SSC San Diego, San Diego, CA.
Finneran, J.J., C.E. Schlundt, D.A. Carder, J.A. Clark, J.A. Young, J.B. Gaspin, and S.H. Ridgway. 2000. Auditory and behavioral responses of bottlenose dolphins (Tursiops truncatus) and beluga whale (Delphinapterus leucas) to impulsive sounds resembling distant signatures of underwater explosions. J. Acoust. Soc. Am. 108(1):417-431.
Finneran, J.J., C.E. Schlundt, R. Dear, D.A. Carder, and S.H. Ridgway. 2002. Temporary shift in masked hearing thresholds in odontocetes after exposure to single underwater impulses from a seismic watergun. J. Acoust. Soc. Am. 111(6):2929-2940.
Finneran, J.J., D.A. Carder, C.E. Schlundt, and S.H. Ridgway. 2005. Temporary threshold shift in bottlenose dolphins (Tursiops truncatus) exposed to mid-frequency tones. J. Acoust. Soc. Am. 118(4):2696-2705.
Ford, J.K.B. 2002. Killer whale. p. 669-675 In: W.F. Perrin, B. Würsig, and J.G.M. Thewissen (eds.), Encyclopedia of marine mammals. Academic Press, San Diego, CA. 1414 p.
XV. Literature Cited
L-DEO IHA Application for the CNMI, 2012 Page 62
Frankel, A.S. 2005. Gray whales hear and respond to a 21–25 kHz high-frequency whale-finding sonar. Abstr. 16th
Frantzis, A. 1998. Does acoustic testing strand whales?
Bienn. Conf. Biol. Mar. Mamm., 12–16 Dec. 2005, San Diego, CA.
Nature
Fulling, G.L., P.H. Thorson, and J. Rivers. 2011. Distribution and abundance estimates for cetaceans in the waters off Guam and the Commonwealth of the Northern Mariana Islands. Pac. Sci. 65(3):321-343.
392(6671):29.
Gailey, G., B. Würsig, and T.L. McDonald. 2007. Abundance, behavior, and movement patterns of western gray whales in relation to a 3-D seismic survey, northeast Sakhalin Island, Russia. Environ. Monit. Assess. 134(1-3):75-91. doi: 10.1007/s10661-007-9812-1.
Gambell, R. 1976. World whale stocks. Mamm. Rev. 6:41-53.
Gambell, R. 1985a. Sei whale Balaenoptera borealis Lesson, 1828. p. 155-170 In: S.H. Ridgway and R. Harrison (eds.), Handbook of marine mammals, Vol. 3: The sirenians and baleen whales. Academic Press, London, U.K. 362 p.
Gambell, R. 1985b. Fin whale Balaenoptera physalus (Linnaeus, 1758). p. 171-192 In: S.H. Ridgway and R. Harrison (eds.), Handbook of marine mammals, Vol. 3: The sirenians and baleen whales. Academic Press, London, U.K. 362 p.
Gannier, A. 2000. Distribution of cetaceans off the Society Islands (French Polynesia) as obtained from dedicated surveys. Aquat. Mamm. 26(2):111-126.
Gannier, A. 2002. Cetaceans of the Marquesas Islands (French Polynesia): distribution and relative abundance as obtained from a small boat dedicated survey. Aquat. Mamm. 28(2):198-210.
Garrigue, C., A. Aguayo, V.L.U. Amante-Helweg, C.S. Baker, S. Caballero, P. Clapham, R. Constantine, J. Denkinger, M. Donoghue, L. Flórez-González, J. Greaves, N. Hauser, C. Olavarría, C. Pairoa, H. Peckham, and M. Poole. 2002. Movements of humpback whales in Oceania, South Pacific. J. Cetac. Res. Manage. 4(3):255-260.
Gedamke, J., S. Frydman, and N. Gales. 2008. Risk of baleen whale hearing loss from seismic surveys: preliminary results from simulations accounting for uncertainty and individual variation. Working Pap. SC/60/E9. Int. Whal. Comm., Cambridge, U.K. 10 p.
Gentry, R. (ed.). 2002. Report of the workshop on acoustic resonance as a source of tissue trauma in cetaceans. April 24 and 25, 2002, Silver Spring, MD. 19 p. Accessed in September 2011 at http://www.nmfs.noaa.gov/pr/pdfs/acoustics/cetaceans.pdf.
Gerrodette, T. and J. Pettis. 2005. Responses of tropical cetaceans to an echosounder during research vessel Surveys. p. 104 In: Abstr. 16th
Gilmore, R.M. 1978. Right whale. In: D. Haley (ed.), Marine mammals of eastern North Pacific and arctic waters. Pacific Search Press, Seattle, WA.
Bien. Conf. Biol. Mar. Mamm., 12–16 Dec. 2005, San Diego, CA.
Goold, J.C. 1996a. Acoustic assessment of common dolphins off the west Wales coast, in conjunction with 16th
Goold, J.C. 1996b. Acoustic assessment of populations of common dolphin Delphinus delphis in conjunction with seismic surveying. J. Mar. Biol. Assoc. U.K. 76:811-820.
round seismic surveying. Rep. from School of Ocean Sciences, Univ. Wales, Bangor, Wales, for Chevron UK Ltd, Repsol Explor. (UK) Ltd., and Aran Energy Explor. Ltd. 22 p.
Goold, J.C. 1996c. Acoustic cetacean monitoring off the west Wales coast. Rep. from School of Ocean Sciences, Univ. Wales, Bangor, Wales, for Chevron UK Ltd, Repsol Explor. (UK) Ltd, and Aran Energy Explor. Ltd. 20 p.
Gordon, J., D. Gillespie, J. Potter, A. Frantzis, M.P. Simmonds, R. Swift, and D. Thompson. 2004. A review of the effects of seismic surveys on marine mammals. Mar. Technol. Soc. J. 37(4):16-34.

XV. Literature Cited
L-DEO IHA Application for the CNMI, 2012 Page 63
Gosselin, J.-F. and J. Lawson. 2004. Distribution and abundance indices of marine mammals in the Gully and two adjacent canyons of the Scotian Shelf before and during nearby hydrocarbon seismic exploration programmes in April and July 2003. Res. Doc. 2004/133. Can. Sci. Advis. Secretariat, Fish. Oceans Canada. 24 p. Accessed in Septeber 2011 at http://www.dfo-mpo.gc.ca/csas/Csas/DocREC/2004/RES2004_133_e.pdf.
Greene, C.R., Jr. 1997. Physical acoustics measurements. p. 3-1 to 3-63 In: W.J. Richardson (ed.), Northstar marine mammal monitoring program, 1996: marine mammal and acoustical monitoring of a seismic program in the Alaskan Beaufort Sea. LGL Rep. 2121-2. Rep. from LGL Ltd., King City, Ont., and Greeneridge Sciences Inc., Santa Barbara, CA, for BP Explor. (Alaska) Inc., Anchorage, AK, and Nat. Mar. Fish. Serv., Anchorage, AK, and Silver Spring, MD. 245 p.
Greene, C.R., Jr., N.S. Altman, and W.J. Richardson. 1999a. Bowhead whale calls. p. 6-1 to 6-23 In: W.J. Richardson (ed.), Marine mammal and acoustical monitoring of Western Geophysical’s open-water seismic program in the Alaskan Beaufort Sea, 1998. LGL Rep. TA2230-3. Rep. from LGL Ltd., King City, Ont., and Greeneridge Sciences Inc., Santa Barbara, CA, for Western Geophysical, Houston, TX, and U.S. Nat. Mar. Fish. Serv., Anchorage, AK, and Silver Spring, MD. 390 p.
Greene, C.R., Jr., N.S. Altman, and W.J. Richardson. 1999b. The influence of seismic survey sounds on bowhead whale calling rates. J. Acoust. Soc. Am. 106(4, Pt. 2):2280 (Abstr.).
Gregr, E.J. and A.W. Trites. 2001. Predictions of critical habitat of five whale species in the waters of coastal British Columbia. Can. J. Fish. Aquat. Sci. 58:1265-1285.
Hain, J.H.W., W.A.M. Hyman, R.D. Kenney, and H.E. Winn. 1985. The role of cetaceans in the shelf-edge region of the U.S. Mar. Fish. Rev. 47(1):13-17.
Harris, R.E., T. Elliot, and R.A. Davis. 2007. Results of mitigation and monitoring program, Beaufort Span 2-D marine seismic program, open water season 2006. LGL Rep. TA4319-1. Rep. from LGL Ltd., King City, Ont., for GX Technol., Houston, TX. 48 p.
Harwood, J. and B. Wilson. 2001. The implications of developments on the Atlantic Frontier for marine mammals. Cont. Shelf Res. 21:1073-1093.
Hauser, D.D.W., M. Holst, and V.D. Moulton. 2008. Marine mammal and sea turtle monitoring during Lamont-Doherty Earth Observatory’s marine seismic program in the eastern tropical Pacific, April–August 2008. LGL Rep. TA4656/7-1. Rep. from LGL Ltd., King City., Ont., and St. John’s, Nfld., for Lamont-Doherty Earth Observatory of Columbia Univ., Palisades, NY, and Nat. Mar. Fish. Serv., Silver Spring, MD. 98 p.
Heide-Jørgensen, M.P., D. Bloch, E. Stefansson, B. Mikkelsen, L.H. Ofstad, and R. Dietz. 2002. Diving behaviour of long-finned pilot whales Globicephala melas around the Faroe Islands. Wildl. Biol. 8:307-313.
Herman, L.M., C.S. Baker, P.H. Forestell, and R.C. Antinoja. 1980. Right whale, Balaena glacialis, sightings nears Hawaii: a clue to the wintering grounds? Mar. Ecol. Prog. Ser. 2(4):271-275.
Heyning, J.E. 1989. Cuvier’s beaked whale Ziphius cavirostris G. Cuvier, 1823. p. 289-308 In: S.H. Ridgway and R.J. Harrison (eds.), Handbook of marine mammals, Vol. 4: River dolphins and the larger toothed whales. Academic Press, San Diego, CA. 444 p.
Heyning, J.E. 2002. Cuvier’s beaked whale Ziphius cavirostris. p. 305-307 In: W.F. Perrin, B. Würsig, and J.G.M. Thewissen (eds.), Encyclopedia of marine mammals. Academic Press, San Diego, CA. 1414 p.
Heyning, J.E. and M.E. Dahlheim. 1988. Orcinus orca. Mammal. Spec. 304:1-9. Hildebrand, J.A. 2005. Impacts of anthropogenic sound. p. 101-124 In: J.E. Reynolds, W.F. Perrin, R.R. Reeves,
S. Montgomery, and T. Ragen (eds.), Marine mammal research: conservation beyond crisis. Johns Hopkins Univ. Press, Baltimore, MD. 223 p.
Hoelzel, A.R., C.W. Potter, and P.B. Best. 1998. Genetic differentiation between parapatric ‘nearshore’ and ‘offshore’ populations of the bottlenose dolphin. Proc. R. Soc Lond. B 265:1177-1183.

XV. Literature Cited
L-DEO IHA Application for the CNMI, 2012 Page 64
Hogarth, W.T. 2002. Declaration of William T. Hogarth in opposition to plaintiff’s motion for temporary restrain-ing order, 23 October 2002. Civ. No. 02-05065-JL. U.S. District Court, Northern District of California, San Francisco Div.
Holst, M. 2004. Marine mammal monitoring during Lamont-Doherty Earth Observatory's TAG seismic study in the mid-Atlantic Ocean, October–November 2003. LGL Rep. TA2822-21. Rep. from LGL Ltd., King City, Ont., for Lamont-Doherty Earth Observatory of Columbia Univ., Palisades, NY, and Nat. Mar. Fish. Serv., Silver Spring, MD. 42 p.
Holst, M. and J. Beland. 2008. Marine mammal and sea turtle monitoring during Lamont-Doherty Earth Observatory’s seismic testing and calibration study in the northern Gulf of Mexico, November 2007–February 2008. LGL Rep. TA4295-2. Rep. from LGL Ltd., King City, Ont., for Lamont-Doherty Earth Observatory of Columbia Univ., Palisades, NY, and Nat. Mar. Fish. Serv., Silver Spring, MD. 77 p.
Holst, M. and M.A. Smultea. 2008. Marine mammal and sea turtle monitoring during Lamont-Doherty Earth Observatory’s marine seismic program off Central America, Feburary–April 2008. LGL Rep. TA4342-3. Rep. from LGL Ltd., King City, Ont., for Lamont-Doherty Earth Observatory of Columbia Univ., Palisades, NY, and Nat. Mar. Fish. Serv., Silver Spring, MD. 133 p.
Holst, M., M.A. Smultea, W.R. Koski, and B. Haley. 2005a. Marine mammal and sea turtle monitoring during Lamont-Doherty Earth Observatory’s marine seismic program in the eastern tropical Pacific Ocean off Central America, November–December 2004
Holst, M., M.A. Smultea, W.R. Koski, and B. Haley. 2005b. Marine mammal and sea turtle monitoring during Lamont-Doherty Earth Observatory’s marine seis
. LGL Rep. TA2822-30. Rep. from LGL Ltd., King City, Ont., for Lamont-Doherty Earth Observatory of Columbia Univ., Palisades, NY, and Nat. Mar. Fish. Serv., Silver Spring, MD. 125 p.
mic program off the Northern Yucatán Peninsula in the Southern Gulf of Mexico, January–February 2005
Holst, M., W.J. Richardson, W.R. Koski, M.A. Smultea, B. Haley, M.W. Fitzgerald, and M. Rawson. 2006. Effects of large and small-source seismic surveys on marine mammals and sea turtles. Abstract. Presented at Am. Geophys. Union - Soc. Explor. Geophys. Joint Assembly Environ. Impacts Mar. Geophys. Geol. Studies - Recent Advances from Academic & Industry Res. Progr., Baltimore, MD, May 2006.
. LGL Rep. TA2822-31. Rep. from LGL Ltd., King City, Ont., for Lamont-Doherty Earth Observatory of Columbia Univ., Palisades, NY, and Nat. Mar. Fish. Serv., Silver Spring, MD. 96 p.
Horwood, J. 1987. The sei whale: population biology, ecology, and management. Croom Helm, Beckenham, Kent, U.K. 375 p.
Horwood, J. 2002. Sei whale. p. 1069-1071 In: W.F. Perrin, B. Würsig, and J.G.M. Thewissen (eds.), Encyclo-pedia of marine mammals. Academic Press, San Diego, CA. 1414 p.
Hoyt, E. 2005. Marine protected areas for whales, dolphins and porpoises: a world handbook for cetacean habitat conservation. Earthscan, Sterling, VA.
IAGC. 2004. Further analysis of 2002 Abrolhos Bank, Brazil humpback whale strandings coincident with seismic surveys. Int. Assoc. Geophys. Contr., Houston, TX.
IUCN (The World Conservation Union). 2011. IUCN Red List of Threatened Species. Version 2011.1. Accessed on 14 September 2011 at http://www.iucnredlist.org.
IWC (International Whaling Commission). 2007. Report of the standing working group on environmental concerns. Annex K to Report of the Scientific Committee. J. Cetac. Res. Manage. 9 (Suppl.):227-260.
IWC (International Whaling Commission). 2010. Whale population estimates. Accessed on 14 September at http://www.iwcoffice.org/conservation/estimate.htm.

XV. Literature Cited
L-DEO IHA Application for the CNMI, 2012 Page 65
Jacquet, N. and H. Whitehead. 1996. Scale-dependent correlation of sperm whale distribution with environmental features and productivity in the South Pacific. Mar. Ecol. Prog. Ser. 135(1-3):1-9.
Jefferson, T.A. and N.B. Barros. 1997. Peponocephala electra. Mammal. Spec. 553:1-6.
Jefferson, T.A. and S.K. Hung. 2007. An updated, annotated checklist of the marine mammals of Hong Kong. Mammalia 2007:105-114.
Jefferson, T.A., D. Fertl, M. Michael, and T.D. Fagin. 2006. An unusual encounter with a mixed school of melon-headed whales (Peponocephala electra) and rough-toothed dolphins (Steno bredanensis) at Rota, northern Mariana Islands. Micronesica 38(2):239-244.
Jefferson, T.A., M.A. Webber, and R.L. Pitman. 2008. Marine mammals of the world: a comprehensive guide to their identification. Academic Press, New York. 573 p.
Jepson, P.D., M. Arbelo, R. Deaville, I.A.P. Patterson, P. Castro, J.R. Baker, E. Degollada, H.M. Ross, P. Herráez, A.M. Pocknell, F. Rodríguez, F.E. Howie, A. Espinosa, R.J. Reid, J.R. Jaber, V. Martin, A.A. Cunningham, and A. Fernández. 2003. Gas-bubble lesions in stranded cetaceans. Nature 425(6958):575-576.
Jochens, A., D. Biggs, K. Benoit-Bird, D. Engelhaupt, J. Gordon, C. Hu, N. Jaquet, M. Johnson, R. Leben, B. Mate, P. Miller, J. Ortega-Ortiz, A. Thode, P. Tyack, and B. Würsig. 2008. Sperm whale seismic study in the Gulf of Mexico: synthesis report. OCS Study MMS 2008-006. Rep. from Dep. Oceanogr., Texas A & M Univ., College Station, TX, for U.S. Minerals Manage. Serv., Gulf of Mexico OCS Reg., New Orleans, LA. 341 p.
Johnson, S.R., W.J. Richardson, S.B. Yazvenko, S.A. Blokhin, G. Gailey, M.R. Jenkerson, S.K. Meier, H.R. Melton, M.W. Newcomer, A.S. Perlov, S.A. Rutenko, B. Würsig, C.R. Martin, and D.E. Egging. 2007. A western gray whale mitigation and monitoring program for a 3-D seismic survey, Sakhalin Island, Russia. Environ. Monit. Assess. 134(1-3):1-19. doi: 10.1007/s10661-007-9813-0.
Kami, H.T. and A.J. Hosmer. 1982. Recent beachings of whales on Guam. Micronesica 18:133-135.
Kami, H.T. and R.J. Lujan. 1976. Records of the dwarf sperm whale Kogia simus Owen from Guam. Micronesica 12(2):327-332.
Kanda, N., M. Goto, H. Kato, M.V. McPhee, and L.A. Pastene. 2007. Population genetic structure of Bryde’s whales (Balaenoptera brydei) at the inter-oceanic and trans-equatorial levels. Conserv. Genet. 8:853-864.
Kasuya, T. 1986. Distribution and behavior of Baird's beaked whales off the Pacific coast of Japan. Sci. Rep. Whales Res. Inst. 37:61-83.
Kasuya, T., T. Miyashita, and F. Kasamatsu. 1988. Segregation of two forms of short-finned pilot whales off the Pacific Coast of Japan. Sci. Rep. Whales Res. Inst. Tokyo 39:77-90.
Kato, H. 2002. Bryde’s whales Balaenoptera edeni and B. brydei. p. 171-176 In: W.F. Perrin, B. Würsig, and J.G.M. Thewissen (eds.), Encyclopedia of marine mammals. Academic Press, San Diego, CA. 1414 p.
Kato, H. and W.F. Perrin. 2009. Bryde’s whales Balaenoptera edeni/brydei. p. 158-162 In: W.F. Perrin, B. Würsig and J.G.M. Thewissen (eds.), Encyclopedia of marine mammals, 2nd
Kenney, R.D. and H.E. Winn. 1987. Cetacean biomass densities near submarine canyons compared to adjacent shelf/slope areas. Continent. Shelf Res. 7:107-114.
edit. Academic Press, San Diego, CA. 1316 p.
Ketten, D.R. 1995. Estimates of blast injury and acoustic trauma zones for marine mammals from underwater explosions. p. 391-407 In: R.A. Kastelein, J.A. Thomas, and P.E. Nachtigall (eds.), Sensory systems of aquatic mammals. De Spil Publ., Woerden, Netherlands. 588 p.
Ketten, D.R., J. Lien, and S. Todd. 1993. Blast injury in humpback whale ears: evidence and implications. J. Acoust. Soc. Am. 94(3, Pt. 2):1849-1850.

XV. Literature Cited
L-DEO IHA Application for the CNMI, 2012 Page 66
Klatsky, L.J. 2004. Movement and dive behavior of bottlenose dolphins (Tursiops truncatus) near the Bermuda Pedestal. M.Sc. Thesis. San Diego State University, CA. 31 p.
Klatsky, L., R. Wells, and J. Sweeney. 2005. Bermuda’s deep diving dolphins–movements and dive behavior of offshore bottlenose dolphins in the Northwest Atlantic Ocean near Bermuda. Abstr. 16th
Kremser, U., P. Klemm, and W.D. Kötz. 2005. Estimating the risk of temporary acoustic threshold shift, caused by hydroacoustic devices, in whales in the Southern Ocean. Antarctic Sci. 17(1):3-10.
Bienn. Conf. Biol. Mar. Mamm., San Diego, CA, 12–16 December 2005.
Kruse, S., D.K. Caldwell, and M.C. Caldwell. 1999. Risso’s dolphin Grampus griseus (G. Cuvier, 1812). p. 183-212 In: S.H. Ridgway and R. Harrison (eds.), Handbook of marine mammals, Vol. 6: The second book of dolphins and the porpoises. Academic Press, San Diego, CA. 486 p.
Kryter, K.D. 1985. The effects of noise on man, 2nd
Laurinolli, M.H. and N.A. Cochrane. 2005. Hydroacoustic analysis of marine mammal vocalization data from ocean bottom seismometer mounted hydrophones in the Gully. p. 89-95 In: K. Lee, H. Bain, and G.V. Hurley (eds.), Acoustic monitoring and marine mammal surveys in the Gully and outer Scotian Shelf before and during active seismic surveys. Environ. Stud. Res. Funds Rep. 151. 154 p. Published 2007.
ed. Academic Press, Orlando, FL. 688 p.
Leatherwood, S. and R.R. Reeves. 1983. The Sierra Club handbook of whales and dolphins. Sierra Club, San Francisco, CA. 302 p.
LGL. 2008. Environmental assessment of a marine geophysical survey by the R/V Marcus G. Langseth in Southeast Asia, March–July 2009. LGL Rep. TA4553-1. Rep. from LGL Ltd., King City, Ont., for Lamont-Doherty Earth Observatory of Columbia Univ., Palisades, NY, and National Science Foundation, Arlington, VA. Accessed at http://www.nsf.gov/geo/oce/envcomp/Att1_LGL_Taiger_EA_FINAL_24Oct_ver2.pdf in September 2011.
Ljungblad, D.K., B. Würsig, S.L. Swartz, and J.M. Keene. 1988. Observations on the behavioral responses of bowhead whales (Balaena mysticetus) to active geophysical vessels in the Alaskan Beaufort Sea. Arctic 41(3):183-194.
Lockyer, C.H. and S.G. Brown. 1981. The migration of whales. p. 105-137 In: D.J. Aidley (ed.), Animal migration. Soc. Exp. Biol. Seminar Ser. 13, Cambridge University Press, U.K.
Lucke, K., U. Siebert, P.A. Lepper, and M.-A. Blanchet. 2009. Temporary shift in masked hearing thresholds in a harbor porpoise (Phocoena phocoena) after exposure to seismic airgun stimuli. J. Acoust. Soc. Am. 125(6):4060-4070.
Lusseau, D. and L. Bejder. 2007. The long-term consequences of short-term responses to disturbance experience from whalewatching impact assessment. Int. J. Comp. Psych. 20(2-3):228-236.
MacLean, S.A. and B. Haley. 2004. Marine mammal monitoring during Lamont-Doherty Earth Observatory’s seismic study in the Støregga Slide area of the Norwegian Sea, August–September 2003. LGL Rep. TA2822-20. Rep. from LGL Ltd., King City, Ont., for Lamont-Doherty Earth Observatory of Columbia Univ., Palisades, NY, and Nat. Mar. Fish. Serv., Silver Spring, MD. 59 p.
MacLean, S.A. and W.R. Koski. 2005. Marine mammal monitoring during Lamont-Doherty Earth Observatory’s seismic program in the Gulf of Alaska, August–
MacLeod, C.D. and A. D’Amico. 2006. A review of beaked whale behaviour and ecology in relation to assessing and mitigating impacts of anthropogenic noise. J. Cetac. Res. Manage. 7(3):211-221.
September 2004. LGL Rep. TA2822-28. Rep. from LGL Ltd., King City, Ont., for Lamont-Doherty Earth Observatory of Columbia Univ., Palisades, NY, and Nat. Mar. Fish. Serv., Silver Spring, MD. 102 p.
Madsen, P.T., B. Mohl, B.K. Nielsen, and M. Wahlberg. 2002. Male sperm whale behavior during exposures to distant seismic survey pulses. Aquat. Mamm. 28(3):231-240.

XV. Literature Cited
L-DEO IHA Application for the CNMI, 2012 Page 67
Madsen, P.T., M. Johnson, P.J.O. Miller, N. Aguilar de Soto, J. Lynch, and P.L. Tyack. 2006. Quantitative mea-sures of air gun pulses recorded on sperm whales (Physeter macrocephalus) using acoustic tags during controlled exposure experiments. J. Acoust. Soc. Am. 120(4):2366–2379.
Malakoff, D. 2002. Suit ties whale deaths to research cruise. Science 298(5594):722-723.
Malme, C.I. and P.R. Miles. 1985. Behavioral responses of marine mammals (gray whales) to seismic discharges. p. 253-280 In: G.D. Greene, F.R. Engelhardt and R.J. Paterson (eds.), Proc. Worksh. Effects Explosives Mar. Environ., Jan. 1985, Halifax, N.S. Tech. Rep. 5. Can. Oil & Gas Lands Admin., Environ. Prot. Br., Ottawa, Ont. 398 p.
Malme, C.I., P.R. Miles, C.W. Clark, P. Tyack, and J.E. Bird. 1984. Investigations of the potential effects of underwater noise from petroleum industry activities on migrating gray whale behavior/Phase II: January 1984 migration. BBN Rep. 5586. Rep. from Bolt Beranek & Newman Inc., Cambridge, MA, for U.S. Minerals Manage. Serv., Anchorage, AK. Var. pag. NTIS PB86-218377.
Malme, C.I., P.R. Miles, P. Tyack, C.W. Clark, and J.E. Bird. 1985. Investigation of the potential effects of underwater noise from petroleum industry activities on feeding humpback whale behavior. BBN Rep. 5851; OCS Study MMS 85-0019. Rep. from BBN Labs Inc., Cambridge, MA, for U.S. Minerals Manage. Serv., Anchorage, AK. Var. pag. NTIS PB86-218385.
Malme, C.I., B. Würsig, J.E. Bird, and P. Tyack. 1986. Behavioral responses of gray whales to industrial noise: feeding observations and predictive modeling. Outer Cont. Shelf Environ. Assess. Progr., Final Rep. Princ. Invest., NOAA, Anchorage, AK 56(1988):393-600. BBN Rep. 6265. 600 p. OCS Study MMS 88-0048; NTIS PB88-249008.
Malme, C.I., B. Würsig, J.E. Bird, and P. Tyack. 1988. Observations of feeding gray whale responses to controlled industrial noise exposure. p. 55-73 In: W.M. Sackinger, M.O. Jeffries, J.L. Imm, and S.D. Treacy (eds.), Port and ocean engineering under arctic conditions, Vol. II. Geophys. Inst., Univ. Alaska, Fairbanks, AK. 111 p.
Marsh, H., H. Penrose, C. Eros, and J. Hugues. n.d. Dugong status report and action plans for countries and territories. Early warning and assessment report series. UNEP/DEWA/RS.02-1.
McAlpine, D.F. 2002. Pygmy and dwarf sperm whales Kogia breviceps and K. sima. p. 1007-1009 In: W.F. Perrin, B. Würsig and J.G.M. Thewissen (eds.), Encyclopedia of marine mammals. Academic Press, San Diego, CA. 1414 p.
McAlpine, D.F., L.D. Murison, and E.P. Hoberg. 1997. New records for the pygmy sperm whale, Kogia breviceps (Physeteridae) from Atlantic Canada with notes on diet and parasites. Mar. Mamm. Sci. 13(4):701-704.
McCauley, R.D., M.-N. Jenner, C. Jenner, K.A. McCabe, and J. Murdoch. 1998. The response of humpback whales (Megaptera novaeangliae) to offshore seismic survey noise: preliminary results of observations about a working seismic vessel and experimental exposures. APPEA (Austral. Petrol. Product. Explor. Assoc.) J. 38:692-707.
McCauley, R.D., J. Fewtrell, A.J. Duncan, C. Jenner, M.-N. Jenner, J.D. Penrose, R.I.T. Prince, A. Adhitya, J. Murdoch, and K. McCabe. 2000a. Marine seismic surveys: analysis of airgun signals; and effects of air gun exposure on humpback whales, sea turtles, fishes, and squid. Rep. from Centre for Marine Science and Technology, Curtin Univ., Perth, W.A., for Austral. Petrol. Prod. Assoc., Sydney, N.S.W. 188 p.
McCauley, R.D., J. Fewtrell, A.J. Duncan, M.-N. Jenner, M-N., C. Jenner, R.I.T. Prince, A. Adhitya, K. McCabe, and J. Murdoch. 2000b. Marine seismic surveys–a study of environmental implications. APPEA (Austral. Petrol. Product. Explor. Assoc.) J. 40:692-708.
McDonald, M.A., J.A. Hildebrand, and S.C. Webb. 1995. Blue and fin whales observed on a seafloor array in the Northeast Pacific. J. Acoust. Soc. Am. 98(2 Pt.1):712-721.

XV. Literature Cited
L-DEO IHA Application for the CNMI, 2012 Page 68
Mead, J.G. 1989. Beaked whales of the genus Mesoplodon. p. 349-430 In: S.H. Ridgway and R.J. Harrison (eds.), Handbook of marine mammals, Vol. 4: River dolphins and the larger toothed whales. Academic Press, San Diego, CA. 444 p.
Mead, J.G. and C.W. Potter. 1995. Recognizing two populations of the bottlenose dolphins (Tursiops truncatus) off the Atlantic coast of North America: morphological and ecological considerations. IBI Reports 5:31-44.
Miller, C. 2007. Current state of knowledge of cetacean threats, diversity, and habitats in the Pacific Islands Region. WDCS Australasia Inc. 98 p.
Miller, G.W., R.E. Elliott, W.R. Koski, V.D. Moulton, and W.J. Richardson. 1999. Whales. p. 5-1 to 5-109 In: W.J. Richardson (ed.), Marine mammal and acoustical monitoring of Western Geophysical’s open-water seismic program in the Alaskan Beaufort Sea, 1998. LGL Rep. TA2230-3. Rep. from LGL Ltd., King City, Ont., and Greeneridge Sciences Inc., Santa Barbara, CA, for Western Geophysical, Houston, TX, and U.S. Nat. Mar. Fish. Serv., Anchorage, AK, and Silver Spring, MD. 390 p.
Miller, G.W., V.D. Moulton, R.A. Davis, M. Holst, P. Millman, A. MacGillivray, and D. Hannay. 2005. Monitoring seismic effects on marine mammals—southeastern Beaufort Sea, 2001–2002. p. 511-542 In: S.L. Armsworthy, P.J. Cranford, and K. Lee (eds.), Offshore oil and gas environmental effects monitoring: approaches and technologies. Battelle Press, Columbus, OH. 631 p.
Miller, P.J.O., M.P. Johnson, P.T. Madsen, N. Biassoni, M. Quero, and P.L. Tyack. 2009. Using at-sea experiments to study the effects of airguns on the foraging behavior of sperm whales in the Gulf of Mexico. Deep-Sea Res. I 56(7):1168-1181.
Miyashita, T. 1993. Abundance of dolphin stocks in the western North Pacific taken by the Japanese drive fishery. Rep. Int. Whal. Comm. 43:417-437.
Miyashita, T., T. Kishiro, N. Higash, F. Sato, K. Mori, and H. Kato. 1996. Winter distribution of cetaceans in the western North Pacific inferred from sighting cruises 1993–1995. Rep. Int. Whal. Comm. 46:437-441.
Miyazaki, N. and W.F. Perrin. 1994. Rough-toothed dolphin Steno bredanensis (Lesson, 1828). p. 1-21 In: S.H. Ridgway and R.J. Harrison (eds.), Handbook of marine mammals, Vol. 5: The first book of dolphins. Academic Press, San Diego, CA. 416 p.
Mobley, J.R. Jr., S.W. Martin, D. Fromm, and P. E. Nachtigall. 2007. Lunar influences as possible cause for simultaneous aggregations of melon-headed whales in Hanalei Bay, Kaua’i, and Sasanhaya Bay, Rota. Abstr. 17th
Moore, S.E., J.M. Waite, N.A. Friday, and T. Honkalehto. 2002. Distribution and comparative estimates of cetacean abundance on the central and south-eastern Bering Sea shelf with observations on bathymetric and prey associations. Prog. Oceanogr. 55(1-2):249-262.
Bienn. Meet. Biol. Mar. Mamm., Soc. Mar. Mammal., Cape Town, South Africa.
Mori, K., F. Sato, and A. Mochizuki. 1998. recent observation records onf the northern right whale in the waters of Ogasaw Ara (Bonin Islands), Japan. Abstr. p. 93-94 In: World Mar. Mamm. Sci. Conf., Monaco, January 1998.
Moulton, V.D. and M. Holst. 2010. Effects of seismic survey sound on cetaceans in the Northwest Atlantic. Environ. Stud. Res. Funds Rep. No. 182. St. John’s, Nfld. 28 p.
Moulton, V.D. and G.W. Miller. 2005. Marine mammal monitoring of a seismic survey on the Scotian Slope, 2003. p. 29-40. In: K. Lee, H. Bain, and G.V. Hurley (eds.), Acoustic monitoring and marine mammal surveys in the Gully and outer Scotian Shelf before and during active seismic programs. Env. Stud. Res. Funds Rep. No. 151. 154 p. + xx.
Neumann, D.R. 2001. Seasonal movements of short-beaked common dolphins (Delphinus delphis) in the north-western Bay of Plenty, New Zealand: influence of sea surface temperature and El Niño/La Niña. N.Z. J. Mar. Freshw. Res. 35:371-374.

XV. Literature Cited
L-DEO IHA Application for the CNMI, 2012 Page 69
Nieukirk, S.L., K.M. Stafford, D.K. Mellinger, R.P. Dziak, and C.G. Fox. 2004. Low-frequency whale and seismic airgun sounds recorded in the mid-Atlantic Ocean. J. Acoust. Soc. Am. 115(4):1832-1843.
Nishiwaki, M. 1959. Humpback whales in Ryukyuan waters. Sci. Rep. Whales Res. Inst. Tokyo 14:49-87.
Nishiwaki, M., T. Kasuya, N. Miyazaki, T. Tobayama, and T. Kataoka. 1979. Present distribution of the dugong in the world. Sci. Rep. Whales Res. Inst. 31:133-141.
NMFS (National Marine Fisheries Service). 1991. Recovery plan for the northern right whale (Eubalaena glacialis). Prepared by the Right Whale Recovery Team for Nat. Mar. Fish. Serv., Silver Spring, MD. 86 p.
NMFS (National Marine Fisheries Service). 1995. Small takes of marine mammals incidental to specified activities; offshore seismic activities in southern California. Fed. Regist. 60(200, 17 Oct.):53753-53760.
NMFS (National Marine Fisheries Service). 1998. Recovery plan for the blue whale (Balaenoptera musculus). Prepared by R.R. Reeves, P.J. Clapham, R.L. Brownell, Jr., and G.K. Silber for Nat. Mar. Fish. Serv., Silver Spring, MD. 42 p.
NMFS (National Marine Fisheries Service). 2000. Small takes of marine mammals incidental to specified activities; marine seismic-reflection data collection in southern California/Notice of receipt of application. Fed. Regist. 65(60, 28 Mar.):16374-16379.
NMFS (National Marine Fisheries Service). 2001. Small takes of marine mammals incidental to specified activities; oil and gas exploration drilling activities in the Beaufort Sea/Notice of issuance of an incidental harassment authorization. Fed. Regist. 66(26, 7 Feb.):9291-9298.
NMFS (National Marine Fisheries Service). 2005. Endangered fish and wildlife; notice of intent to prepare an environmental impact statement. Fed. Regist. 70(7, 11 Jan.):1871-1875.
NMFS (National Marine Fisheries Service). 2007. Pacific Islands region marine mammal response network activity update, July–September 2007. Accessed on 8 November 2009 at http://www.fpir.noaa.gov/Library/PRD/Marine%20Mammal%20Response/MMRN%20Newsletter%206%20HT%20final.pdf.
NOAA and USN (National Oceanographic and Atmospheric Administration and U.S. Navy). 2001. Joint interim report: Bahamas marine mammal stranding event of 15–16 March 2000. U.S. Dep. Commer., Nat. Oceanic Atmos. Admin., Nat. Mar. Fish. Serv., Sec. Navy, Assist. Sec. Navy, Installations and Environ. 59 p. Accessed in September 2011 at http://www.nmfs.noaa.gov/pr/pdfs/health/stranding_bahamas2000.pdf.
Nowacek, D.P., L.H. Thorne, D.W. Johnston, and P.L. Tyack. 2007. Responses of cetaceans to anthropogenic noise. Mamm. Rev. 37(2):81-115.
NRC (National Research Council). 2005. Marine mammal populations and ocean noise/Determining when noise causes biologically significant effects. U.S. Nat. Res. Counc., Ocean Studies Board, Committee on Characterizing Biologically Significant Marine Mammal Behavior (Wartzok, D.W., J. Altmann, W. Au, K. Ralls, A. Starfield, and P.L. Tyack). Nat. Acad. Press, Washington, DC. 126 p.
Odell, D.K. and K.M. McClune. 1999. False killer whale Pseudorca crassidens (Owen, 1846). p. 213-243 In: S.H. Ridgway and R. Harrison (eds.), Handbook of marine mammals, Vol. 6: The second book of dolphins and the porpoises. Academic Press, San Diego, CA. 486 p.
Ohizumi, H., T. Matsuishi, and H. Kishino. 2002. Winter sightings of humpback and Bryde’s whales in tropical waters of the western and central and North Pacific. Aquat. Mamm. 28(1):73-77.
Ohsumi, S. and S. Wada. 1974. Status of whale stocks in the North Pacific, 1972. Rep. Int. Whal. Comm. 25:114-126.
Olson, P.A. and S. B. Reilly. 2002. Pilot whales. p. 898-893 In: W.F. Perrin, B. Würsig, and J.G.M. Thewissen (eds.), Encyclopedia of marine mammals. Academic Press, San Diego, CA. 1414 p.

XV. Literature Cited
L-DEO IHA Application for the CNMI, 2012 Page 70
Omura, H. 1986. History of right whale catches in the waters around Japan. Rep. Int. Whal. Comm. Spec. Iss. 10:35-41.
Panigada, S., M. Zanardelli, S. Canese, and M. Jahoda. 1999. Deep diving performances of Mediterranean fin whales. p. 144 In: Abstr., 13th
Papastavrou, V., S.C. Smith, and H. Whitehead. 1989. Diving behaviour of the sperm whale, Physeter macro-cephalus, off the Galápagos Islands. Can. J. Zool. 67(4):839-846.
Bienn. Conf. Biol. Mar. Mamm. 28 November–3 December 1999, Wailea, Maui, HI.
Parente, C.L., M.C.C. Marcondes, and M.H. Engel. 2006. Humpback whale strandings and seismic surveys in Brazil from 1999 to 2004. Working Pap. SC/58/E41. Int. Whal. Comm., Cambridge, U.K. 16 p.
Parsons, E.C.M., M.L. Felley, and L.J. Porter. 1995. An annotated checklist of cetaceans recorded from Hong Kong’s territorial waters. Asian Mar. Biol. 12:79-100.
Perrin, W.F. 2002a. Pantropical spotted dolphin Stenella attenuata. p. 865-867 In: W.F. Perrin, B. Würsig, and J.G.M. Thewissen (eds.), Encyclopedia of marine mammals. Academic Press, San Diego, CA. 1414 p.
Perrin, W.F. 2002b. Common dolphins Delphinus delphis, D. capensis, and D. tropicalis. p. 245-248 In: W.F. Perrin, B. Würsig, and J.G.M. Thewissen (eds.), Encyclopedia of marine mammals. Academic Press, San Diego, CA. 1414 p.
Perrin, W.F. and A.A. Hohn. 1994. Pantropical spotted dolphin Stenella attenuata. p. 71-98 In: S.H. Ridgway and R. Harrison (eds.), Handbook of marine mammals, Vol. 5: The first book of dolphins. Academic Press, San Diego, CA. 416 p.
Perrin, W.F., C.E. Wilson, and F.I. Archer II. 1994a. Striped dolphin Stenella coeruleoalba (Meyen, 1833). p. 129-159 In: S. H. Ridgway and R. J. Harrison (eds.), Handbook of marine mammals, Vol. 5: The first book of dolphins. Academic Press, San Diego, CA. 416 p.
Perrin, W.F., S. Leatherwood, and A. Collet. 1994b. Fraser's dolphin Lagenodelphis hosei Fraser, 1956. p. 225-240 In: S.H. Ridgway and R. Harrison (eds.), Handbook of marine mammals, Vol. 5: The first book of dolphins. Academic Press, San Diego, CA. 416 p.
Perrin, W.F., L.L. Dolar, and D. Robineau. 1999. Spinner dolphins (Stenella longirostris) of the western Pacific and Southeast Asia: pelagic and shallow-water forms. Mar. Mamm. Sci. 15(4):1029-1053.
Perrin, W.F., M.L.L. Dolar, M. Amano, and A. Hayano. 2003. Cranial sexual dimorphism and geographic variation in Fraser’s dolphin, Lagenodelphis hosei. Mar. Mamm. Sci. 19(3):484-501.
Perrin, W.F., R.R. Reeves, M.L.L. Dolar, T.A. Jefferson, H. Marsh, J.Y. Wang, and J. Estacion (eds). 2005. Report of the second workshop on the biology and conservation of small cetaceans and dugongs of south-east Asia. CMS Technical Series Publication No. 9. 161 p.
Perry, S.L., D.P. DeMaster, and G.K. Silber. 1999a. The great whales: history and status of six species listed as endangered under the U.S. Endangered Species Act of 1973. Mar. Fish. Rev. 61(1):7-23.
Perry, S.L., D.P. DeMaster, and G.K. Silber. 1999b. The fin whale. Mar. Fish. Rev. 61(1):44-51.
Perryman, W.L., D.W.K. Au, S. Leatherwood, and T.A. Jefferson. 1994. Melon-headed whale Peponocephala electra Gray, 1846. p. 363-386. In: S.H. Ridgway and R. Harrison (eds.), Handbook of marine mammals, Vol. 5: The first book of dolphins. Academic Press, San Diego, CA. 416 p.
Pierson, M.O., J.P. Wagner, V. Langford, P. Birnie, and M.L. Tasker. 1998. Protection from, and mitigation of, the potential effects of seismic exploration on marine mammals. Chapter 7 In: M.L. Tasker and C. Weir (eds.), Proc. Seismic Mar. Mamm. Worksh., London, 23–25 June 1998.
Pike, G.C. and I.B. MacAskie. 1969. Marine mammals of British Columbia. Bull. Fish. Res. Board Can. 171. 54 p.

XV. Literature Cited
L-DEO IHA Application for the CNMI, 2012 Page 71
Pitman, R.L. 2002. Mesoplodont whales Mesoplodon spp. p. 738-742 In: W.F. Perrin, B. Würsig, and J.G.M. Thewissen (eds.), Encyclopedia of marine mammals. Academic Press, San Diego, CA. 1414 p.
Pitman, R.L., A. Aguayo L., and J. Urbán R. 1987. Observations of an unidentified beaked whale (Mesoplodon sp.) in the eastern tropical Pacific. Mar. Mamm. Sci. 3(4):345-352.
Pitman, R.L., D.M. Palacios, P.L.R. Brennan, B.J. Brennan, K.C. Balcomb, III, and T. Miyashita. 1999. Sightings and possible identity of a bottlenose whale in the tropical Indo-Pacific: Indopacetus pacificus? Mar. Mamm. Sci. 15(2): 513-518.
Potter, J.R., M. Thillet, C. Douglas, M.A. Chitre, Z. Doborzynski, and P.J. Seekings. 2007. Visual and passive acoustic marine mammal observations and high-frequency seismic source characteristics recorded during a seismic survey. IEEE J. Oceanic Eng. 32(2):469-483.
Psarakos, S., D.L. Herzing, and K. Marten. 2003. Mixed-species associations between pantropical spotted dolphins (Stenella attenuata) and Hawaiian spinner dolphins (Stenella longirostris) off Oahu, Hawaii. Aquat. Mamm. 29(3):390-395.
Randall, R.H., R.T. Tsuda, R.S. Jones, M.J. Gawel, J.A. Chase, and R. Rechebei. 1975. Marine biological survey of the Cocos barrier reefs and enclosed lagoon. University of Guam Mar. Lab. Tech. Rep. 17. 160 p.
Reeves, R.R., J.G. Mead, and S. Katona. 1978. The right whale, Eubalaena glacialis, in the western North Atlantic. Rep. Int. Whal. Comm. 28:303-12.
Reeves, R.R., S. Leatherwood, G.S. Stone, and L. G. Eldredge. 1999. Marine mammals in the area served by the South Pacific Regional Environment Programme (SPREP). SPREP, Apia, Samoa. 55 p.
Reeves, R.R., B.S. Stewart, P.J. Clapham, and J.A. Powell. 2002. Guide to marine mammals of the world. Chanticleer Press, New York, NY.
Reilly, S.B. 1990. Seasonal changes in distribution and habitat differences among dolphins in the eastern tropical Pacific. Mar. Ecol. Prog. Ser. 66(1-2):1-11.
Reilly, S.B. and P.C. Fiedler. 1994. Interannual variability of dolphin habitats in the eastern tropical Pacific. I: Research vessel surveys, 1986-1990. Fish. Bull. 92(2):434-450.
Reilly, S.B. and V.G. Thayer. 1990. Blue whale (Balaenoptera musculus) distribution in the eastern tropical Pacific. Mar. Mamm. Sci. 6:265-277.
Rendell, L.E. and J.C.D. Gordon. 1999. Vocal response of long-finned pilot whales (Globicephala melas) to military sonar in the Ligurian Sea. Mar. Mamm. Sci. 15(1):198-204.
Rice, D.W. 1978. The humpback whale in the North Pacific: distribution, exploitation and numbers. p. 29-44 In: K.S. Norris and R.R. Reeves (eds.), Report on a workshop on problems related to humpback whales (Megaptera novaeangliae) in Hawaii. NTIS PB 280 794, U.S. Department of Commerce.
Rice, D.W. 1989. Sperm whale Physeter macrocephalus Linnaeus, 1758. p. 177-233 In: S.H. Ridgway and R. Harrison (eds.), Handbook of marine mammals, Vol. 4: River dolphins and the larger toothed whales. Academic Press, San Diego, CA. 444 p.
Rice, D.W. 1998. Marine mammals of the world, systematics and distribution. Spec. Publ. 4. Soc. Mar. Mammal., Allen Press, Lawrence, KS. 231 p.
Richardson, W.J., B. Würsig, and C.R. Greene. 1986. Reactions of bowhead whales, Balaena mysticetus, to seismic exploration in the Canadian Beaufort Sea. J. Acoust. Soc. Am. 79(4):1117-1128.
Richardson, W.J., R.A. Davis, C.R. Evans, D.K. Ljungblad, and P. Norton. 1987. Summer distribution of bowhead whales, Balaena mysticetus, relative to oil industry activities in the Canadian Beaufort Sea, 1980–84. Arctic 40(2):93-104.

XV. Literature Cited
L-DEO IHA Application for the CNMI, 2012 Page 72
Richardson, W.J., C.R. Greene, Jr., C.I. Malme, and D.H. Thomson. 1995. Marine mammals and noise. Academic Press, San Diego. 576 p.
Richardson, W.J., G.W. Miller, and C.R. Greene, Jr. 1999. Displacement of migrating bowhead whales by sounds from seismic surveys in shallow waters of the Beaufort Sea. J. Acoust. Soc. Am. 106(4, Pt. 2):2281 (Abstract).
Richardson, W.J., M. Holst, W.R. Koski and M. Cummings. 2009. Responses of cetaceans to large-source seismic surveys by Lamont-Doherty Earth Observatory. p. 213 In: Abstr. 18th
Rogers, P. and M. Cox. 1988. Underwater sound as a biological stimulus. p. 131-149 In: J. Atema., R.R. Fay, A.N. Popper, and W.N. Tavolga (eds.), The sensory biology of aquatic animals. Springer-Verlag, New York, NY.
Bienn. Conf. Biol. Mar. Mamm., Québec, Oct. 2009. 306 p.
Ross, G. J.B. and S. Leatherwood. 1994. Pygmy killer whale Feresa attenuata Gray, 1874. p. 387-404 In: S.H. Ridgway and R.J. Harrison (eds.), Handbook of marine mammals, Vol. 5: The first book of dolphins. Academic Press, San Diego, CA. 416 p.
Rowntree, V., J. Darling, G. Silber, and M. Ferrari. 1980. Rare sighting of a right whale (Eubalaena glacialis) in Hawaii. Can. J. Zool. 58(2):308-312.
Rudolph, P. and C. Smeenk. 2002. Indo-West Pacific marine mammals. p. 617-624 In: W.F. Perrin, B. Würsig, and J.G.M. Thewissen (eds.), Encyclopedia of marine mammals. Academic Press, San Diego, CA. 1414 p.
Salden, D.R., L.M. Herman, M. Yamaguchik, and F. Sato. 1999. Mulitple visits of individual humpback whales (Megaptera novaeangliae) between the Hawaiian and Japanese winter grounds. Can. J. Zool. 77:504-508.
Scarff, J.E. 1986. Historic and present distribution of the right whale (Eubalaena glacialis) in the eastern North Pacific south of 50ºN and east of 180ºW. Rep. Int. Whal. Comm. Spec. Iss. 10:43-63.
Scarff, J.E. 1991. Historic distribution and abundance of the right whale (Eubalaena glacialis) in the North Pacific, Bering Sea, Sea of Okhotsk, and Sea of Japan from the Maury Whale Charts. Rep. Int. Whal. Comm. 41:467-489.
Schilling, M.R., I. Selpt, M.T. Weinrich, S.E. Frohock, A.E. Kuhlberg, and P.J. Clapham. 1992. Behavior of individually-identified sei whales Balaenoptera borealis during an episodic influx into the southern Gulf of Maine in 1986. Fish. Bull. 90:749-755.
Schlundt, C.E., J.J. Finneran, D.A. Carder, and S.H. Ridgway. 2000. Temporary shift in masking hearing thresholds of bottlenose dolphins, Tursiops truncatus, and white whales, Delphinapterus leucas, after exposure to intense tones. J. Acoust. Soc. Am. 107(6):3496-3508.
Schulz, J. 1980. Beached whale found in Ipan. Press Release: Pacific Daily News, 7 July, p. 1.
Sergeant, D.E. 1977. Stocks of fin whales Balaenoptera physalus L. in the North Atlantic Ocean. Rep. Int. Whal. Comm. 27:460-473.
Shelden, K.E.W., S.E. Moore, J.M. Waite, P.R. Wade, and D.J. Rugh. 2005. Historic and current habitat use by North Pacific right whales Eubalaena japonica in the Bering Sea and Gulf of Alaska. Mamm. Rev. 35(2):129-155.
Simard, Y., F. Samaran, and N. Roy. 2005. Measurement of whale and seismic sounds in the Scotian Gully and adjacent canyons in July 2003. p. 97-115 In: K. Lee, H. Bain, and C.V. Hurley (eds.), Acoustic monitoring and marine mammal surveys in the Gully and outer Scotian Shelf before and during active seismic surveys. Environ. Stud. Res. Funds Rep. 151. 154 p (Published 2007).
Simmonds, M. P. and L.F. Lopez-Jurado. 1991. Whales and the military. Nature 351(6326):448.

XV. Literature Cited
L-DEO IHA Application for the CNMI, 2012 Page 73
Smith, B.D., G. Braulik, T.A. Jefferson, B.D. Chung, C.T. Vinh, D.V. Du, B.V. Hanh, P.D. Trong, D.T. Ho, and V.V. Quang. 2003. Notes on two cetacean surveys in the Gulf of Tonkin, Vietnam. Raff. Bull. Zool. 51(1):165-171.
Smith, S.D. and H. Whitehead. 1999. Distribution of dolphins in Galápagos waters. Mar. Mamm. Sci. 15(2)550-555.
Smultea, M.A. and M. Holst. 2003. Marine mammal monitoring during Lamont-Doherty Earth Observatory’s seismic study in the Hess Deep area of the eastern Equatorial tropical Pacific, July 2003. LGL Rep. TA2822-16. Rep. from LGL Ltd., King City, Ont., for Lamont-Doherty Earth Observatory of Columbia Univ., Palisades, NY, and Nat. Mar. Fish. Serv., Silver Spring, MD. 68 p.
Smultea, M.A., M. Holst, W.R. Koski, and S. Stoltz. 2004. Marine mammal monitoring during Lamont-Doherty Earth Observatory’s seismic program in the Southeast Caribbean Sea and adjacent Atlantic Ocean, April–June 2004. LGL Rep. TA2822-26. Rep. from LGL Ltd., King City, Ont., for Lamont-Doherty Earth Observatory of Columbia Univ., Palisades, NY, and Nat. Mar. Fish. Serv., Silver Spring, MD. 106 p.
Southall, B.L., A.E. Bowles, W.T. Ellison, J.J. Finneran, R.L. Gentry, C.R. Greene Jr., D. Kastak, D.R. Ketten, J.H. Miller, P.E. Nachtigall, W.J. Richardson, J.A. Thomas, and P.L. Tyack. 2007. Marine mammal noise exposure criteria: initial scientific recommendations. Aquat. Mamm. 33(4):411-522.
SRS-Parsons, GMI, and Bio-Waves. 2007. Marine mammal and sea turtle survey and density estimates for Guam and the Commonwealth of the Northern Mariana Islands. Rep. to Naval Facilities Engineering Command Pacific. Contract No. N68711-02-D-8043, Task Order No. 0036.
Stacey, P.J. and R.W. Baird. 1991. Status of the false killer whale, Pseudorca crassidens, in Canada. Can. Field-Nat. 105(2):189-197.
Stafford, K.M. 2003. Two types of blue whale calls recorded in the Gulf of Alaska. Mar. Mamm. Sci. 19(4):682-693.
Stafford, K.M., S.L. Nieukirk, and C.G. Fox. 1999. Low-frequency whale sounds recorded on hydrophones moored in the eastern tropical Pacific. J. Acoust. Soc. Am. 106(6):3687-3698.
Stafford, K.M., S.L. Nieukirk, and C.G. Fox. 2001. Geographic and seasonal variation of blue whale calls in the North Pacific. J. Cetac. Res. Manage. 3(1):65-76
Stafford, K.M., D.K. Mellinger, S.E. Moore, and C.G. Fox. 2007. Seasonal variability and detection range modeling of baleen whale calls in the Gulf of Alaska, 1999–2002. J. Acoust. Soc. Am. 122(6):3378-3390.
Stewart, B.S. and S. Leatherwood. 1985. Minke whale Balaenoptera acutorostrata Lacépède, 1804. p. 91-136 In: S.H. Ridgway and R. Harrison (eds.), Handbook of marine mammals, Vol. 3: The sirenians and baleen whales. Academic Press, London, U.K. 362 p.
Stockin, K.A., D. Lusseau, V. Binedell, N. Wiseman, and M.B. Orams. 2008. Tourism affects the behavioural budget of the common dolphin Delphinus sp. in the Hauraki Gulf, New Zealand. Mar. Ecol. Prog. Ser. 355:287-295.
Stone, C.J. 2003. The effects of seismic activity on marine mammals in UK waters 1998–2000. JNCC Report 323. Joint Nature Conservancy, Aberdeen, Scotland. 43 p.
Stone, C.J. and M.L. Tasker. 2006. The effects of seismic airguns on cetaceans in U.K. waters. J. Cetac. Res. Manage. 8(3):255-263.
Swartz, S.L., A. Martinez, J. Stamates, C. Burks, and A.A. Mignucci-Giannoni. 2002. Acoustic and visual surveys of cetaceans in the waters of Puerto Rico and the Virgin Islands: February to March 2001. NOAA Tech. Memo. NMFS-SEFSC 463. 62 p.
XV. Literature Cited
L-DEO IHA Application for the CNMI, 2012 Page 74
Tillman, M.F. 1977. Estimates of population size for the North Pacific sei whale. Rep. Int. Whal. Comm. Spec. Iss. 1:98-106.
Tolstoy, M., J. Diebold, L. Doermann, S. Nooner, S.C. Webb, D.R. Bohenstiehl, T.J. Crone, and R.C. Holmes. 2009. Broadband calibration of R/V Marcus G. Langseth four-string seismic sources. Geochem. Geophys. Geosyst., 10, Q08011, doi:10.1029/2009GC002451.
Townsend, C.H. 1935. The distribution of certain whales as shown by logbook records of American whaleships. Zoologica (NY) 19(1-2):1-50+6 maps.
Trianni, M.S. and C.C. Kessler. 2002. Incidence and strandings of the spinner dolphin, Stenella longirostris, in Saipan Lagoon. Micronesica 34(2):249-260.
Tyack, P.L. 2009. Human-generated sound and marine mammals. Phys. Today 62(11, Nov.):39-44.
Tyack, P., M. Johnson, and P. Miller. 2003. Tracking responses of sperm whales to experimental exposures of airguns. p. 115-120 In: A.E. Jochens and D.C. Biggs (eds.), Sperm whale seismic study in the Gulf of Mexico/annual report: Year 1. OCS Study MMS 2003-069. Rep. from Texas A&M Univ., College Station, TX, for U.S. Minerals Manage. Serv., Gulf of Mexico OCS Reg., New Orleans, LA.
Tyack, P.L., M. Johnson, N. Aguilar Soto, A. Sturlese, and P.T. Madsen. 2006. Extreme diving of beaked whales. J. Exp. Biol. 209(21):4238-4253.
Tynan, C.T., D.P. DeMaster, and W.T. Peterson. 2001. Endangered right whales on the southeastern Bering Sea shelf. Science 294(5548):1894.
UNEP-WCMC. 2011.
Urick, R.J. 1983. Principles of underwater sound, 3rd Ed. McGraw-Hill, New York, NY. 423 p.
UNEP-WCMC Species Database: CITES-Listed Species. Appendices I, II and III. Valid from 27 April 2011. Accessed on 14 September 2011 at http://www.cites.org/eng/app/appendices.shtml.
Wada, S. 1973. The ninth memorandum on the stock assessment of whales in the North Pacific. Rep. Int. Whal. Comm. 23:164-169.
Wade, P.R. and T. Gerrodette. 1993. Estimates of cetacean abundance and distribution in the Eastern Tropical Pacific. Rep. Int. Whal. Comm. 43:477-493.
Walker, J.L., C.W. Potter, and S.A. Macko. 1999. The diets of modern and historic bottlenose dolphin populations reflected through stable isotopes. Mar. Mamm. Sci. 15(2):335-350.
Wang, J.Y. and S.-C. Yang. 2006. Unusual cetacean stranding events of Taiwan in 2004 and 2005. J. Cetac. Res. Manage. 8(3):283-292.
Wang, J.Y., L.-S. Chou, C.-J. Yao, A.S. Neimanis, and W.-H. Chou. 1995a. Records of Cuvier’s beaked whales (Ziphius cavirostris) from Taiwan, Republic of China. Asian Mar. Biol. 12:111-118.
Waring, G.T., E. Josephson, C.P. Fairfield-Walsh, and K. Maze-Foley (eds). 2009. U.S. Atlantic and Gulf of Mexico marine mammal stock assessments—2008. NOAA Tech. Memo. NMFS-NE-210. 440 p.
Wartzok, D., A.N. Popper, J. Gordon, and J. Merrill. 2004. Factors affecting the responses of marine mammals to acoustic disturbance. Mar. Technol. Soc. J. 37(4):6-15.
Watkins, W.A. and K.E. Moore. 1982. An underwater acoustic survey for sperm whales (Physeter catodon) and other cetaceans in the southeast Caribbean. Cetology 46:1-7.
Watkins, W.A., K.E. Moore, and P. Tyack. 1985. Sperm whale acoustic behaviors in the southeast Caribbean. Cetology 49:1-15.
Watkins, W.A., M.A. Daher, G.M. Reppucci, J.E. George, D.L. Martin, N.A. DiMarzio, and D.P. Gannon. 2000a. Seasonality and distribution of whale calls in the North Pacific. Oceanography 13:62-67.

XV. Literature Cited
L-DEO IHA Application for the CNMI, 2012 Page 75
Watkins, W.A., J.E. George, M.A. Daher, K. Mullin, D.L. Martin, S.H. Haga, and N.A. DiMarzio. 2000b. Whale call data from the North Pacific, November 1995 through July 1999: occurrence of calling whales and source locations from SOSUS and other acoustic systems. Tech. Rep. WHOI-00-02. Woods Hole Oceanographic Inst., Woods Hole, MA. 160 p.
Weilgart, L.S. 2007. A brief review of known effects of noise on marine mammals. Int. J. Comp. Psychol. 20:159-168.
Weir, C.R. 2008. Overt responses of humpback whales (Megaptera novaeangliae), sperm whales (Physeter macro-cephalus), and Atlantic spotted dolphins (Stenella frontalis) to seismic exploration off Angola. Aquat. Mamm. 34(1):71-83.
Weir, C.R. and S.J. Dolman. 2007. Comparative review of the regional marine mammal mitigation guidelines implemented during industrial seismic surveys, and guidance towards a worldwide standard. J. Int. Wildl. Law Policy 10(1):1-27.
Whitehead, H. 1993. The behavior of mature male sperm whales on the Galápagos breeding grounds. Can. J. Zool. 71(4):689-699.
Whitehead, H. 2002a. Sperm whale Physeter macrocephalus. p. 1165-1172 In: W.F. Perrin, B. Würsig, and J.G.M. Thewissen (eds.), Encyclopedia of marine mammals. Academic Press, San Diego, CA. 1414 p.
Whitehead, H. 2002b. Estimates of the current global population size and historical trajectory for sperm whales. Mar. Ecol. Prog. Ser. 242:295-304.
Whitehead, H. 2003. Sperm whales: social evolution in the ocean. University of Chicago Press, Chicago, IL. 431 p.
Whitehead, H. and S. Waters. 1990. Social organization and population structure of sperm whales off the Galápagos Islands, Ecuador (1985–1987). Rep. Int. Whal. Comm. Spec. Iss. 12:249-257.
Whitehead, H., W.D. Bowen, S.K. Hooker, and S. Gowans. 1998. Marine mammals. p. 186-221 In: W.G. Harrison and D.G. Fenton (eds.), The Gully: a scientific review of its environment and ecosystem. Dep. Fish. Oceans, Ottawa, Ont. Can. Stock Assessm. Secret. Res. Doc. 98/83.
Wieting, D. 2004. Background on development and intended use of criteria. p. 20 In: S. Orenstein, L. Langstaff, L. Manning, and R. Maund (eds.), Advisory Committee on Acoustic Impacts on Marine Mammals, Final Meet. Summary. Second Meet., April 28–30, 2004, Arlington, VA. Sponsored by the Mar. Mamm. Commis., 10 Aug.
Winsor, M.H. and B.R. Mate. 2006. Seismic survey activity and the proximity of satellite tagged sperm whales. Working Pap. SC/58/E16. Int. Whal. Comm., Cambridge, U.K. 8 p.
Würsig, B., S.K. Lynn, T.A. Jefferson, and K.D. Mullin. 1998. Behaviour of cetaceans in the northern Gulf of Mexico relative to survey ships and aircraft. Aquat. Mamm. 24(1):41-50.
Würsig, B.G., D.W. Weller, A.M. Burdin, S.H. Reeve, A.L Bradford, S.A. Blokhin, and R.L Brownell, Jr. 1999. Gray whales summering off Sakhalin Island, Far East Russia: July–October 1997. A joint U.S.-Russian scientific investigation. Final Report. Rep. from Texas A&M Univ., College Station, TX, and Kamchatka Inst. Ecol. & Nature Manage., Russian Acad. Sci., Kamchatka, Russia, for Sakhalin Energy Investment Co. Ltd and Exxon Neftegaz Ltd, Yuzhno-Sakhalinsk, Russia. 101 p.
Yamada, T.K., T. Kakuda, N. Kubo, and M.L. Dalebout. 2004. Kagoshima specimen of Longman’s beaked whale. Proc. 18th
Yang, W.-C., L.-S. Chou, P.D. Jepson, R.L. Brownell, D. Cowan, P.-H. Chang, H.-I. Chiou, C.-J. Yao, T.K. Yamada, J.-T. Chiu, S.-C. Chin, P.-J. Wang, and A. Fernández. 2008. Unusual cetacean mortality event in Taiwan: caused by naval activities? Vet. Rec. 162.
Conf. Europ. Cetac. Soc., Kolmården, Sweden, 28–31 March 2004.

XV. Literature Cited
L-DEO IHA Application for the CNMI, 2012 Page 76
Yazvenko, S.B., T.L. McDonald, S.A. Blokhin, S.R. Johnson, S.K. Meier, H.R. Melton, M.W. Newcomer, R.M. Nielson, V.L. Vladimirov, and P.W. Wainwright. 2007a. Distribution and abundance of western gray whales during a seismic survey near Sakhalin Island, Russia. Environ. Monit. Assess. 134(1-3):45-73. doi: 10.1007/s10661-007-9809-9.
Yazvenko, S.B., T.L. McDonald, S.A. Blokhin, S.R. Johnson, H.R. Melton, and M.W. Newcomer. 2007b. Feeding activity of western gray whales during a seismic survey near Sakhalin Island, Russia. Environ. Monit. Assess. 134(1-3): 93-106. doi: 10.1007/s10661-007-9810-3.
Yochem, P.K. and S. Leatherwood. 1985. Blue whale. p. 193-240 In: S.H. Ridgway and R Harrison (eds.), Hand-book of marine mammals, Vol. 3: The sirenians and baleen whales. Academic Press, New York, NY. 362 p.
Yoder, J.A. 2002. Declaration of James A. Yoder in opposition to plaintiff’s motion for temporary restraining order, 28 October 2002. Civ. No. 02-05065-JL. U.S. District Court, Northern District of California, San Francisco Division.
Zhou, K., S. Leatherwood, and T.A. Jefferson. 1995. Records of small cetaceans in Chinese waters: a review. Asian Mar. Biol. 12:119-139.
Fish, Invertebrates, and Other André, M., M. Solé, M. Lenoir, M. Durfort, C. Quero, A. Mas, A. Lombarte, M van der Schaar, M. López-Bejar, M.
Morell, S. Zaugg, and L. Houégnigan. 2011. Low-frequency sounds induce acoustic trauma in cephalopods. Front. Ecol. Environ. doi:10.1890/100124.
Andriguetto-Filho, J.M., A. Ostrensky, M.R. Pie, U.A. Silva, and W.A. Boeger. 2005. Evaluating the impact of seismic prospecting on artisanal shrimp fisheries. Cont. Shelf. Res. 25:1720-1727.
Bjarti, T. 2002. An experiment on how seismic shooting affects caged fish. Faroese Fisheries Laboratory, University of Aberdeen. 41 p.
Boeger, W.A., M.R. Pie, A. Ostrensky, and M.F. Cardoso. 2006. The effect of exposure to seismic prospecting on coral reef fishes. Braz. J. Oceanog. 54(4): 235-239.
Booman, C., J. Dalen, H. Leivestad, A. Levsen, T. van der Meeren, and K. Toklum. 1996. Effecter av luftkanonshyting på egg, larver og yngel. Fisken og Havet 1996(3):1-83. (Norwegian with English summary).
Buchanan, R.A., J.R. Christian, V.D. Moulton, B. Mactavish, and S. Dufault. 2004. 2004 Laurentian 2-D seismic survey environmental assessment. Rep. from LGL Ltd., St. John’s, Nfld., and Canning & Pitt Associates, Inc., St. John's, Nfld., for ConocoPhillips Canada Resources Corp., Calgary, Alta. 274 p.
Chapman, C.J. and A.D. Hawkins. 1969. The importance of sound in fish behaviour in relation to capture by trawls. FAO Fish. Rep. 62:717-729.
Christian, J.R., A. Mathieu, and R.A. Buchanan. 2004. Chronic effects of seismic energy on snow crab (Chion-oecetes opilio). Environ. Stud. Res. Funds Rep. No. 158, March 2004. Calgary, Alta. 45 p.
Christian, J.R., A. Mathieu, D.H. Thomson, D. White, and R.A. Buchanan. 2003. Effect of seismic energy on snow crab (Chionoecetes opilio). Rep. by LGL Ltd., St. John’s, Nfld.,
Dalen, J. and G.M. Knutsen. 1986. Scaring effects in fish and harmful effects on eggs, larvae and fry by offshore seismic explorations. p. 93-102 In: H.M. Merklinger (ed.), Progress in underwater acoustics. Plenum, NY. 839 p.
for Environ. Stud. Res. Funds (ESRF), Calgary, Alta. 56 p.
Dalen, J. and A. Raknes. 1985. Scaring effects on fish from three dimensional seismic surveys. Inst. Mar. Res. Rep. FO 8504/8505, Bergen, Norway. (In Norwegian, with an English summary).

XV. Literature Cited
L-DEO IHA Application for the CNMI, 2012 Page 77
Dalen, J., E. Ona, A.V. Soldal, and R. Saetre. 1996. Seismiske undersøkelser til havs: en vurdering av konsekvenser for fisk og fiskerier [Seismic investigations at sea; an evaluation of consequences for fish and fisheries]. Fisken og Havet 1996:1-26. (in Norwegian, with an English summary).
DFO (Fisheries and Oceans Canada). 2004. Potential impacts of seismic energy on snow crab. DFO Can. Sci. Advis. Sec. Habitat Status Rep. 2004/003.
DoN (Department of the Navy). 2008. Request for letter of authorization for the incidental harassment of marine mammals resulting from training and research development, testing and evaluation activities conducted within the Mariana Islands Range Complex. Submitted to Office of Protected Resources National Marine Fisheries Service, 1315 East-West Highway Silver Spring, Maryland, 20910-3226. 414 p.
Engås, A, S. Løkkeborg, E. Ona, and A.V. Soldal. 1996. Effects of seismic shooting on local abundance and catch rates of cod (G. morhua) and haddock (M. aeglefinus). Can. J. Fish. Aquat. Sci. 53:2238-2249.
Falk, M.R. and M.J. Lawrence. 1973. Seismic exploration: its nature and effect on fish. Fish. Mar. Serv., Resource Management Branch, Fisheries Operations Directorate: Tech. Rep. CENT-73-9.
Guerra, A., A.F. González, and F. Rocha. 2004. A review of the records of giant squid in the north-eastern Atlantic and severe injuries in Architeuthis dux stranded after acoustic explorations. ICES CM 2004/CC: 29.
Hassel, A., T. Knutsen, J. Dalen, S. Løkkeborg, K. Skaar, Ø. Østensen, E.K. Haugland, M. Fonn, Å. Høines, and O.A. Misund. 2003. Reaction of sandeel to seismic shooting: a field experiment and fishery statistics study. Institute of Marine Research, Bergen, Norway.
Hastings, M.C. and A.N. Popper. 2005. Effects of sound on fish. Prepared for Jones & Stokes, Sacramento, CA, for California Department of Transportation, Sacramento, CA. 28 January.
Holliday, D.V., R.E. Piper, M.E. Clarke, and C.F. Greenlaw. 1987. The effects of airgun energy release on the eggs, larvae, and adults of the northern anchovy (Engraulis mordax). American Petroleum Institute, Washington, DC. Tracer Applied Sciences.
Kostyuchenko, L.P. 1973. Effect of elastic waves generated in marine seismic prospecting on fish eggs on the Black Sea. Hydrobiol. J. 9:45-48.
LaBella, G., C. Froglia, A. Modica, S. Ratti, and G. Rivas. 1996. First assessment of effects of air-gun seismic shooting on marine resources in the central Adriatic Sea. Society of Petroleum Engineers, Inc. International Conference on Health, Safety and Environment, New Orleans, LA, 9–12 June 1996.
Løkkeborg, S. 1991. Effects of geophysical survey on catching success in longline fishing. ICES CM B 40. 9 p.
McCauley, R.D., J. Fewtrell, and A.N. Popper. 2003. High intensity anthropogenic sound damages fish ears. J. Acoust. Soc. Am. 113(1):638-642.
NMFS (National Marine Fisheries Service). 2002. Endangered Species Act Section 7 Consultation Biological Opinion: Authorization of pelagic fisheries under the Fishery Management Plan for pelagic fisheries of the western Pacific Region. Nat. Mar. Fish. Serv., Southwest Region, Pacific Islands Area Office. 365 p.
Parry, G.D. and A. Gason. 2006. The effect of seismic surveys on catch rates of rock lobsters in western Victoria, Australia. Fish. Res. 79:272-284.
Payne, J.F., J. Coady, and D. White. 2009. Potential effects of seismic airgun discharges on monkfish eggs (Lophius americanus) and larvae. Environ. Stud. Res. Funds Rep. No. 170. St. John’s, Nfld. 35 p.
Payne, J.F., C.A. Andrews, L.L. Fancey, A.L. Cook, and J.R. Christian. 2007. Pilot study on the effects of seismic air gun noise on lobster (Homarus americanus). Can. Tech. Rep. Fish. Aquatic Sci. 2712.
Payne, J.F., C. Andrews, L. Fancey, D. White, and J. Christian. 2008. Potential effects of seismic energy on fish and shellfish: An update since 2003. Fisheries and Oceans Canada Science, Canadian Science Advisory Secretariat Research Document 2008/060.

XV. Literature Cited
L-DEO IHA Application for the CNMI, 2012 Page 78
Pearson, W., J. Skalski, S. Sulkin, and C. Malme. 1994. Effects of seismic energy releases on the survival and development of zoeal larvae of Dungeness crab (Cancer magister). Mar. Environ. Res. 38:93-113.
Pearson, W.H., J.R. Skalski, and C.I. Malme. 1992. Effects of sounds from a geophysical survey device on behaviour of captive rockfish (Sebastes spp.). Can. J. Fish. Aquat. Sci. 49(7):1343-1356.
Pickett, G.D., D.R. Eaton, R.M.H. Seaby, and G.P. Arnold. 1994. Results of bass tagging in Poole Bay during 1992. Lab. Leafl. 74, MAFF Direct. Fish. Res., Lowestoft, U.K. 12 p.
Popper, A.N. 2005. A review of hearing by sturgeon and lamprey. Report by A.N. Popper, Environmental BioAcoustics, LLC, Rockville, MD, for U.S. Army Corps of Engineers, Portland District.
Popper, A.N., M. Salmon, and K.W. Horch. 2001. Acoustic detection and communication by decapod crustaceans. J. Comp. Physiol. A 187:83-89.
Popper, A.N., M.E. Smith, P.A. Cott, B.W. Hanna, A.O. MacGilvray, M.E. Austin, and D.A. Mann. 2005. Effects of exposure to seismic air gun use on hearing of three fish species. J. Acoust. Soc. Am. 117(6):3958-3971.
Saetre, R. and E. Ona. 1996. Seismike undersøkelser og på fiskeegg og -larver en vurdering av mulige effecter pa bestandsniva. [Seismic investigations and damages on fish eggs and larvae; an evaluation of possible effects on stock level]. Fisken og Havet 1996:1-17, 1-8. (In Norwegian, with an English summary).
Santulli, La A., A. Modica, C. Messina, L. Ceffa, A. Curatolo, G. Rivas, G. Fabi, and V. D'Amelio. 1999. Biochemical responses of European sea bass (Dicentrarchus labrax L.) to the stress induced by off shore experimental seismic prospecting. Mar. Pollut. Bull. 38:1105-1114.
Skalski, J.R., W.H. Pearson, and C.I. Malme. 1992. Effects of sounds from a geophysical survey device on catch-per-unit-effort in a hook-and-line fishery for rockfish (Sebastes spp.). Can. J. Fish. Aquat. Sci. 49:1357-1365.
Slotte, A., K. Hansen, J. Dalen, and E. Ona. 2004. Acoustic mapping of pelagic fish distribution and abundance in relation to a seismic shooting area off the Norwegian west coast. Fish. Res. 67:143-150.
Sverdrup, A., E. Kjellsby, P.G. Krüger, R. Fløysand, F.R. Knudsen, P.S. Enger, G. Serck-Hanssen, and K.B. Helle. 1994. Effects of experimental seismic shock on vasoactivity of arteries, integrity of the vascular endothelium and on primary stress hormones of the Atlantic salmon. J. Fish Biol. 45:973-995.
Thomsen, B. 2002. An experiment on how seismic shooting affects caged fish. Thesis, Faroese Fisheries Laboratory, University of Aberdeen, Aberdeen, Scotland. 16 August.
Wardle, C.S., T.J. Carter, G.G. Urquhart, A.D.F. Johnstone, A.M. Ziolkowski, G. Hampson, and D. Mackie. 2001. Effects of seismic air guns on marine fish. Cont. Shelf Res. 21(8-10):1005-1027.