IGC Newsletter V - Indira Gandhi Centre for Atomic Research · 2018-10-23 · IGC Newsletter INDIRA...
28
IGCNewsletter INDIRA GANDHI CENTRE FOR ATOMIC RESEARCH http://www.igcar.gov.in/lis/nl117/igc117.pdf Technical Articles • Replacement of Safety Control Plate Drive Mechanisms of KAMINI Reactor • Study on the Kinetics of Catalytic Hydrogenation of U(VI) in Nitric Acid Solution using a Bubble Reactor • Development of Welding and Ultrasonic Examination Procedures for Dissimilar Metal Welding between 10%Cr Steel and Alloy 617M Welded Rotor of Indian Advanced Ultra Super Critical Thermal Power Plant Young Officer’s Forum • Nature of Binary Uranium Intermetallic Compounds at Extreme Conditions Young Researcher’s Forum • Quantum State Engineering of Cavity Fields Conference and Meeting Highlights • Research Scholars Meet on Materials Science and Engineering of Nuclear Materials • Metal Fuel Pin Fabrication Facility (MFFF) - Dedicated to the Nation by Shri Ram Nath Kovind, Honourable President of India • Dr. Baldev Raj Memorial Bridge Course on Non-Destructive Evaluation and Quality Assurance (BRM-BCNQ) News and Events HBNI-IGCAR Corner Awards & Honours ISSN 0972-5741 Volume 117 July 2018
Transcript of IGC Newsletter V - Indira Gandhi Centre for Atomic Research · 2018-10-23 · IGC Newsletter INDIRA...

IGCNewsletter
INDIRA GANDHI CENTRE FOR ATOMIC RESEARCHhttp://www.igcar.gov.in/lis/nl117/igc117.pdf
Technical Articles• Replacement of Safety Control Plate Drive Mechanisms of
KAMINI Reactor• Study on the Kinetics of Catalytic Hydrogenation of U(VI) in
Nitric Acid Solution using a Bubble Reactor• Development of Welding and Ultrasonic Examination
Procedures for Dissimilar Metal Welding between 10%Cr Steel and Alloy 617M Welded Rotor of Indian Advanced Ultra Super Critical Thermal Power Plant
Young Officer’s Forum• Nature of Binary Uranium Intermetallic Compounds at Extreme
Conditions
Young Researcher’s Forum• Quantum State Engineering of Cavity Fields
Conference and Meeting Highlights• Research Scholars Meet on Materials Science and
Engineering of Nuclear Materials• Metal Fuel Pin Fabrication Facility (MFFF) - Dedicated to the
Nation by Shri Ram Nath Kovind, Honourable President of India• Dr. Baldev Raj Memorial Bridge Course on Non-Destructive
Evaluation and Quality Assurance (BRM-BCNQ)
News and Events
HBNI-IGCAR Corner
Awards & Honours
ISSN 0972-5741 Volume 117 July 2018

From the Editor
From the Editorial CommitteeDear Reader It is our pleasant privilege to forward a copy of the latest issue of IGC Newsletter (Volume 117, July 2018 issue).
In the special technical article K. Bhanumurthy and colleagues from Reactor Facilities Group have shared their experience on Replacement of Safety Control Plate Drive Mechanisms of KAMINI Reactor.
In the first technical article Remya Murali and colleagues from Reprocessing Group have discussed about the study on the Kinetics of Catalytic Hydrogenation of U(VI) in Nitric Acid Solution using a Bubble Reactor.
In the second technical article Harish Chandra Dey and colleagues from Metallurgy and Materials Group have discussed about the Development of Welding and Ultrasonic Examination Procedures for Dissimilar Metal Welding between 10%Cr Steel and Alloy 617M Welded Rotor of Indian Advanced Ultra Super Critical Thermal Power Plant.
This issue’s Young Officer’s Forum features an article by Dr. Balmukund Shukla from Materials Science Group of IGCAR discussing about the Nature of Binary Uranium Intermetallic Compounds at Extreme Conditions.
Shri Nilakantha Meher has described about Quantum State Engineering of Cavity Fields in the Young Researcher’s Forum.
We are happy to share with you the awards, honours and distinctions earned by our colleagues.
We look forward to your comments, continued guidance and support.
With best wishes and personal regards
Editorial Committee, IGC Newsletter
IGC Newsletter
1
IGC NewsletterTechnical Article
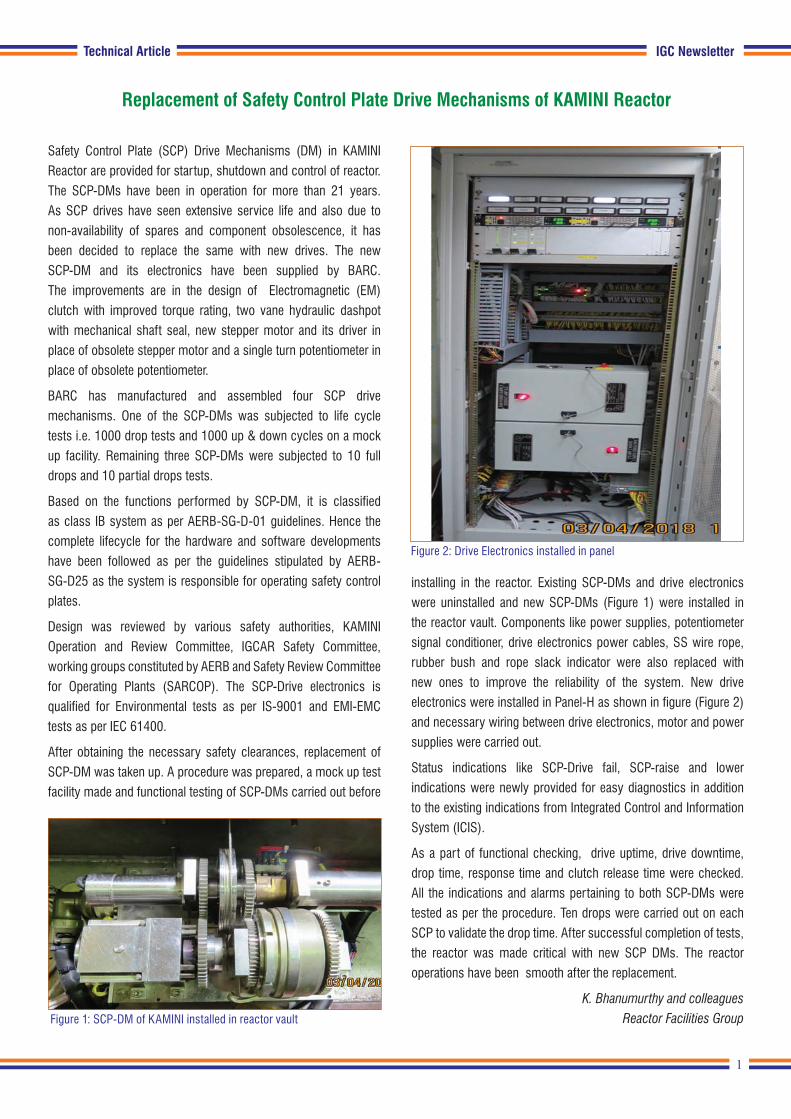
installing in the reactor. Existing SCP-DMs and drive electronics
were uninstalled and new SCP-DMs (Figure 1) were installed in
the reactor vault. Components like power supplies, potentiometer
signal conditioner, drive electronics power cables, SS wire rope,
rubber bush and rope slack indicator were also replaced with
new ones to improve the reliability of the system. New drive
electronics were installed in Panel-H as shown in figure (Figure 2)
and necessary wiring between drive electronics, motor and power
supplies were carried out.
Status indications like SCP-Drive fail, SCP-raise and lower
indications were newly provided for easy diagnostics in addition
to the existing indications from Integrated Control and Information
System (ICIS).
As a part of functional checking, drive uptime, drive downtime,
drop time, response time and clutch release time were checked.
All the indications and alarms pertaining to both SCP-DMs were
tested as per the procedure. Ten drops were carried out on each
SCP to validate the drop time. After successful completion of tests,
the reactor was made critical with new SCP DMs. The reactor
operations have been smooth after the replacement.
K. Bhanumurthy and colleagues
Reactor Facilities Group
Safety Control Plate (SCP) Drive Mechanisms (DM) in KAMINI
Reactor are provided for startup, shutdown and control of reactor.
The SCP-DMs have been in operation for more than 21 years.
As SCP drives have seen extensive service life and also due to
non-availability of spares and component obsolescence, it has
been decided to replace the same with new drives. The new
SCP-DM and its electronics have been supplied by BARC.
The improvements are in the design of Electromagnetic (EM)
clutch with improved torque rating, two vane hydraulic dashpot
with mechanical shaft seal, new stepper motor and its driver in
place of obsolete stepper motor and a single turn potentiometer in
place of obsolete potentiometer.
BARC has manufactured and assembled four SCP drive
mechanisms. One of the SCP-DMs was subjected to life cycle
tests i.e. 1000 drop tests and 1000 up & down cycles on a mock
up facility. Remaining three SCP-DMs were subjected to 10 full
drops and 10 partial drops tests.
Based on the functions performed by SCP-DM, it is classified
as class IB system as per AERB-SG-D-01 guidelines. Hence the
complete lifecycle for the hardware and software developments
have been followed as per the guidelines stipulated by AERB-
SG-D25 as the system is responsible for operating safety control
plates.
Design was reviewed by various safety authorities, KAMINI
Operation and Review Committee, IGCAR Safety Committee,
working groups constituted by AERB and Safety Review Committee
for Operating Plants (SARCOP). The SCP-Drive electronics is
qualified for Environmental tests as per IS-9001 and EMI-EMC
tests as per IEC 61400.
After obtaining the necessary safety clearances, replacement of
SCP-DM was taken up. A procedure was prepared, a mock up test
facility made and functional testing of SCP-DMs carried out before
Replacement of Safety Control Plate Drive Mechanisms of KAMINI Reactor
Figure 1: SCP-DM of KAMINI installed in reactor vault
Figure 2: Drive Electronics installed in panel

2
IGC Newsletter
comprehensive information on its kinetics. The usual data reported
so far are conversion obtainable under different process conditions
with different catalysts in different solution media. For the design
of any process equipment, it is important to know the diffusion
characteristics, reaction kinetics and the extent of back-mixing
in the system. Hence, it was thought important to undertake a
systematic investigation on the kinetics of hydrogenation of U(VI)
for the production of U(IV).
The objective of this study was to understand the mechanisms of
catalytic reduction of U(VI) with hydrogen and hydrazine using 2%
Pt catalyst loaded on silica in semi-batch slurry reactor (bubble
column reactor).The main objectives were to determine (1)
mechanism of reaction (2) intrinsic kinetics of hydrogenation of
U(VI) using 2% Pt catalyst loaded on silica in semi-batch slurry
reactor and (3) mathematical model for the performance of semi-
batch reactor under isothermal and atmospheric pressure. Such
information will provide the starting basis for further development
and optimization of U(VI) catalytic reduction reactor for pilot plant
or commercial scale operations.
A cylindrical glass reactor (Figure 1) was used for the catalytic
reduction experiment, with provision for sparging H2 gas into the
solution (uranyl nitrate-hydrazine) of the reactor. Feed solution
containing required concentration of uranium, nitric acid and
hydrazine were charged into reaction vessel and to this 2%
In the aqueous reprocessing of spent nuclear fuels by PUREX
process, uranium and plutonium are co-extracted by tributyl
phosphate leaving the fission products in the raffinate phase.
Further, separation of plutonium and uranium from each other
is achieved by selectively reducing the plutonium [Pu(IV)]
to poorly extractable [Pu (III)] by means of a reducing agent.
Among the various reductants, uranous [U(IV)] ion is widely
employed as a reducing agent for U/Pu partitioning (separation)
in the contemporary salt free nuclear fuel reprocessing flowsheet.
In the Indian reprocessing plants, [U(IV)] is produced by
electrochemical reduction of U(VI) using Pt/titanium electrodes
with hydrazine nitrate as a stabilizing/holding agent for uranous
ions. Hydrazine nitrate acts as a scavenger of the nitrous acid
which is produced in-situ by autocatalytic decomposition of nitric
acid and re-oxidizes of U(IV) to U(VI). The major drawback of
the electrochemical method is its limited conversion efficiency
(50-60%) which results in increased uranium processing load.
Other disadvantages include slow kinetics, frequent recoating of
electrode and secondary waste generation during decontamination
of electrode. Other reported methods include reduction of U(VI)
with hydrogen, formic acid and hydrazine in the presence of
platinum catalyst loaded on alumina/silica substrates.
Considerable amount of work is available in the published literature
dealing with catalytic reduction of U(VI). However there is a lack of
Study on the Kinetics of Catalytic Hydrogenation of U(VI) in Nitric Acid Solution using a Bubble Reactor
Figure 1: Experimental setup made of glass
Figure 2: Concentration versus time plot representing the reproducibility of experimental data
Technical Article

3
IGC NewsletterTechnical Article
platinum loaded on silica was added. Sampling was done at
regular intervals to estimate the U(IV) generation and variation in
acidity as well as hydrazine concentrations. The effects of different
operating conditions like catalyst loading (C:U ratio from 1:75 to
1:200), nitric acid concentration (1-2M), hydrazine concentration
(0.25-0.75 M) and hydrogen flow rate (5-22 lph) on the process
were studied in detail. All the experiments were conducted at
atmospheric pressure and room temperature. Reproducibility of
the experimental data measurement was found to be within 6% as
indicated by few repeated experiments (Figure 2).
Reaction stoichiometry
In the catalytic hydrogenation process, U(VI) is chemically reduced
to lower valence state i.e. U(IV) which results from the following
two reactions:
i. Catalytic reduction of U(VI) by hydrogen
ii. Indirect catalytic reduction of U(VI) by hydrazine
The major fraction of U(VI) reduction is caused by hydrogen.
Hydrazine reduces U(VI) much more slowly than does hydrogen.
Hence, as a reactant, it is not considered in the development of
kinetic rate expression as our experimental data confirmed that the
rate of reduction using only hydrazine is very slow. Moreover, it is
common to add hydrazine only as a holding reductant to prevent
U(IV) re-oxidation by nitrous acid, which is likely to be produced
during the hydrogenation process. Following reactions take place
during the hydrogenation process:
(1)
(2)
The rate of reaction (1) increases with an increase in the pressure
of hydrogen and with the catalyst loading. Therefore, in industrial
conditions, hydrogen is used at fairly high pressure (typically about
40 atm.) and the platinum is deposited on silica grains, in order to
meet both high catalytic activities and good hydraulic properties.
The rate of the reaction also increases with temperature, but
cannot be operated at temperatures significantly higher than room
temperature, as at high temperature another reaction occurs; the
catalytic reduction of nitric acid by hydrogen, according to the
following equation
(3)
Kinetic Model of the Reaction
Hydrogenation of U(VI) is a heterogeneous catalytic reaction
involving gas-liquid-solid phases. Various steps occur in the
series when a gas-liquid-solid reaction occurs such as diffusion,
adsorption, surface reactions and desorption of the products. The
following assumptions were made while studying the catalytic
hydrogenation of U(VI):
1. The catalyst activity is assumed to be constant during the
experimental runs, i.e., no poisoning or the deactivation of the
catalyst occurs.
2. Desorption of the products offered no resistance to mass
Table 1: Kinetic models for different controlling mechanisms
Model No
Controlling Mechanism
Rate Model
Dissolved hydrogen directly reacts with adsorbed reactant A and B on catalyst surface
IAdsorption of A controlling
( )BB
A
CKC
+=
1k r A
IIAdsorption of B controlling ( )AA
B
CKC
+=
1k r A
IIISurface reaction controlling
All the reactants molecularly adsorbed on the catalyst surface and reacts
IVAdsorption of A controlling ( )CCBB
A
CKCKC++
=1
k r A
VAdsorption of B controlling ( )CCAA
B
CKCKC++
=1
k r A
VIAdsorption of C controlling ( )BBAA
C
CKCKC++
=1
k r A
VIISurface reaction controlling
Reaction between atomically adsorbed hydrogen and adsorbed molecules of A and B
VIIIAdsorption of A controlling ( ) )(1
k r 2
1A
CCBB
A
CKCKC++
=
IXAdsorption of B controlling
++
=2
1A
)(1
k r CCAA
B
CKCK
C
XAdsorption of C controlling ( )2A 1
k r BBAA
C
CKCKC++
=
XISurface reaction controlling
4
IGC Newsletter Technical Article
transfer. Also, desorption rates of the products are assumed to
be very fast.
3. Isothermal condition around and within the catalyst is assumed
(i.e. temperature gradient is zero).
A Langmuir-Hinshelwood (L-H) type model was proposed to
describe the hydrogenation of U(VI) to U(IV). Several model
equations (Table 1) were derived and the model parameters were
evaluated, including those with molecular adsorption of all the
reactants and dissociative hydrogen adsorption. These model
equations are derived on the assumption that one of the three
elementary steps of hydrogenation process (adsorption of U(VI)
and hydrogen, surface reaction between adsorbed molecules and
desorption of products) is the rate-controlling step.
Semi-batch Reactor (bubble reactor) Model
In order to verify the applicability of the kinetic model, reaction
is carried out in bubble reactor to which hydrogen is added
continuously in such a way that pressure is maintained constant
(~1 atm.) and experimental data on the liquid phase concentration
of uranium (i.e. U(VI)) and nitric acid as a function of time were
obtained. The gas and the liquid phase in the reactor are assumed
to be completely back-mixed. The mass balances for uranium,
nitric acid and hydrogen in the liquid is written as
(4)
(5)
(6)
The initial conditions for the Equations 4-6 can be written as
at t = 0; CA = CA0; CB = CB0 and CC = CC0
Equations 4-6 imply that the mass-transfer resistances around
the catalyst particles and inside the particles are ignored. Mass
transfer resistances in and around the porous catalyst can be
eliminated by using small catalyst particle size (≤45 μm).
The system of ordinary differential equations (Equations 4-6)
were solved numerically by using Runge-Kutta method to obtain
concentrations of uranium, nitric acid and dissolved hydrogen
as a function of time. For this purpose, intrinsic rate parameter,
equilibrium constants and volumetric gas-liquid mass transfer
coefficient (kLaGL) were determined from superimposing the
experimental time vs concentration data on to the diagrams
of numerical solution of model Equations 4-6 using a nonlinear
regression technique. The best values were obtained by minimizing
the following objective function:
(7)
where ‘p’ is the number of observations. Calculations were
performed using MATLAB, which has built-in algorithm to perform
a nonlinear least-squares data fit. It is observed that only the
parameters of model I, III, IV, X and XI have positive values but
the model III was found to give the best fit for the experimental
data. Though model XI describes reasonably the physical/chemical
phenomenon occurring in the system, model Eqs. (4-6) did not
converge at the initial guess values for the rate parameters while
solving them numerically. Most often it provided complex values for
some of the rate parameters. Whereas such limitations were not
observed with Model-III. It was also found to give the best fit for the
experimental data even though it may not describe completely the
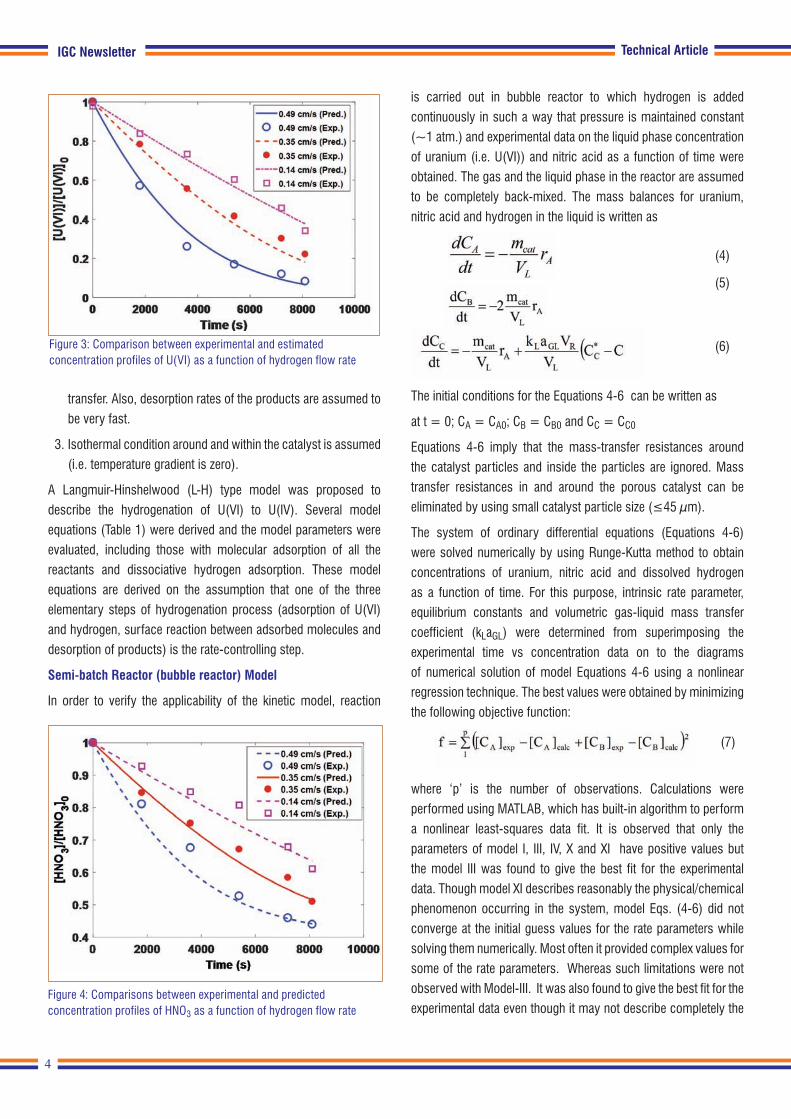
Figure 3: Comparison between experimental and estimated concentration profiles of U(VI) as a function of hydrogen flow rate
Figure 4: Comparisons between experimental and predicted concentration profiles of HNO3 as a function of hydrogen flow rate

5
IGC NewsletterTechnical Article
physical/chemical phenomena occurring in the system. Therefore,
we are inclined to select Model-III. The estimated values of
volumetric gas-liquid mass transfer coefficient for the hydrogen
superficial velocities were almost found to be independent of nitric
acid concentration in the range studied in the present investigation.
The comparisons between experimental and estimated results
(from the model) for some typical cases are presented in Figures 3
and 4, which show a reasonably good agreement. As it is observed
from these figures, the process is partially influenced by gas-liquid
mass transfer resistance, because with an increase in the hydrogen
flow rate, the extent of conversion increases.
Based on the observations presented above, it is appropriate to
comment that surface reaction between dissolved hydrogen and
adsorbed reactants A and B (uranium and nitric acid respectively)
Figure 5: Variation of dissolved hydrogen concentration during hydrogenation
on the surface of the catalyst explains the catalytic hydrogenation
of U(VI) (i.e. Model III). Figure 5 shows the calculated concentration
profile of dissolved hydrogen in the reactor during the hydrogenation
process. It is noticed that dissolved hydrogen concentration varies
in the range 5.7x10⁻⁴ – 7.5x10⁻⁴ kmol.m-3 during hydrogenation
process.
The present work concerned with the experimental work was
carried out at room temperature and atmospheric pressure.
In future, research will be extended to varying the size of catalyst
particles, high pressure and temperatures, and observe the results.
Remya Murali and colleagues,
Reprocessing Group

6
IGC Newsletter
Alloy 617M forgings. The welding procedure involves buttering/
weld overlaying of 10Cr steel using ERNiCrCoMo-1 followed by
post weld heat treatment (PWHT) and subsequent welding of
weld overlay deposit with Alloy 617M part by NG-TIG welding
process.The chemical composition and mechanical properties of
10Cr steel, Alloy 617M forgings and Alloy 617 filler wire used are
given in Table 1. Figure 1 shows hot wire NG-TIG welding machine
with column and boom arrangement to manipulate the TIG torch
for linear welding of plate and circular welding of pipe using Tilt
Table Positioner-Rotator.
Buttering of 400 mm diameter 10Cr steel was carried out by hot-wire
Alloy 617M (a chemistry control variant of Alloy 617 / Inconel 617)
and 10%Cr ferritic-martensitic steel are candidate rotor materials
under consideration for steam turbine of Indian Advanced Ultra
Super Critical (AUSC) coal fired power plants. There is a dissimilar
metal welding (DMW) between 10% Cr steel rotor parts and
Alloy 617M rotor parts. This DMW will be executed by hot-wire
narrow-gap TIG (NG-TIG) welding process using Alloy 617 filler
wire (ERNiCrCoMo-1).
Narrow-Gap TIG welding is an advancement in TIG welding
process used for joining thick sections in nuclear and thermal
power plants. Narrow- Gap TIG (NG-TIG) welding is carried out
using specially designed TIG torch on a narrow-groove joint
preparation. NG-TIG welding in conjunction with hot-wire technique
increases the productivity. In-house NG-TIG welding facility has
been established to develop the welding procedures for joining of
thick components for fission, fusion reactor programs, and AUSC
coal-fired power plant project.
In this article, the welding procedure developed for dissimilar metal
welding of 10Cr steel and Alloy 617M using in-house NG-TIG
facility is presented. Also, the ultrasonic examination procedure
established to qualify this dissimilar metal weld joint is presented.
Materials and NG-TIG Welding
To develop the dissimilar metal welding procedure, a mock-up
welding was planned using 400 mm diameter 10Cr steel and
Development of Welding and Ultrasonic Examination Procedures for Dissimilar Metal Welding between 10%Cr Steel and Alloy 617M Welded Rotor
of Indian Advanced Ultra Super Critical Thermal Power Plant
Figure 2: 10Cr steel forging buttering with ERNiCrCoMo-1
Figure 1. NG-TIG Welding Machine at IGCAR Figure 3: 10Cr steel/Alloy 617M DMW in progress
Technical Article

7
IGC Newsletter
TIG welding process using ERNiCrCoMo-1 filler wire. Preheating
and inter-pass temperature of around 200°C was maintained during
buttering operation using induction heating system. The buttering
of 10Cr steel forging using ERNiCrCoMo-1 has been successfully
carried out and deposited to the required height of 33 mm towards
job centre. Figure 2 shows 10Cr steel forging with weld overlaying
of ERNiCrCoMo-1. The weld overlaying was qualified by liquid
penetrant test after the final pass and found to be free from surface
defects. The 10Cr steel buttering piece was subjected to PWHT at
670°C for 10 hours.
For NG-TIG welding, 10Cr steel buttering piece and Alloy 617M
solid forging were machine fabricated into hollow forging
(Ø400 mm x 95 mm wall thickness x 200 mm length) and
edge prepared for NG-TIG welding with groove angle of 6°. NG-
TIG welding was carried out between Alloy 617 buttering layer
and Alloy 617M part in 1G position using ERNiCrCoMo-1 filler
wire of 0.8 mm diameter (Figure 3). During welding, inter-pass
temperature was maintained below 150°C. Welding of 95 mm thick
weld groove was completed by 50 weld passes (including root
pass). After completion of welding, the weld bead was qualified
by liquid penetrant test and was found to be acceptable (Figure 4).
Development of phased array ultrasonic methodology for
inspection of thick dissimilar weld joint
A phased array ultrasonic methodology is developed for inspection
of thick dissimilar weld between Alloy 617M and 10Cr ferritic steel.
The methodology involves focusing the beam at different depths
in various vertical planes parallel to the weld. A 2.25 MHz 128
element phased array transducer with 0.75 mm pitch was used. An
aperture of 64 element was used to focus the beam throughout the
thickness at 2 mm step. The aperture was translated electronically
in steps of 12 mm to cover the entire buttering layer and weld
volume. This methodology does not require any physical scanning
of the transducer perpendicular to the weld line. The placement
of the transducer with respect to the weld is shown in Figure 5a.
The inspection was carried out from both 10Cr ferritic steel and
Figure 4: LPT after final weld pass of 400 mm diameter 10Cr steel/Alloy 617M weld joint
Table 1:Chemical composition and mechanical properties (at RT) of 10Cr steel forging, Alloy 617M forging and Alloy 617 filler wire
10 % Cr Steel Forging
Cr Mo W V Nb Ni C N Mn Si P S Al Fe
10.56 1.07 0.98 0.2 0.02 0.77 0.123 0.046 0.42 0.024 0.005 0.002 0.005 Balance
0.2% YS (MPa) UTS (MPa) % Elongation (5d) % Reduction in Area Impact Strength (J)
770-779 894-902 17-18 59-62 56-61
Alloy 617M Forging
Cr Fe Mn Mo Co Al C Cu B Si S N Ti Ni
22.9 0.38 0.001 8.39 12.32 0.81 0.062 0.019 0.003 0.11 0.002 0.0046 0.428 Bal.
0.2% YS (MPa) UTS (MPa) % Elongation (5d)
414 726 52.6
Alloy 617 Filler Wire
Cr Fe Mn Mo Co Al C Cu B Si S N Ti Ni
22.30 0.8 0.42 8.7 11.30 1.3 0.1 0.1 - 0.32 0.002 - 0.42 Balance
Technical Article
8
IGC Newsletter
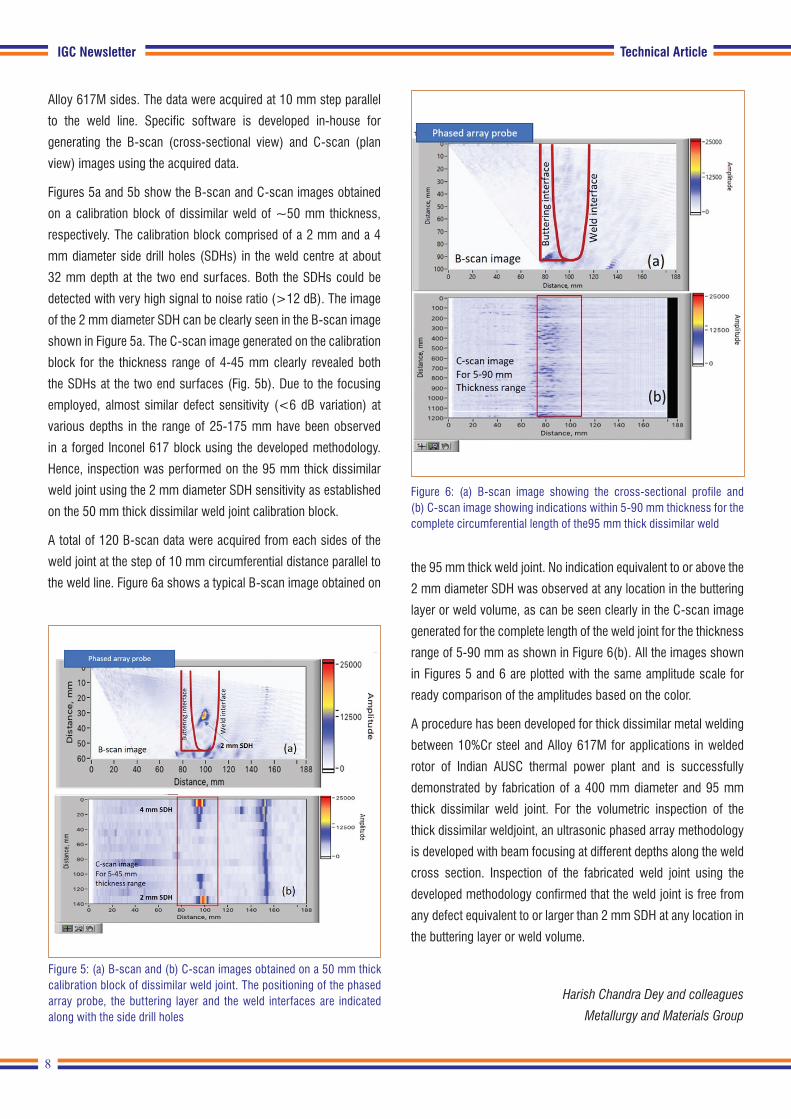
Figure 6: (a) B-scan image showing the cross-sectional profile and (b) C-scan image showing indications within 5-90 mm thickness for the complete circumferential length of the95 mm thick dissimilar weld
Alloy 617M sides. The data were acquired at 10 mm step parallel
to the weld line. Specific software is developed in-house for
generating the B-scan (cross-sectional view) and C-scan (plan
view) images using the acquired data.
Figures 5a and 5b show the B-scan and C-scan images obtained
on a calibration block of dissimilar weld of ~50 mm thickness,
respectively. The calibration block comprised of a 2 mm and a 4
mm diameter side drill holes (SDHs) in the weld centre at about
32 mm depth at the two end surfaces. Both the SDHs could be
detected with very high signal to noise ratio (>12 dB). The image
of the 2 mm diameter SDH can be clearly seen in the B-scan image
shown in Figure 5a. The C-scan image generated on the calibration
block for the thickness range of 4-45 mm clearly revealed both
the SDHs at the two end surfaces (Fig. 5b). Due to the focusing
employed, almost similar defect sensitivity (<6 dB variation) at
various depths in the range of 25-175 mm have been observed
in a forged Inconel 617 block using the developed methodology.
Hence, inspection was performed on the 95 mm thick dissimilar
weld joint using the 2 mm diameter SDH sensitivity as established
on the 50 mm thick dissimilar weld joint calibration block.
A total of 120 B-scan data were acquired from each sides of the
weld joint at the step of 10 mm circumferential distance parallel to
the weld line. Figure 6a shows a typical B-scan image obtained on the 95 mm thick weld joint. No indication equivalent to or above the
2 mm diameter SDH was observed at any location in the buttering
layer or weld volume, as can be seen clearly in the C-scan image
generated for the complete length of the weld joint for the thickness
range of 5-90 mm as shown in Figure 6(b). All the images shown
in Figures 5 and 6 are plotted with the same amplitude scale for
ready comparison of the amplitudes based on the color.
A procedure has been developed for thick dissimilar metal welding
between 10%Cr steel and Alloy 617M for applications in welded
rotor of Indian AUSC thermal power plant and is successfully
demonstrated by fabrication of a 400 mm diameter and 95 mm
thick dissimilar weld joint. For the volumetric inspection of the
thick dissimilar weldjoint, an ultrasonic phased array methodology
is developed with beam focusing at different depths along the weld
cross section. Inspection of the fabricated weld joint using the
developed methodology confirmed that the weld joint is free from
any defect equivalent to or larger than 2 mm SDH at any location in
the buttering layer or weld volume.
Harish Chandra Dey and colleagues
Metallurgy and Materials Group
Technical Article
Figure 5: (a) B-scan and (b) C-scan images obtained on a 50 mm thick calibration block of dissimilar weld joint. The positioning of the phased array probe, the buttering layer and the weld interfaces are indicated along with the side drill holes

9
IGC Newsletter
Young Officer’s FORUM Dr. Balmukund Shukla joined the Materials Science Group of IGCAR, Kalpakkam after completing OCES from 10th batch of RRCAT Training School, Indore. He received his M.Sc. in Physics from Jawaharlal Nehru University and has obtained his Ph.D degree in Physical
Sciences from HBNI in 2018. His research interests include high pressure and high temperature structural studies on uranium intermetallic and oxide compounds. He has five peer reviewed journal publications and four conference publications.
Young Officer's Forum
The behavior of materials at extreme conditions of pressures & temperatures is interesting and has been widely studied since decades to explore their physical and mechanical properties. The applied pressure on crystalline solids results in lattice compression and structural changes in the material, most often these two effects are correlated. These effects lead to several fascinating phenomena such as metal-insulator transitions, Lifshitz phase transitions, interband electron and valence transitions. Hence, to know the physics behind these interesting phase transitions and to understand the kinetics, High Pressure (HP) studies become relevant.
Actinides are among the most studied materials from technological and physics point of view and hence investigation of these compounds is desirable under extreme conditions. Among all the UmXn intermetallic compounds, UX2 type compounds are large in number. Most of the UX2 type compounds are found to stabilize in MgCu2 type Laves phase (UX2, X=Fe, Co, Ir, Os etc.) at ambient because of very low electronegativity value, Zunger pseudo potential radii and higher valence electron. This report describes the HP structural stability of some of the MgCu2 type Laves phase and AlB2 type UX2 compounds.
All the compounds have been prepared using vacuum arc-melting technique. The X-ray Diffraction (XRD) study of UIr2, UOs2 & UZr2 revealed the samples to be in single phase with lattice parameters- cubic (MgCu2 type), a=7.561 Å; cubic (MgCu2 type), a = 7.515 Å; hexagonal (AlB2 type) a =5.032 Å & c =3.081 Å; respectively. Indigenously designed Mao-Bell type DAC was used to carry out HP experiments at ambient temperature. HP-XRD studies have been carried out at laboratory-based X-ray source (λ=0.7101 Å) for UOs2, and synchrotron-based X-ray source at Indus-2, RRCAT, India (λ= 0.6061 Å) has been used for UIr2 and UZr2. In addition, High Pressure- High Temperature (HP-HT) XRD studies on UZr2 have been carried out using a novel custom-designed combination of membrane cell DAC coupled to a high flux micro-focus X-ray machine (λ=0.7101 Å).
Nature of Binary Uranium Intermetallic Compounds at Extreme Conditions
First-principle based calculations were carried out to understand the bonding and charge density distribution using the density functional theory (DFT) as implemented in Vienna ab-Initio Simulation Package (VASP). The interaction between the valence electrons and the ionic core was described by Projector Augmented Wave based pseudopotential. Generalized Gradient Approximation as parametrized by Perdew, Burke, and Ernzerh was used for exchange-correlation functional.
UX2 Compounds Exhibiting Laves Phase – UOs2 and UIr2
Various empirical methods are available in the literature to describe the systematics of the stability of these compounds. Structural stability maps by Villars (1989) employs the criteria such as Zunger-pseudo potential radii (∆R), average electronegativity (∆X) and average number of valence electrons per atom (VE) as physical coordinates to predict the structural stability domains of different structure types. In general with increasing pressure, the parameters ∆R, ∆X and VE show an increase. Using this argument, the following structural sequence under pressure for UX2 compounds are predicted: Laves phase → MoSi2 (Tetragonal) → CeCd2(hexagonal) → CeCu2 (orthorhombic) → CaIn2 (hexagonal) → AlB2 (hexagonal) → ZrSi2 (orthorhombic) → ThSi2 (tetragonal) → SmSb2 (orthorhombic) → Cu2Sb (tetragonal). The free electron concentration per atom (e/a) is another stabilization criterion which states that MgCu2 type structure is stable when e/a is less than 1.8 & more than 2.3, and for 1.8<e/a<2.3 MgZn2 & MgNi2 structures are adopted. The radii ratio of RU/RX has also been found useful to predict the stability of the Laves phase structures which are stable between radii ratio 1.06-1.68. This report describes the HP studies on UOs2 and UIr2 compounds among Laves phases.
HP Study on UOs2 & UIr2 at Ambient Temperature
UOs2 has two allotropic forms, namely a high-temperature cubic MgCu2 type Laves phase and another low-temperature hexagonal MgZn2 type Laves phase. MgCu2 type phase has been obtained by quenching the ingot at 1073K.

10
IGC NewsletterYoung Officer's Forum
The HP-XRD studies on UOs2 and UIr2 have been performed up to 36.0 GPa [figure 1] & 55.0 GPa respectively. The XRD patterns of UOs2 & UIr2 were indexed with Fd-3m space group. However, the diffraction patterns of UOs2 & UIr2 are indexable only up to 12 GPa & 25 GPa with Fd-3m space group and beyond these pressures new Bragg reflections are observed indicating the structural transformation to a different phase. The estimated lattice parameter from the XRD patterns for both the compounds are found to decrease with increasing pressure. The P-V curve of UOs2 & UIr2
were fitted to Birch Murnaghan Equation of State (BM-EOS) up to 12.0 GPa & 25.0 GPa, resulting in the bulk modulus of the material to be 261 GPa& 284 GPa respectively.
Beyond 12 GPa in UOs2, transformation to a high-pressure phase occurs and the phase transformation completes at 20.1 GPa. A hexagonal lattice with lattice parameters a = 3.013 Å and c = 4.267 Å gives the best fitting to the observed Bragg’s reflection. The volume of the new hexagonal lattice is estimated to be 33.55 Å indicating a new compact structure with c/a=1.4 having
space group P6/mmm. Theoretical diffraction patterns of UOs2 were generated for the predicted structural sequence. However, none of the generated patterns correspond to the experimental observation indicating that UOs2 doesn’t follow the predicted high-pressure structural sequence. The BM-EOS fit to P-V curve for the HP structure yields bulk modulus of high pressure phase to be 366 GPa. This is the highest bulk modulus obtained among any of the uranium intermetallic compounds. The observed structural transition is found to be irreversible in nature. Thus the least compressible phase of UOs2 is retrievable at ambient pressure. Higher bulk modulus of the high pressure phase may be due to the fact that atomic density in the unit cell is more as compared to the parent phase.
The UOs2 structure can be visualized in terms of two tetrahedra, one being uranium tetrahedral where the U atoms occupy the corner & center of the tetrahedral, and the other is the osmium tetrahedral where the osmium atoms occupy only at the corners of the tetrahedral. The osmium tetrahedra form a strong Os-Os network inside the lattice due to short Os-Os (2.65 Å) bonding. Therefore, it is the uranium tetrahedra which is most probably affected under external pressure. To look into the reason for the phase transition and to understand the role of individual atoms, DFT computation was carried out. Figure 2 shows the charge density along (001) plane at ambient and 46 GPa respectively. It clearly shows the metallic bonding between U-U and Os-Os bonds. Also, the presence of charge (isolines) between U and Os indicates the covalent nature of U-Os bond in addition to the metallic bonding. Charge density plots indicate an increase in the covalent nature of the bonding between U-Os with pressure. Therefore, it can be concluded that pressure affects mostly U-U bonding and the phase transition may be due to the distortion of tetrahedral formed by uranium. Total density of state is plotted at ambient as well as with respect to pressure ranging from ambient pressure to 46 GPa as shown in figure 3. Inset in the figure shows that a dip starts to develop near the Fermi
Figure 1: HP-XRD patterns of UOs2; bottom-Cubic MgCu2 type phase, top- HP Hexagonal phase
Young Officer's Forum
Figure 2. Different charge density plots for UOs2 along (001) plane
11
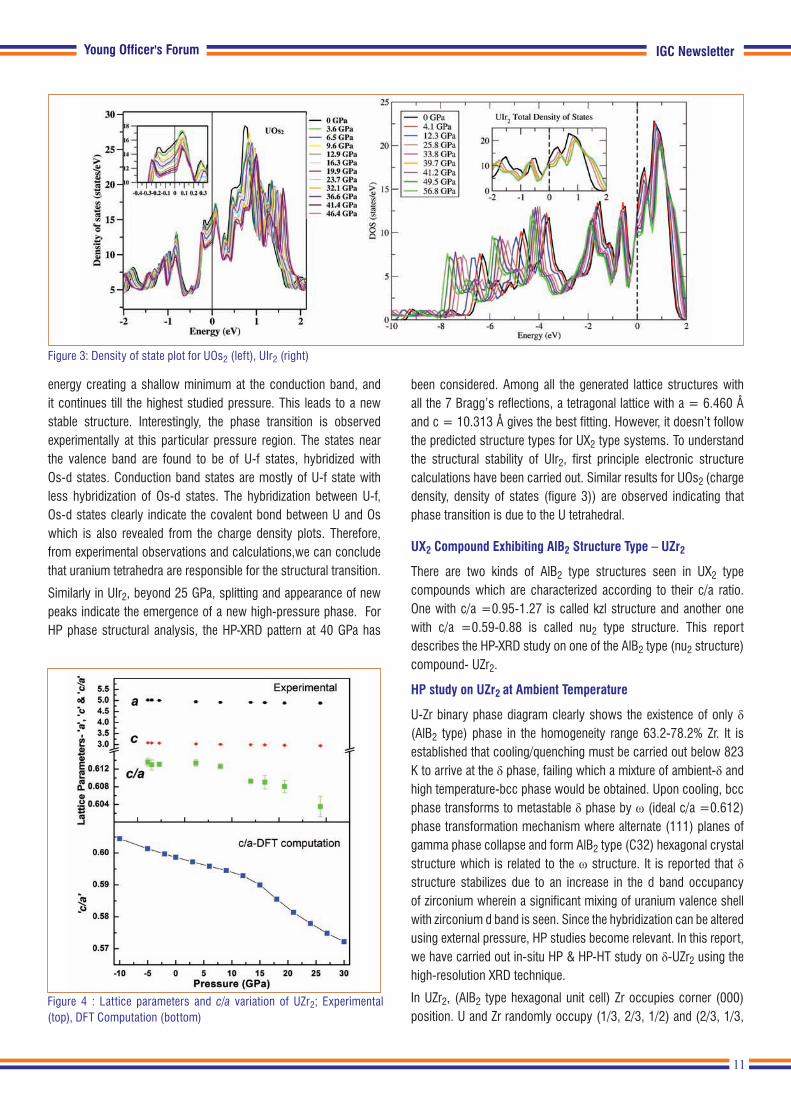
IGC Newsletter
energy creating a shallow minimum at the conduction band, and it continues till the highest studied pressure. This leads to a new stable structure. Interestingly, the phase transition is observed experimentally at this particular pressure region. The states near the valence band are found to be of U-f states, hybridized with Os-d states. Conduction band states are mostly of U-f state with less hybridization of Os-d states. The hybridization between U-f, Os-d states clearly indicate the covalent bond between U and Os which is also revealed from the charge density plots. Therefore, from experimental observations and calculations,we can conclude that uranium tetrahedra are responsible for the structural transition.
Similarly in UIr2, beyond 25 GPa, splitting and appearance of new peaks indicate the emergence of a new high-pressure phase. For HP phase structural analysis, the HP-XRD pattern at 40 GPa has
been considered. Among all the generated lattice structures with all the 7 Bragg’s reflections, a tetragonal lattice with a = 6.460 Å and c = 10.313 Å gives the best fitting. However, it doesn’t follow the predicted structure types for UX2 type systems. To understand the structural stability of UIr2, first principle electronic structure calculations have been carried out. Similar results for UOs2 (charge density, density of states (figure 3)) are observed indicating that phase transition is due to the U tetrahedral.
UX2 Compound Exhibiting AlB2 Structure Type – UZr2
There are two kinds of AlB2 type structures seen in UX2 type compounds which are characterized according to their c/a ratio. One with c/a =0.95-1.27 is called kzl structure and another one with c/a =0.59-0.88 is called nu2 type structure. This report describes the HP-XRD study on one of the AlB2 type (nu2 structure) compound- UZr2.
HP study on UZr2 at Ambient Temperature
U-Zr binary phase diagram clearly shows the existence of only δ (AlB2 type) phase in the homogeneity range 63.2-78.2% Zr. It is established that cooling/quenching must be carried out below 823 K to arrive at the δ phase, failing which a mixture of ambient-δ and high temperature-bcc phase would be obtained. Upon cooling, bcc phase transforms to metastable δ phase by ω (ideal c/a =0.612) phase transformation mechanism where alternate (111) planes of gamma phase collapse and form AlB2 type (C32) hexagonal crystal structure which is related to the ω structure. It is reported that δ structure stabilizes due to an increase in the d band occupancy of zirconium wherein a significant mixing of uranium valence shell with zirconium d band is seen. Since the hybridization can be altered using external pressure, HP studies become relevant. In this report, we have carried out in-situ HP & HP-HT study on δ-UZr2 using the high-resolution XRD technique.
In UZr2, (AlB2 type hexagonal unit cell) Zr occupies corner (000) position. U and Zr randomly occupy (1/3, 2/3, 1/2) and (2/3, 1/3,
Young Officer's Forum
Figure 4 : Lattice parameters and c/a variation of UZr2; Experimental (top), DFT Computation (bottom)
Figure 3: Density of state plot for UOs2 (left), UIr2 (right)

12
IGC Newsletter
1/2) positions. Rietveld refinement with 50% randomness at U and Zr positions in UZr2, results in a huge mismatch in the intensities of observed and calculated patterns. However, the refinement of the occupancy factor at (1/3, 2/3, 1/2) and (2/3, 1/3, 1/2) positions results in a better match in the intensities. The occupancy factor of 0.84 at Zr position (1/3, 2/3, 1/2) turns out to be good fitting i.e. in 84% of the unit cells, Zr occupies (1/3, 2/3, 1/2) position in δ-UZr2.
HP-XRD has been carried out up to 20 GPa and the compound is found to be stable in its parent phase up to the highest pressure studied. The estimated pressure-volume data has been fitted with BM-EOS and bulk modulus and is found to be 108.3 GPa. Figure 4 shows that the lattice parameters ‘a’ and ‘c’ decrease with increasing pressure and axis ‘a’ decreases faster than ‘c’. Up to 10 GPa, c/a decreases slowly, and as the pressure is increased further, the rate of decrease in c/a increases sharply. The same trend in variation of c/a has also been seen in the lattice parameter variation estimated from DFT calculation and is also shown in Figure 4. In order to understand the rate of change of c/a ratio with pressure, difference charge density has been calculated along (110) and (001) planes at various pressures and is shown for (110) in Figure 5. It can be seen that corner Zr-Zr bonds have metallic nature and U(1/3,2/3,1/2)-Zr(2/3, 1/3, 1/2) bond have metallic as well as covalent character. Therefore, it can be concluded that at lower pressures U(1/3,2/3,1/2) - Zr(2/3,1/3,1/2) bond is weaker resulting in higher compression of the lattice parameter ‘a’ up to 10 GPa, beyond which the bond becomes stronger (DFT computation) leading to a resistance in compression along the ‘a’ axis at higher pressures.
Another interesting point which comes out from the charge density plot is that charge gets concentrated on each atom with increasing pressure and hence the overall metallicity of UZr2 decreases which is in contradiction to the usual trends under pressure. Since U-f electrons and Zr-d electrons contribute majorly to the total DOS, U-f and Zr-d states are responsible for the decrease in the metallicity of the system.
HP Study on UZr2 at High Temperatures
In-situ HP-HT XRD studies have been carried out up to ~6 GPa and 473 K to study the structural behavior at HP-HT and it has been observed that δ phase remains stable up to 6 GPa and 473 K. The estimated lattice parameters are seen to decrease with decrease in pressure at higher temperatures. The BM-EOS fitting to the P-V data gives the bulk moduli to be 105 GPa &102 GPa at 373 K & 473 K, respectively. Thermal expansion coefficients have been calculated as a function of pressure and are found to be 4.6×10⁻⁵ K-1, 3.7×10⁻⁵ K-1, 2.7×10⁻⁵ K-1 at 1.2 GPa, 4.8 GPa and 6.6 GPa respectively in the temperature range of 300 K - 473 K. A decrease in the thermal expansion coefficient as a function of pressure is expected because pressure causes hindrance in the expansion of the material.
The HP study on Laves phase MgCu2 type structure compounds
-UOs2 & UIr2- show that the compounds are stable up to 12 GPa & 25 GPa with the bulk modulus 261 GPa and 284 GPa respectively. The compressibility of the compounds shows that UIr2 is more stable as compared to UOs2, showing an increased hybridization due to more number of electrons in Ir. Both the compounds UOs2
& UIr2 are found to transform to the hexagonal and tetragonal structure respectively. The HP retrievable phase of UOs2 shows highest bulk modulus value of 366 GPa, among any uranium intermetallic compounds. The reason for the phase transformation in both the compounds is found to be due to uranium tetrahedral in the lattice. The density of state shows the existence of a pseudogap at Fermi energy at high pressure causing the transformation to a new HP phase.
AlB2 type compound UZr2 studied under high pressure has been found to remain stable up to 20 GPa with bulk modulus 108 GPa wherein the 5f electrons of uranium are found to be hybridized with the Zr-db and electrons. Up to 10 GPa, the c/a ratio is found to decrease slowly, beyond which it decreases sharply. It has been attributed to the strengthening of U(1/3, 2/3, 1/2)- Zr(1/3, 2/3, 1/2) covalent bond along the a-axis at lower pressures. The localisation of the charge density also leads to the drop in the metallisation of the material.
HP-HT study on UZr2 shows that the structure is stable up to 6 GPa and 473 K simultaneously. A usual decrease in the thermal expansion coefficient has been observed, which are 4.6×10⁻⁵ K-1, 3.7×10⁻⁵ K-1, 2.7×10⁻⁵ K-1 at 1.2 GPa, 4.8 GPa and 6.6 GPa, respectively in the temperature range 298 - 473 K.
Dr. Balmukund Shukla Materials Science Group
Young Officer's Forum
Figure 5: Difference charge density plot for UZr2 along (110) plane
13
IGC Newsletter
Quantum State Engineering of Cavity Fields
Young Researcher’s FORUM
Communication has been revolutionized with the availability of semiconductor based gadgets. It is difficult to imagine the chaos that would ensue if connectivity is not to be available. A skeleton requirement for a communication system is a vehicle to carry the information. Present day digital communication is tuned to its near perfection by using the electromagnetic waves as the information carrier. Classical communication involves transfer of information from sender to receiver by encoding the information in classical bits. A classical bit, for instance, could be two voltage levels to represent 0 and 1 respectively. Other possibilities include two distinct polarizations of light, orthogonal states of spin, etc. In a communication system, sender encodes information in a string of these bits and transfers them through a channel to the receiver. The communication could be free-space communication or through conduits such as cables. Of late, schemes have been proposed to harness the quantal nature of the electromagnetic field to improve several aspects, in particular, information security in communication.
The elementary unit used for encoding information, the quantum way is a quantum-bit or qubit in short. A qubit is typically a microscopic system that has two distinguishable (orthogonal) quantum states. These are conventionally represented by
0 and 1 . What distinguishes the qubit from its classical counterpart is that the former can be in a superposition of its states while the later has only two mutually exclusive possibilities. A general state for a qubit is , where 10 βα + are two complex numbers such that .1|||| 22 =+ βα If the two complex numbers are restricted to be 0 or 1, the two states of the qubit exactly maps to the two values that a classical bit can assume.
Some other examples of qubit configurations are
1. states of atoms or molecules,
2. states of nuclear spin,
3. vacuum state 0 and single photon state 1 of the electromagnetic field,
4. two orthogonal polarizations of light etc.
A cavity is an arrangement to confine photons. For instance, two highly reflecting, parallel planar mirrors make a cavity. The boundary conditions imply that the cavity supports only a select set of modes. The temporal frequencies of these modes are the resonant frequencies of the cavity. Depending on the quality of the cavity, photons can be sustained for a sufficiently long durations. Micro-cavities can be realized in photonic crystals, dielectric slabs, media with spatially modulated refractive index, etc. It is possible to realize coupled cavities wherein the dynamics of energy exchange can be controlled to realize quantum information transfer and processing. There are distinct advantages of using coupled cavities as they almost eliminate environmental influences such as the dissipation, decoherence, etc. In addition, states of the individual cavities can be changed by suitable external fields.
In this article, the qubit state is assumed to be a superposition of vacuum state and single photon state, whereas channel is cavity array. Hence, transfer of a single photon in cavity array is the basic requirement for transferring information.
Single photon transfer in cavity array
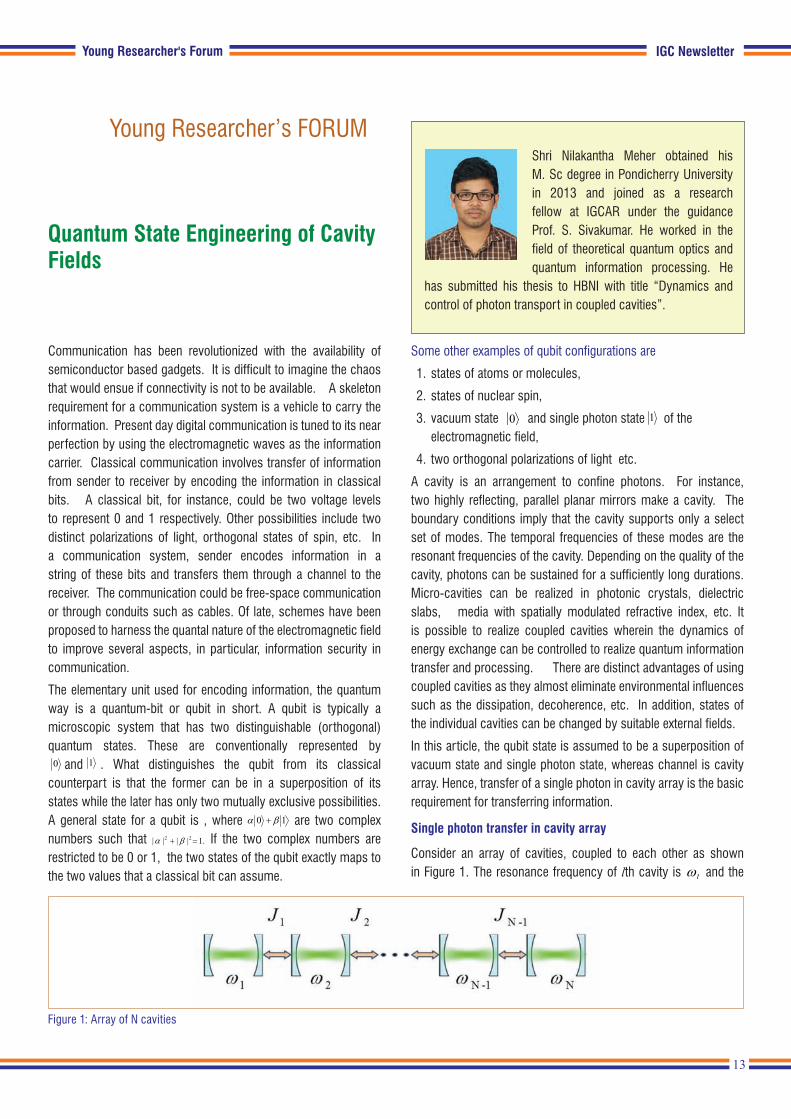
Consider an array of cavities, coupled to each other as shown in Figure 1. The resonance frequency of lth cavity is lw and the
Young Researcher's Forum
Shri Nilakantha Meher obtained his M. Sc degree in Pondicherry University in 2013 and joined as a research fellow at IGCAR under the guidance Prof. S. Sivakumar. He worked in the field of theoretical quantum optics and quantum information processing. He
has submitted his thesis to HBNI with title “Dynamics and control of photon transport in coupled cavities”.
Figure 1: Array of N cavities

14
IGC Newsletter Young Researcher's ForumYoung Researcher's Forum
coupling strength between l th and (l+1)th cavity is lJ . Coupling allows exchange of photons between two cavities. In this case, exchange is restricted to nearest neighbor cavities.
A simple situation is where all the coupling strengths are equal (JI = J) and the cavities are identical, i.e., all the resonance frequencies of the cavities are equal (=w). This array is said to be homogeneous. Transfer properties of this array can be understood by calculating the probability of transferring a single photon from one end to the other end. If the probability of detecting the photon at the end cavity is unity, then the transfer is perfect. The probability curves for the arrays containing different number of cavities are shown in Figure 2. It is to be noted that perfect transfer occurs from the first cavity to end cavity if the array contains three cavities. For an array with more than three cavities, perfect transfer does not occur. In other words, a single photon cannot travel from one end to the other end of the array with certainty (unit probability) if the array contains more than three cavities. The maximum of the probability decreases with increasing number of cavities in the array. If the length of the array is so large, in principle, probability is negligible. To conclude, a homogeneous array is not suitable for perfect transfer. This comes from the fact that the dispersion relation is nonlinear if the array has more than three cavities and any propagating wave undergoes dispersion.
Duality between two coupled cavities and an array of cavities
It is natural to ask for a configuration that allows perfect transfer of a single photon. In other words, complete transfer of photon demands suitable combinations of the coupling strengths and cavity resonance frequencies. In order to derive the suitable conditions, a duality relation between “N−1 photons in two coupled cavities” and “single photon in N cavities” has been employed. In simple language, duality means equivalence. Duality facilitates understanding of nontrivial aspects of one system in terms of easily accessible features of the other.
Mapping between the possible quantum states of the two systems is shown in Figure 3. An example for N=6 is also shown in Figure 3. Distributing N-1 photons in two cavities generates N number of possible quantum states of the form ,,1 nnN −− where n=0, 1, 2…., N-1. Here sr, represents the state if there are r photons in the left cavity and s photons in the right cavity. The state ,,1 nnN −− is mapped to the state 1+n of the cavity array. Here j refers to the state if there is a single photon in jth cavity and rest of the cavities are in their respective vacuua. Moreover, the transition between two states in coupled cavities is equivalent to the transfer of single photon across the array. We can call this a transition-transfer duality. It requires the coupling strengths to be inhomogeneous, i.e., unequal
JkNkJ k )( −= (1)
where k=1, 2, 3…., N-1 and J is a constant parameter. Note that lNl JJ −= . It is to be noted from Figure 3 that the transition
Figure 2: Probability of detecting a single photon at the end cavity as a function of time, in homogeneous, resonant cavity array. Profiles for arrays of length N=3 (black), 4 (green), 5 (red) and 10 (blue) are shown. In all cases, coupling strength J=√2/10 Figure 3:Quantum state mapping
Figure 4:Time evolution of probability for the coupled cavity to be in on evolution from the initial state , with J = 10−2π. By duality, these profiles show the transfer probability of a single photon from first cavity to Nth (end) cavity in the array. Different curves correspond to N = 2 (black), 4 (green) and 6 (red)

15
IGC Newsletter
from the state 0,1−N to 1,0 −N is dual to the transfer of single photon from the first cavity to the end cavity in the array. The transition probability from 0,1−N to 1,0 −N are shown in Figure 4 for N=2, 4 and 6. By duality, this profile also indicates the probability of transferring a single photon from one end to the other end in the array having 2, 4 and 6 number of cavities. Perfect transfer occurs at T= J2/π . In addition, due to symmetry in the coupling strengths, perfect transfer occurs between two symmetrically located cavities. Hence, the coupling strengths given in Equation 1 allow perfect transfer between two symmetrically located cavities in the array.
Quantum state engineering
Complete transfer of a photon between two symmetrically located cavities is possible if the coupling parameters of the array satisfy the relation given in Eqn. 1. This is equivalent to the transition between the states ,,1 nnN −− and nNn −−1, in the coupled cavity system. Transferring a photon between two arbitrary cavities in the array is equivalent to the transition between the states nm, and qp, in coupled cavities where m+n=p+q=N−1. With linear coupling, it is not possible to achieve perfect transition between two arbitrary states.
To see if nonlinearity helps in steering the evolution of states to achieve perfect transfer and complete transition, Kerr-type nonlinearity is considered. The energy of the electromagnetic field in a cavity with Kerr medium is proportional to the square of
number of photons. Hence the energy levels of electromagnetic field become an harmonic.
Average energy of the states nNn −−1, for coupled cavities are shown in Figures 5a and 5b. It is of interest to note that the states with equal number of photons but apportioned between the cavities have different average energies. This comes from the fact that
Young Researcher's Forum
Figure 5: Average energy as a function of n (number of photon in the second cavity) if there are 28 photons shared by the two cavities. (a) Resonant case , (b) Non-resonant case for a non-zero Kerr strength
Figure 6: Single photon detection probability in 1st and 5th cavities in an array of six cavities, as a function of time. Curves correspond to numerical estimation of probabilities P1(black) and P5( green). For comparison, the corresponding analytical values are shown, P1(red) and P5 (blue). Here Pm is the probability of finding the single photon in mth cavity in the array

16
IGC Newsletter
average energy of a state is dependent on Kerr nonlinearity which, in turn, depends on the number of photons present in the individual cavities. It is of interest to note from the Figure 5a that every state has only one partner state with equal average energy in the resonant case, i.e., zero de tuning. The de tuning between the cavities is
21 ww −=∆ where w1 and w2 are resonance frequencies of the two cavities. So, transition is possible between these two partner states and probabilities of transition to other states are negligible. It is observed from Figure 5b that not every state has a partner state with equal average energy in the nonresonant case. Essentially, states without partner states are approximate Eigen states of the Hamiltonian of the two coupled cavities and therefore, do not evolve. It is the de tuning and nonlinear strengths, which decide the pair of states that will have equal average energy. Hence, with proper choices of de tuning and nonlinear strengths, the states
nm, and qp, can become partner states. As a consequence, the state nm, evolves to the state qp, in time for those choices of parameters. Now, the duality between the two coupled cavities and the cavity array points to the possibility of transferring a photon from (n+1)th cavity to (q+1)th cavity.
For the purpose of illustration, we calculate the transfer probability of a single photon from the 1st cavity to 5th cavity in an array of six cavities. Appropriate values of resonance frequencies and Kerr strengths for the cavity array are calculated from the parameters of coupled cavities using duality. As can be seen in Figure 6, probability of transferring a photon from 1st cavity to 5th is unity. Importantly, transfer of photon occurs from one cavity to other cavity without populating other cavities. Hence, perfect transfer is possible between any two cavities in the array if resonance frequencies, coupling strengths and nonlinear parameters are suitably chosen.
Quantum State transfer
In the context of quantum state transfer in a cavity array, sender and receiver monoeuvre two different cavities in the array. The sender prepares the state in his cavity which is to be transferred to the receiver cavity. The state of the system is
....,000...00Rs
ψ=Ψ
where the state of the sender’s cavity is and the other cavities are in their respective vacuua. Here ‘S’ stands for sender and ‘R’ stands for receiver. On evolution under a suitable Hamiltonian H, if the state of the system after time t is
....,00...000RS
ψ=Ψ
the quantum state transfer is realized.
Perfect transfer of a single photon between any two cavities in the array can be used for perfect transfer of quantum states. Consider
Young Researcher's Forum
the initial state of the cavity array to be
,1++= nvacin βαψ
where
.0..1...001
,0.....00
121
21
Nn
N
n
vac
+=+
=
The state corresponds to the (n+1)-th cavity in the superposition 10 βα + and the other cavities are in their respective vacuua. If the parameters, i.e., Kerr strengths and coupling strengths satisfy the condition for single photon transfer between any two cavities in the array, then the state at a suitable time T becomes . Hence, the state 10 βα + is transferred from (n+1)th cavity to (q+1)th cavity at time T. The time T depends on the system parameters.
Perfect transfer of a single photon in an array of homogeneously coupled cavities is forbidden if the array has more than three cavities. A duality relation between a system of single photon in an array of N linearly coupled cavities and another system of N − 1 photons in two linearly coupled cavities identifies the correct combination of the coupling strengths and resonance frequencies for perfect transfer of a photon between two symmetrically located cavities in the array. In particular, the coupling strengths are required to be inhomogeneous. With this identification, transfer of a photon in the array is dynamically equivalent to the problem of sharing N −1 photons between the two linearly coupled cavities. Duality is extendable even if the cavities are of Kerr-type. This extended duality has identified the correct combination of the coupling strengths and local nonlinearities in the cavity array for perfect photon transfer between any two cavities in the array. Additionally, this transfer is effected without populating the other cavities so that the transfer cannot be viewed as a contiguous hopping of photon from one cavity to the other. Another interesting result of the analysis is the possibility of perfect transfer of superposition of the form 10 βα + using a combination of Kerr nonlinearity and complex coupling strengths. This feature is important in the context of encoding and transfer of information. These results are pertinent in the context of quantum information processing in cavity arrays as they are scalable. The ideas presented here are applicable to coupled spin chains as well to achieve controlled transfer of states between any two spins in the chain.
Nilakantha Meher Materials Science Group
....,000...00Rs
ψ=Ψ

17
IGC NewsletterConference and Meeting Highlights
Conference and Meeting Highlights
A three-day HBNI Research Scholars Meet- 2018 with the theme “Materials Science and Engineering of Nuclear Materials” (RSM- MSENM-2018), was organised during May 7-9, 2018 at Indira Gandhi Centre for Atomic Research (IGCAR), Kalpakkam. The meeting was first of its kind organised with the participants from the Constituent Institutions (CIs) of HBNI, with a view to promote collaborative interactions amongst young research scholars and provide an opportunity for them to get an exposure of the unique facilities across the CIs. The event brought together about 80 researchers from six CIs to acquaint them with the latest in materials research and technology developments in the nuclear industry.
Prof. Arun Kumar Bhaduri, Director, IGCAR , Prof. P. R. Vasudeva Rao, VC, HBNI and Prof. G. Amarendra, Director, MMG & MSG during the release of the souvenir
Research Scholars Meet on Materials Science and Engineering of Nuclear Materials (RSM- MSENM-2018),
May 7-9, 2018
The three day conference was inaugurated by the Chief Guest Prof. P. R. Vasudeva Rao, the Vice-Chancellor of HBNI, who spoke about unique research opportunities at HBNI. He also released the proceedings of the Meet. Prof. Arun Kumar Bhaduri, Director, IGCAR in his presidential address highlighted the importance of integrity and ethics, while pursuing research and emphasized the role of collaborative research work. Prof. G. Amarendra, Chairman, RSM-HBNI- 2018 welcomed the gathering and indicated that this meeting will pave for the organisation of similar conferences at other CIs. The RSM-2018 conference was structured under seven technical sessions, each dedicated to a specific field with four invited lectures from the eminent scientists of CIs of HBNI/DAE, Prof. Arun Kumar Bhaduri, Prof. Paramita Mukherjee, VECC, Kolkata, Prof. Sanjay Rai, RRCAT, Indore and Prof. K. Madanagopal, Materials Group, BARC, Mumbai. Prof. Arun Kumar Bhaduri spoke on the development of improved materials for sodium cooled fast reactors; Prof. Paramita Mukherjee highlighted the material science research being pursued at VECC and the facilities available; Prof. Sanjay Rai, discussed about the utilisation of INDUS 1 and INDUS 2 beam lines for materials science studies; and Prof. Madanagopal gave an over view of the materials synthesis and characterisation methods. In addition, there were 30 oral presentations and 51 poster presentations from the participants.
Prof. V. Aravind, Director, Institute of Mathematical Sciences (IMSc), Chennai was the Guest of Honour for the valedictory function. He appreciated the initiative of bringing together research scholars of diverse research areas on a common platform and to promote collaborative interactions among them. He presented ten best research contribution awards to the scholars based on the recommendations from a panel of jury.
Organising Committee HBNI-RSM-MSENM-2018

18
IGC Newsletter
A Metal Fuel pin Fabrication Facility (MFFF) has been set-up and is in operation at Radiochemistry Laboratory of IGCAR Kalpakkam. The facility is a demonstration for fabrication of sodium bonded metal fuel pin containing U-Pu-Zr metal alloy which markedly reduce the doubling time. The first of its kind facility comprises specialised equipment housed in inert atmosphere glove boxes for making plutonium bearing metal alloy fuel pins by injection casting process. A short film was prepared describing the facility with various process operations involved in metal fuel pin fabrication.
A special programme was organised in BARC on May 15, 2018 to remotely inaugurate some of the high technology facilities of the Department of Atomic Energy by Shri Ram Nath Kovind, the Honourable President of India. The Metal Fuel pin Fabrication Facility (MFFF) at IGCAR Kalpakkam was inaugurated by the Honourable President of India and dedicated the facility to the nation. The dignitaries for the function included the Honourable President of India, Smt. Savita Kovind First lady of India, Shri Vidyasagar Rao, Honourable Governor of Maharashtra, Dr. R. Chidambram, PSA to GOI, Dr. Sekhar Basu, Secretary, DAE and Chairman, Atomic Energy Commission and Shri K. N. Vyas, Director, BARC and senior officers from DAE.
To begin the programme, a short film on MFFF was live video streamed from BARC. During the remote inauguration, Dr. Arun Kumar Bhaduri, Director IGCAR, senior members along with the colleagues involved in setting up of the facility were physically present at the inauguration site at IGCAR, Kalpakkam. Director, IGCAR, through video conference welcomed all the dignitaries present in BARC for the inauguration. The Honourable President of India pressed the button marked MFFF on the panel at BARC to unveil the curtain at IGCAR and dedicated the facility to the nation. After unveiling, Director, IGCAR showed a typical metal fuel pin which was fabricated in this facility. Director, BARC mentioned that the one metal fuel pin contains about 50g of fuel and it has enough energy to provide electricity to ~4500 household for one full day.
The proud moment was viewed through live streaming at all the DAE units in Kalpakkam.
Dr. Arun Kumar Bhaduri, Director, IGCAR through video conference welcomed all the dignitaries present in BARC for the inauguration
Metal Fuel pin Fabrication Facility - Dedicated to the Nation by Shri Ram Nath Kovind, Honourable President of India
May 15, 2018
Conference and Meeting Highlights
Conference and Meeting Highlights

19
IGC Newsletter
Dr. Baldev Raj Memorial Bridge Course on Non-Destructive Evaluation (NDE) and Quality Assurance (BRM-BCNQ) was
organised jointly by IGCAR, ISNT Kalpakkam Chapter and Society for Failure Analysis (SFA) Chennai Chapter at IGCAR during
May 21-25, 2018 for the benefit of students entering final year of B.E./ B.Tech/ M.E/ M.Tech (Mechanical/Metallurgy/Materials
Science/ Industrial/ Manufacturing/ Production/NDT/ Welding Technology). The objective of this unique course is to motivate
young students and engineers from the centre by introducing advanced NDE science and technologies through a series of
technical lectures by eminent experts and providing hands-on practical in the state-of-the-art NDE equipment. This course
was attended by 40 participants that include 21 motivated students from academic institutes and 19 engineers from IGCAR.
Dr. Arun Kumar Bhaduri, Director, IGCAR inaugurated the course and during his address, he highlighted the role of NDE and QA in nuclear industry and encouraged the students to learn to the extent possible during this unique course and to equip themselves better to work for the nation. Dr. G. Amarendra, Director, Metallurgy & Materials Group and Materials Science Group, IGCAR highlighted the importance of this course and motivated the students to pursue a research career in NDE and QA. Dr. B. P. C. Rao, Associate Director, Fast Reactor Fuel Cycle Facility and Chairman, BRM-BCNQ briefed the importance of the Bridge Course and remembered the association with Late Dr. Baldev Raj, the father of NDT in India who initiated and nurtured NDE and QA activities at IGCAR.
Expert faculty from IGCAR, IIT Madras, GE Global Research Bengaluru and NIAS Bengaluru delivered the technical lectures. The lectures were well received and the participants interacted very well with the experts. During the afternoon sessions, participants performed one mini-project to gain hands-on experience in advanced NDE equipment. A quiz competition was conducted on May 25, 2018. During the feed back session, the students lauded the bridge course and mentioned that they were immensely benefitted by attending the course. All the students and winners of quiz competition were given certificates. Dr. C. K. Mukhopadhyay, Convener, BRM-BCNQ, proposed the vote of thanks.
Dr. C. K. Mukhopadhyay Convener, BRM-BCNQ
Inauguration of Dr. Baldev Raj Memorial Bridge Course on Non-Destructive Evaluation and Quality Assurance (BRM-BCNQ) by Dr. Arun Kumar Bhaduri, Director, IGCAR
Dr. Baldev Raj Memorial Bridge Course on Non-Destructive Evaluation and Quality Assurance (BRM-BCNQ)
May 21- 25, 2018
Conference and Meeting Highlights
Conference and Meeting Highlights

20
IGC Newsletter
News and Events
Dr. Purnima Jalihal, Head, Energy and Fresh Water Programme, National Institute of Ocean Technology, Chennai delivered IGC Colloquium on “Ocean Energy and Desalination – Possible Solutions to the Energy and Water Crises?” on April 03, 2018
Dr. P. Pramod, Principal Scientist and Head, Nature Education, Salim Ali Centre for Ornithology and Natural History, Coimbatore delivered a talk on Nature, Science & Society on April 27, 2018
Dr. Purnima Jalihal, NIOT delivering IGC Colloquium
Dr. P. Pramod delivering a talk on Nature, Science & Society
News and Events
21
IGC Newsletter
Visit of Dignitaries
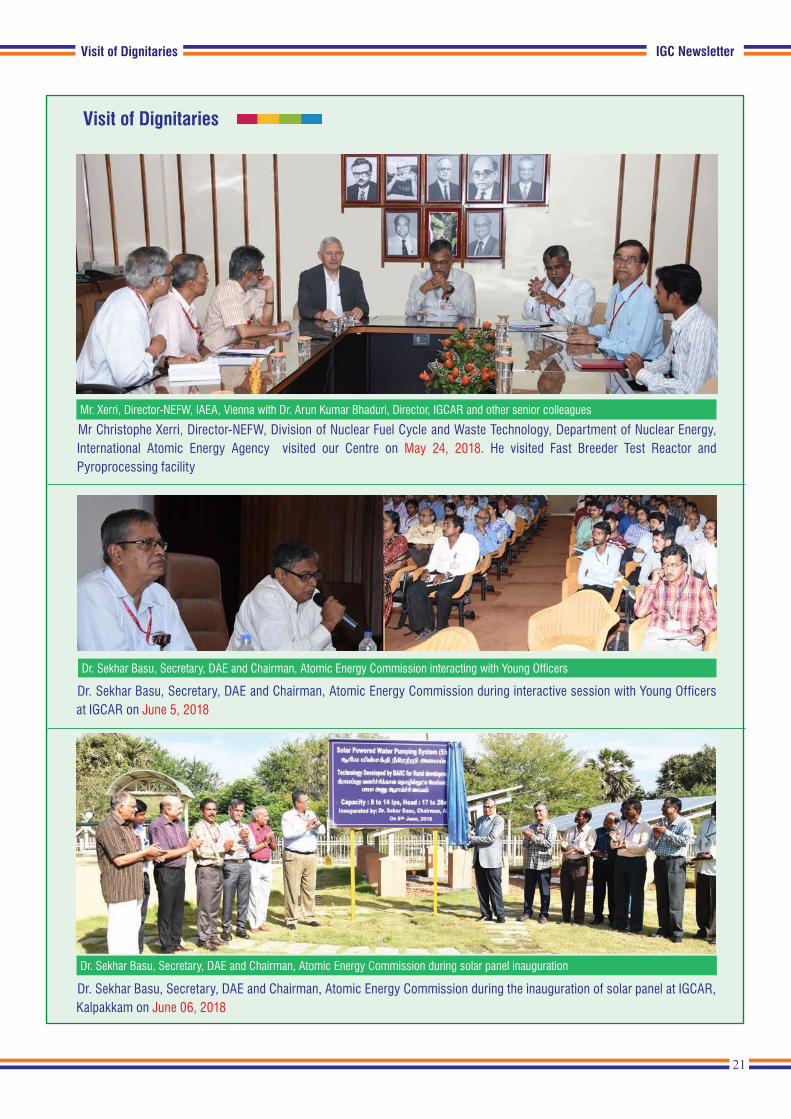
Mr Christophe Xerri, Director-NEFW, Division of Nuclear Fuel Cycle and Waste Technology, Department of Nuclear Energy, International Atomic Energy Agency visited our Centre on May 24, 2018. He visited Fast Breeder Test Reactor and Pyroprocessing facility
Dr. Sekhar Basu, Secretary, DAE and Chairman, Atomic Energy Commission during the inauguration of solar panel at IGCAR, Kalpakkam on June 06, 2018
Mr. Xerri, Director-NEFW, IAEA, Vienna with Dr. Arun Kumar Bhaduri, Director, IGCAR and other senior colleagues
Dr. Sekhar Basu, Secretary, DAE and Chairman, Atomic Energy Commission during solar panel inauguration
Dr. Sekhar Basu, Secretary, DAE and Chairman, Atomic Energy Commission interacting with Young Officers
Dr. Sekhar Basu, Secretary, DAE and Chairman, Atomic Energy Commission during interactive session with Young Officers at IGCAR on June 5, 2018
Visit of Dignitaries

22
IGC Newsletter
Visit of Dignitaries
Dr. Sekhar Basu, Secretary, DAE and Chairman, Atomic Energy Commission during the inauguration of Training Centre at FRFCF on June 27, 2018
Parliamentary Committee on Estimates visited IGCAR on June 25, 2018 and had discussions with Dr. Sekhar Basu, Secretary, DAE and Chairman, Atomic Energy Commission, Dr. Arun Kumar Bhaduri, Director, IGCAR and other DAE unit heads at Kalpakkam. They also visited MAPS, BHAVINI, FRFCF and Waste Immobilisation Plant
Dr. Sekhar Basu, Secretary, DAE and Chairman, Atomic Energy Commission during the inauguration of Training Centre at FRFCF
Parliamentary Committee on Estimates visited IGCAR on June 25, 2018
Visit of Dignitaries

23
IGC Newsletter
HBNI-IGCAR Corner
Ph.D thesis defense
Name Title Date Discipline
Shri P. ManikandanVaporisation and thermodynamic studies on systems of
relevance to nuclear technology06-04-2018 Chemical Sciences
Ms. P. M. Aiswarya
Phase diagram studies of Bi-Mo-O and Pb-Mo-O systems
and the development of a high temperature piezoelectric
material for use in liquid metals
18-05-2018 Chemical Sciences
Shri G.V.S. Ashok KumarCharacterization of Irradiation Positions in KAMINI & FBTR and Radiochemical Purification Studies
18-05-2018 Chemical Sciences
Ms. R. SajimolNuclear Fuel Characterisation Studies using Mass Spectrometry
12-06-2018 Chemical Sciences
Ms. T. PrathibhaSynthesis and Evaluation of N,N-di-alkyl-2-Hydroxyacetamides for the Modifier-Free Separation of Trivalent Actinides from Nitric Acid Medium.
29-6-2018 Chemical Sciences
Shri Vikas KumarDevelopment of Weld Pattern Analyzer for Quality Analysis of
Arc Welding Process11-5-2018 Engineering Sciences
Shri K. G. RaghavendraSynthesis and Characterization of ZrO2 Dispersion Strengthened Fe Based Alloys
14.05.2018 Physical Sciences
Shri Balmukund ShuklaInvestigation of Structural Stability and Phase Transition behavior of Uranium based Compounds under Pressure
18.05.2018 Physical Sciences
Ms. L. K. PreethiBand Gap Engineering of TiO2 Nanotubes for Photocatalytic Hydrogen Generation
25.05.2018 Physical Sciences
Shri G. Sainath
Molecular Dynamics Simulation Studies on Deformation and Fracture Behaviour of BCC Fe Nanowires : Influence of Orientation, Mode of Loading, Size, Temperature and Boundaries
12.06.2018 Physical Sciences
HBNI-IGCAR Corner
24
IGC Newsletter
HBNI-IGCAR Corner
Research Contribution Awards
Research Scholars Meet on Materials Science and Engineering of Nuclear Materials (RSM-MSENM) held at IGCAR during May 7-9, 2018Following Research Scholars received Best Research Contribution Awards
Neutrons to Predict Third Phase Formation in Tetravalent ThoriumMs. A. Aditi Chandrashekar
Efficiency of B10 Based Stacked Semiconductor Neutron Detector - A GEANT4 SimulationShri Manoj Kumar Parida
Uranium Melting Study on Yttria coated HDG with SiC interlayer for Pyrochemical Reprocessing Application Ms. B. Madhura
Strain Rate Effects on Dynamic Recrystallization During Hot Deformation of Nitrogen Enhanced Austenitic Stainless Steel Shri Santhosh Kumar
Polarized Raman Studies on VO2 Micro-Crystals Ms. S. Rakthima Basu
Compressibility and Thermal Expansion Study of δ-UZr2 at HP-HT Shri Balmukund Shukla
Deformation Behavior under Isothermal and Thermomechanical Fatigue in Type 316LN SS Base Metal and Weld Joint Shri T. Suresh Kumar
Ceramic Based Electronic Components for Radiation Detection and Estimation using Thermoluminescence Ms. S. Jagathamani
Origin of Phase Transition in VO2 and its Application as Advanced Smart Window Ms. Raktima Basu Runner-up I of Dr. K. V. Rao Research Awards in Physics for the Year 2018
HBNI-IGCAR Corner

Awards & Honours IGC Newsletter
Fiber Optic aided Spectrophotometric Determination of Trace Amount of Samarium in Aqueous Streams of Nuclear WasteShri S. Ganesh and Shri N. K. PandeyInternational Conference on Recent Trends in Analytical Chemistry (ICORTAC-2018) March 15-17, 2018, University of Madras, Chennai
Best Paper AwardSynthesis and Evaluation of Hexahexylphosphoramide for Extraction of ActinidesShri G. Jegan, Ms. K. Barani Priya, Shri Karanam Kaushik, Dr. C. V. S. Brahmananda Rao, Dr. A. Suresh and Dr. N. SivaramanDAE-BRNS symposium on emerging trends in Separation Science and Technology (SESTEC-2018) held during May 23-26, 2018 at BITS Pilani, K. K. Birla Goa campus, Goa, IndiaBest Poster Award
Best Paper/Poster Awards
Awards and Honours
Dr. Rani P. George, Head, SM&CS, CSTD, MMG received “NACE Fellow Honor 2018” for sustained contributions to corrosion control from NACE International USA
Dr. John Philip, Head, CSTD, MMG has been selected as a Member of Research Council of CSIR-Advanced Materials and Processes Research Institute (CSIR-AMPRI), Bhopal
Shri S. Thiyagu, has participated in 2018 Arc Cup International Welding Competition held at Zhuzhou City, Hunan Province, China during 4 –10 June, 2018 and won 3rd Prize in Gas Tungsten Arc Welding Competition and Excellent Award in Finished Product Welding

Editorial Committee Members: Dr. T. S. Lakshmi Narasimhan, Dr. N. V. Chandra Shekar, Dr. C. K. Mukhopadhyay, Dr. Vidya Sundararajan, Shri A. Suriyanarayanan, Dr. C. V. S. Brahmananda Rao, Dr. V. Subramanian, Ms. R. Preetha, Shri J. Kodandaraman,
Shri G. Venkat Kishore, Shri S. Kishore, Dr. N. Desigan, Shri M. Rajendra Kumar, Shri V. Rajendran, Ms. S. Rajeswari, Shri K. Ganesan, Shri K. Varathan and Shri G. Pentaiah
Published by Scientific Information Resource Division, RMG, RM&PAG, IGCAR, Kalpakkam-603102
Black-headed IbisBlack-headed Ibis are formerly known as Oriental white Ibis, these are wading birds from the Ibis family. It has a black head, legs and a long, decurved black bill. Their population is considered to be under decline globally, though it is stable in India.
The bird has a near threatened bird status.
Biodiversity Basket - Avian Fauna