IFX Day 2011 - Infineon
25
Page 1 Copyright © Infineon Technologies 2011. All rights reserved. IFX Day 2011 Campeon – 07 June 2011 Dominik Asam Member of the Management Board Chief Financial Officer
Transcript of IFX Day 2011 - Infineon
Page 1Copyright © Infineon Technologies 2011. All rights reserved.
IFX Day 2011Campeon – 07 June 2011
Dominik AsamMember of the Management BoardChief Financial Officer
Page 2Copyright © Infineon Technologies 2011. All rights reserved.
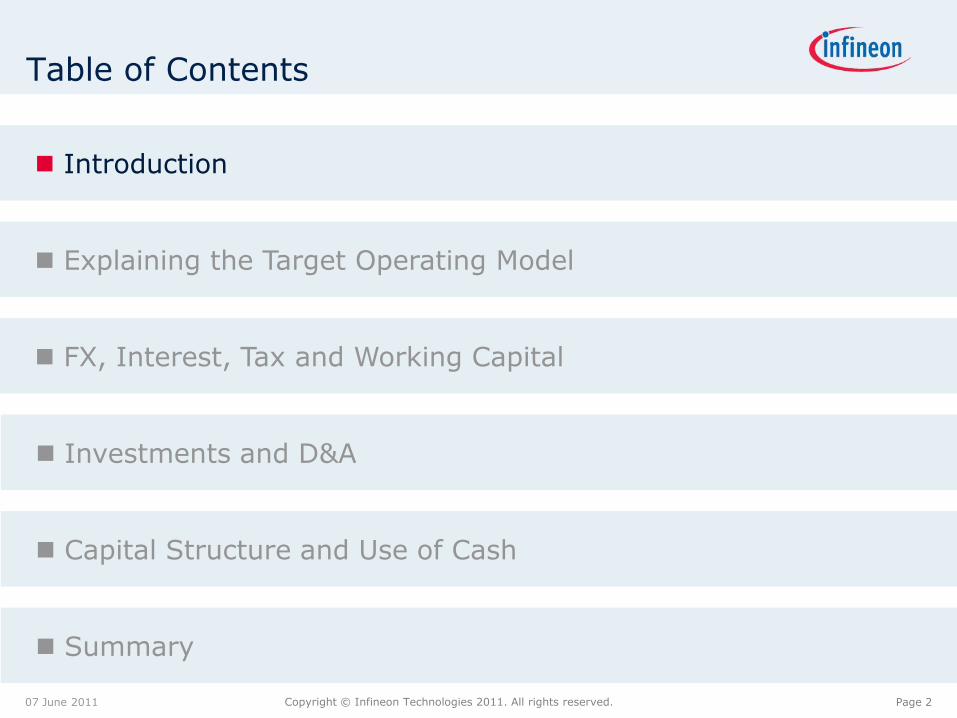
Table of Contents
07 June 2011
Introduction
Explaining the Target Operating Model
FX, Interest, Tax and Working Capital
Investments and D&A
Capital Structure and Use of Cash
Summary
Page 3Copyright © Infineon Technologies 2011. All rights reserved.
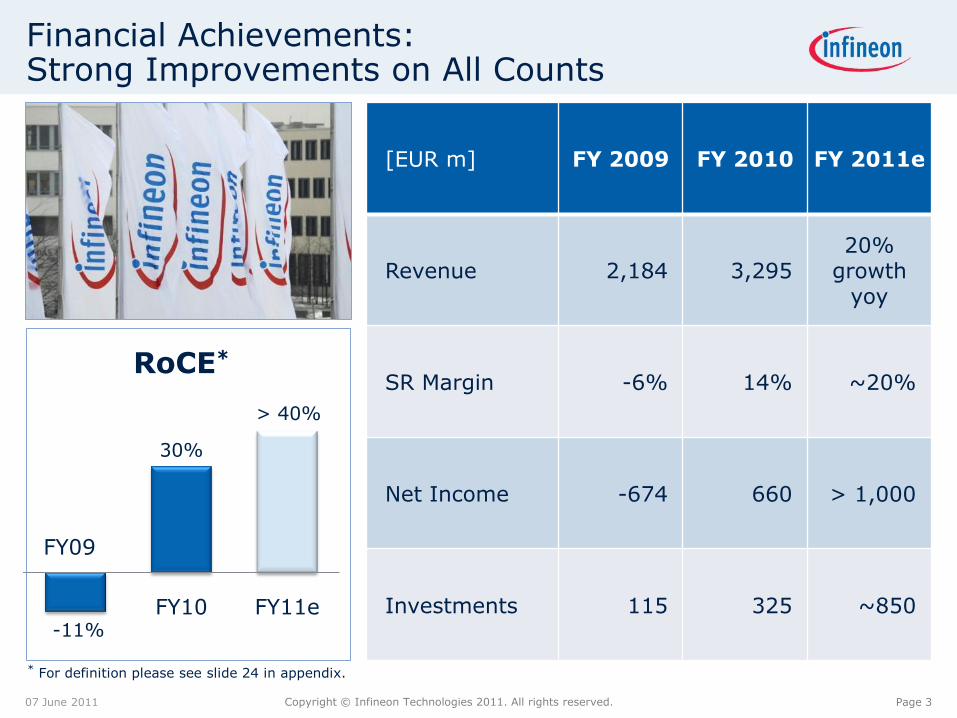
Financial Achievements:Strong Improvements on All Counts
07 June 2011
-11%
30%
FY10 FY11e
RoCE*
[EUR m] FY 2009 FY 2010 FY 2011e
Revenue 2,184 3,29520%
growthyoy
SR Margin -6% 14% ~20%
Net Income -674 660 > 1,000
Investments 115 325 ~850
FY09
> 40%
* For definition please see slide 24 in appendix.
Page 4Copyright © Infineon Technologies 2011. All rights reserved.
Table of Contents
07 June 2011
Introduction
Explaining the Target Operating Model
FX, Interest, Tax and Working Capital
Investments and D&A
Capital Structure and Use of Cash
Summary
Page 5Copyright © Infineon Technologies 2011. All rights reserved.
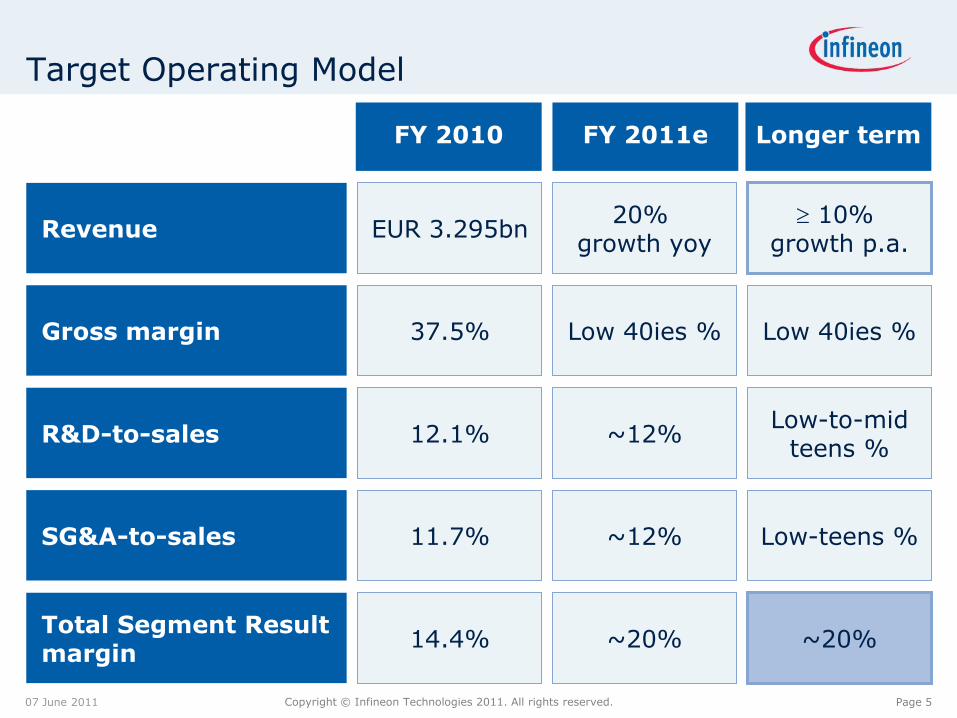
Target Operating Model
07 June 2011
Revenue
Gross margin
R&D-to-sales
SG&A-to-sales
Total Segment Result margin
14.4%
FY 2010 FY 2011e Longer term
EUR 3.295bn
37.5%
12.1%
11.7%
20% growth yoy
Low 40ies %
~12%
~12%
~20%
10% growth p.a.
Low 40ies %
Low-to-midteens %
Low-teens %
~20%
Page 6Copyright © Infineon Technologies 2011. All rights reserved.
0%
20%
40%
60%
0
500
1.000
Q1 FY09 Q1 FY10 Q1 FY11
Revenue Gross margin
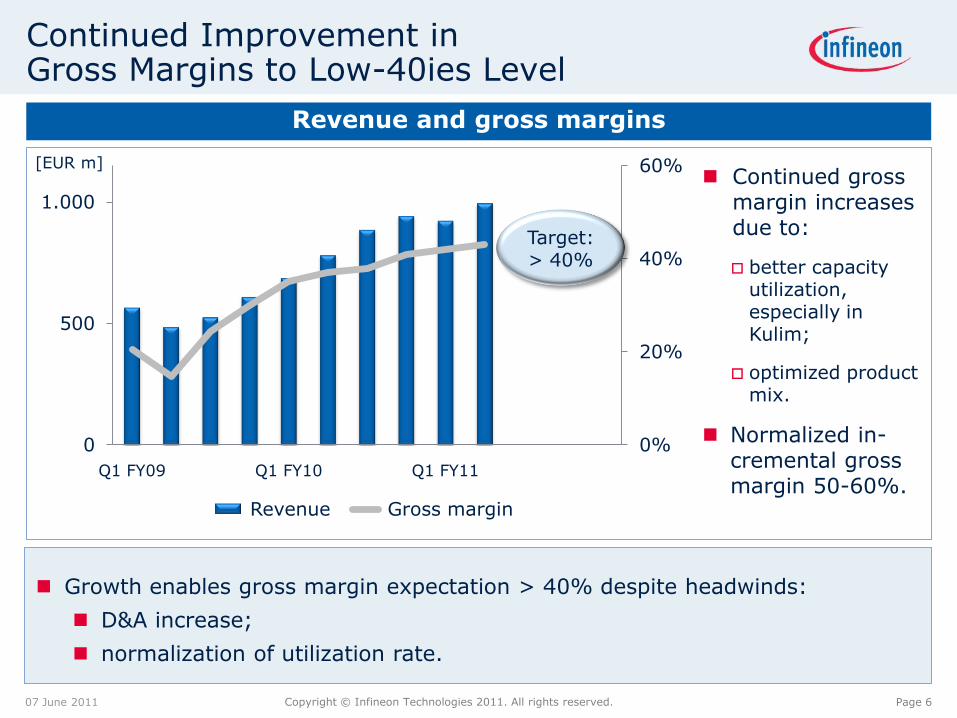
Continued Improvement inGross Margins to Low-40ies Level
07 June 2011
Revenue and gross margins
[EUR m]
Growth enables gross margin expectation > 40% despite headwinds:
D&A increase;
normalization of utilization rate.
Continued grossmargin increasesdue to:
better capacityutilization, especially in Kulim;
optimized productmix.
Normalized in-cremental grossmargin 50-60%.
Target:> 40%
Page 7Copyright © Infineon Technologies 2011. All rights reserved.
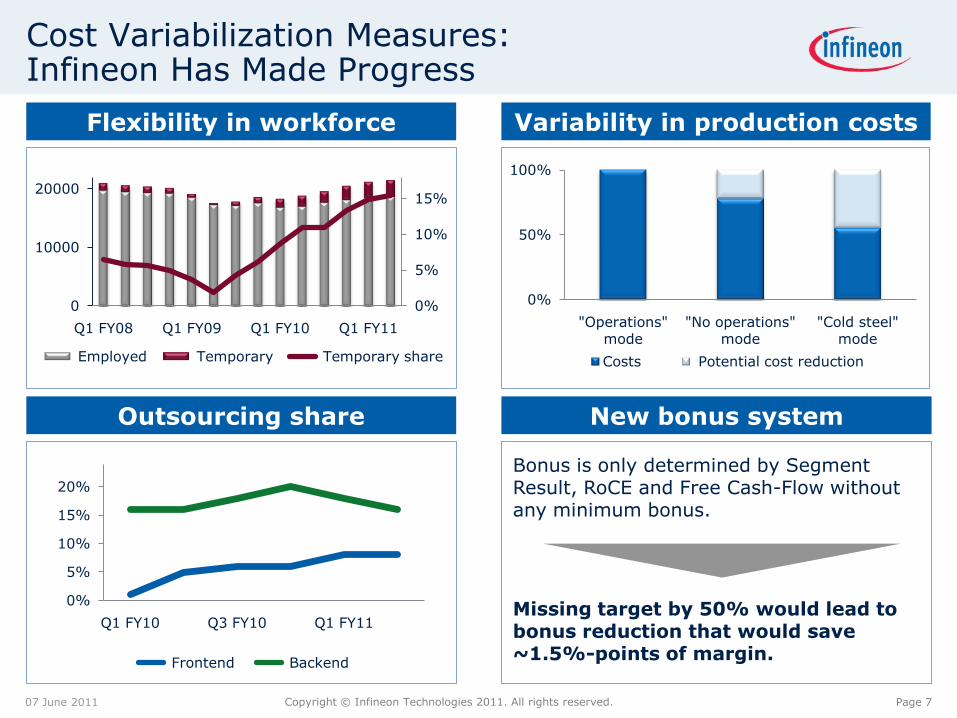
Cost Variabilization Measures:Infineon Has Made Progress
07 June 2011
Flexibility in workforce
Bonus is only determined by Segment Result, RoCE and Free Cash-Flow without any minimum bonus.
Missing target by 50% would lead to bonus reduction that would save ~1.5%-points of margin.
Variability in production costs
Outsourcing share New bonus system
0%
5%
10%
15%
0
10000
20000
Q1 FY08 Q1 FY09 Q1 FY10 Q1 FY11
Employed Temporary Temporary share
0%
50%
100%
"Operations"mode
"No operations"mode
"Cold steel"mode
Costs Potential cost reduction
0%
5%
10%
15%
20%
Q1 FY10 Q3 FY10 Q1 FY11
Frontend Backend
Page 8Copyright © Infineon Technologies 2011. All rights reserved.
10%
11%
12%
13%
14%
15%
16%
0
100
200
300
400
FY09 FY10 FY11e longer term
FY09 FY10 FY11e longer term
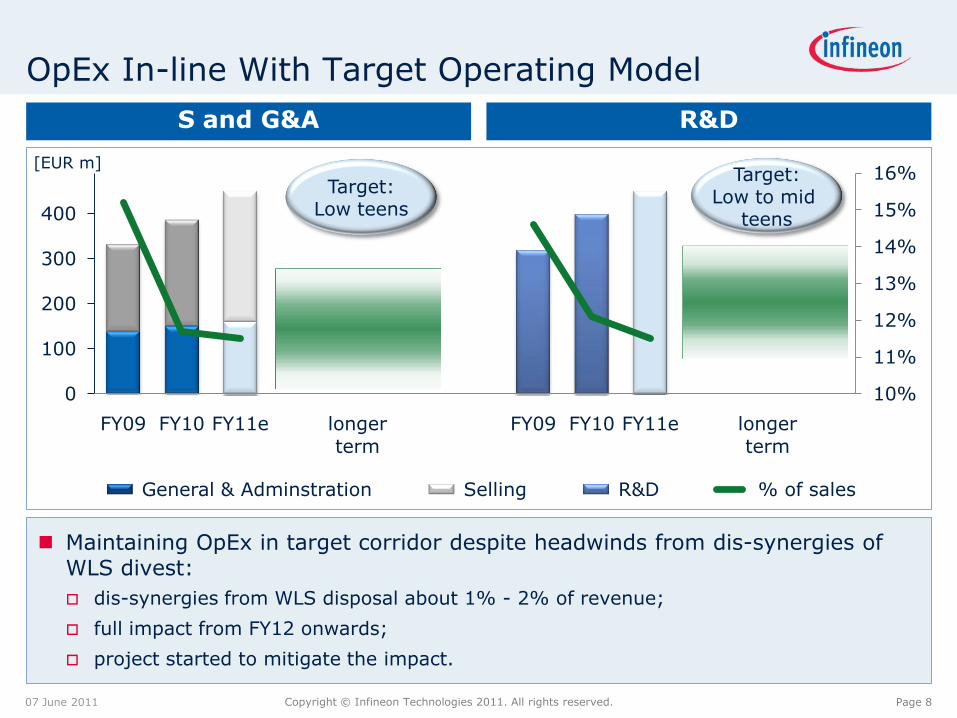
General & Adminstration Selling R&D % of sales
OpEx In-line With Target Operating Model
07 June 2011
S and G&A R&D
[EUR m]
Maintaining OpEx in target corridor despite headwinds from dis-synergies of WLS divest:
dis-synergies from WLS disposal about 1% - 2% of revenue;
full impact from FY12 onwards;
project started to mitigate the impact.
Target:Low to mid
teens
Target:Low teens
Page 9Copyright © Infineon Technologies 2011. All rights reserved.
Table of Contents
07 June 2011
Introduction
Explaining the Target Operating Model
FX, Interest, Tax and Working Capital
Investments and D&A
Capital Structure and Use of Cash
Summary
Page 10Copyright © Infineon Technologies 2011. All rights reserved.
0%
100%
month+0 month+1 month+2
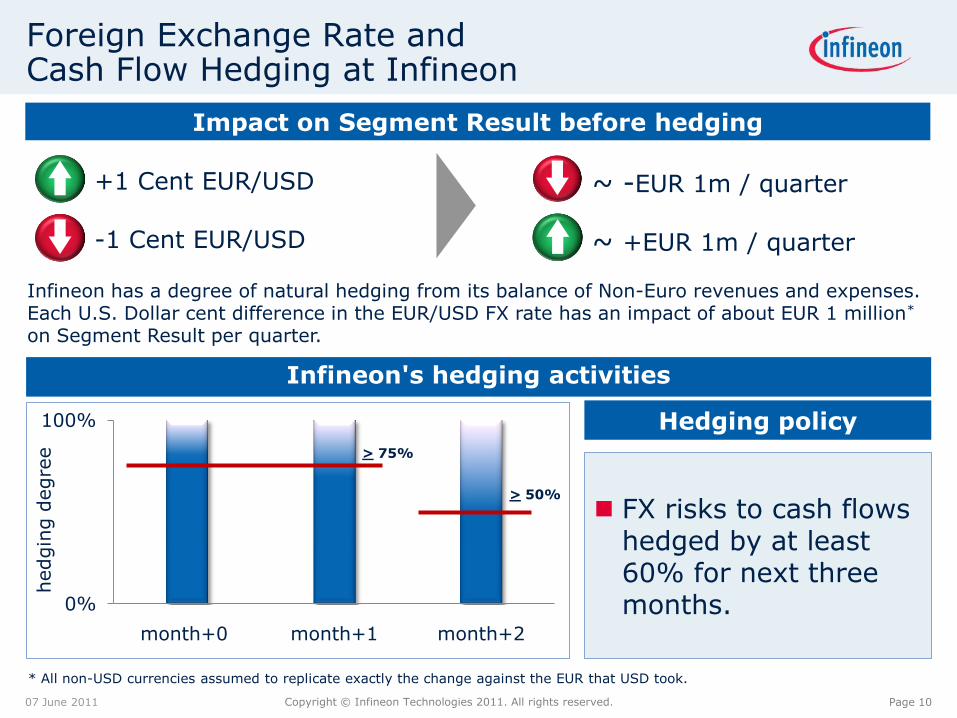
Foreign Exchange Rate and Cash Flow Hedging at Infineon
07 June 2011
Infineon's hedging activities
Impact on Segment Result before hedging
FX risks to cash flowshedged by at least 60% for next threemonths.
Infineon has a degree of natural hedging from its balance of Non-Euro revenues and expenses. Each U.S. Dollar cent difference in the EUR/USD FX rate has an impact of about EUR 1 million*
on Segment Result per quarter.
+1 Cent EUR/USD ~ -EUR 1m / quarter
-1 Cent EUR/USD ~ +EUR 1m / quarter
hedgin
gdegre
e
> 50%
> 75%
Hedging policy
* All non-USD currencies assumed to replicate exactly the change against the EUR that USD took.
Page 11Copyright © Infineon Technologies 2011. All rights reserved.
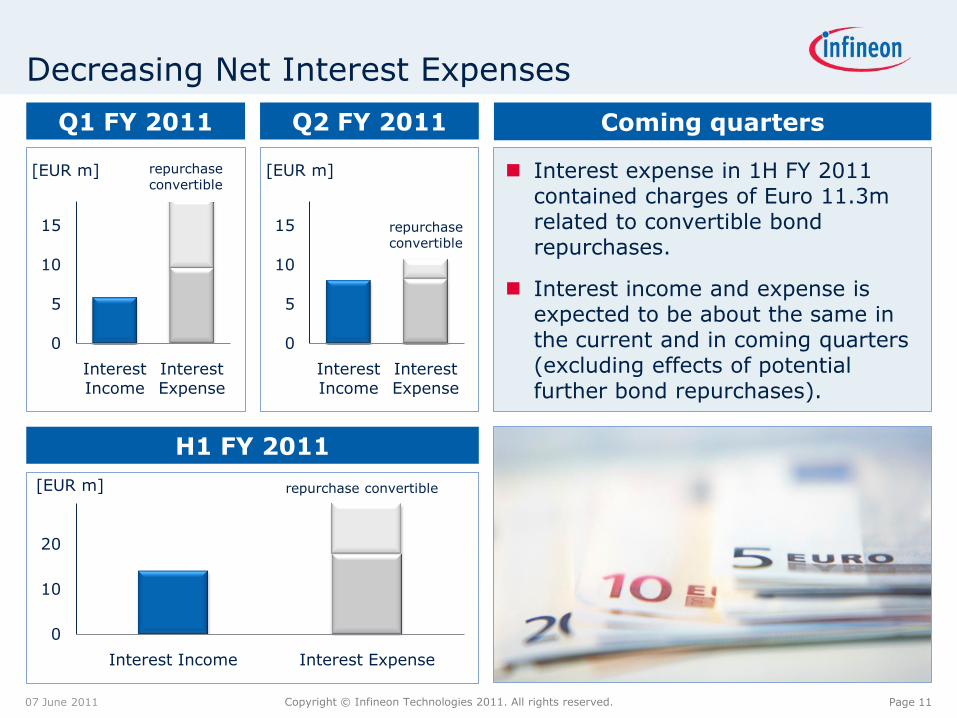
Q1 FY 2011 Coming quarters
Interest expense in 1H FY 2011 contained charges of Euro 11.3m related to convertible bondrepurchases.
Interest income and expense isexpected to be about the same in the current and in coming quarters(excluding effects of potential further bond repurchases).
Decreasing Net Interest Expenses
07 June 2011
[EUR m]
0
5
10
15
Interest Income
Interest Expense
Q2 FY 2011
0
5
10
15
Interest Income
Interest Expense
H1 FY 2011
0
10
20
Interest Income Interest Expense
[EUR m]
[EUR m] repurchase convertible
repurchaseconvertible
repurchaseconvertible
Page 12Copyright © Infineon Technologies 2011. All rights reserved.
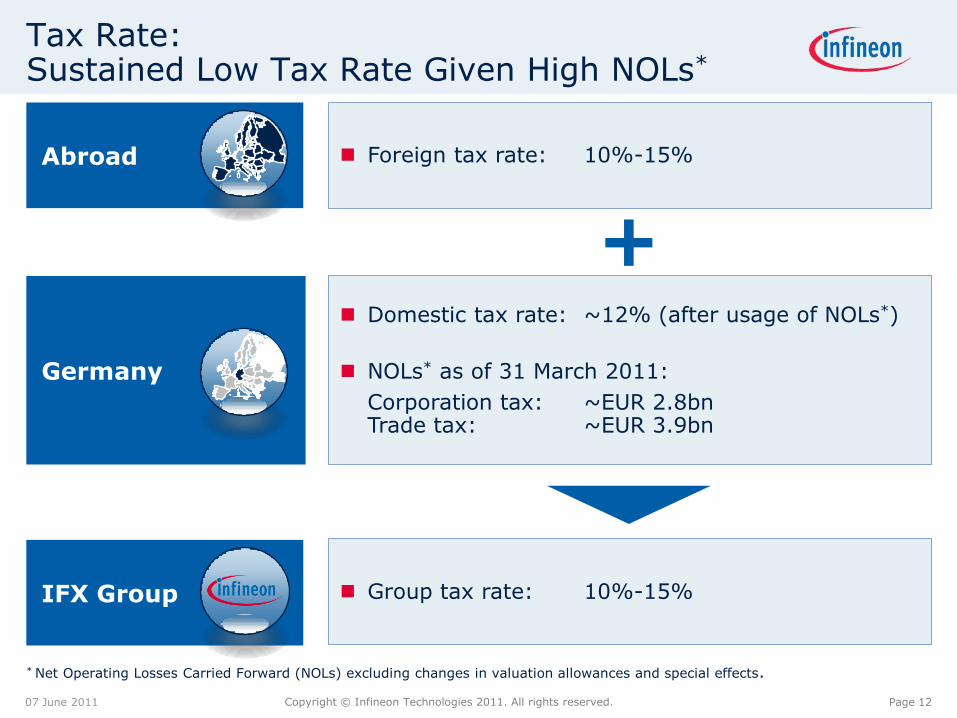
IFX Group
Germany
Abroad
Domestic tax rate: ~12% (after usage of NOLs*)
NOLs* as of 31 March 2011:
Corporation tax: ~EUR 2.8bnTrade tax: ~EUR 3.9bn
* Net Operating Losses Carried Forward (NOLs) excluding changes in valuation allowances and special effects.
Tax Rate:Sustained Low Tax Rate Given High NOLs*
07 June 2011
Foreign tax rate: 10%-15%
+
Group tax rate: 10%-15%
Page 13Copyright © Infineon Technologies 2011. All rights reserved.
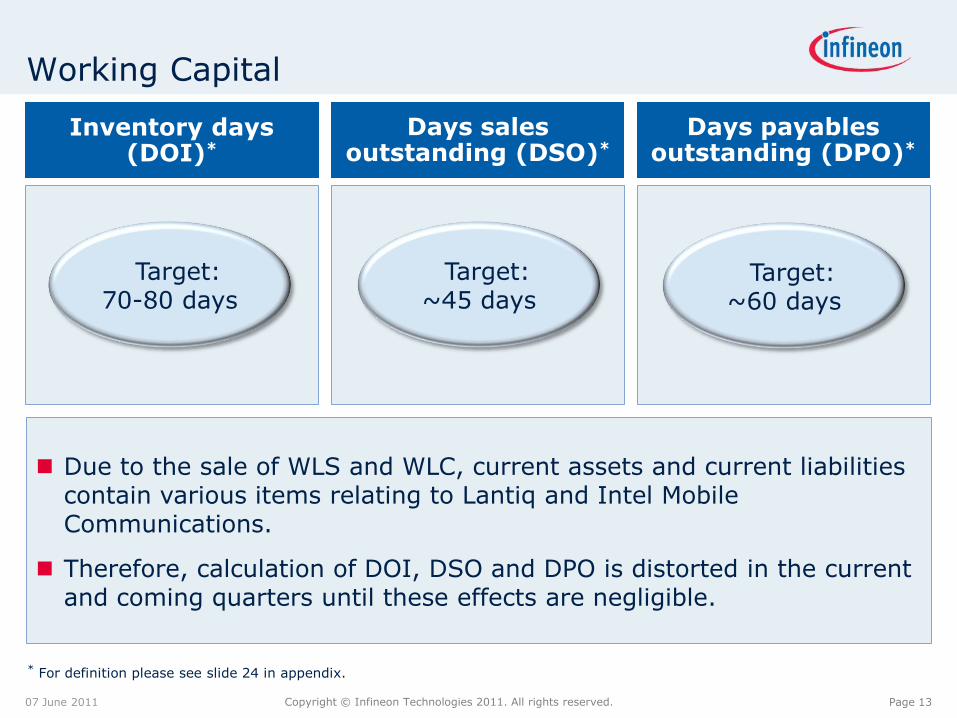
Working Capital
07 June 2011
16% 16% 17% 17% 19%
25% 25%24%22%18%
10% 13%10%5%3%
Due to the sale of WLS and WLC, current assets and current liabilitiescontain various items relating to Lantiq and Intel Mobile Communications.
Therefore, calculation of DOI, DSO and DPO is distorted in the currentand coming quarters until these effects are negligible.
Inventory days (DOI)*
Days payables outstanding (DPO)*
Target:70-80 days
Target:~45 days
Target:~60 days
Days sales outstanding (DSO)*
* For definition please see slide 24 in appendix.
Page 14Copyright © Infineon Technologies 2011. All rights reserved.
Table of Contents
07 June 2011
Introduction
Explaining the Target Operating Model
FX, Interest, Tax and Working Capital
Capital Structure and Use of Cash
Summary
Investments and D&A
Page 15Copyright © Infineon Technologies 2011. All rights reserved.
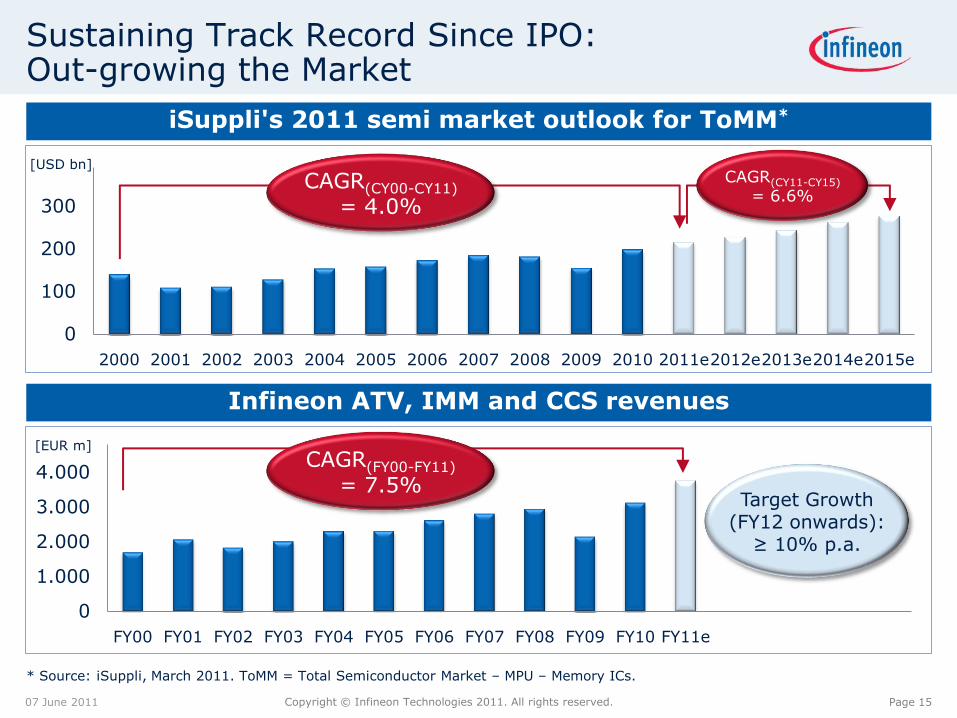
Sustaining Track Record Since IPO:Out-growing the Market
07 June 2011
* Source: iSuppli, March 2011. ToMM = Total Semiconductor Market – MPU – Memory ICs.
0
100
200
300
2000 2001 2002 2003 2004 2005 2006 2007 2008 2009 2010 2011e2012e2013e2014e2015e
0
1.000
2.000
3.000
4.000
FY00 FY01 FY02 FY03 FY04 FY05 FY06 FY07 FY08 FY09 FY10 FY11e
iSuppli's 2011 semi market outlook for ToMM*
Infineon ATV, IMM and CCS revenues
[USD bn]
[EUR m]
Target Growth(FY12 onwards):
≥ 10% p.a.
CAGR(CY00-CY11)
= 4.0%
CAGR(CY11-CY15)
= 6.6%
CAGR(FY00-FY11)
= 7.5%
Page 16Copyright © Infineon Technologies 2011. All rights reserved.
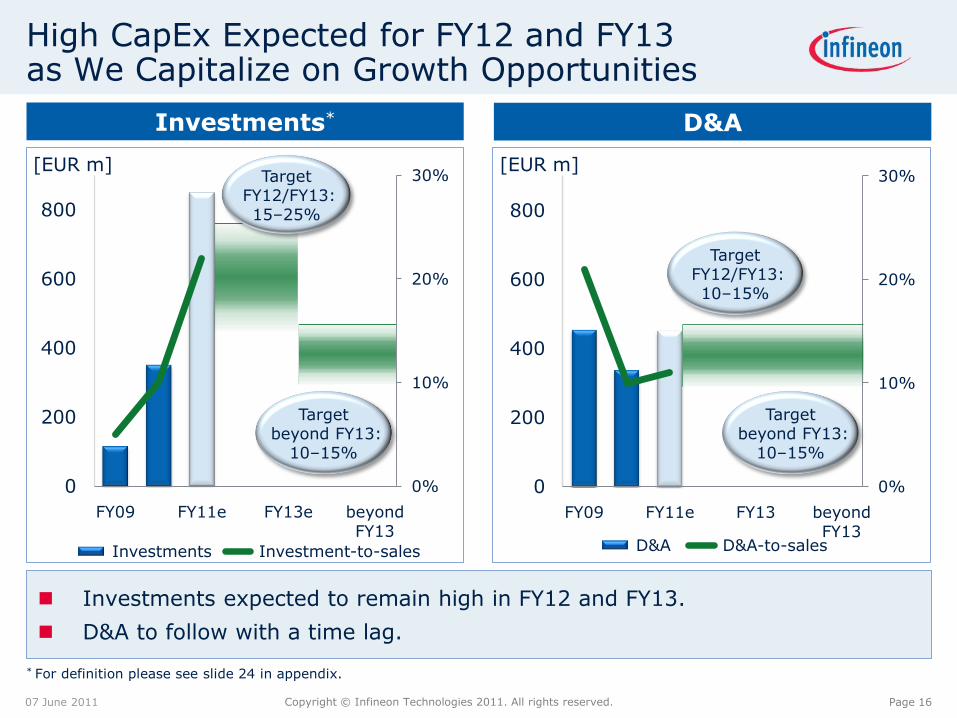
0%
10%
20%
30%
0
200
400
600
800
FY09 FY11e FY13e beyond FY13
Investments Investment-to-sales
0%
10%
20%
30%
0
200
400
600
800
FY09 FY11e FY13 beyond FY13
D&A D&A-to-sales
High CapEx Expected for FY12 and FY13 as We Capitalize on Growth Opportunities
07 June 2011
* For definition please see slide 24 in appendix.
D&A
[EUR m]
Investments*
[EUR m]
Targetbeyond FY13:
10–15%
Targetbeyond FY13:
10–15%
TargetFY12/FY13:10–15%
Investments expected to remain high in FY12 and FY13.
D&A to follow with a time lag.
TargetFY12/FY13:15–25%
Page 17Copyright © Infineon Technologies 2011. All rights reserved.
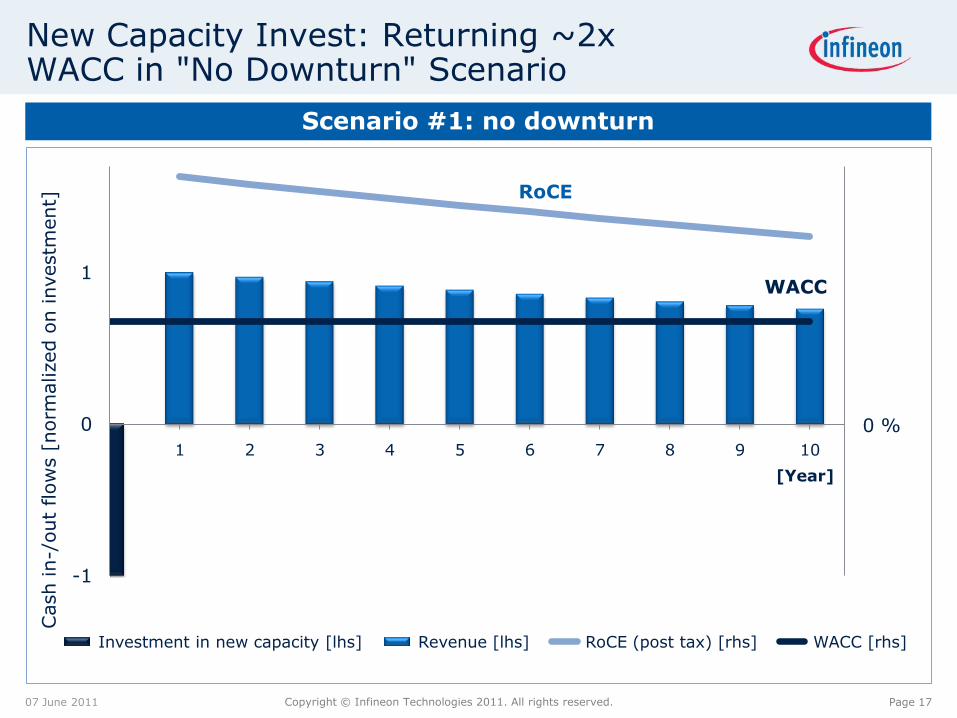
New Capacity Invest: Returning ~2x WACC in "No Downturn" Scenario
07 June 2011
-1
0
1
1 2 3 4 5 6 7 8 9 10
Investment in new capacity [lhs] Revenue [lhs] RoCE (post tax) [rhs] WACC [rhs]
Cash in-/
out
flow
s[n
orm
alized
on investm
ent]
Scenario #1: no downturn
WACC
RoCE
0 %
[Year]
Page 18Copyright © Infineon Technologies 2011. All rights reserved.
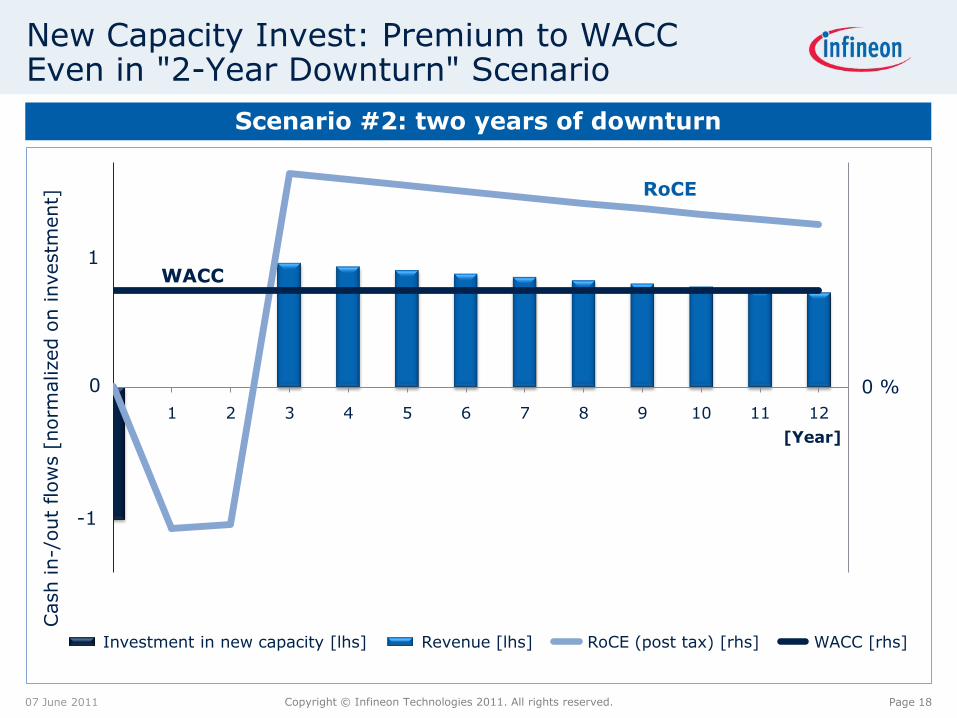
New Capacity Invest: Premium to WACC Even in "2-Year Downturn" Scenario
1 2 3 4 5 6 7 8 9 10 11 12
Investment in new capacity [lhs] Revenue [lhs] RoCE (post tax) [rhs] WACC [rhs]
Scenario #2: two years of downturn
WACC
-1
1
0 %0
[Year]
RoCE
Cash in-/
out
flow
s[n
orm
alized
on investm
ent]
07 June 2011
Page 19Copyright © Infineon Technologies 2011. All rights reserved.
Table of Contents
07 June 2011
Introduction
Explaining the Target Operating Model
FX, Interest, Tax and Working Capital
Investments and D&A
Summary
Capital Structure and Use of Cash
Page 20Copyright © Infineon Technologies 2011. All rights reserved.
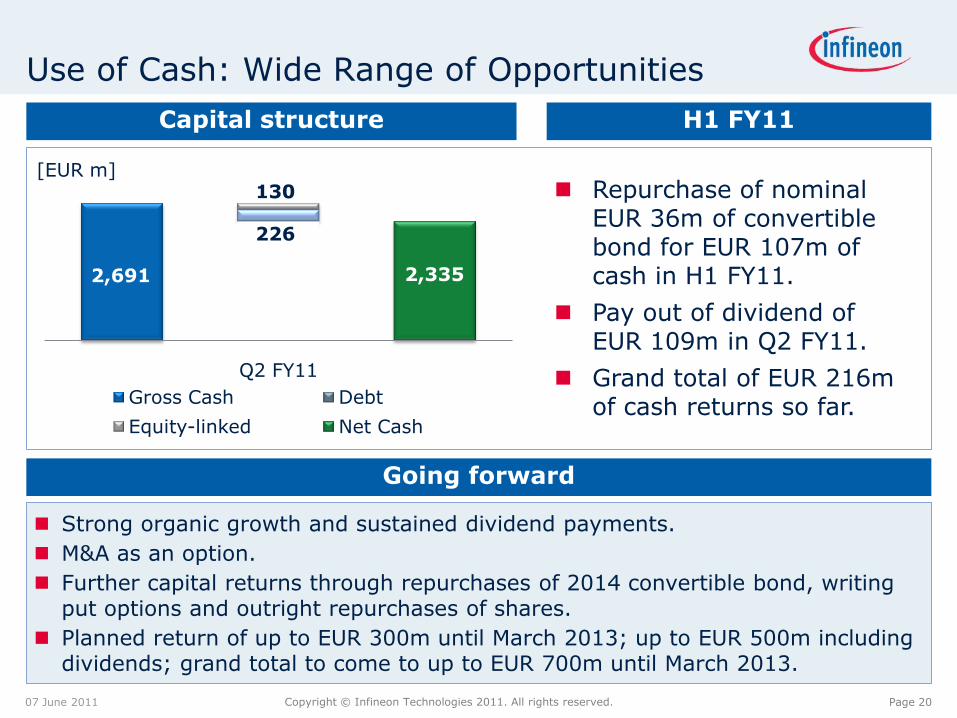
Use of Cash: Wide Range of Opportunities
07 June 2011
Going forward
H1 FY11Capital structure
2335
226
130
Q2 FY11
Gross Cash Debt
Equity-linked Net Cash
[EUR m] Repurchase of nominal
EUR 36m of convertible bond for EUR 107m of cash in H1 FY11.
Pay out of dividend ofEUR 109m in Q2 FY11.
Grand total of EUR 216m of cash returns so far.
Strong organic growth and sustained dividend payments.
M&A as an option.
Further capital returns through repurchases of 2014 convertible bond, writingput options and outright repurchases of shares.
Planned return of up to EUR 300m until March 2013; up to EUR 500m includingdividends; grand total to come to up to EUR 700m until March 2013.
2,691 2,335
Page 21Copyright © Infineon Technologies 2011. All rights reserved.
Table of Contents
07 June 2011
Introduction
Explaining the Target Operating Model
FX, Interest, Tax and Working Capital
Summary
Investments and D&A
Capital Structure and Use of Cash
Page 22Copyright © Infineon Technologies 2011. All rights reserved.
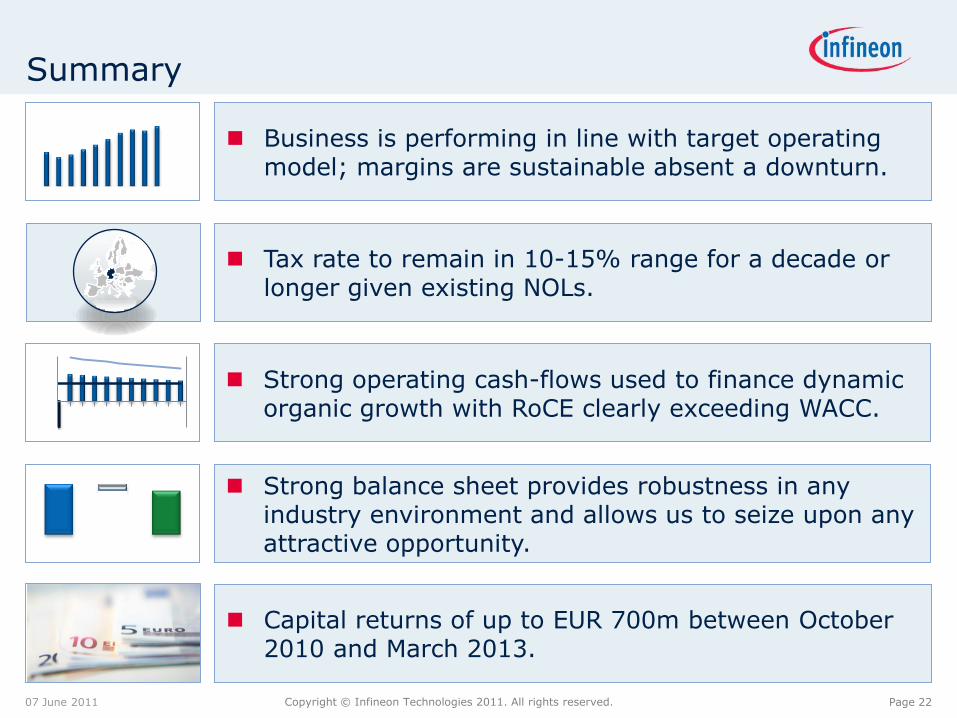
Summary
07 June 2011
Business is performing in line with target operating model; margins are sustainable absent a downturn.
Strong balance sheet provides robustness in any industry environment and allows us to seize upon any attractive opportunity.
Strong operating cash-flows used to finance dynamic organic growth with RoCE clearly exceeding WACC.
Tax rate to remain in 10-15% range for a decade or longer given existing NOLs.
Capital returns of up to EUR 700m between October2010 and March 2013.
-1
0
1

Page 24Copyright © Infineon Technologies 2011. All rights reserved.
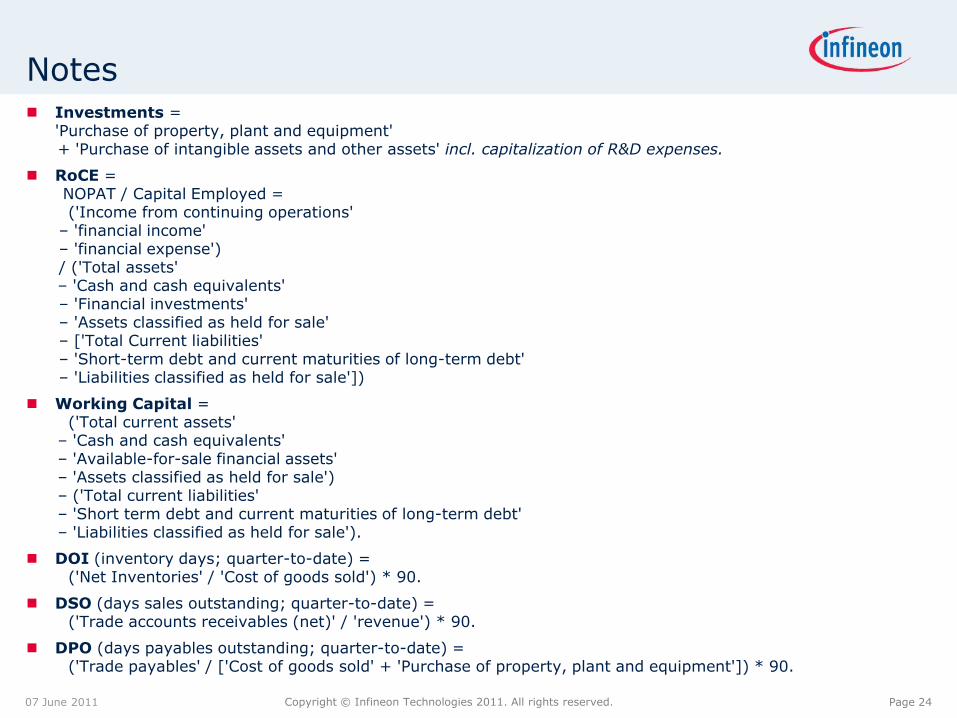
Notes
07 June 2011
Investments = 'Purchase of property, plant and equipment'+ 'Purchase of intangible assets and other assets' incl. capitalization of R&D expenses.
RoCE =NOPAT / Capital Employed = ('Income from continuing operations'
– 'financial income'– 'financial expense')/ ('Total assets'– 'Cash and cash equivalents'– 'Financial investments'– 'Assets classified as held for sale'– ['Total Current liabilities'– 'Short-term debt and current maturities of long-term debt'– 'Liabilities classified as held for sale'])
Working Capital =('Total current assets'
– 'Cash and cash equivalents'– 'Available-for-sale financial assets'– 'Assets classified as held for sale')– ('Total current liabilities'– 'Short term debt and current maturities of long-term debt'– 'Liabilities classified as held for sale').
DOI (inventory days; quarter-to-date) = ('Net Inventories' / 'Cost of goods sold') * 90.
DSO (days sales outstanding; quarter-to-date) = ('Trade accounts receivables (net)' / 'revenue') * 90.
DPO (days payables outstanding; quarter-to-date) = ('Trade payables' / ['Cost of goods sold' + 'Purchase of property, plant and equipment']) * 90.
Page 25Copyright © Infineon Technologies 2011. All rights reserved.
Disclaimer
This presentation was prepared as of June 7, 2011 and is current only as of that date.
This presentation includes forward-looking statements and assumptions about the future of Infineon's business and the industry in which we operate. These include statements and assumptions relating to general economic conditions, future developments in the world semiconductor market, our ability to manage our costs and to achieve our growth targets, the resolution of Qimonda's insolvency proceedings and the liabilities we may face as a result of Qimonda's insolvency the benefits of research and development alliances and activities, our planned levels of future investment, the introduction of new technology at our facilities, our continuing ability to offer commercially viable products, and our expected or projected future results.
These forward-looking statements are subject to a number of uncertainties, such as broader economic developments, including the sustainability of recent improvements in the market environment; trends in demand and prices for semiconductors generally and for our products in particular, as well as for the end-products, such as automobiles and consumer electronics, that incorporate our products; the success of our development efforts, both alone and with partners; the success of our efforts to introduce new production processes at our facilities; the actions of competitors; the continued availability of adequate funds; any mergers, acquisitions or dispositions we may undertake; the outcome of antitrust investigations and litigation matters; and the resolution of Qimonda's insolvency proceedings; as well as the other factors mentioned in this presentation and those disclosed at other occasions.
As a result, Infineon's actual results could differ materially from those contained in or suggested by these forward-looking statements. You are cautioned not to place undue reliance on these forward-looking statements. Infineon does not undertake any obligation to publicly update or revise any forward-looking statements in light of developments which differ from those anticipated.
07 June 2011