Ifrei West Africa
48
IESE Business School - Barcelona - 2012 Page 1 IESE Family-Responsible environment (FRe) Index for the World and West Africa Prof. Nuria Chinchilla Prof. Mireia Las Heras
-
Upload
mireia-las-heras -
Category
Presentations & Public Speaking
-
view
19 -
download
0
Transcript of Ifrei West Africa
© IESE Business School - Barcelona - 2012 Page 1
IESE Family-Responsible environment (FRe) Indexfor the World and West Africa
Prof. Nuria Chinchilla
Prof. Mireia Las Heras
© IESE Business School - Barcelona - 2012 Page 2
In collaboration with:
Florence Lokossou
© IESE Business School - Barcelona - 2012 Page 3
The Corporate Sponsors of the International Center for Work and Family
© IESE Business School - Barcelona - 2012 Page 4
Principal Objetive
To show the impact of family-responsible policies, practices and leadership on your health, your commitment to loyalty,
your intention to leave to the company, and your satisfaction.
© IESE Business School - Barcelona - 2012 Page 5
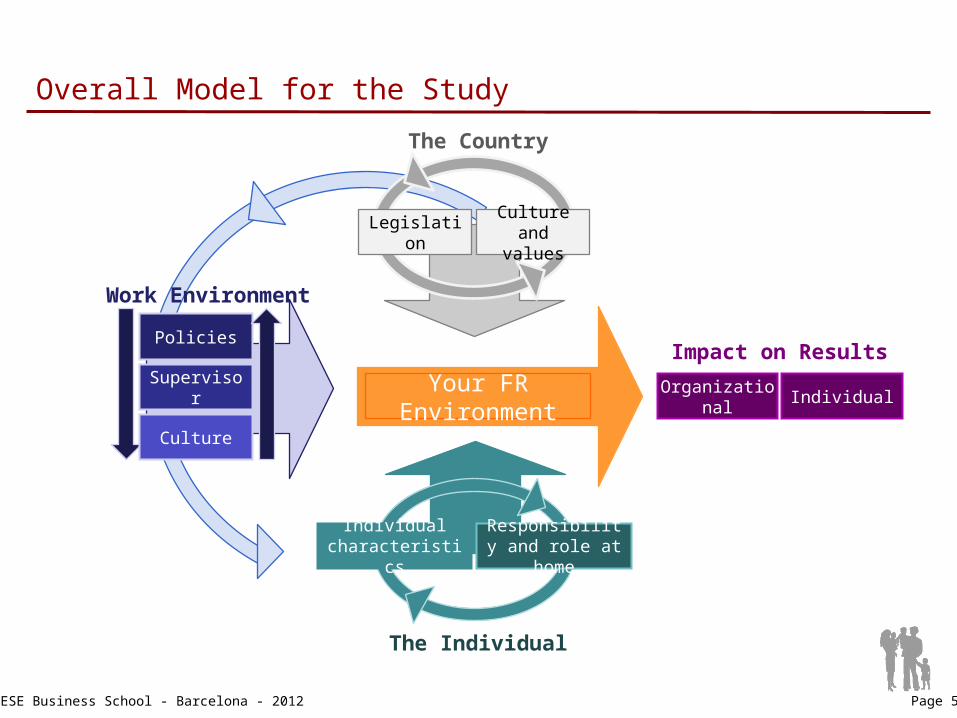
Overall Model for the Study
The Country
LegislationCulture
and values
The Individual
Individual characteristics
Responsibility and role at
home
Policies
Work Environment
Supervisor
Culture
Your FR Environment
Organizational
Individual
Impact on Results
© IESE Business School - Barcelona - 2012 Page 6
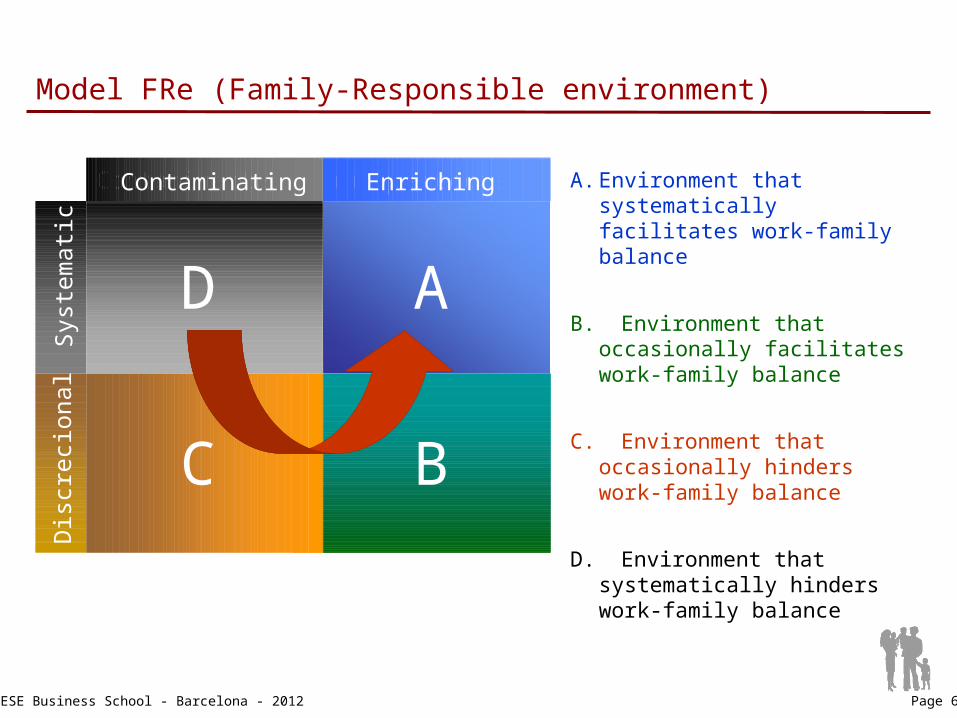
Model FRe (Family-Responsible environment)
EnriquecedoraContaminante
BC
AD
EnrichingContaminating
BC
AD
Dis
creci
onal
Syst
em
ati
c
A. Environment that systematically facilitates work-family balance
B. Environment that occasionally facilitates work-family balance
C. Environment that occasionally hinders work-family balance
D. Environment that systematically hinders work-family balance
© IESE Business School - Barcelona - 2012 Page 7
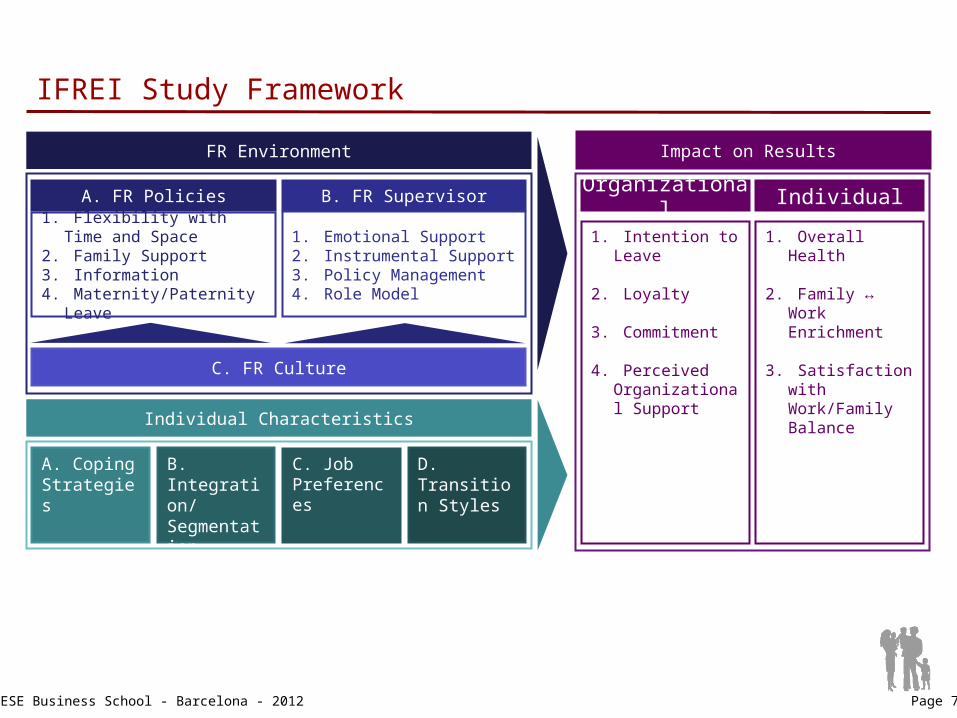
IFREI Study Framework
A. FR Policies1. Flexibility with Time and
Space2. Family Support3. Information4. Maternity/Paternity
Leave
C. FR Culture
B. FR Supervisor
1. Emotional Support2. Instrumental Support3. Policy Management4. Role Model
Impact on Results
1. Intention to Leave
2. Loyalty
3. Commitment
4. Perceived Organizational Support
Organizational Individual
FR Environment
Individual Characteristics
A. Coping Strategies
B. Integration/ Segmentation Preferences
C. Job Preferences
D. Transition Styles
1. Overall Health
2. Family ↔ Work Enrichment
3. Satisfaction with Work/Family Balance
© IESE Business School - Barcelona - 2012 Page 8
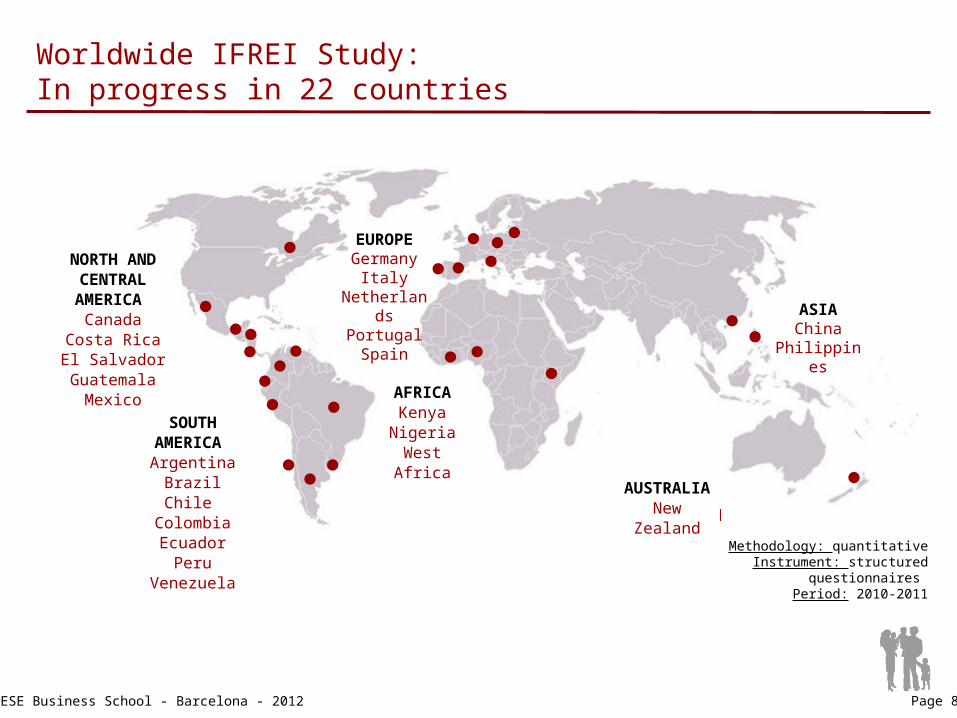
Worldwide IFREI Study: In progress in 22 countries
Nueva Zeland
a
SOUTH AMERICA Argentina
BrazilChile
ColombiaEcuador
PeruVenezuela
NORTH AND CENTRAL AMERICA
CanadaCosta RicaEl SalvadorGuatemala
Mexico AFRICAKenyaNigeria
West Africa
ASIAChina
Philippines
EUROPEGermany
ItalyNetherland
sPortugal
Spain
AUSTRALIA
New Zealand Methodology: quantitative
Instrument: structured questionnaires Period: 2010-2011

© IESE Business School - Barcelona - 2012 Page 9
Participation in the Worldwide IFREI Study
Women: 2161 / 40%
Women with children: 54%
Women without children: 46%
Men: 3288 / 60%
Men with children: 66%
Men without children: 34%
Women without management responsibility: 48%
Men with management responsibility: 61%
Men without management responsibility: 39%
Women with management responsibility: 52%
60%
40%
49%
51%
71%
29%
60%
40%With childrenWithout children With children
Without children
© IESE Business School - Barcelona - 2012 Page 10
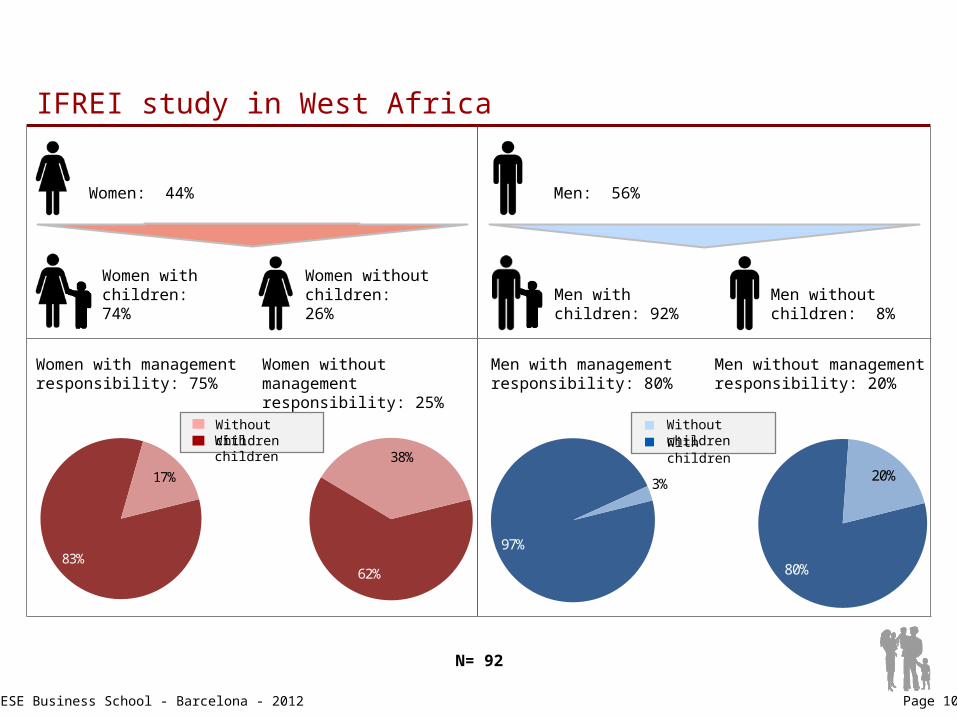
IFREI study in West Africa
With childrenWithout children With children
Without children
Women: 44%
Women with children: 74%
Women without children: 26%
Men: 56%
Men with children: 92%
Men without children: 8%
Women without management responsibility: 25%
Men with management responsibility: 80%
Men without management responsibility: 20%
Women with management responsibility: 75%
N= 92
83%
17%
62%
38%
97%
3%
80%
20%
© IESE Business School - Barcelona - 2012 Page 11
EnriquecedoraContaminante
BC
AD
EnrichingContaminating
Dis
creci
onal
Syst
em
ati
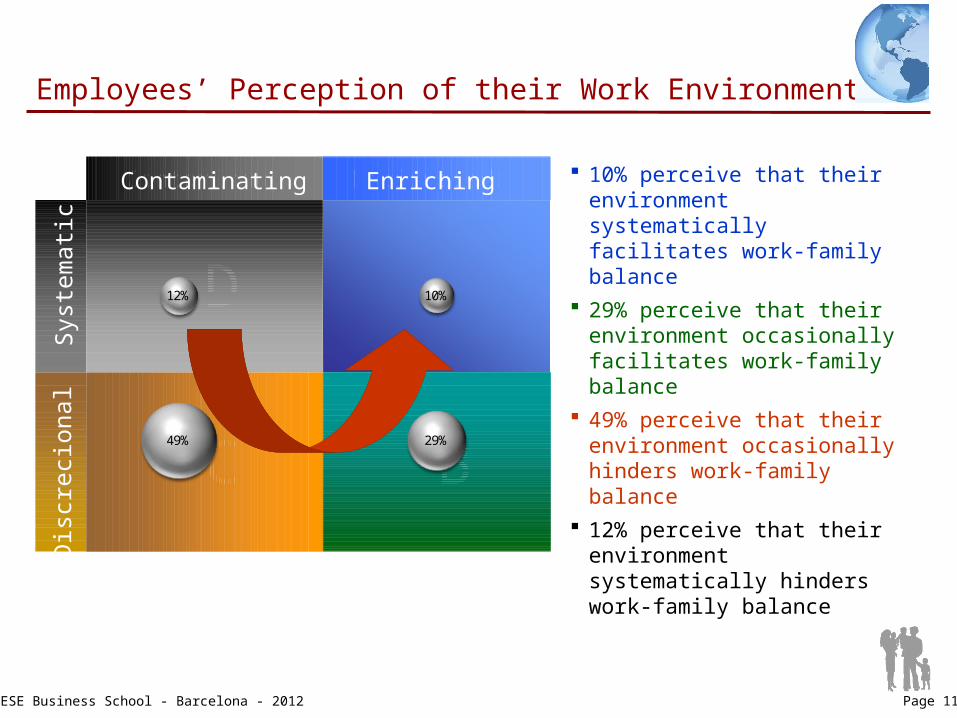
cEmployees’ Perception of their Work Environment
10% perceive that their environment systematically facilitates work-family balance
29% perceive that their environment occasionally facilitates work-family balance
49% perceive that their environment occasionally hinders work-family balance
12% perceive that their environment systematically hinders work-family balance
10%
29%49%
12%
© IESE Business School - Barcelona - 2012 Page 12
EnriquecedoraContaminante
BC
AD
EnrichingContaminating
Dis
creci
onal
Syst
em
ati
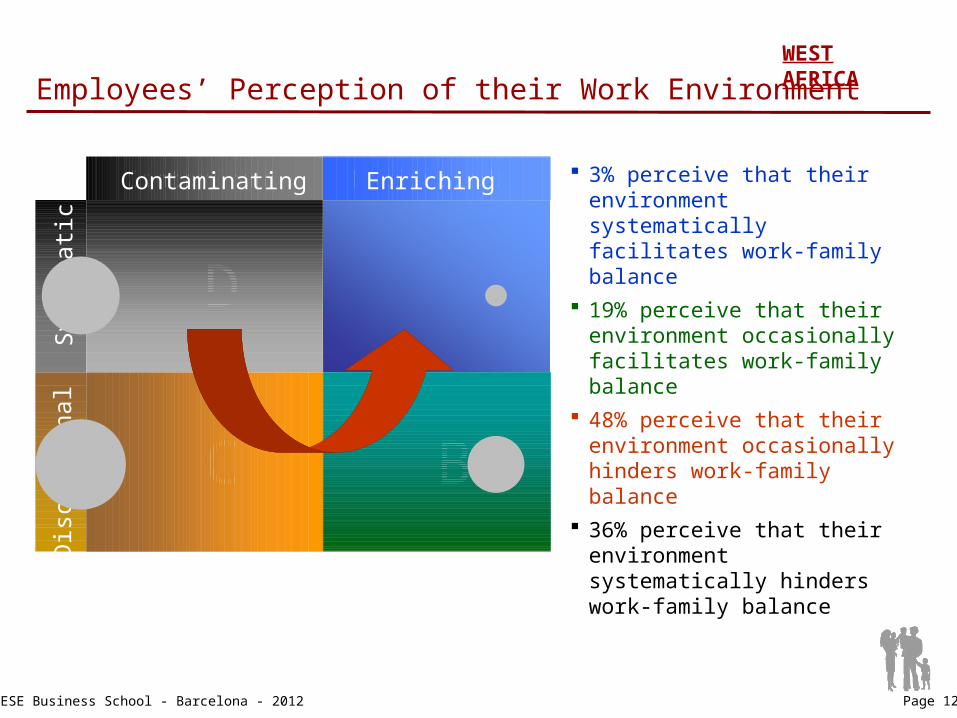
cEmployees’ Perception of their Work Environment
3% perceive that their environment systematically facilitates work-family balance
19% perceive that their environment occasionally facilitates work-family balance
48% perceive that their environment occasionally hinders work-family balance
36% perceive that their environment systematically hinders work-family balance
WEST AFRICA

© IESE Business School - Barcelona - 2012 Page 13
Family-Responsible Environment:
Policies
© IESE Business School - Barcelona - 2012 Page 14
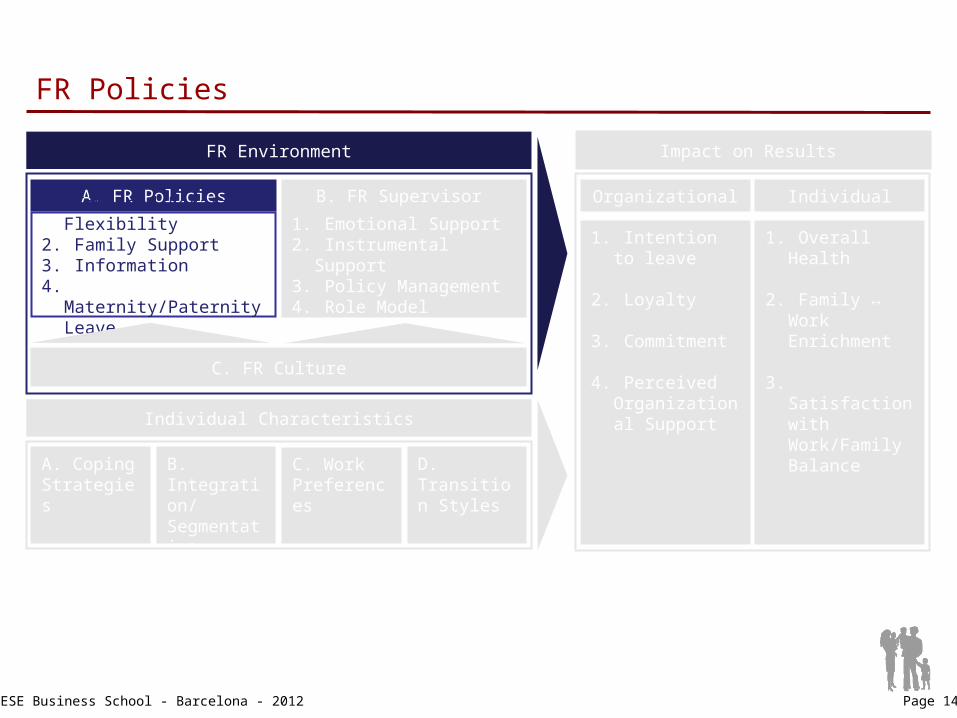
FR Policies
A. FR Policies1. Time and Location
Flexibility2. Family Support3. Information4. Maternity/Paternity
Leave
C. FR Culture
B. FR Supervisor
Impact on Results
1. Intention to leave
2. Loyalty
3. Commitment
4. Perceived Organizational Support
Organizational Individual
FR Environment
1. Overall Health
2. Family ↔ Work Enrichment
3. Satisfaction with Work/Family Balance
Individual Characteristics
A. Coping Strategies
B. Integration/ Segmentation Preferences
C. Work Preferences
D. Transition Styles
1. Emotional Support2. Instrumental Support3. Policy Management4. Role Model
© IESE Business School - Barcelona - 2012 Page 15
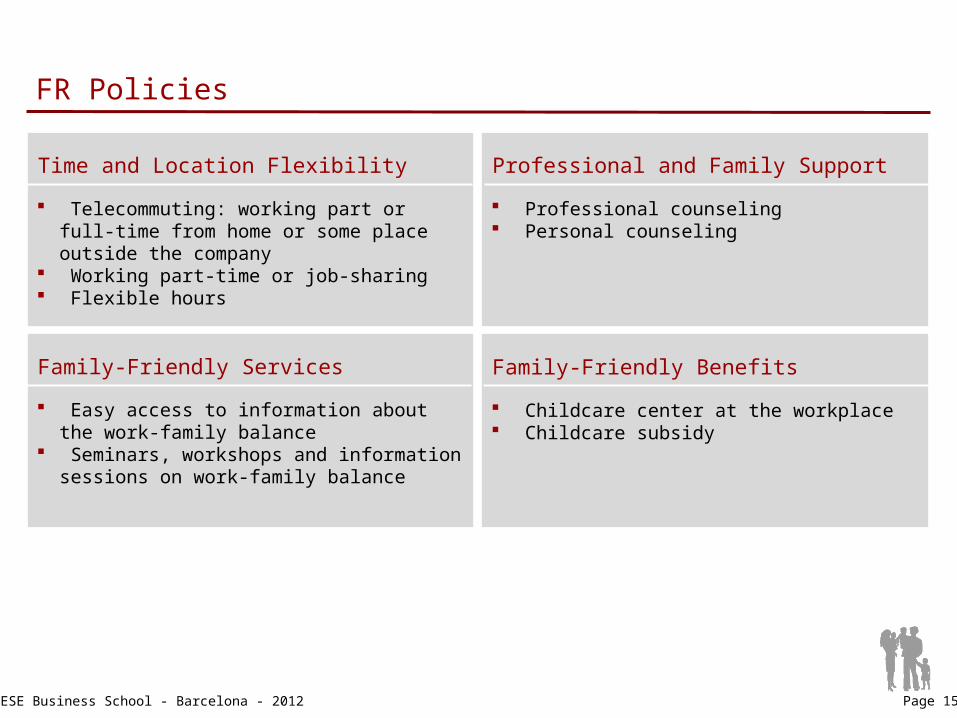
FR Policies
Telecommuting: working part or full-time from home or some place outside the company
Working part-time or job-sharing Flexible hours
Time and Location Flexibility
Professional counseling Personal counseling
Professional and Family Support
Easy access to information about the work-family balance
Seminars, workshops and information sessions on work-family balance
Family-Friendly Services
Childcare center at the workplace Childcare subsidy
Family-Friendly Benefits
© IESE Business School - Barcelona - 2012 Page 16
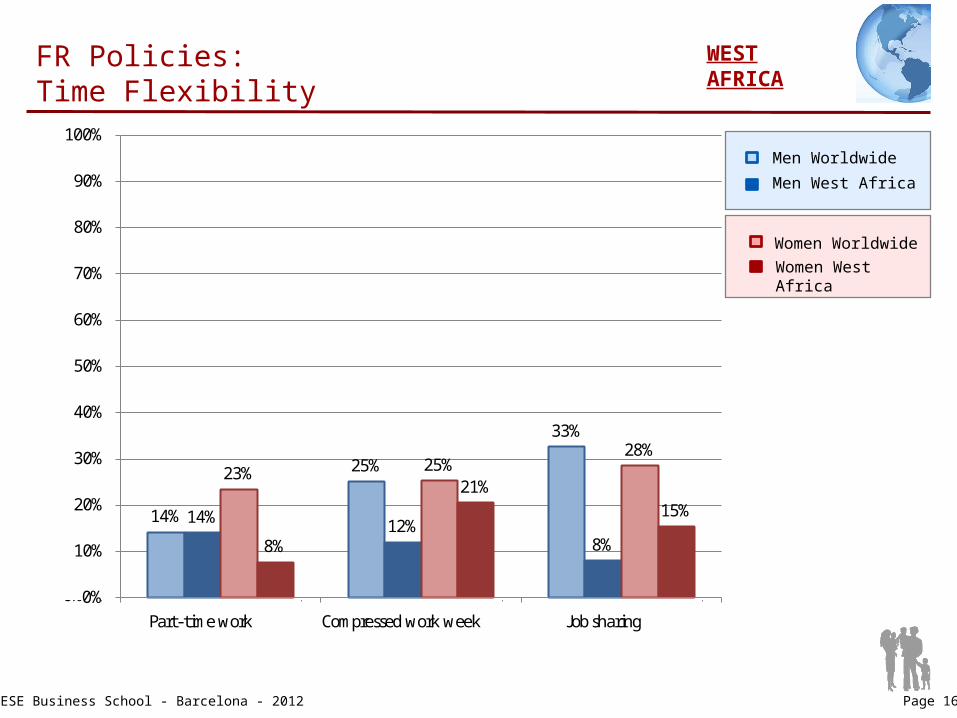
FR Policies: Time Flexibility
Men West Africa
Men Worldwide
Women WorldwideWomen West Africa
14%
25%
33%
6%
15%
23%24% 25%29%
13%16%
25%
0%
10%
20%
30%
40%
50%
60%
70%
80%
90%
100%
Part-time work Compressed work week Job sharing
WEST AFRICA
14%
25%
33%
14% 12%8%
23% 25%28%
8%
21%15%
0%
10%
20%
30%
40%
50%
60%
70%
80%
90%
100%
Trabajo a tiempo parcial Semana comprimida Trabajo compartido
© IESE Business School - Barcelona - 2012 Page 17
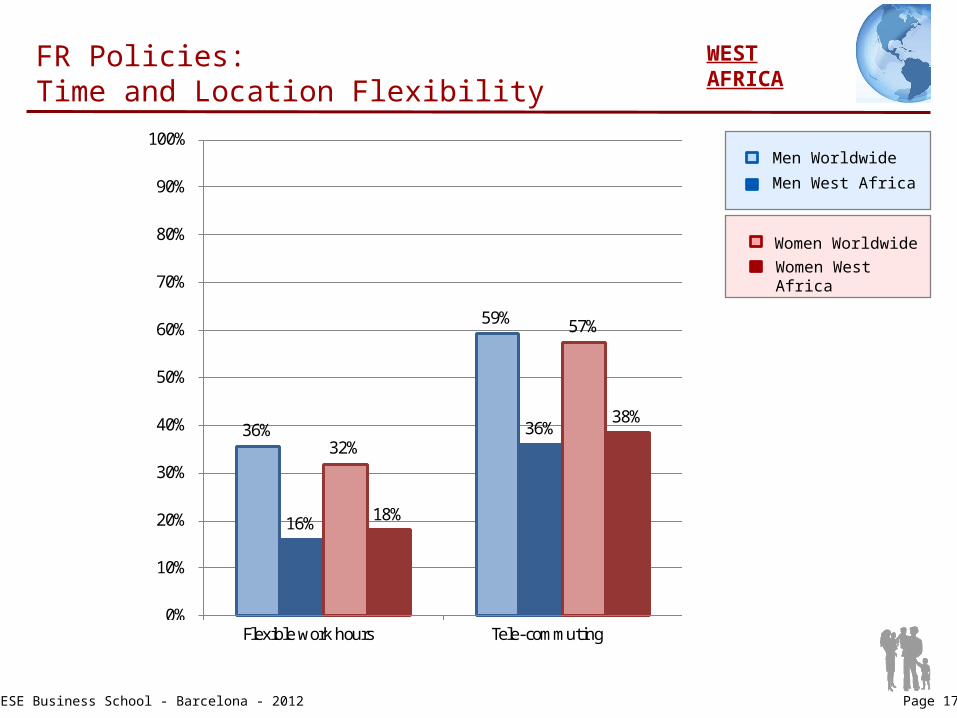
FR Policies: Time and Location Flexibility
Men West Africa
Men Worldwide
Women WorldwideWomen West Africa
36%
60%
25%
43%
32%
58%
21%
40%
0%
10%
20%
30%
40%
50%
60%
70%
80%
90%
100%
Flexible work hours Tele-commuting
WEST AFRICA
36%
59%
16%
36%32%
57%
18%
38%
0%
10%
20%
30%
40%
50%
60%
70%
80%
90%
100%
Teletrabajo Horario flexible

© IESE Business School - Barcelona - 2012 Page 18
FR Policies: Family Support
6%
20%
40%
5%
35%
54%
13%
22%
44%
12%
22%
53%
0%
10%
20%
30%
40%
50%
60%
70%
Childcare center at work Subsidy for childcare Permission to leave due to a family emergency
Men West Africa
Men Worldwide Women WorldwideWomen West Africa
WEST AFRICA
6%
20%
40%
4%
12%18%
12%
22%
44%
3%8%
23%
0%
10%
20%
30%
40%
50%
60%
70%
80%
90%
100%
Guardería Subsidio para cuidado de niños Excedencia para cuidar de un familiar
© IESE Business School - Barcelona - 2012 Page 19
Family-Responsible Environment: Supervisor
© IESE Business School - Barcelona - 2012 Page 20
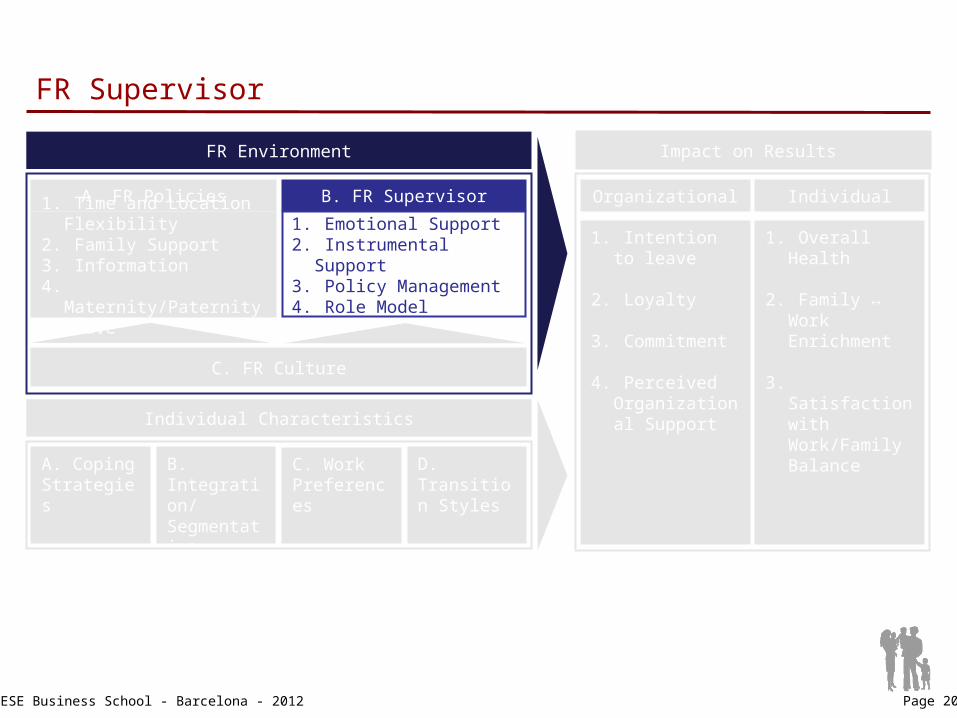
FR Supervisor
Impact on Results
1. Intention to leave
2. Loyalty
3. Commitment
4. Perceived Organizational Support
Organizational Individual
1. Overall Health
2. Family ↔ Work Enrichment
3. Satisfaction with Work/Family Balance
Individual Characteristics
A. Coping Strategies
B. Integration/ Segmentation Preferences
C. Work Preferences
D. Transition Styles
B. FR Supervisor
1. Emotional Support2. Instrumental Support3. Policy Management4. Role Model
FR Environment
C. FR Culture
A. FR Policies1. Time and Location
Flexibility2. Family Support3. Information4. Maternity/Paternity
Leave
© IESE Business School - Barcelona - 2012 Page 21
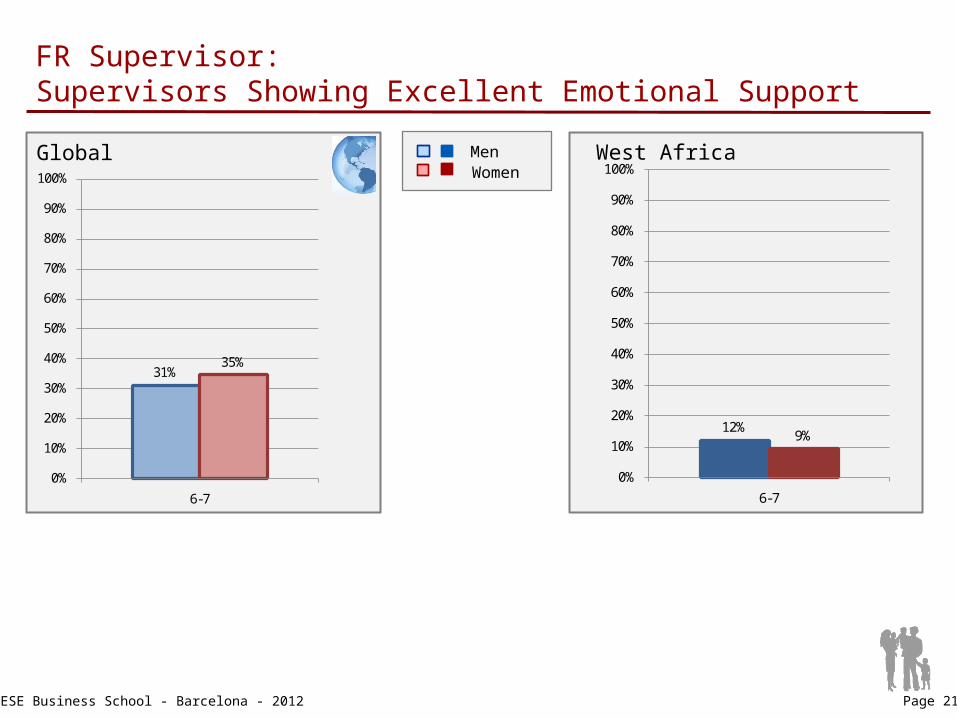
FR Supervisor: Supervisors Showing Excellent Emotional Support
Global West AfricaWomenMen
31%35%
0%
10%
20%
30%
40%
50%
60%
70%
80%
90%
100%
6-7
12%9%
0%
10%
20%
30%
40%
50%
60%
70%
80%
90%
100%
6-7
© IESE Business School - Barcelona - 2012 Page 22
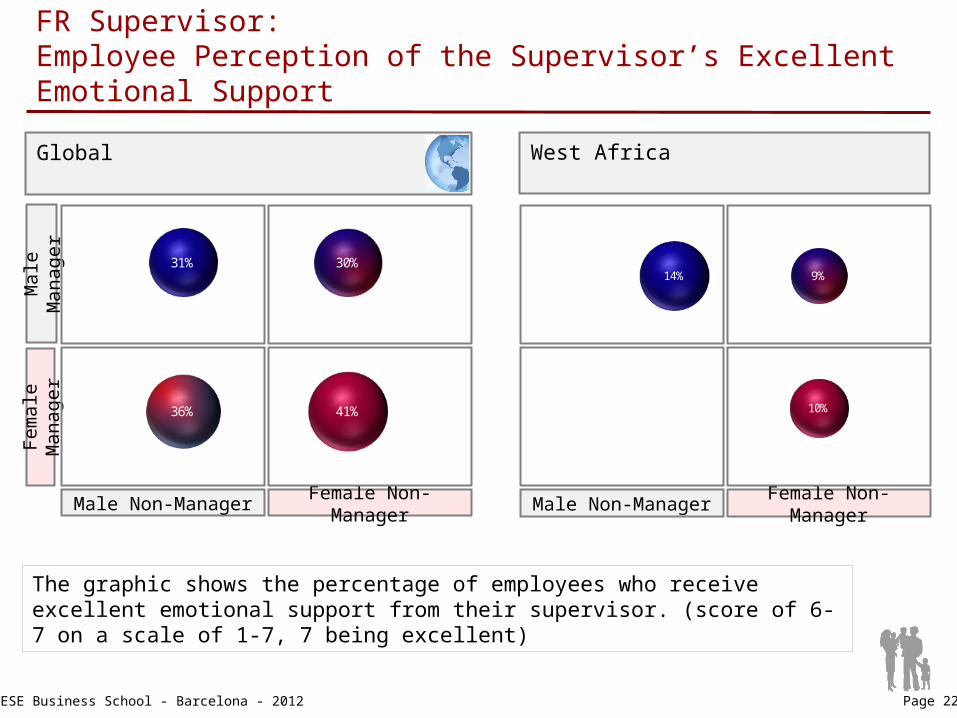
FR Supervisor:Employee Perception of the Supervisor’s Excellent Emotional Support
The graphic shows the percentage of employees who receive excellent emotional support from their supervisor. (score of 6-7 on a scale of 1-7, 7 being excellent)
Male
M
an
ag
er
Fem
ale
M
an
ag
er
Female Non-Manager
Male Non-Manager
Global West Africa
Female Non-Manager
Male Non-Manager
30%
41%36%
31%9%
10%
14%
© IESE Business School - Barcelona - 2012 Page 23
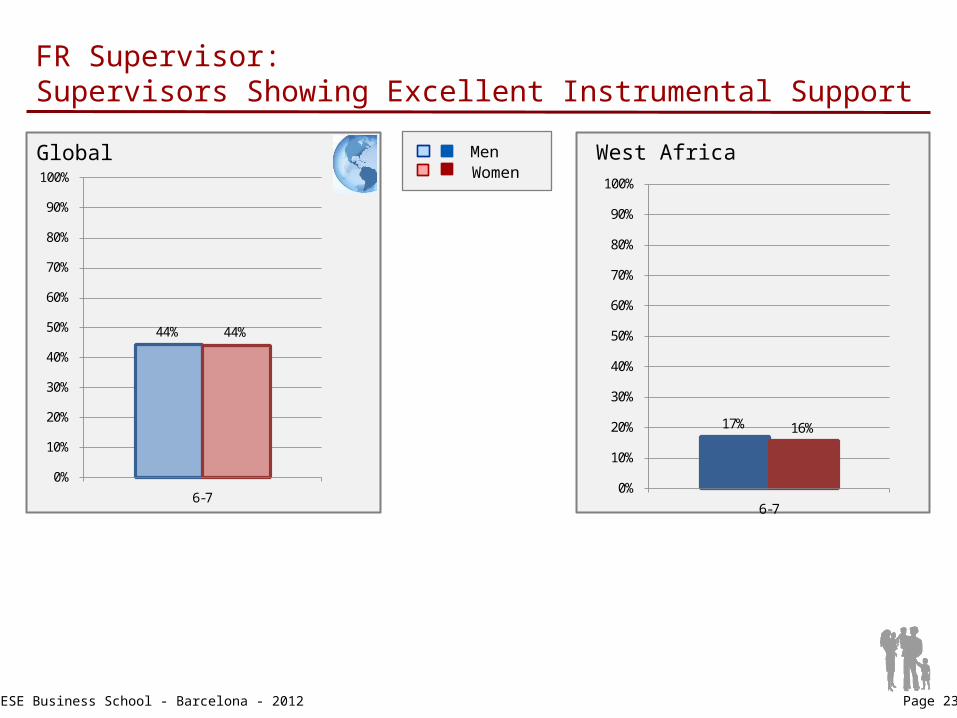
FR Supervisor: Supervisors Showing Excellent Instrumental Support
Global West AfricaWomenMen
44% 44%
0%
10%
20%
30%
40%
50%
60%
70%
80%
90%
100%
6-7
17% 16%
0%
10%
20%
30%
40%
50%
60%
70%
80%
90%
100%
6-7
© IESE Business School - Barcelona - 2012 Page 24
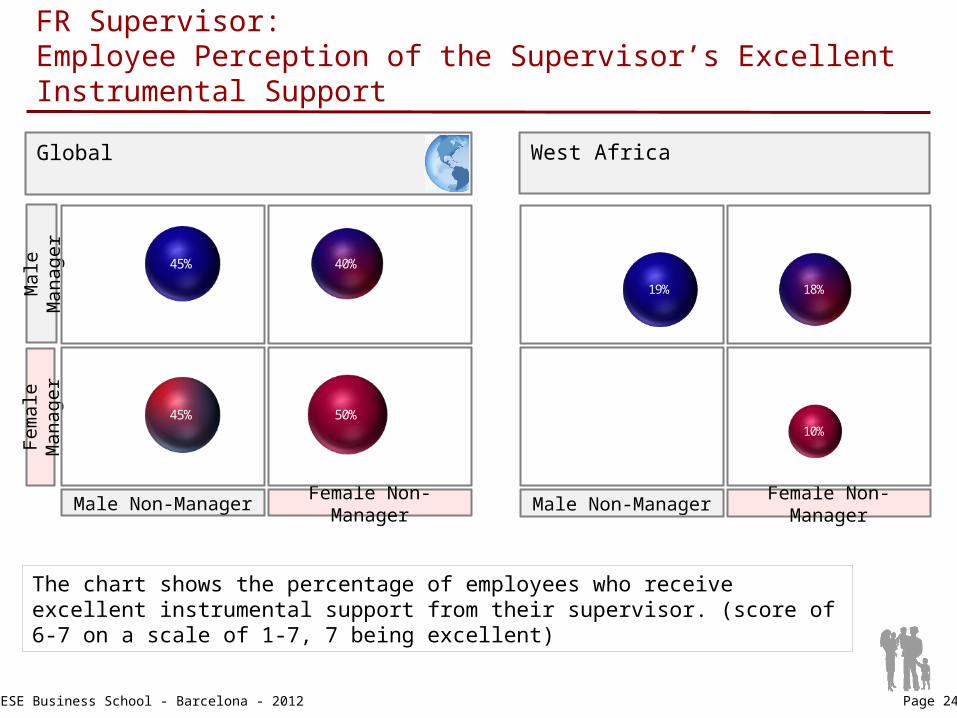
FR Supervisor:Employee Perception of the Supervisor’s Excellent Instrumental Support
The chart shows the percentage of employees who receive excellent instrumental support from their supervisor. (score of 6-7 on a scale of 1-7, 7 being excellent)
Male
M
an
ag
er
Fem
ale
M
an
ag
er
Female Non-Manager
Male Non-Manager
Global West Africa
Female Non-Manager
Male Non-Manager
40%
50%45%
45%
18%
10%
19%
© IESE Business School - Barcelona - 2012 Page 25
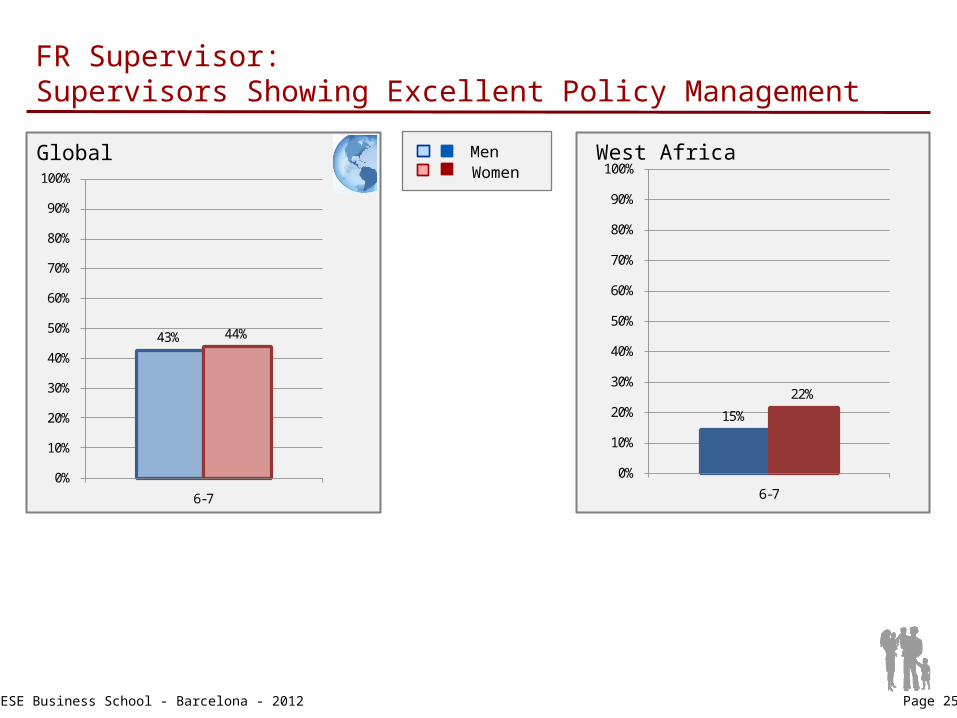
FR Supervisor: Supervisors Showing Excellent Policy Management
Global West AfricaWomenMen
43% 44%
0%
10%
20%
30%
40%
50%
60%
70%
80%
90%
100%
6-7
15%
22%
0%
10%
20%
30%
40%
50%
60%
70%
80%
90%
100%
6-7
© IESE Business School - Barcelona - 2012 Page 26
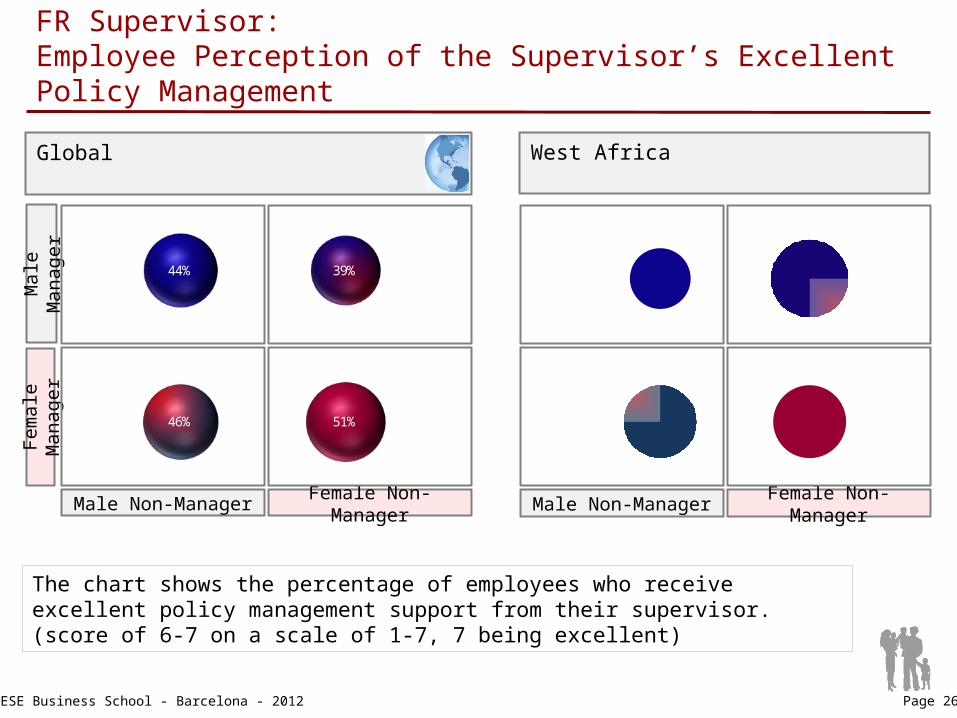
FR Supervisor:Employee Perception of the Supervisor’s Excellent Policy Management
The chart shows the percentage of employees who receive excellent policy management support from their supervisor. (score of 6-7 on a scale of 1-7, 7 being excellent)
Male
M
an
ag
er
Fem
ale
M
an
ag
er
Female Non-Manager
Male Non-Manager
Global West Africa
Female Non-Manager
Male Non-Manager
39%
51%46%
44%
© IESE Business School - Barcelona - 2012 Page 27
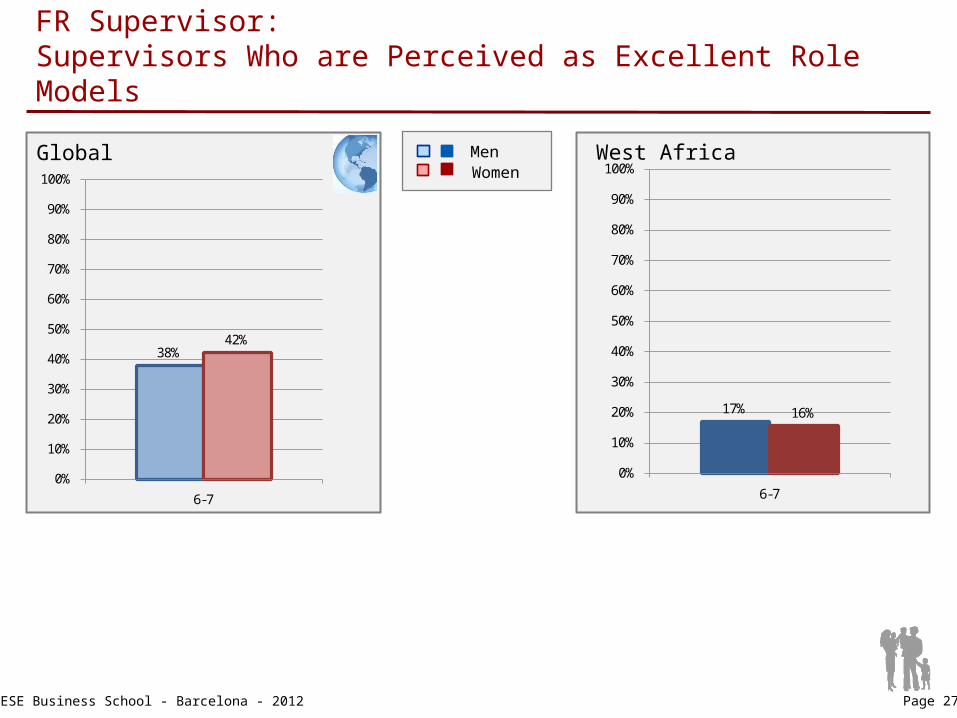
FR Supervisor:Supervisors Who are Perceived as Excellent Role Models
Global West AfricaWomenMen
38%42%
0%
10%
20%
30%
40%
50%
60%
70%
80%
90%
100%
6-7
17% 16%
0%
10%
20%
30%
40%
50%
60%
70%
80%
90%
100%
6-7
© IESE Business School - Barcelona - 2012 Page 28
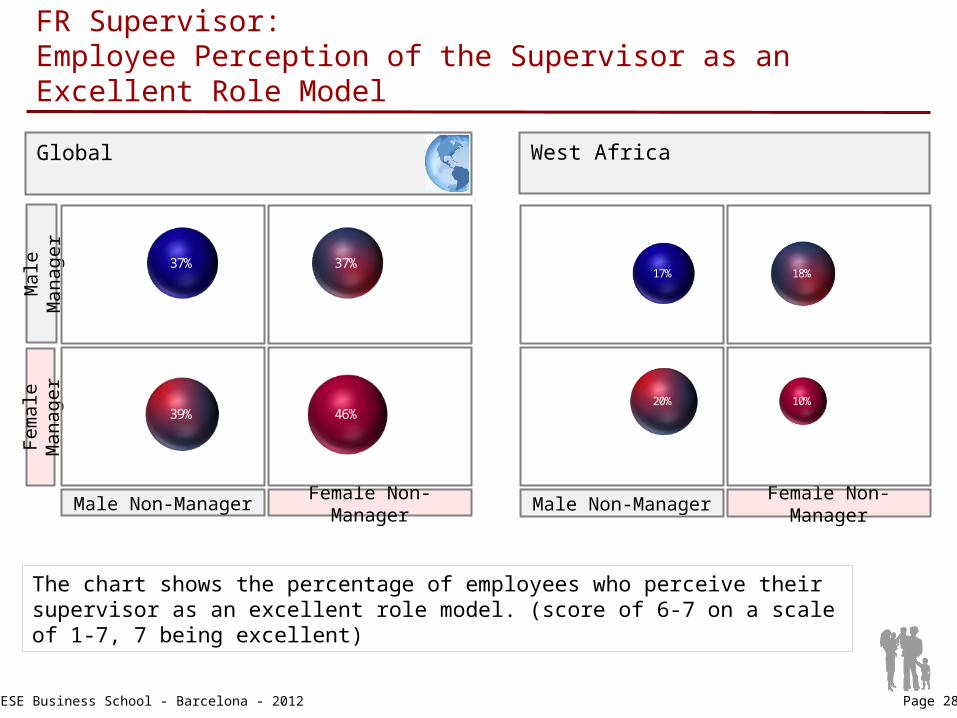
FR Supervisor:Employee Perception of the Supervisor as an Excellent Role Model
The chart shows the percentage of employees who perceive their supervisor as an excellent role model. (score of 6-7 on a scale of 1-7, 7 being excellent)
Male
M
an
ag
er
Fem
ale
M
an
ag
er
Female Non-Manager
Male Non-Manager
Global West Africa
Female Non-Manager
Male Non-Manager
37%
46%39%
37%18%
10%20%
17%
© IESE Business School - Barcelona - 2012 Page 29
Family-Responsible Environment:
Organizational CultureA. FR Policies
1.Time and Location Flexibility2.Family Support3.Information4.Maternity/Paternity Leave
B. FR Supervisor
1.Emotional Support2.Instrumental Support3.Policy Management4.Role Model
Individual Characteristics
A. Coping Strategies
B. Integration/ Segmentation Preferences
C. Work Preferences
D. Transition Styles
C. FR Culture
FR Environment Impact on Results
1.Intention to Leave
2.Loyalty
3.Commitment
4.Perceived Organizational Support
Organizational Individual
1.Overall Health
2.Family ↔ Work Enrichment
3.Satisfaction with Work/Family Balance
© IESE Business School - Barcelona - 2012 Page 30
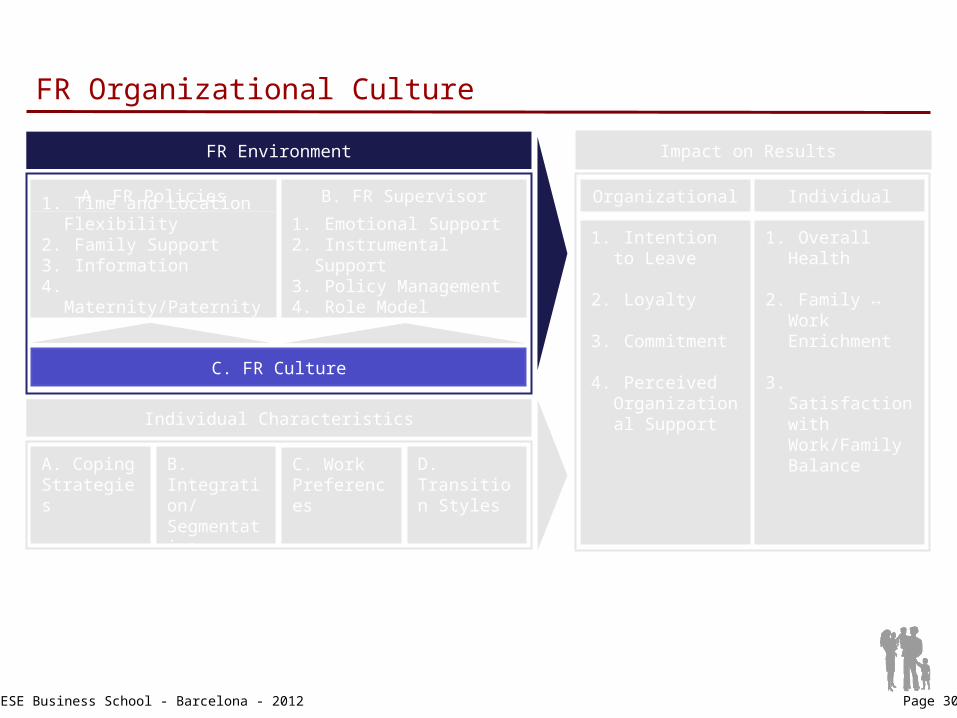
FR Organizational Culture
A. FR Policies1. Time and Location
Flexibility2. Family Support3. Information4. Maternity/Paternity
Leave
B. FR Supervisor
1. Emotional Support2. Instrumental Support3. Policy Management4. Role Model
Individual Characteristics
A. Coping Strategies
B. Integration/ Segmentation Preferences
C. Work Preferences
D. Transition Styles
C. FR Culture
FR Environment Impact on Results
1. Intention to Leave
2. Loyalty
3. Commitment
4. Perceived Organizational Support
Organizational Individual
1. Overall Health
2. Family ↔ Work Enrichment
3. Satisfaction with Work/Family Balance
© IESE Business School - Barcelona - 2012 Page 31
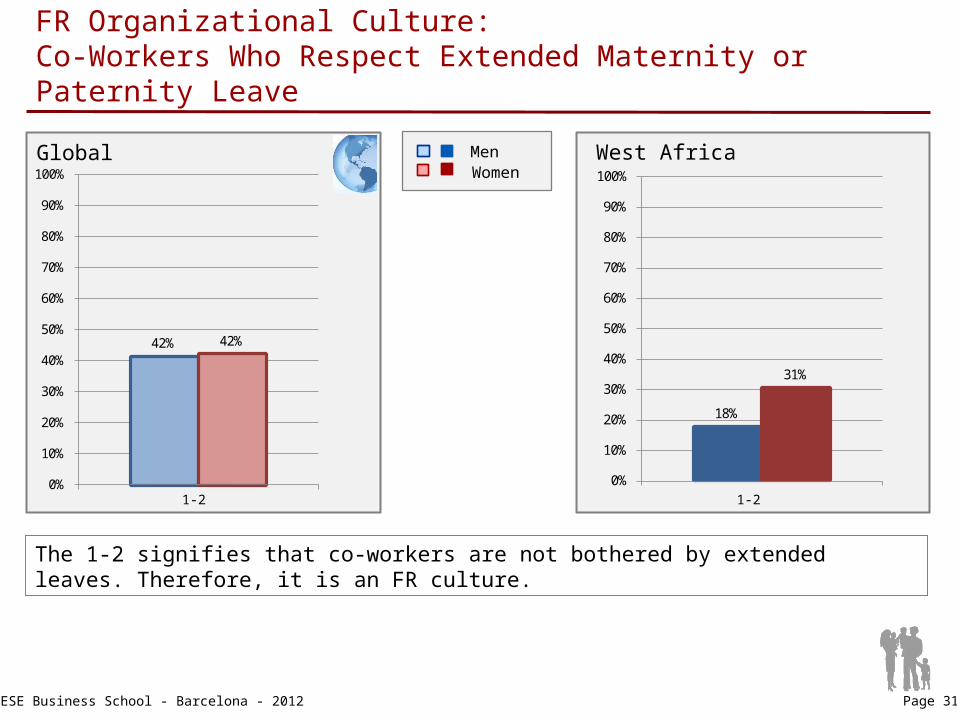
FR Organizational Culture: Co-Workers Who Respect Extended Maternity or Paternity Leave
Global West Africa
The 1-2 signifies that co-workers are not bothered by extended leaves. Therefore, it is an FR culture.
WomenMen
1-2
42% 42%
0%
10%
20%
30%
40%
50%
60%
70%
80%
90%
100%
6-71-2
18%
31%
0%
10%
20%
30%
40%
50%
60%
70%
80%
90%
100%
6-7
© IESE Business School - Barcelona - 2012 Page 32
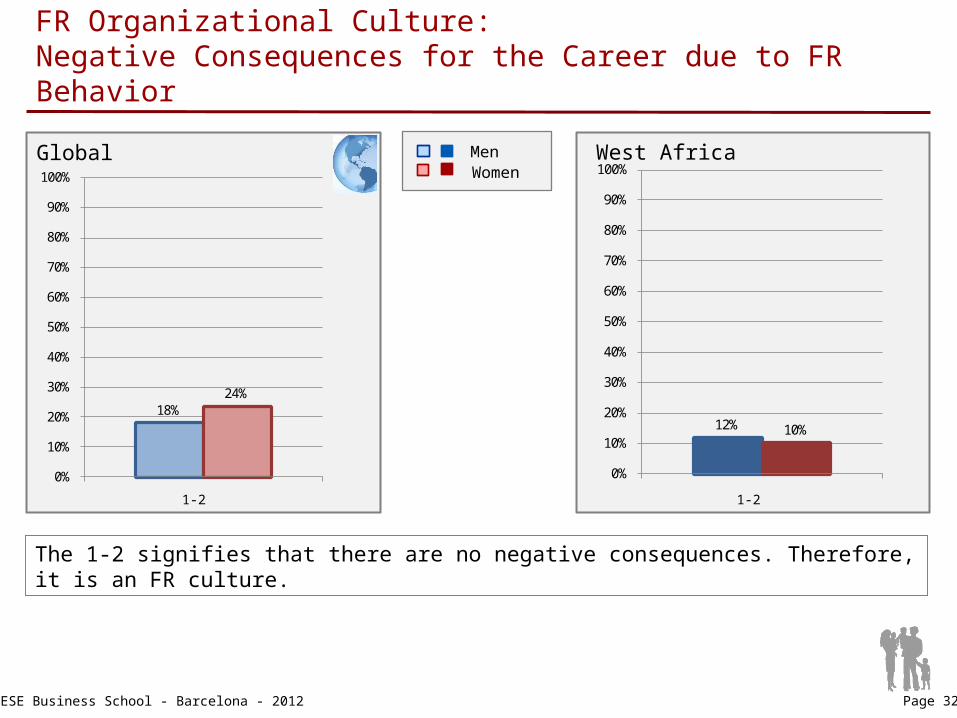
FR Organizational Culture: Negative Consequences for the Career due to FR Behavior
Global West Africa
The 1-2 signifies that there are no negative consequences. Therefore, it is an FR culture.
WomenMen
18%24%
0%
10%
20%
30%
40%
50%
60%
70%
80%
90%
100%
6-7 1-21-2
12% 10%
0%
10%
20%
30%
40%
50%
60%
70%
80%
90%
100%
6-7
© IESE Business School - Barcelona - 2012 Page 33
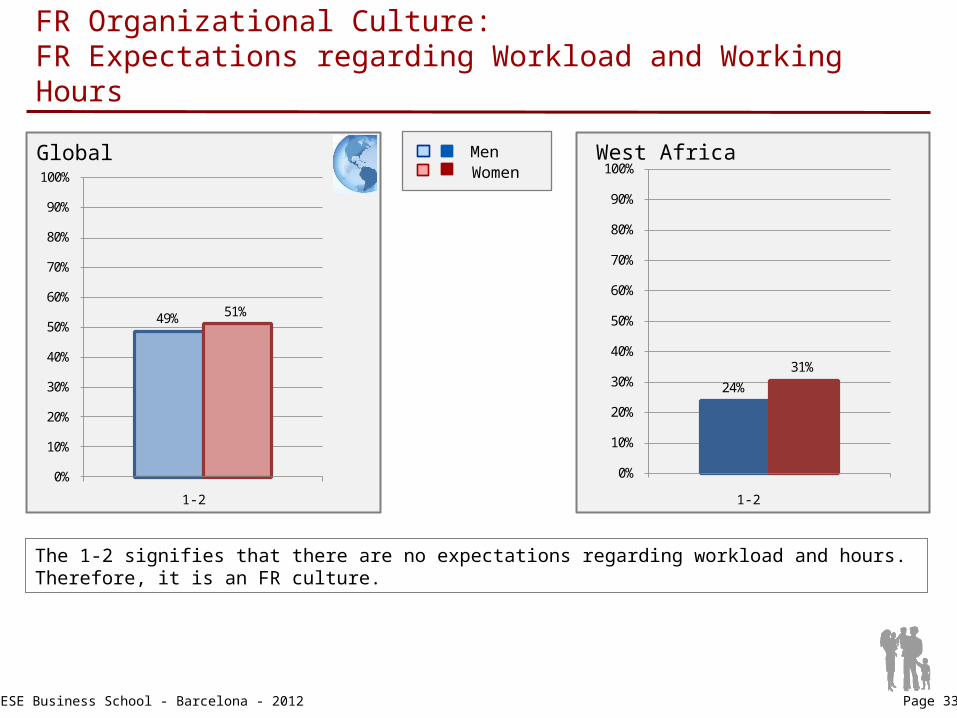
FR Organizational Culture: FR Expectations regarding Workload and Working Hours
Global West Africa
The 1-2 signifies that there are no expectations regarding workload and hours. Therefore, it is an FR culture.
WomenMen
49% 51%
0%
10%
20%
30%
40%
50%
60%
70%
80%
90%
100%
6-7 1-21-2
24%
31%
0%
10%
20%
30%
40%
50%
60%
70%
80%
90%
100%
6-7
© IESE Business School - Barcelona - 2012 Page 34
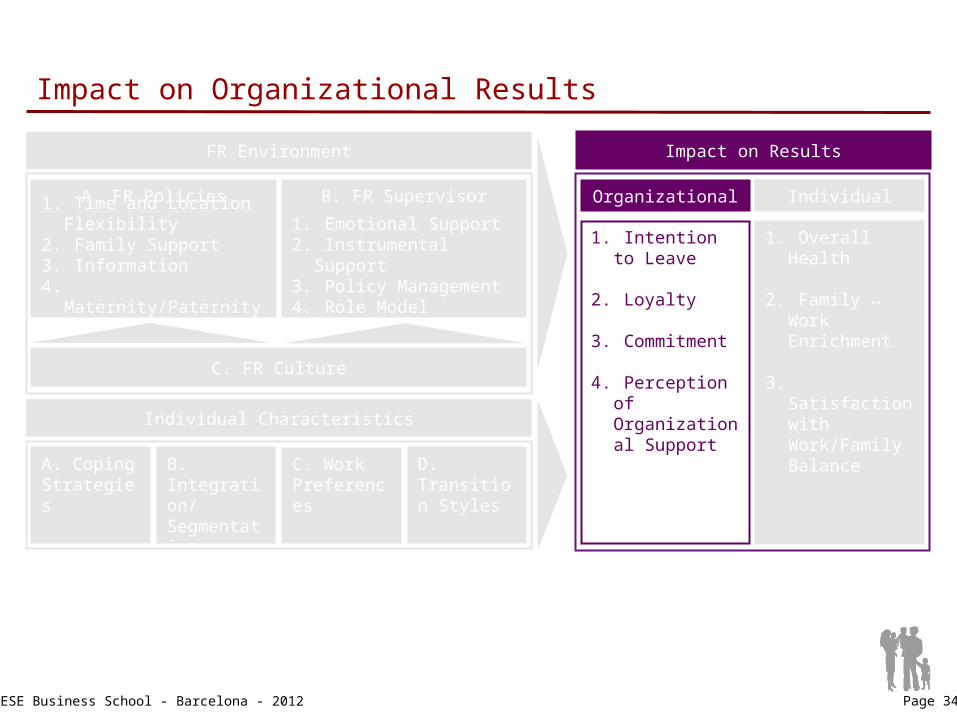
Impact on Organizational Results
A. FR Policies1. Time and Location
Flexibility2. Family Support3. Information4. Maternity/Paternity
Leave
C. FR Culture
B. FR Supervisor
1. Emotional Support2. Instrumental Support3. Policy Management4. Role Model
FR Environment
Individual Characteristics
A. Coping Strategies
B. Integration/ Segmentation Preferences
C. Work Preferences
D. Transition Styles
Impact on Results
1. Intention to Leave
2. Loyalty
3. Commitment
4. Perception of Organizational Support
Organizational Individual
1. Overall Health
2. Family ↔ Work Enrichment
3. Satisfaction with Work/Family Balance
© IESE Business School - Barcelona - 2012 Page 35
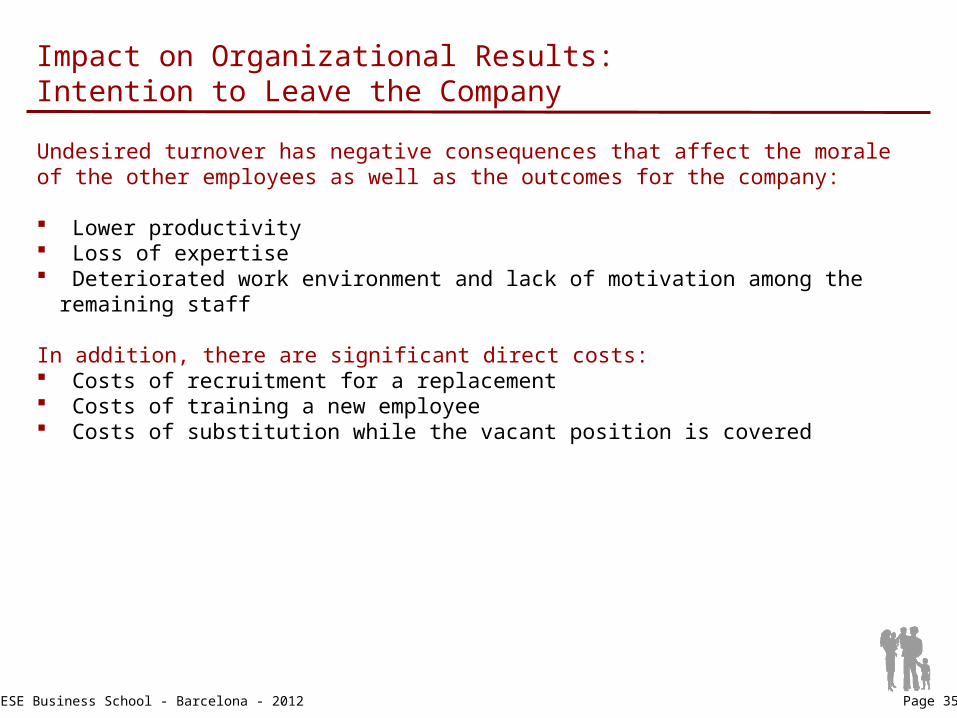
Impact on Organizational Results: Intention to Leave the Company
Undesired turnover has negative consequences that affect the morale of the other employees as well as the outcomes for the company:
Lower productivity Loss of expertise Deteriorated work environment and lack of motivation among the remaining
staff
In addition, there are significant direct costs: Costs of recruitment for a replacement Costs of training a new employee Costs of substitution while the vacant position is covered

© IESE Business School - Barcelona - 2012 Page 36
Impact on Organizational Results: Intention to Leave the Company
The graphs “Impact on Organizational Results: Intention to Leave the Company” refer to the following questions in the questionnaire:
Do you agree with the following statements? (1 = strongly disagree / 7 = strongly agree)
I would prefer another more ideal job than the one I have now If it was up to me, in three years I would not be in this organization I frequently think of quitting my job
© IESE Business School - Barcelona - 2012 Page 37
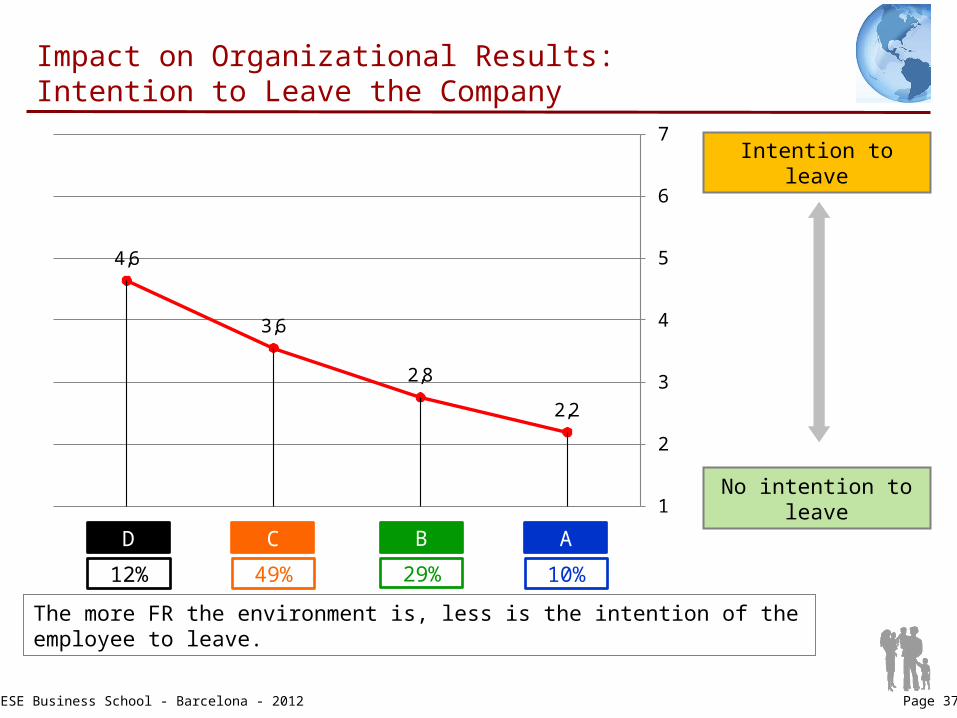
Impact on Organizational Results: Intention to Leave the Company
Intention to leave
No intention to leave
The more FR the environment is, less is the intention of the employee to leave.
AD C B
10%12% 49% 29%
2,2
2,8
3,6
4,6
1
2
3
4
5
6
7
© IESE Business School - Barcelona - 2012 Page 38
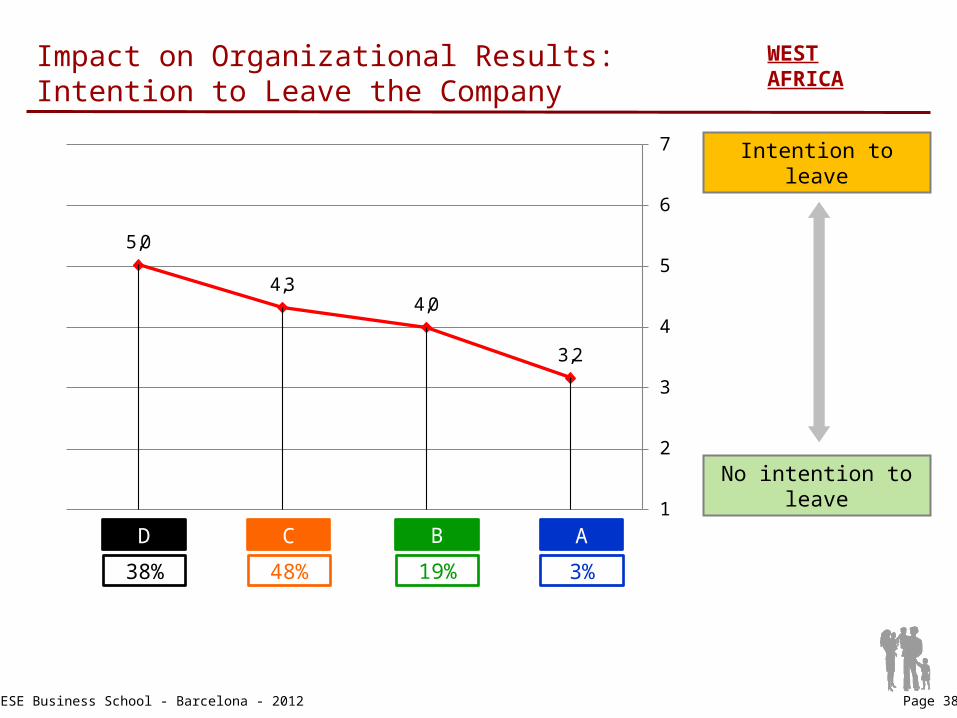
Impact on Organizational Results: Intention to Leave the Company
Intention to leave
No intention to leave
AD C B
3%38% 48% 19%
3,2
4,04,3
5,0
1
2
3
4
5
6
7
WEST AFRICA
© IESE Business School - Barcelona - 2012 Page 39
Impact on Organizational Results: Perceived Organizational Support
The graphs “Impact on Organizational Results: Perceived Organizational Support” refer to the following questions in the questionnaire:
Do you agree with the following statements? (1 = strongly disagree / 7 = strongly agree)
When I have a problem, the organization tries to help me The organization is sincerely concerned about my well-being The organization takes my opinion seriously The organization is concerned about my overall satisfaction at work
© IESE Business School - Barcelona - 2012 Page 40
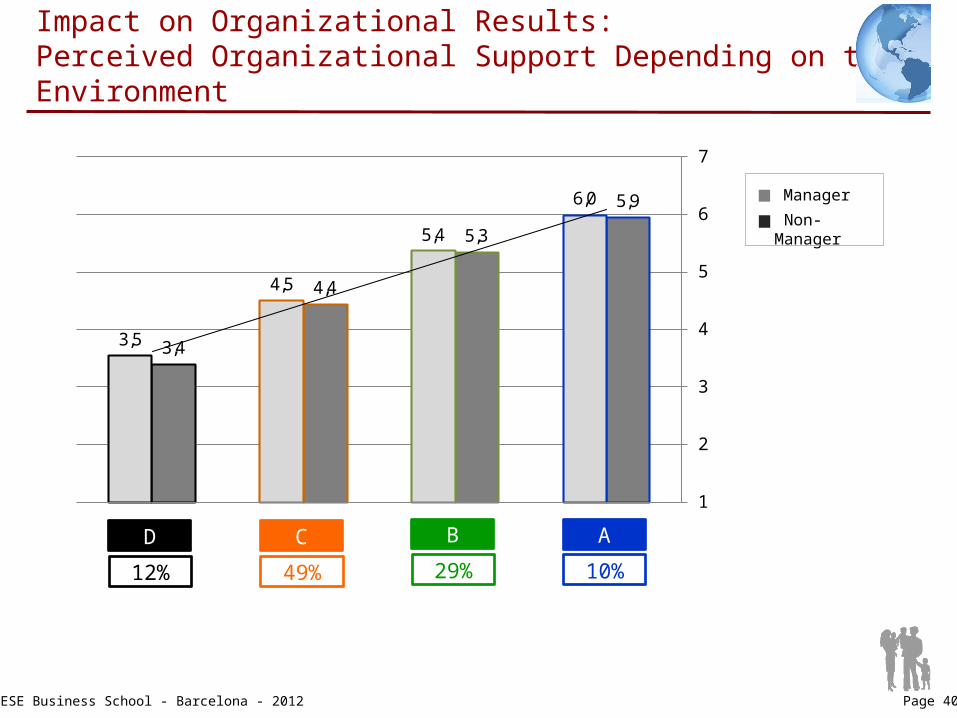
Impact on Organizational Results: Perceived Organizational Support Depending on the Environment
Manager
Non-Manager
5,9
5,3
4,4
3,4
6,0
5,4
4,5
3,5
1
2
3
4
5
6
7
ABCD AD C B
10%12% 49% 29%
© IESE Business School - Barcelona - 2012 Page 41
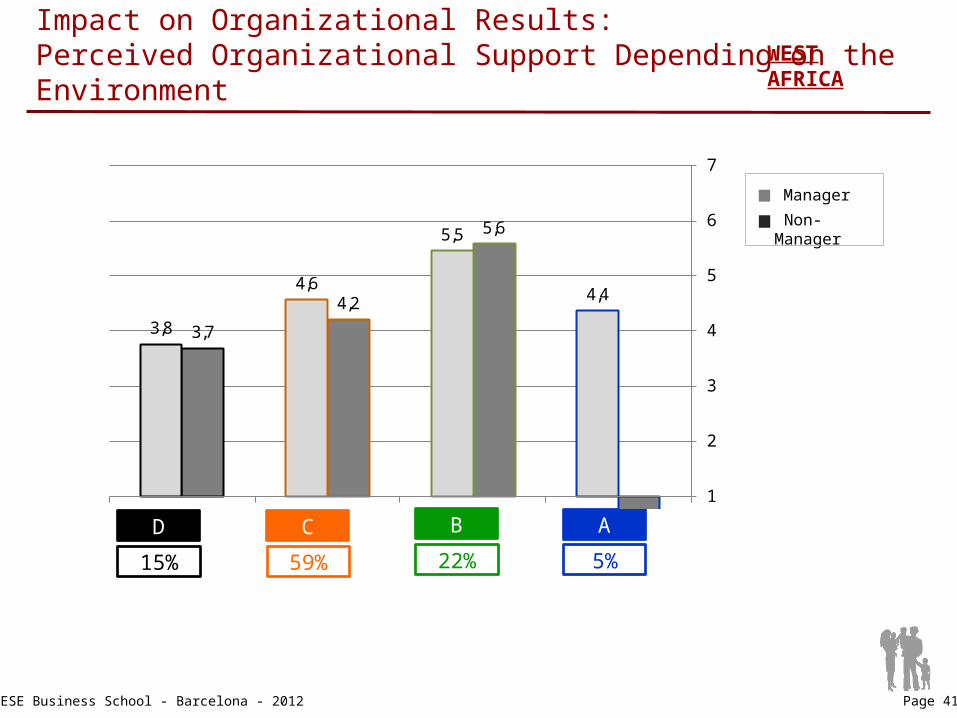
Impact on Organizational Results: Perceived Organizational Support Depending on the Environment
Manager
Non-Manager
AD C B
5%15% 59% 22%
5,6
4,2
3,7
4,4
5,5
4,6
3,8
1
2
3
4
5
6
7
ABCD
WEST AFRICA
© IESE Business School - Barcelona - 2012 Page 42
Impact on Individual Results: Satisfaction with Work/Life Balance
The person is satisfied with how he or she is managing work and family responsibilities.
This variable refers to the level of satisfaction that the person has with how he or she divides his or her attention between work and family. It is also the satisfaction with how both domains, the familial and professional, fit to form a balanced framework that the person likes.
This satisfaction is facilitated, in large part, by the resources that the company provides a person to do their job in an independent and flexible manner. In this way, he or she can contribute professionally without it negatively affecting his or her family life.

© IESE Business School - Barcelona - 2012 Page 43
Impact on Individual Results: Satisfaction with Work/Life Balance
The graphs of “Impact on Individual Results: Satisfaction with Work/Life Balance” refer to the following questions in the questionnaire:
Please tell us how satisfied you are with the following aspects of your life (1 = Very dissatisfied / 7 = Very satisfied)
The way I divide my time between work and personal or family life The way I divide my attention between work and home The way my personal and family life fit together My ability to balance the needs of your job with those of my personal or family
life The opportunity to balance my job and look after my duties at home

© IESE Business School - Barcelona - 2012 Page 44
Impact on Individual Results: Satisfaction with Work/Life Balance
Female Manager
Female Non-Manager
Male Manager
Male Non-Manager
Low Commitment
High Commitment5,7
5,2
4,74,3
5,65,1
4,7
4,1
5,55,3
4,6
3,9
5,55,1
4,6
3,9
1
2
3
4
5
6
7
ABCD
© IESE Business School - Barcelona - 2012 Page 45
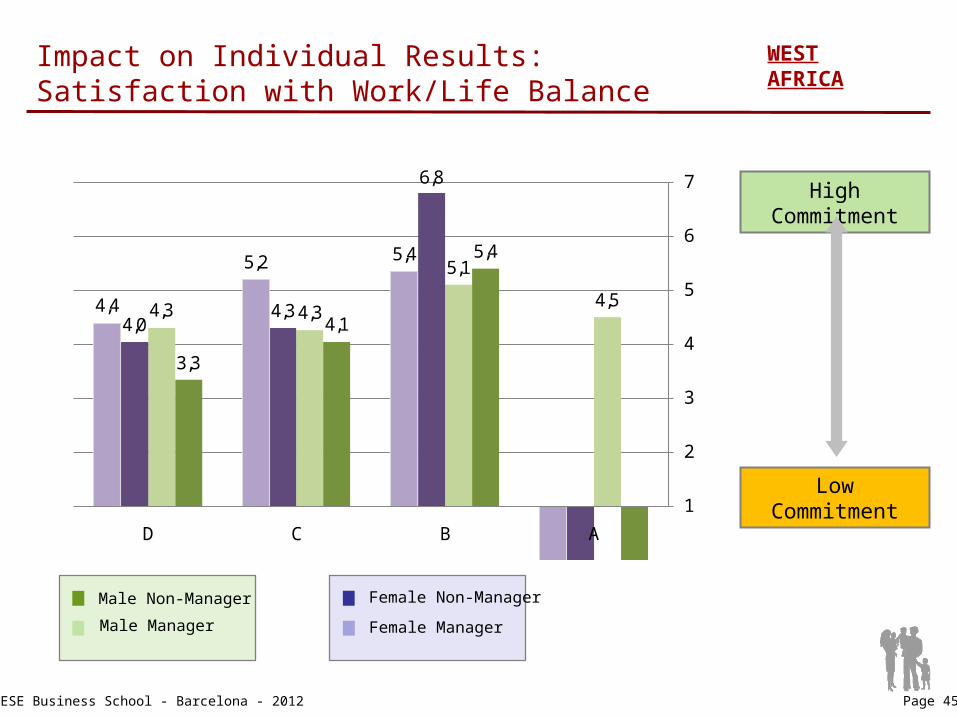
Impact on Individual Results: Satisfaction with Work/Life Balance
Low Commitment
High Commitment
Female Manager
Female Non-Manager
Male Manager
Male Non-Manager
5,4
4,1
3,3
4,5
5,1
4,34,3
6,8
4,34,0
5,45,2
4,4
1
2
3
4
5
6
7
ABCD
WEST AFRICA
© IESE Business School - Barcelona - 2012 Page 46
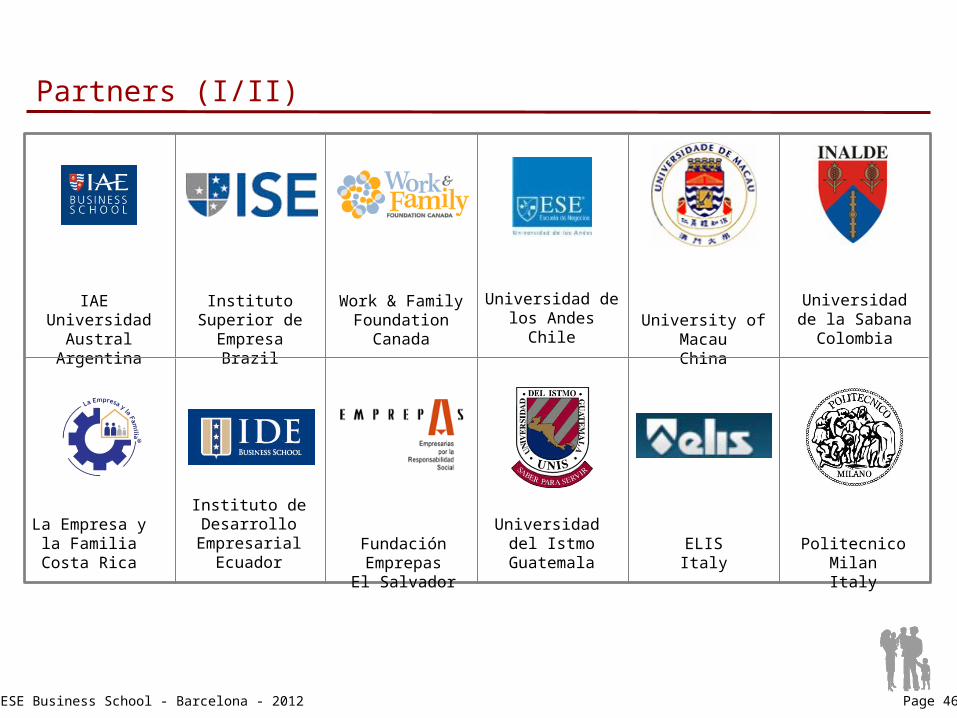
Partners (I/II)
IAE Universidad
AustralArgentina
Work & Family Foundation
Canada
Universidad de la SabanaColombia
Universidad de los Andes
Chile
Instituto Superior de
EmpresaBrazil
La Empresa y la Familia
Costa Rica
Instituto de Desarrollo
EmpresarialEcuador
ELISItaly
Universidad del Istmo
GuatemalaFundación EmprepasEl Salvador
University of MacauChina
Politecnico MilanItaly
© IESE Business School - Barcelona - 2012 Page 47
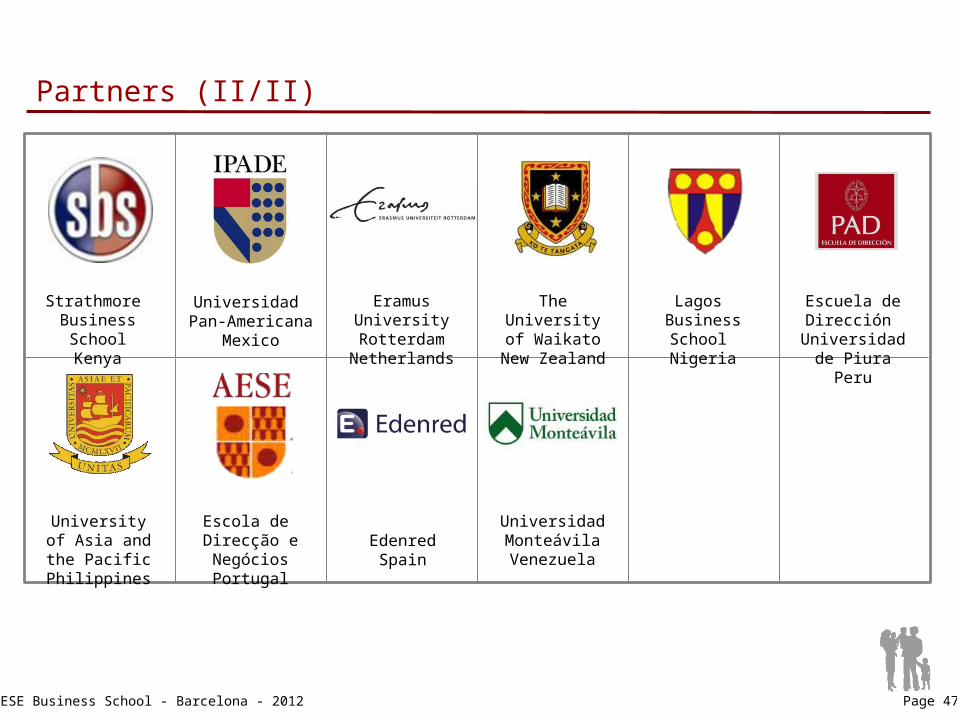
Partners (II/II)
Strathmore Business SchoolKenya
Eramus University Rotterdam
Netherlands
Lagos Business School Nigeria
The University of Waikato
New Zealand
Universidad Pan-Americana
Mexico
Escuela de Dirección
Universidad de PiuraPeru
Escola de Direcção e NegóciosPortugal
EdenredSpain
Universidad MonteávilaVenezuela
University of Asia and the
PacificPhilippines
© IESE Business School - Barcelona - 2012 Page 48
IESE Family-Responsible environment (FRe) Indexfor the World and Nigeria
Prof. Nuria Chinchilla
Prof. Mireia Las Heras