![Abstra«s Pub]ished Papers](https://static.fdocuments.net/doc/165x107/629e99bd5f90371ca366ded1/abstras-pubished-papers.jpg)
Ifllllflflflflflflflfll EIEEIIIIEEIIEEmullluuuullulu -IIIIIIIIIIIu ... · I r! ABSTRA CT Title: AIR...
151
AD-A090 635 AIR FORCE INST OF TECH WRIGHT-PATTERSON AFB ON F/6 5/9 AIR FORCE MAINTENANCE TECHNICIAN PERFORMANCE MEASUREMENT.(U) DEC 79 J R HICKMAN UNCLASSIFIED AFIT-CI-79-241T NL flflIIIIIIIIIIIIflf Ifllllflflflflflflflfll EIEEIIIIEEIIEE mullluuuullulu -IIIIIIIIIIIu -lEElllllllhE
Transcript of Ifllllflflflflflflflfll EIEEIIIIEEIIEEmullluuuullulu -IIIIIIIIIIIu ... · I r! ABSTRA CT Title: AIR...

AD-A090 635 AIR FORCE INST OF TECH WRIGHT-PATTERSON AFB ON F/6 5/9AIR FORCE MAINTENANCE TECHNICIAN PERFORMANCE MEASUREMENT.(U)DEC 79 J R HICKMAN
UNCLASSIFIED AFIT-CI-79-241T NLflflIIIIIIIIIIIIflfIfllllflflflflflflflfllEIEEIIIIEEIIEEmullluuuullulu-IIIIIIIIIIIu-lEElllllllhE

IiNC LASS
LWRITX CLASSIFICATION OF THIS PAGE (Whien Datfne ,d)
READ INSTRUCTIONS2'- 1 REPORT DOCUMENTA.TION PJ M BEFORE COMPLETING FORM' PORT N SER 2. GOVT ACCESSION NO 3. RECIPIENT'S CATALOG NUMBCERl
,' *#"ll4 ii ff~l~i ........ " ....... S. TYPE OF REPORT A PERIOD COVERED
C seAir Force Maintenance Technician PerTPEmanceIO. R O viao
Measurement * THES IS/DISSERTATION
/G.. PERFORMING ORG. REPORT NUMBER7 .r' -,H! --Capt Joel R. ickman ..- 7 ,,
.P E R F O R M IN G O R G A N I Z A T IO N N A M E A N D A D R S A R E A P HO R U I T N U M B E R
AFIT STUDENT AT: Arizona State Univ
II. CONTROLLING OFFICE NAME AND ADDRESS " /""
AFIT/NR A 28 Dec 79WPAFB OH 45433
1 I36
14. MONITORING AGENCY NAME A ADDRESS(iI differet rao, Cont, oing Office) 15. SECURITY CLASS. (of this report)
/t/2 !"i /UNCLASSISa. DECLASSIPICATION/DOWNGRADING
SCHEDULE
I. DISTRIBUTION STATEMENT (01 this Report) D Ij
APPROVED FOR PUBLIC RELEASE; DISTRIBUTION UNLIMITED D.II.. ELECTEIOCT 2 11-0~ l !
17. DISTRIBUTION STATEMENT (of the abstract entered in 1111Bite 30 II differmnl ea Repeot)
E
WS SUPPLEMENTARY NOTES14AAr L N~ kj~iSf"
APPROVED FOR PUBLIC RELEASE: lAW AFR 190-17 Z ARFc C
25 SEP 1980 & I A P(ATC)"Wlght-Patterson AF6, OH 45433
IS. KEY WORDS (Cotinue an ,everae aids, It necessary ind iden..1t beeiek Mo be)
20. ABSTRACT (Cotnue an reverse side Of necessary and Idaetiy6 b lock aMbr)
ATTACHED
DD , . - , .147-3 ",,EDITIoN o Fo NOV 66 IS O SOLETE 8,C) 9iCLAS S

I r!
ABSTRA CT
Title: AIR FORCE MAINTENANCE T-,-NIIAN PERFCRMANCZ
M MEASUR E,MENT
Author: Joel R. Hickman, Capt, USAF
Dates 1979
Number of Pages: 136
Degree Awarded: Master of Science
Institution: Arizona State University
The ourDose of this study is to find or develop some
method for evaluating and measuring the performance of
aircraft maintenance technicians in the United States Air
Force. This evaluation method is to be used in another
research effort to develop a model or models for predicting
or evaluating the effectiveness of maintenance technician
performance.
The performance appraisal method developed in this
study is based on a review of the literature on the subject.
A literature review has been necessary, as existing appraisal
methods either are not applicable to statistical analysis,
are highly inflated, or provide incomplete and non-current
coverage of maintenance organizations. The performance
aopraisal method developed relies on subjective supervisor
appraisals of maintenance technician quantity and quality
of performance.
An evaluation of the performance appraisal methoi
has been conducted within the aircraft maintenance organization _
¢'4

;7of one pilot trainina base. The random sam1:e consists of
2)' of the assigrned technicians. 7hirty-six supervisory
grouzs of five or fewer technicians per group have been
selected and found to represent the organization as a whole
in terms of experience and relative manning. uality of
performance ratings have a mean value of 7.2 (median of 8.0)
on a 10.0 scale, while quantity of performance ratings have
a mean value of 6.6 (median of 7.0).
The auality of performance data shows only marginal
correlation with axistinz personnel inspection data. The
performance ratings as a whole, however, display sunerior
face validity and usefulness compared to existing personnel
inspection data.
Accassion For
NTIS GRA.IDDC TAB
Un-am ; i -- .... .. d
A ''*1*
____-
Dist -c"!a

AIR FORCE M4AINTENANCE TECHNICIAN
byFOMAC MEASUREMENT[
Joel. R, Hickman
has been approved
December 1979
APPROVED:
Supervisory Committee
C CEPTEJ~,I T7
Department C ir
Deiii 0 14~ a niernand Applied Sciences

A3STRACT
Joel R. Hickman, Arizona State University, December,
1979. Air Force Maintenance Technician Performance Measure-
ment. Major Professor: Hewitt H. Young, Ph.D.
The purpose of this study was to find or develop some
method for evaluating and measuring the performance of
aircraft maintenance technicians in the United States Air
Force. This evaluation method was then to be used in another
research effort to develop a model or models for predicting
or evaluating the effectiveness of maintenance technician
performance.
The performance appraisal method developed in this
study was basei on a review of the literature on the subject.
A literature review was necessary, as existing appraisal
methods either were not applicable to statistical analysis,
were highly inflated, or provided incomplete and non-current
coverage of maintenance organizations. The performance
appraisal method developed relied on subjective supervisor
appraisals of maintenance technician quantity and quality
of performance.
An evaluation of the performance appraisal method was
conducted within the aircraft maintenance organization of
one pilot training base. The random sample for the evalua-
tion consisted of 20% of the assigned technicians. Thirty-
six supervisory groups of five or fewer technicians per
iii

group were selected and found to represent the or'anizatio-
as a wvhole in terms of experience and relative branch -an-
ning. The resultant Quality of performance ratings had a
mean value of 7.2 (median of 8.0) on a 10.0 scale, while
quantity of performance ratings had a mean value of 6.6
(median of 7.0). These skewed results presented potential
difficulties for regression modeling and for the comparison
of distributions. However, these difficulties were overcome
for regression mojeling, while the quantity and quality
distributions were found to be significantly different,
The quality of performance data showed only marginal
correlation with existing personnel inspection data. in
addition, the use of numbered gradations on the performance
appraisal scales resulted in performance histograms which
were not useable in most non-parametric tests and which
reduced the Dower of parametric tests for comparisons. The
performance ratings as a whole, however, displayed superior
face validity and usefulness compared to existina personnel
inspection data.
iv
*f
-a

PREFACE
Althouah this study was conducted with official
permission, the findings and conclusions expressed are those
of the author, and are not to be construed as official or
reflecting those of the United States Air Force.
Y1any persons have assisted me greatly throughout this
undertaking and those mentione! specifically are by no means
the only persons who have been helpful. 1 wish to express
ny deepest aDoreciation to the following :eole:
To Dr. Hewitt H. Y:,un,. FrofeZsor an1 -'airerz n of
my research comittee, wrose ienerous support ani exzert .7uiiance contributed to the completion of *,his recorc,
To Dr. David D. Sedwor.h and Dr. Dwayne A. Rollier,
for their comments and assistance while servinz on my
resea.rch committee.
To Col. alker and *aot. jerry kane%, an' 'I, 7-, e
nange personnel of , iiliams AF3, Arizona. *svo.o ontributed
their time and expert help.
To my wife, Gwenne, who labored as the editor of this
manuscript.
V

TABLE OF CONTENTS
Page
LIST OF TABLES . . ........ ........ . x
LIST OF FIGURES . . . . . . . . . . . . . . . . . . . xi
Chapter
1. INTRODUCTION . . . . . . . . . . . .
Purpose . . . . . . . . . . ...
2. THECRETICAL PERFOR.MQNCE . .......
Organization Structure
.,ual ty of Ratings ....... ............ 7
Acceptability . . . . .......... 3
Relevance . . . . ..... . . . . ..
Performance Critera. . .... . . . .
Objective .easures .... ............ .. -
Subjective '.easures ........... .
The 3est Traits . . . . . . . . . . . . .
Appraisal Methods . 22..... .
Comparative Procedures . .. .. . . . ..
Absolute Standards ...............
Eanagement by Objectives .... . . . 27
Direct Measures . .... . ............ .
Suggested Methods ............
Rating Scale Errors . . . . . . . ji
The Error of Leniency ............
Error of Central Tendency . . . . 31
vi

Halo Effect . . . . . . . . . . . . .
Scale Format . . . ............... 33
Rules for Writing Scales . . . . . . .
Rating Standards . . . . . . . . . . .. 33
Scale Anchors . . .. .. ... . . . . ..
The Form of Rating Scales ........
The Rater . . . . . . . . . . . . . . . . . 37
SUervisory Appraisal . ..........
Peer Appraisal ....... ............
Self an'! Subordir.ate A:oraisa ........ .
Outside Azrraisal ..........
Recommena-ticns and ocru*z n . ...r
Conclusions . . . . ...........
The Da:a Gathering Irstruen-z ... ........
Summarv of Data .. .d ........
Samole Selection Procedures ........
Data Collection . . . .- "..........
Data Analysis -.
Summ1ary . . . ....................... . . .. .. ........
4 * ANALYSIS ...................
Sample Ccmoosition . . . ... .............
Sanrle Statistical Proerties . .
YSEP Data . . . . ..... . .............-
Normality and Applicability toRe-ression Analysis .. . ....
Rating Comnarisons ........... ..vii

Rating Associations . . . . . . . 31
Opinion Survey Analysis ... ............ 83
Summary . . . . . . . . ...........
5. DISCUSSION . . . . . ................ 86
The Performance Appraisal Method ......... 86
Evaluation of the Rating Method . . . . . .
Test Sampling Procedures ........... 89
Ratina Distributions .................
Rating Distributions and :'ocrialit . . . . .
uantitv and a',l"'i"ty . .
Validty , anc Assoca-on. . . .
..i- a an e 0-fi e ni. o s < . . . . . . . .
Summary . . . . . . . . ........... ...
6. 0LU1IN ...... ...... . .. . . .
Contributions and Future Codeations . ,2 'Q
nal Comment .. ...............
APPEND ICES
A. ',.'AINT--NANC~ EE H~:A
I.
3. QUALITY OF PERFORMANCE .3 A ,,"" GS.. . .. !..
C. QUANTITY OF PERFORMANE RA GS . . 11 2 . •
D. DATA . . . . . . ... ..........
E. STATISTCA1 DATA . ............. i
F. C'.I-S UARE C-CDNSo-OF-FIT C ' A :-C' 1.2
-. EFCT OF SKEWNESS .""' K,, ,1 C.;TYPE I ERROR .. . . . .. ..... . ... . . . . . 1
viii

IIi
H. F-TEST FOR EQUIVALENCE OF
SAMPLE VARIANCES . . . . . . . . . 124
I. COMPARISON OF SAMp'PLE DISTRIBUTIONS . . . .. 125
J. CORRELATION ANALYSIS .. . . . . . . . . . 127
K. MAINTENANCE OFFICER SURVEY .. . . . .. . 130
L. SURVEY ANSWERS ....... .......... v . . . 132
M. GLOSSARY . . . . . ..... . . ............... . . 135
ix~ -- I-

T A B LS
Table Page
1. Frequency of Rating Categories ........ 2
2. Amount of Disagreement Among Judgesin Estimating the Traits of Others ..... 21
3. Validity Coefficients fLor GraphicRating Scales and Forced-ChoiceSections for Various Criteria . . . . . . . . 26
4. Grade Distribution of Samnle and
~. elaiveSriuadron 3ra-ch tethversus Relat ive Sarnne "3ancn S'tren_--h.s . . .
6.Ratio of P erscnnel Aw1inf'. z
7. C'hi-S-7iuare orm--a'LDistribution...Aciood aI ? ests . . . .ai.t. . . ........
~. Concar-son of Variance Zaualit' 7
10. Com )arison of Mieans . . . .* . ......... .. . .....
11I. Summary of Correlation Coef'ficernts (r'for %uanti;ty/7,,uaIity Associations and, ualit-/=D2E Assoc~ations . . .. .. .. ..
x

FIGURES
Figure Page
1. Deputy Commander forMaintenance Organization . . . . . . . . . . 8
2. Organizational MaintenanceOrganization . . . . . . . ............ 9
3. Field Maintenance Organization . . . . 10
4. Avionics Maintenance Organization .... . . . 11
5. tinirs Maintenance Caiaio.. ...... 12
6. illustrations of Convential RatingScalina Fcrmats for a Single T,.em ......... 5
7. Resnonse Distributions 3asedon Scale Anchors . . . . . . . . . . . . . . .
. Denuty Commander for -aintenanceOrganization, Williams . Arizona . 7 . . -,
9. Organizational :Maintenance Smuadron
CXranization . . ................
10. Fieli Maintenance Squadron Organization
11. Propulsion and Fabrication 3ranches, 7,S .
12. Aerospace Systems Branch. FMS .
13. AGE and Avionics Branches, F.iS ..... . . .
14. FMS Histograms . . . . . . . . 67
15. OMS Histograms . . ................
16. FMS Quality Rating s and vSEP ......... 71
17. OMS Quality Ratings and :vS:EP ............. 72
xi

Chapter 1
INTRODU CTION
One of the greatest needs of managers of the military
weapons system maintenance complex is to measure accurately
how well individuals perform on the job. individual job
performance forms one of the bases for performance by the
entire organization. If the effectiveness of weapons system
maintenance is to be improved, then individual Derformance
must also be measurable and subject to improvement. As
stated by Cummings and Schwab (1973:56), in general "the
measurement and assessment of human performance is cruciai
to effective utilization in orler to -rovide the basis for
feedback into the input-processing and inrut-conversion
staaes..." of the organizational control process.
Quantifying job effectiveness is, however, difficult.Campbell et al. (1970:101) feel that "Quantifying job
effectiveness has been industrial psychology's major bugaboc
since its inceDtion." Decades of research by psychologists
and personnel experts have failed to provide definitive
answers to the question of how to measure performance or
effectiveness. Air Force Manual 66-I (AFB 66-i), Volume I,
Maintenance Manapement (1975:A3-2), allows that the measures
of personnel performance form the basis for capability
predictions. These measures are, however, difficult to
assess and subject to a number of variables. As a

2
substitute for personnel performance measures, overall
maintenance support to the unit's mission is assessed. Such
an approach is justifiable given the thirty thousand tasks
reported by Wiley (1978:5) that Air Force maintenance zer-
forms. Existing official supervisor ratings (e.g.. Airmen
Performance Ratings) do not serve the performance measure-
ment purpose either as they are general in nature, are not
specifically related to tasks and jobs, are highly inflated,
and do not discriminate among individuals.
This study considers the available rating techniques,
recommends a particular rating technique, and reports on a
test of the recommended technioue. Chapter 2 will discuss
performance and will conclude with a su7zested rating scheme.
Test methodolo j will be provided in Chapter 3, Chap:ter 4
will report on the analysis of test results, and Cha;ters
and 6 will contain an interpretation and a summary of tne
test results.
Purpose
The purpose of this study is to find or develco a
method for evaluating and measuring the performance of
aircraft maintenance technicians in the United States Air
Force. This evaluation method Vill ultimately be used as a
performance measure of maintenance manpower effectiveness in
a research effort to develop a model or models for predict-
ing and evaluating the effectiveness of maintenance techni-
cian performance (see Young;1978:l5).
... _ _ i22 7 .. .... . ..

IThe performance rating used must involve minimum
development time and cost. These limitations restrict the
approaches that can be used. The primary approach used here
is a review of published material dealing with performance,
with an emphasis on previous studies of Air Force mainte-
nance activities. The recommended performance rating
method will then be tested.
Besides cost and time restrictions, any performance
evaluation method should meet the following criteria:
1. 3e useful fcr describing performance to manaze- ij
ment.
2. Be valid as a measurement of maintenance tech-
nician performance.
3. Be applicable to different tyces of rerformance
tasks, such as repair, service, and preventive main-
tenance.
4. Be applicable to both military anI civilian em-
ployees of the Air Force.
5. Provide a performance measure throughout the
many levels of weapon systems maintenance.
6. Provide valid information for statistical analysis
in the form of normal performance distributions with
constant variance.
These objectives impose severe restrictions on any
possible measurement system. However, satisfying such
restrictions is imperative if any research effort is to
provide an accurate analysis of the motivation and ability

4
factors affecting performance. As Guion (1965t9O) has
stated, "interest should be focused upon what is to be
predicted."
In short, the purpose of this study is to answer the
following questions:
1. What is the best research method for evaluating
or measuring performance of aircraft maintenance
technicians in the United States Air Force?
2. Does this method for evaluating or measuring
performance provide useful and valid statLstical
data?
rL

Chapter 2
THEORETICAL PERFORMANCE MEASURES
This chapter deals with the available methods for
evaluating and measuring performance based on a review of
the literature. The following considerations will be
discussed:
1. Organization structure.
2. ' uality of ratings.
3. Performance criteria.
4. Appraisal method3.
5. Ratina scale errors.
6. Scale format.
7. The raters.
A suggested rating scheme based on the above considerations
will be provided at the conclusion of Chapter 2.
Orzanization Structure
The Air Force maintenance structure involves thou-
sands of personnel performing a vast variety of functions.
Thus, any performance measure must be applicable to differ-
ent orzanizational levels. This is a difficult requirement
to sa-isfv. as VcDonnell (1979) reports that there are
forty-five thousand Air Force members in the aircraft
maintenance field alone.
Maintenance is concerned with aircraft and missiles
9.
- __________-~.

0I
and is Derformed by military or civilian technicians of both
sexes. The three overall levels of maintenance organization
are known as base or organizational, intermediate, and
depot. Base level maintenance consists of inspecting.
servicing, and replacing parts. Intermediate level mainte-
nance is often indistinguishable from base level maintenance
and consists of calibrating or replacing damaged or unserv-
iceable parts, of modifying material, and of emergency
manufacturina of unavailable parts. Depot level maintenance
augments stocks of serviceable material with more extensive
shop facilities and personnel of higher technical skill
level (usually civilian emnloyees). Although the present
research will include cnly base level organizations. provi-
sion must be included for making the proposed performance
measurement technique applicable to all levels for further
evaluation.
Further generality of the rating technique is man-
dated by the varied tasks Derformed by a base level mainte-
nance organization. A typical Air Force base with a mission
involving aircraft might include field maintenance (FNS).
organizational maintenance (OS), avionics maintenance (AVS).
and munitions maintenance (XMS) squadrons (see Figures 1,2,
3,4, and 5). Meister, Finley. and Thompson (1971), Foley
(1974), and Wiley (I73) have considered automatic flight
control maintenance performance in the AM;S alone, while
Sauer, Campbell, and Potter (1977) dealt with Short Range
Attack Missile maintenance in the MMS alone. Enlarging the
--- -- 9

7
scope of a performance measurement tool to include repair,
fabrication, and preventive maintenance personnel as sell
as flightline launch and recovery personnel, requires eitner
generalized rating scales applicable to many technician
specialties, or specific, noncomparable measures for each
specialty. Separate measures would, however, make any
analysis of overall performance within a squadron impossible.
The nature of the maintenance organization strongly
favors the use of general individual performance measures.
Such measures would be applicable to tte varied tasks and
functions for which the different tecnnicians are responsi-
ble.. Since most maintenance is performed by teams of five to
ten technicians working under one supervisor, the sucervisor
could evaluate his personnel if a general, subjective per-
formance measure were to be used. Thus due to tie structure,
size, and complexity of the Air Force maintenance system,
the present research effort must use a new, subjective, and
7eneralized performance measurement system.
Quality of Ratings
A performance measure is successful, according to
Barrett (1966,t2), only if it meets three standards:
It must be acceptable to the people wh use it; itmust cover what is important and only what is important;and a systematic examination of the results of ratinsmust show that they are reasonably free from importantdefects.
I_

mt
i -
"S ..
II
In
- _
- i

F
-
=2 S
-- a,, -
-C cm W
,I0,
12. .
-E iia
&a. -Ia -
L4 I-
P-4 ca
caa
un
hido
k" ,
=W

'a a w
ca
SM =m=q I
CDw=
ca
-A M C c
Ln
- 00= a an 'a
C=.3
SMca
E ta 0
go Is a a

I- -3
m i
L3L4
ac
3 =- ..7-
a C
ca a .2
o =.
Ca . z
* .wA
4 z 9
-~ a ~* OF

12
1. 7:2. W~~ZE
~ **~* c~ *~ -

AcceDtability
The performance data which will eventually '- e use-
develop performance effectiveness models must be a
by maintenance managers and evaluators as well as resear-r
personnel. The easiest way to gain acceptance t-- e -o
use existing measures such as Airmen Performance :-
(APRs) or Merit Ratings for civilian personnel. Hc,'eeve r,
these measures are used for the administrative cur:czeso
nromotion and wage administration, and not for 'eL:-u-:a
purposes, Mclre~or (357a . r--
mix:ng such in....a-ible e .....
nent L DIac e in the o:.-tib _ role c .
counselor.
If a new z -erforrance measure i_ to
miht be advisable to solici- the c inizrns of ..
using survey!s or lmedaccetance tests
utility. An alternative to eith-er usin: exis :n -r
or soliciting manager oninions as to aceea-ili_
to develoo critericn-referenced test measures. . 'rlor n-
referenced test measures what an individual can .4c,:r :,,
compared to what he must be able to do, or must row, in
order to complete a task successfully (3laser an4i Ii"
1q711 Swezey and :earlstein, 1'75). Suon C.ri erio.-
Referenced Job Task Performance Tests (j- 'sere
tally develoned by Foley (1974) for electronic main:e-a:;.
tasks after much time and effort. 2uci o b ec L t -- o7
might rrove to be more acceptable than su rec: . f-n

14
judgments, such as supervisors' ratings.
Relevance
Acceptance is not enough; a measure that omits
essentials or zives weight to trivia is defective. 3arrett
(1966) fnels that a clear statement of the objectives of the
ratings is the first step, while Guion (1965) believes that
the first step is a judgment of the importance of the concept
cein , developed. Both authors azree that the second s-eo Is
a clear statement of wnat the 4ob requires ana ii..-in4s of
.job behavior that are essential to success. .s .arret.
-,cin- ' ut, 7unztuaib-, cea -,- -mcrtn in an'
office her eac. er-on's -,erfor!ance a fects his nihbors,
but it is unrelated to the success of a door-to-door
salesman.
In decidina whether a rating is relevant, it is
helzful to check it against standards described by 2toIden
and Taylor (950)., The three d efects s they , dentiy are
deficiency, contamination, and distortion.
Deficiency. This defect results if the measure of
performance lacks any elements necessary to give adequate
coverage. Rating or ranking of "overall perfr-mance" gives
the illusion that everything is included while, in fac.,
raters may have diferent ccncepts of 'job elements and
different ideas of what constitutes successfui erformance.
Cummings and Schwab (1973:46) also consider measurement
deficiency to exist if emrloyee productivity is accounted

for by quantity of output alone without also considering
quality of output.
Contamination. Lopez (1968:211) feels that contam-
ination occurs when behavioral characteristics that are
unrelated to job performance are included in an evaluation
method. Such unrelated characteristics i-clude "self-
confidence," "self-control," and "personality."
Distortion. When several criteria are usei to -i, ,.e
perforr.ance it is oossible to distort thir _mpor-anc -.y
imorooer weizhtin. c'rteria ;vhi;h are not secifc Ma',
allow inclusion of dramatic or easil:; observei evens
as frequent tardiness or a lucky o-eak in ;-e.avalu- r
All of these defects can be avoided vizn careful
selection of the oerformance cri-eria to bO evaluated.
Procedures for selectina such criteria -ai 1-1 '3-__ e
next.
Performan:e Criteria
e ideal toDics for ratini must be both imcortant
and ratable. As Barrett (1966:33) points out, these to
attributes do not necessarily go tozether, as some trivia.
areas such as rezularit: of haircuts may be acurazev
rated while important concepts such as outzut and quaiit
are harder to pin down.
In Reneral, Lopez (1968:37) believes that oerforma.ce
refers to a sDecific kind of human behavior in a "system"

16
environment and activity. He feels that some employee
performance evaluation procedures are designed to judge only
behavior, while others are designed to judge only results.
The first approach is too general and the second too narrow
because the proper object of the process is the evaluation
of the act of performing in terms of both results and
behavior.
Guion (1965:91-96) indicates that two types of
criteria can be used. These are objective measures of job
behavior and judgment ratings. Objective or countable
measures of behavior can be grouped into two major catego-
ries: production data and personnel data. "Production data"
includes quantity and quality of output, while "personnel
data" includes absence or accident rates.
Objective Measures
Attempts to use objective data in analyzina mainte-
nance performance were made by Sauer, Potter, and Campbell
(1977), Foley (1974), and Meister, Finley, and 2homoson
(1971). Sauer, Campbell, and Potter (1977:22) attempted to
use individual task performance for Short Range Attack
Missile (SHRAM) technicians through the Strategic Air
Command (SAC) Maintenance Standardization and Evaluation
Program (MSEP). This provided information on technician
performance against standards for technical errors, safety
errors, and reliability errors. Technician tasks, however,
are desianed for ease of completion, which results in
,&4t .

17
very few errors and limited variability. These performance
measures are thus of limited value for computing the rela-
tionship between human resource factors and task perform-
ance.
Meister. Finley. and Thompson (1971:31), utilized
observers to record the performance of technicians on a
very specific electronics maintenance task--autopilot
repair. Two types of performance variables were recorded:
those hiich were based on obJectIve otservat i en ,
elansed time. error freiuency, number of components removed
and replaced', and those which were based on the subjective
judgment of the observer and the observed technician
(e.g.. efficiency of performance. di*ficulty of task). The
drawbacks of this method include the need to train observers
for particular maintenance functions and the lack of
relevance of the measures for service functions (e.g.,
refueling, canopy cleaning. etc.) performed by Organizational
,1ainntenance Squadron rersonnel.
Foley (1974) advocates tbe use of Criterion-Refer-
enced Job Task Performance Tests (JTPT). Ronan (197,)
reports that a Task Performance Test for firemen led to the
adoption of nine independent performance factors, which are
superior to peer and supervisory subjective evaluations.
Such systems are difficult, costly, and time-consuming to
develop, according to Obradovic (1979). No such rating
measures now exist for the many maintenance tasks performed
by Air Force technicians.

15
Subjective Measures
Subjectives ratings or judgments are relied upon by
management as criteria for validation studies. Guicn
(1965:96) reports that eighty-one per cent of validation
studies appearing in the Journal of Apolied Psycholoay
and Personnel Psychology between January, 1950, and ruly,
1955, relied upon ratings.
According to Barrett (1966:33), rating scales are
concerned with three kinds of concepts: personality, per-
formance, and product. Personality is the total of a persocn's r
characteristics. It includes emotional make-uz, elligence,
and what is commonly called character. .e rfrmance hac to
do with how an individual roes about doing -.ork. ncl 'd *i
are workina hard, followina instructions, planninj. and
taking resoonsibility. ?roduct is a cerson's oupuz. ....
quantity and auality of work are product.
The most pertinent of tne three is oroduct. .ana7e-
ment is fundamentally interested in sales,. production of
finished goods. and other factors that are visi.ble and
inherently measurable. Product in some cases can be Teas-
ured directly (objective measurement) and in other cases
it is necessary to have a rater look at the product and
evaluate its iuality. 1easures of product often suf*:er .m
deficiency, as only part of an individual's outr ut .an be
measured in objective terms. They may also be contaminatei.
since much of what is measured is beyond the individualls
control; for example, product mav be the output of many

individuals, not one alone.
Existing ratings of individuals employed oy the Afr
Force are of little value except for administrative purposes.
Airmen Performance Ratings (APRs) are inflated, according to
Callander (1Q79), and are of little value as a single Der-
formance measure. Civilian and military personnel a-craisals
are also privileged information which are difficult to rain
access to.
If production is not available for evaiuat n, th-,e
rater may evaluate how the emplOvee goes aoct his s t,
instead of w.ha he ,r'duces. T-ouh not a. eo.:vely
measured as =rzduots, these job perfcrnance ha -oterionics
are both ratable and imp ortant . Studies by garret: .:36)2
indicate that supervisors and subordinates are cuite sensi-
tive to oer-formance, a7ree on tzhe relative I ..... _ of
oerformance traits, and attach a great deal of ,e: -t tz :=he
performance style used on the job.
Most nebulous, but fI requentl, rated, is personality.
Employees are expected to be trustworthy, loyal, he ul
friendly, courteous, kind, and reverent. However, no one
knows which of these characteristics contribute--and how
much they contribute--to job success. Indeed, agreement on
definitions of traits is much harder to reach than azree-
ment on product or performance.
A survey of fifty merit rating olans by Habbe (I56)
shows that the element of personality, the most di'ficult to
rate, was the most widely used. 2he ratin, of product

20
(using Barrett's definition) was confined to quantity an!
quality of output. The findings are summarized in Table 1.
Holley, Feild, and Barnett (1976,45n) reported siuilar
results on the frequency of category use.
Table 1
Frequency of Rating Categories (Habbe, 1956)
Category FreQ. Category Fre2.
Group 1: The Old Standbys (Product)
Quantity of work uality of w; 7 1
Group 2: Job Knowledge and Performance
Knowledge of job 25 Safety nabit
Attendance 14 Good housekee:Lnz 3
Punctualitv 12
Group 3: Characteristics of the individual (7ersa .
Cooperativeness 36 Initiative _'7
Dependability 35 intelligence 1?
The major emphasis of ratings should be on the prod-
uct of an individual's effort in terms of '.viat he or she
accomplishes. When there are no oroducts, :erformnce
suggested as being the next best level of abstraction tc
deal with, while pure personality variables have !"-tie
any relevance to the performance measurement "taSK.
Hollinaworth (1922:7) :rovides evidence tnat szme traits

21
are more reliably measured than others. Only personality
traits were studied and Table 2 summarizes the relative
disagreement between judges concerning traits.
Table 2
Amount of Disagreement Among Judges in Estimatingthe Traits of Others (Hollingworth, 1922)
Trait Divergence Trait Divergence
Close Agreement
Efficiency 83 Perseverance :
Criginality 86 uiccness -
Fair Agreement
Breadth 96 Intensity
Leadership 96 Reasonableness I:2
Poor Agreement
Courage 109 integrity 117
Unselfishness 110 Cooperativeness 11'
The Best Traits
In this case it appears that subjective apcraisals
are most aoolicable. There are, however, many potential
traits that could be used. Tawier (1967:371) indicates that
it is easy to err on the side of proviiina too many traits
uoon which to make ratings. Lunnette (1 63:252i points out
that the use of a single criterion is unrealistic,while

22
'iush il 3,23', indicates that between three and five criter-
i.n factors surface in factor-analysis studies. The
rztential size of a study covering Air Force maintenance
-emrn1 .... the use of as few factors as possible.
Lawler (1967:371) indicates that one rating that
probably should be included is one on quality of job perform-
ance. When people are asked to make such general ratings on
quality they act in a very predictable way, as efficient
apiraisers of critical incident data from their observations
of an individual's performance in the past. >ne other traits
besides quality that should be used in performance analysis
are difficult to specify. They should be based on the
purpose of the study and on particular types o' behavior
that characterize the important functions of the job. .Viley
(1978,23) included quantity of work, self-initiation, shar-
ing of knowledge, and exceeding one's snare as additional
rating dimensions. In this study, quantity and quality of
output are applicable to all technician functions and are
of interest to management.
Appraisal Methods
A wide variety of appraisal methods has been developed.
The major appraisal methods come under four general oa!Lnas:
(2) comparative procedures, (2) absolute standards, (3) ran-
azement by objectives (IMB0), and () direct indexes.

23
Zomparative Procedures
Comparative procedures are frequently ch~.racterized
by two features. First, the evaluation is made by comparing
one individual against another on the particular di~ension
of interest. Second, this comparison is often made on a
general dimension which attempts to mneasure an emrioyee's
overall contribution to the organization. Two popular
comzarative pzrocedures are strai4-ht ra-'ki.g- an~d -airedi
cornparison.
Str-i:ht Rank %-.r'. an~th vI
a-ris .~ia a-k-k-i to: cr'sijer aIl o~f
o-? an raisel -an! il1er.ify tr~e very . e -t r;vr
s-ion 4 best, ar~d so on thnrough:i all emDlo3,recso to vr
roorest. '3urn-ir.ns and Schwab ( 1973:32 f--eltn
rrozedure is natural ror- most evaluators, as :ce
fre~uertj -norr'allv rared. 3arre't( : n as
that ran~ir:74 f~r-e of lenienc-: ar-s central.~
-hg ability to show relIati-ie 7zerfcrmnance b~*~r.:o
.:)St. 'Saur, I npbell and Potter (I~,~ ar~r.
cr-e'izreN-t a conversion to normnaliz:ed1 perert: -e:
described by Guion (104,4:1E~d tc analz aneac esn
nel --er'ormrance. This nroce'ure .4s a----i
t'nat rerfsrmance IS nor-nall: ; rbt- ver a
sanrle.
.a&red .omtnariscr's. This system re-i-i~r s t. '';
atcr to cowcare each e mnloype to be r*An'-eo 't e--

24
emnloyee, one at a time. An emnloyee's standinz in the
final rankinz is determi-ned by the number of times ne or sne
is chosen over the other employees. This system can- be
tedious and result in a large number of comtarisons.
Absolute Standards
With appraisal systems using absolute sta-ndardc,
individuals are evaluated azainst one or severa. written
standards. T here are two :-eea absolu--te staridar'ic
rnethods. First, qualitative -netrods, q*-ere tric eva',atc r 13
:z >!enti.f7v w:,.trner t a 3:rrai.s S25 or J
acteris' :o. And seconil';, wuant-itative vr .>
evaluaocr attpm'tts to meazurp tne degree tc- :i~ eacr.
apnr.isee '-ossesses certain~'a:rsis
.ualitative 7-lethod-3. Critical. iciers frnt'
c'-oi:-e are illustrative of :uaita-, n ~.7r
4 , ?ieri-s tln.. criticaI incient ~9nJas a ehd
that crovil-es a citr f ~.iiulnerf-r-nance. e'
rater records in a szecial for - exam:.±es of sa~.
rcol and poor Derfor'nance on tie ctart of tne _':_dia.
This nethod is not useable in this study ai it wou'l prcvY;-de
neb-ilous res-;t-3 and be cuimtersome to evaluaze wi;n rn'
ma....erance technicians.
Forced choice crocelures invole a series --f :-~
or clulsters of statemrents about ",-I b,,-a,.-or. - cilutz
is as~ed to c!hoose the item whji-h is mo:st sci :tn

25
appraisee. Travers (1951) notes that forced choice makes it
difficult or impossible for a person to control the quality
of the ratinw. The descriptive statements of job behavior
must be developed for each individual job, a procedure that
is also not useable in this research situation.
Quantitative Methods. Conventional rating procedures
and behaviorally anchored ratinF procedures are examples of
quantitative methods. According to Locker and Teel
"1Q77:246), conventional ratingzs constitute the most coular
form of aporaisa! techniques. at;n scales eneraliy have
zeveral statements about employee Charact-erstizs or behav-
ior. A continuous or d-screte scale is established for each
item. Fig ure 6 illustrates several scalinZ p-ocedures from
Cummings and Schwab (1973:?O). item A is scaled continuously:
Fig-ure 6
Illustrations of Conventional Ratin Scaling_ Fcrmatsfor a Single Item (Cummings and Schwab, 197-,
item Scalinz Format
A Overall job oerformance Llow Hg
3 Overall job oerforance I
1 Overall job performance LLOW 3e-l~w Aver. Ab6ve Hi; h
Aver. Aver.
the evaluator places a c"4eck somewhere on the scale to
represent his assessment of the appraisee. item 3 has a
numerical discrete scale although letters are sometimes used

26
instead of numbers. Item C is also scaled discreetly with
adjectives. Discrete scales generally result in greater
agreement amongst raters and hence are preferable to cont.in-
uous scales, accordin r to Cummings and Schwab (1973).
However, the overall validity of rating scales has been
questioned. Bayroff, Haggerty, and Rundquist (1954:105,
concluded as a result of some extensive work on Army ratings
that "Ratings using different tvyes of rating technicues
were not markedly different in va!iditv." Their comzarison
of ;raohic scales, forced choice, and a c nrrole- checklst
with three criteria is shown In Ta l . I
Table 3
Validity Coefficients for $razhic Razing Scales anjForced-Choice Sections for Various 2rlteria
(Haagerty and Run-duist. l?)
Ratings Rank by 2lass £f:icienevAssociates Standing Recorts
3raDhic Scale:overall'value •53 .35
Graphic Scale:competence forduty a.si-nment . .2c .:2
Forced-choice Pairs .41 .25 .!
Controlled checklist .44 .31 .26
to note that iin abla -- ranking by associates is a su:er or
criterion when compare with the validity of existingF
performance measures such as class standinc- or efficiency
report scores. Furthermore, overall value graphic scales

27
are superior to any other rating method investigated.
An alternative quantitative rating method is the use
of behaviorally-anchored rating scales (BARS). Millard,
Luthans, and Otteman (1976) feel that BARS may represent a
substantial improvement over traditional rating approaches.
Three basic steps are involved in 3ARS3 (1) critical inci-
dents are used to determine job-related behaviors and imror-
tant performance dimensions, (2) the job-related behaviors
identified in the critical incidents are linked with the
appropriate 7erformance dimension, an. (- ) significant
behavioral incidents are numerically scaled to a level of
performance. BARS overcome two methodolczi cal proolems
found in conventional ratings: BARS identify tne critical
item included in an assessment and scale these critical
items against specified levels of perfcrmance. 3ARS are nct,
however, aL-licable in this study as they require separate
scales for individual job responsibilities.
Management by Cbjectives
Management by Objectives (PB4) has been offered by
McGregor (1960) and others as an alternative to conventional
ratina and employee comparison systems. 4ikstrom (1968:2)
feels that MBO is based on two related conceots: "(W) the
clearer the idea one has of what it is one is tryin7 to
accomplish, the greater the chances of accomplishing it; and
(2) orog-ress can only be measured in terms of what one is
trying to make progress toward." MBO is primarily a

28
developmental procedure for individuals rather than an
evaluative one. As such, NIB0 is not applicable to this
case.
Direct !.easures
All of the procedures described to this point require
that employee performance be evaluated or assessed by
someone. It is also sometimes possible to obtain informa-
tion about performance more directly without the necessity of
the performance behavior being filtered throug-h the
evaluative processes of an ara.ser.
For instance, it is sometimes oossitl ;o .0easure tnei
oroductivity of an individual directiy. r2hese measures are
-enerally aimed at the ouan-it'r (e.g.. hourly units of
outrut, monthlyt zross sales) or qualiy(e.., percent units
rejectedscrappage) of output. Unfortunately, nc universa.
quality or quantity measures exist for Air Force mainte-
nance. 1hile quantity measures could be developed using
industrial enFineering job standards, ATI, 65-1. vol. 1,
(1975:1-7) mandates that standards be developed to evaluate
mechanics' performance in only certain recurring tasks.
These certain recurring tasks are those which (1) consume
a large number of man-hours, (2) involve extremely ngh cost
co'nnonents, or (3) require a large amount of equipment or
downtime. This limited use of standards thus makes quantity
direct measurcs impossible.
'eality control in the AIr Force is measured in a

29
subjective manner, since many maintenance tasks such as
refueling or preventative maintenance result in no product
subject to a rejection or scrap rate. Furthermore, the
personnel evaluations required by AFM 66-1, vol. 0,
(1977:.-t) are not completed for eaoh individual on any
regular basis. In addition, no samling -rocedures are
specified to ensure that a representative sample of the
technician population is evaluated. As Sauer, Campbell. and
Potter (1Q77) discovered, even the results of Air Force
evaluations are not useable in a statstical a alvsis of
performance due to the performance sccrini methods used and
the resultant hizh level of oerformance.
Direct measures, while the least uestioaoie source
of jerformance information, are simply not available as a
useable source for statistical analysis. indeed, tne
existing quality control system makes it difficult to ensure
that a sample representative of maintenance technician
oerformance can be obtained.
uS.puested Methods
Of the aozraisal methods reviewed, the only apJlicable
methods are straight ranking (a comparative procedure) and
ratin scales (a quantitative, absolute standard). 3oth
methods are based on subjeztive aooraisals of perceived
performance. The use of either method in appraising perform-
ance is open to discussion. Evidence indicates that the use
of two rating procedures in conjunction with each other
2;i

increases the accuracy of the final rating since the rater
is forced to carefully consider each apcraisee for t5e first
ratina procedure before giving his final rating. Campbelil,
Prien, and Brailey (1960:440) concluded that 'Grazhic sca;ls
following a fperformance] checklist show hizher apzarean
validities than the [performance] checklist alone( ."
Similar results have been found for graphic scales follcwin
a forced choice report, accordin to Barrett (9 6:2§ .t
is suggested that in this study zraphlc scaes follow a
forced strai_,ht ranking a-rpraisai. 1 i ..... snou .' a.t .P
for research n! provide ratinz scale ner- ort_ ..n.va" s
which are normally- uistribu ted an, ac c i e . .
analyvsis.
R atin zEcaIe zrrors
The use of ratings rests on tne as-I'u-n -,n
human observer is a F;-od instrumen- of -u n>a: . :b>'' -
tion, i.e., that the observer is ca,.able of some :,.ree
-reci sion and some de,.ree of objectivi, . 3evznra' c -*
errors do arise in rating scale use, :however. These r-.
include the error of leniency, the error of central tendeno-v,
and the halo effect.
The Error of Leniencv
Often ratinas tend to cluster abcut a Vo;z at the
favorable end of any scale used to aopra Le 7er-nnel.
is due to leniency on the part of as.praisers. 3arrett

(1966:23) observes that often, when the descriptive word
"average" is included on a scale, more tnan half the apcrais-
ees are given ratings above average. This is a lozical
impossibility if these individuals are truly compared with
others in the organization. In order to reduce errcrs of
leniency, Guilford (1054:278) surr-ests eliminatinp the word
"average" from any scale. Accordinr to 3ittner (194),
additional ways to reduce errors of leniency include the use
of rankinr and the review of ra,in.zs t several levels of
su:erv sor. Nobli d work cou].c 'Dund ....er:r -
the e-fect of ceer a:'crasais on leniency.
Error of Central Tenden.
As defined by Guion (t6 o), this error is mar.ke
by restricted variability around the center of the sczle.
Raters tend to out their ritings in the center of t-he scale
when they are not entirely le as to the meanin;- of .n---n _ s
or when they do not know the person they are rating. Ier
definition of ratina criteria and the use of" i a cu-
visors reduces this problem. The use of a few descr.-4iV
ad ectives in the mildle of the scale also creates -,robinms,
as appraisal distributions tend to be multimodal and non-
normal 'see Ficure '). No published work could be fcund
which determined if central tenlency merely reflects a
normal distribution of appraisals over a scale.
Halo Effect
As defined by Guion (l'6 5:Q<), halo is the teniency

32
Figure 7
Response Distributions Based on Scale ..nchors
1owest HiLhest Lowest Low Aver. 3etter .- inDesired Normal Less DesireableDistribution "'ultimodal Distribution
to rate an individual in the sa-e manner on all traits
because of a 7eneral, overall impression that can be either
favcrable or unfavorable. Halo thus results in positive
correlation between the traits that are rated. H4aio may be
reduced by using a format proposed by Stevens and cnderlic
(1934) that calls for rating all apcraisees on one tralt.
then rating them on the next trait, and so on. ';uilfori
(I54:27)) also indicates that one trait oer caze should be
used. Rankina methods, of course, eliminate the halo
effect.
In general, the above errors can be avoided by usinz
clear definitions of traits, by concentrating on a single
trait at a time. and by avoiding limited descriotive adjec-
tives and words such as "average." 't is not known if peer
reviow deflates ratings (i.e., reduces leniency). It is
also not known if central tendency errors simply reflect
normal distributions of appraisal ratings.

.33
Scale Format
Once it is decided what should be rated and , what
means, then this information has to be communicated to the
rater or raters so that they know what to do. This problem
of communication is critical to the success of any ratin
scheme. All raters should rate using tne same criteria for *1
the same purpose to produce useable results that reflec trn
performance of individuals in the oranizaticn. AltrucwT.
this ideal can never be met when subjective ratLngs -r
several consideratiOns related to scale buli:i- c-! i7
ratinY.;s. Among- these- considera-ions are rules 4r w - -
scales, ratini standards, scale anchors, tnr-
ratin- scaies. All of these will bC o n S
9ules for ,'4rit. S3ales
Several authors have crovidel rules :'or wrItIn_ scai r.
Uhrbrock (V%1) nroviles a useful list of two tw :o1ni
scaletl tems. <o',ne of t n mo cr tant C' e. ecS .
I. ax.-ress one. and on!- one, tncui"nt in I2. ,,se sords tt ,' rater inle-stands.Hase th -+ _ ,,=
H.dave thie raters rate vmat tey ooseve, n:: w.t'zthey infer..l.iinate double ne.-at' .ves.
. -xp3ress tnou,-h-s si~iy a-4 clearlv.0. Keec state-.ents internal: consist<r..
'1voi unive-sal terms suci zs all. .i':s -.3 tick to :-he ":resent.
". ,voil varue ccnce::s.
3a: in.- Sthn-iars

34
he is to rate is still not equipped to do an evallhation; he
must know the s'tandlards a~rains-t which tne ratin.7 .s to be
made. These standards are based on the creviously discussed
cinsileration of the tvoes of rafi;ras * the curpose of tne
ratIngs, and the orzanization241 settlng i;n which taev% -are
arrived at. To aid in orovidinc a framework!' for clear_'y
expressi-ng one triouaht in a sca"le, Barrett (190'6:77) pro-
vides three relat.ed standards acgainst which perlormance is
-enerally rated:- ooalo with-tes comr:-arison w.;i',-,
stanyiarcds, aind con uarison witn absolut-_- staniar's. az r r
ao~u~~s-7,n-ar'is ado n-ot exist, f or aita-:31,s :r:~.
-a nr :r anenan:oe techni-< 7ns. s~ or se iu> n ce, o7
on> 1, _C- s -- ac1 i s o-,omz)r Is or-, ',Ki oor S n tos
case t :e aonraisee -is eval-ha-ed i*n rela-,i-'n to o-tner :eoc._o
s:-n-e s-ecified _-rzuo. '2tcohan*,,;r :7, a., ce s:eci.-
-lied, t.-e most -ertinent is made un o-f wcr ,.ers onD-n sarr.e
io r or. a siliar or'e, ~uhcczooarison nIade mos- ii-qc~tiy
woen the rater is asled to ran.: a frcur o1 em 1 1C%,ee S.
scale A nchors
Scale anc.nors are num"ers, words, or : hrases ::' o
tell the rater toe si~nificance of making- is rat;,.-,, a-, a
'-iven n o~nt. 2a'-lor et a!. (lS)foundi toat fo.r-at- in-
co-rorat-n:' behavoral iescr--o't;_os o:- -iesosf':-
s'm.rer,,or in reliab-*ILty, tI.o nu-ner::all'i an --Oorel scoo-es.
M'.vever, a crticism co7-nornl- levelel a-, tne uise of' benav:ral
lescriot~ons suich as "excellent," "i-nI'; favo ratle," "fair,"
an-I "ooor" is that tip wcrds J.) n-, ;t he a o )=-n

Careful work by Tones and Dhurstone (1'.-5) contralictedi thtis
criticismn and supported Taylor's ffindinps. fihe', also iis-
covered that scales in which the end Looin-s are %vioer a.-art,
:ve iore reliable results than do t,,ose 'n an-ch -,he s~xr ad
.s constricted. 4hen onl> end anchors are_ :-ven, -there is
less error at the extremes than at the central val.-ue.
For the nresent study, a ouali-4ty scale coull be an-
chored with the ad~ectives "low-es-r" an!nchs I h~
-4atr-.e.a eol sie "slzowest":' a-r as ancncfrs
i - er. e 1 -a s cale -Z _r s vz.lu avr r
*~o~l 3'-oi :'2r~.or7s :D- cutm oa r ::-.n,, r
n a ss h n .;n I n I ;li ~r~ 7 o n p aF ,,?
?om of1 Rat-rc- Soa les
.- :nv~eroiea,.t~nton hlas oo x'r
rs71choI>..' tc t--?rc:msi scali-.- to outnA7, l
can be 'earriel atout 7nan as a 7easuron7 instrumen. t. r*
ence nas stown that certain- rul es are f'avorable
~~raon~~c faons ~lo r 1 4l5:6' ls t
rules:
1. L-ach trait si'oull occujva - arc
2. 2he line should be i t least f '.ve nf~nr s I :n, D:not much, lon.er.
3. The lir~e shoull have no z-rea.,s or ovsr~&. The "zoci" or 'h1h'eoso telnes sno);' .-.,
in t-e samne i'rect~cn.5. -or unsoohist cate-I raters, tYo"2-
be claced first.6.Descrictive 7hrases or cues sn,)uli beo ceor
as muc& as possi-le at or.s. .l cues sihouli not be s, ext rom e in 'nr:-a

they will never be ao):lied.8. End cues should be set, at a litl i.s,:ance +rom
the ends of the line.0. In scoring-, a stencil should Ite used tnat iEvide-:s
each line into sections to which num~eric-:, va_'uasare assiirned.
Th e number of steps inasae ais endi:. 10 >4)
retcorts on ex~ieriments in ratini-s in wNt-ch he found that
satisfactorily hi-h reliAabilities were obtained on scales
involvinr three to nine levels. The Ar Force currently ,,;es
ten levels for Airmnen 7 erfor~nance iatin :s. a f2cm tnat all
:litarv te-hnicic-ins are :;amili! ar w -h. 2ne use 0: Ur to
ten levels I- t h ss c- 3 1-z rt el z.' ~a-r e tt . 1 7~
;vf. !-~- at r a-,er - so'n at3 r. :~e r L -ii ~ s *n
t-an ;-n rntin-a - -erstn a.-ainst a starvni.
~arrett "1:: els 2es t-,. -n,~. cus s: an
litler~sa~hha, cente-ei on t:,,e c'.em: an o!- ;r ~~
numtier of Sc-I stes . 7ne ever -number ed cales deny :
riter tl-e use of the term "avera.-e" as a r,_"n:- * he easiest.
r?.tn7 t,: make. id-numte-rei s,-.Ies, or h otner n7_-'i:,
allow avera--e ratLnis, as there snculd be -njre avera,-e ~ol
than anv other k(nd. There is n) c-nclusive evience wit-h
whnich to resolve the issue; the cresence ;,r absence of a
central coint when more than five le,-vels are used crooi bly
Ices n7,t -n'2 muoni i f e r'e .
It thus ac: -ears that the best sCale format, 2cr tnis
studyv shoull follow the rules listeri b-/'j hrrc-.' and 6uil-
forl. Th-? ratin- stand-iris sh.u2I 't., based on co-nariscons
with stn'er tc.n:mswit+hin -i -r-ticular 7al-ntenance

souairon. sr t-NO aIject;Ve3 to archor tn- erls
f':r -ualit.: an! iuarntitv of :erfor-nance a,.-.ul se*'-
several nurnoses: (1) the term '*avera. -e' " 1Ob V.j
(2) enerality of the scale 'udbe r7an,:ai;-,- t)
an-'llcable to mtany mairntenaince act vi& 3 a~ ;c:~~'
of obtaini-o- a normal cerfor-ance s:uiz :c?~
proved. and1 (! ) rmultimodal listributicns ,rou-j adl n~d.
crintive al~lectives wouli be civcii.?d. ne , .S::7 :e.
Fr-oull be famniliar to -he raters !-.e to *te :
Airnen Pe' n~ce -,atin; C-n'
"'he .'ater
2here are f Lvs 2.-clsble ca..' ~ -'
~ra~1~.7 (1)thesuc erviscr~c 7; f' t e :-ersc . o a:r.:.
L2 oraiat:a eers )' -'c-o
i .sef, . subord inat es of t. e a:>rase , an'4
outoiie t immzlat-e wsor, -Invr-ormeft of' tr o -a-: r-1 * -
of these :-arties omi-ht be a--)o:Dria.e, ,2cn -ne -
cose (either evaluative or devel-:7,nental1 of' t- e a,.:.ra':ioa1
and the dimnensions ( either cutc -mes or ~t-csoi~ :
or-aised. Thiis stui,. is- Tri-aril c, ncern~ed v t~~iji.
cuiroose based on outcomes.
.)une-visor1 A--ra3.sal
There are two nri: arv U7iatZ3fr: .e-
arais~U rocess *-'t,-- pe-for-nc-'s s 3 ro. - .ra-'-

of formal authoritv. whi~ch exists In mnost -r:7an--za:t. -ns
legitimltzes t e rigPht cr t-e su.r erior to -a--e ev-L-ia-1ve --n1l
levelo~mental leci-sions coricerrnn: hrus s,.2or-iina, es. .:r ner
(1963) ani Vanzelst and herr ',-'53', nave si: wn' tnr..t : ,e e-
visor is the oerson miost employees v.,an- an! r~ca:, ex:--ct
to a- rise them. T hornton (l'Th8) has srnosn trna: 9s,, 2ervisI-r
ratirs arp valid. while 3arre:t (vi~ as sn.ow. -reT : to e
reliable if c-arp is t7ien t3 train --r-13ers- to~ us-- -.n
icceotable ar-r-4iFaI -'r'n. .:rvss .-roe
~~-. te~-'- ex i -ns venr' n--- I~ -r,:e~ra
tr~~.'~ esa, norr n~ e~ a ~ o -. a
on the s,, oervi-sori le';eI fIurnet: ?*na117. 2Iosest to t-e r--
are best able to rite them. Zsuzerviszr rat-.n:-s ar., tnu s
the most ar-zlicable rati., scr'ene ava:Ila-'Ie f'-:r rati-'n: A
.orce nair'ten.ve ners rnnei 7erfor-nance.
Acor~- ~Le-iri --.n '.-i any (lQ) oer rat' r-sdv
been en~a2:s--.vw to have nignh valil.;t-.- in . -e
of liverse f-iture :.erfo-rman'ce or. er'a. .:.ee.:rrr-
not future--zerfor-nance is ofr interest In tni3SL2 y
therrmore, ceer ao-raisais have se.'i.om :cen ie 'or ~~t

outsi Ie o, n: ruitary a caleme3 --r! offe '~n - -
it thus a:ears that th-e use cz e _r zr'
041f r Dver su-cerviso)r of~'2 t~~za r;r~K~
_9.i rat-a >nie-; .c', a!t~ no re;;ort7,:' r _earcn
t"'.is sub ,et uc b.-, found.
~ - .- -
t3' ri v -
Stra3'"''-; -,, orserr. 'IN ts IP r7 r
*~~.j*c. ~ ~I~-a!. - *

t'ni s s tudy. Imediate su:ervisors are .Irno.v e7zatLE
thqeir zersornnel anI the desired perfcr' a-ce ir, a :ri>
maintenance sp-ecialty.
Reommendati ons and Conclusion~s
One of the areatest nee-is of m:ana-7ers of t-~ 7i*IY',
weaons svstem maintenan-c-o comdex is -,o measure
how wqell indIviduals perform on the joCn.
Perfor-mance forms one a the oases for or
ent-Ir? ma 4 e.nanc-o jr-anz:a-,or. -o
ma: er ?anc .. S "C e L-D;r _, I i
n:~ cI 1,- n'rc31 In S --
an c is S
to statl ti-1caL -naivsis or -are :?o.
-or research. Airmnen rfracR:Us
are used "or a~miniszrative 7ur-,oses of c
an! seldom reflect .,ob -ertormance alo-ne. Zr
are based either nn caper and penciltho- et ;uc.
not reflect -ob cer:'or-iance or -on -
&S-rn *vhich are il s',ewaed an.;no~
analysis an! whi or, refl ct comrliance, n:e........
blity. Since e :-stin: data is no',r: ~a
sc-neme must be elo'.
Any new performar-oe ri:,.'zcne ru.e0

cable to all levels of the iain-.ernane or:7aniza- v-n, r'2
higzh aualitN', useful criteria mteasure~s, (9K ave v'AL. -
sures, (4j) be free of error, (5) have an : c';ra- e fo-i-, i-
(6) be used b.,, an appropriate rater. in tn-e f :rsz rin ,
the size o'f the Air Force mai.-trance raizL.reu's
a measurement schieme applicabl.?- to ;.ilan an,,
technicians of all races an,! sex*~s oerformin: ma: ny ~
-in.L from servicinPg aircraft -to rn air n ns, r
Sv s t ems. ."ost na-intenance 2'ar: t-Ce 's -erf-rrncz.
ot fI-;a to ten chcan 32:rse z'
oer'ornace ?eis ,res to >nr~ r
i~vtc~at s~crv-Sors.
Secondlvj, any new me::rn e ~sure tSO x>
nuaiity -c . it must have face validlty. s-An
it ~t e acce-cmtbe to th-e nceozle w-z 'L za
b-elng relevant fo(-r rnanaze-:ent. c c a.-,~
n 're2 dv urS -;7 - eas, ire s t=-' ar 'tO i:~s tnTe'
s'irveyinz- ma~ntornance rnana~eent oersonrne! concern 7r
f'ortrance by technician~s. i elevance can acn _Jeved c-, vy
i n defc ie-n c y, c o n a , ra t I an, an'rd.str tnr, a r LrJzn
tese trYolens Iecends. t s -.-e -2" -ent. :n vw~i-at
no t i s r at ed, andI bY whno i
firdly, the perfornance ratofn.- nz-.st -ae a
sures. Lb.ective ratiln~ citr ar-: .3' -
no)t 14seful t-) th'i S stud:y. '-erefore -.ov ~-it r

criteria are the only ones bein~y considered. Cf such sub-
ecfi;ve traits, nerformance Or Product criteria apzear to be
tn e most valid accorlinr' to existing literature or ne subject.
And of th-ose cate.--ories avai-lable, inlividual quality and
quantity of performance by technicians are thie =~.s- appli-
cable. These c~ncents are easy to compare in- -rsonnel, ;pro-
vide better ag-reement between raters, and provide information
usef':l to marnaement. In particular, quantity and quality
of zerfor-inance are eas-y to relat.e to I ndividual !motivat ion
ari capabtlity 4-. an overall oerforman-e modlel.
rcourth, t--e -;erfrmance ra-.t:m -ust oe as- free of- error
a s ro SS LbIe. Cf the a::,raisal metho,,ds revie%-ied, tine o-ni-.
a7-rlcatle _ hods for this cztuliv ar-s stra ipin r-an'-In-7 a
c~m~ratve rocedu..re' and r-at'_n r scales (a ~z~ctva-
solte -Iardl). 3oth met:nods are based :n slibe4 ive ~~~
sal of -erceiv.ed cerforman~ce. vidence indiJcint-es tne
'i-e c'of rra7,hic scales followin a forced ran---*-. inoreases
t'.ie accuracy of' the, ratinizs. Th'is meth od shculd te a.;ial
for research in the cresent study an-- should -=rovide tiz
scale ocerformance values whlcnh are normal>, J17striouted and
acceotable for statistical analysis.
Fifth, the rating, scale must have an accurate format.
_2he actual rati-n. scale oro zosed by t ns s-!.ud, is ,ies-_,-ned
to minimize errors of leniency, of central tende2ncy. an,, of
the halo ef-fect. The quality and qouantity of performance
ar~oraisal fPorms proposed (A perndices 3 and C) are ailauIted
from 6auer, Camnbell, and Potter (1077). The directions have

43
been edited to c'-nf:rm to Uhrbrock's (1961) rules for a-zraisai
forms, i.e., thoup-hts are expressed clearly and si-z!y, staze-
ments are inTernally consistent, and words thaz the raters
understand are used. To conform with Guilford's rules (1954).
each trait occupies a page by itself, the scale line is five
inches long, and ten steps corresponding to increasing per-
formance compared to other technicians in a squadron are used
to provide an adeauate spread of responses.
Finally, the performance ratinr nust be used by an
appropriate rater. For this study the use of immediate super-
visors as performance raters is the most appropriate techni:ue.
Personal supervision of super-visors, either in a Erouz or on
an individual basis, serves to enhance the quality of ratinzs
and to make training unnecessary,. It might also be a:plicable
to have peers complete appraisals in an attempt to reduce ra-er
leniency.
In short, the suggested rating forms in Appendices 3
and C are the best that can be developed based on a review
of the literature concerning appraisals and on the nature of
the Air Force maintenance organization. These rating forms
have face validity, if previous research conclusions are acceo-
ted. It remains to be seen, however, if the suggested rating
forms actually do prove useful to maintenance management and
do nrove to be statistically valid as a measurement of per-
"oriance. In any case. the supgested ratine forms should
provide useful maintenance personnel performance data for use
in developing a model which accurately explains the contri-

L44
bution of individual motivation and ability to Air Force
na intervarice.

Chapter 3
MEETHODOLOGY
This chapter deals with the procedure used to test
the recommended performance measures of auantity anJ quality.
In addition to the test utilizing maintenance personnel at
Williams AFB, Arizona, a small, independent survey was
distributed to determine the opinicns of several maintenan-.e
managers at other bases on the usefulness of h" :erformanc r
neasures.
The following topics will ze c'ns'.c.2re in
1. The data gathering inst-uments.
2. The sample selection orocedures.
3. The soecific data collection procedures.
4. The plans for analysis of the data.
A ,iscussion of assumrticns and iimita::cns o...
methodology will be included in the chapter summnary7.
The Data Gathering Instruments
The apDraisal forms developed in Chapter Z (Apoendi ce:
B and C) are the nrimary iata sources for this study. ease!
on the conclusions of the previous chapter, these forms were
ievelo-e with the intention of proviling useful ;er:'rmance
information 'or statistical analysis.
In addition to the appraisal forms, a limitel numtev
of maintenance officer opinions were solicited concerninz

the validity of the proposed appraisal methods. 't ias feli
that a general survey of maintenance officers would nave
been overly time-consuming and costly. The overall resui-s
of such a survey would have revealed a consensus opinion of
average officers, whereas the opinions of five or six
officers who have excellent performance records may be
considered more relevant. An example of the officer o-inion
questionnaire and its cover letter are contained in Aoe-dlx
K. For such a small survey, free form 'ansvers were sli::d - .
rather than multiole-choice or t', --vay a rswers; t~s ....
was su7ygested by Neter and . 'asserman ,->-. . ......::t
iuestion on the survey and the cover letter %-:ere fi :ned :
establish racort with the respondent. l ouest~ons .ver
simple and were desipned to b- clear, to avoid 1e.~i-. "
reszondent, -and to eliminate bias. .he oue -. i .. iu _
the followinF:
1. Is individual performance important to
maintenance orr-anization?
2. Are the ranking forms apcrooriate for ac:raif--
performance or can you su est a better azoroa ,'
3. Are auantity and quality useful measures of
performance?
4. ," hich do you consider to be -,ore :->-tao:,
quantity or quality?
5. If one is more important than the other, can ym
indicate how much more imnortant it is':
The responses to this survey questionnaire were n.enieo tc

47
indicate whether the proposed performance rating forms have
face validity and how quantity and quality ra:in.s might be
combined into a single menasure of performance.
Several existing sources could theoretically provide
data to validate the accuracy of the performance appraisals.
Among these are Airmen Performance Ratings (APRs) and Skill
Knowledge Tests (SKTs). However, both the AFRs and SKT
results are Air Force privileged information and qero not
available to this author as data sources. Further, A'Rs have
a histor,,, of cenin highly inflate, according tc 'a'ander
S71 : -) , while SK's are paper ani cencil tests a0mnisere2
only to test selected skills and a- uneven intervas. .. u,
neither wouli in actuality be an aprosrLate source f:r
val'daing the zerfor7'.ance ratin.s. i-n fact, there are no
available Air ?orce records that would be useful for
valid-!.::on of s!eed of oerformance--or iuan".ity--ratin,
data.
The source used in this research for a tossible
validation of at least the .ulity of performance rating
scale may be referred to as maintenance nuality control ( )
infornation on technician insoections under the Air Force
M-aintenance Standarlization and Evaluation Prcgram )
"-P persornel nerf rance scores are basea on sczarate
failure levels cr baselines for each type of maintenance
task. Althourh they rrovide the best existing performance
data for valiia-t;on use, difficulties may oe encountered in
usinr YSEP. ?or irstance, personnel evaiuationz ar- not

48
required nor completed for any one individual on any regular
basis; thus some of the technicians in any random sample of
technicians may not have ISEP records.
Summary of Data Needs
The data to be gathered for this research thus
includes (1) suoervisor appraisals of technicians reporting
to them, usina the recommended rating forms (Appendices B
and C), (2) surveys of a few selected maintenance officers
onendix K), an (3) MSEP reports available for most of tne
technicians :rawrn in the samile. The samole instruments
for (I above were reviewed and approved by the Air Fo'rce
Military Personnel Center, Randolzh A 23, 2exas. uman
subject clearances and a orivacy statement example are
included in Annendix A.
Samole Selection Procejures
Selection of the maintenance technicians for the
zamcle proved to be difficult. :t was desired that onl-.- line
technicians be evaluated, and that they be evaluated b' thei -
immediate supervisors, who are responsible for scheduling andI.
insnectinr assigned tasks. No existing source document used
by the Air Force appears to reflect this information on an
accurate and current basis. A complete istin of all
maintenance line sunervisors and their immediate suborainates
is neces-ary if a randomly drawn sample of shift sunervisors
ani their subordinates is to accurately reflect tne entire

4
maintenance organization of a chosen Air Force Base.
The existing personnel listings of razincg officials
responsible for preparation of annual AFRs does not reflect
current work group assignments. For instance, in examini.2:
the nersonnel listing at .illiams AFB, Arizona, it wa;
found that one supervisor was shown wi:h six subordinat s,
none of whom currently reported to him. Another su ervisor
on this same personnel listing had three a-.nu: sr1.-
nares listed, one of whom was n .urrnt..........
.hil - he actuall>- su:ervised a an .iziona svi+n '.:
o' n tft ~j:'. a .Or*2 nc
n sel:ctin- . sa :-;le.
Anther data base, the 4aintena1nc-2 a.n n
ma-tio.n -i- Cntrc I 2'rs t em...3 ZS ma-', -.31 -
ter~nnelas-i-n--d th mairtenrance rai- r.
f le ~oes not ijenti fv su:;rvisor3 zr their i:n < "ia e u . -
na tes. A* s a cons equence, qt ' as ne csa , sa o ,,n a
.urrent roster from each maintenance section :.r-_or to draw-
ing the technician samulo for the stu dy.
In this study supervisor,- grours w'.-re r-njoml iran
from a listin. of all scuch 'our. i each maint-enance
slua d.rn, us t - ra,-do number tarles in 3-.....
{ ' '9 :5-). in a fcw oases :- ..ervis .r. . 7roups w -,'e a ls:
chosen b-i lice rolls to d'.1e the par*ticular si t- -
included in the samzrl. At aC tnree and no more than five
subordinates were se.cte t be 9va 1 u a t -',v a'h :u,+Crv r.
'S.

50
Where more than five subordinates reported to one supervisor,
five subordinates were selected for the stud:,, oy azain
using random number tables. Alternates were also selected
by this nethod where more than five technicians were
encountered in a group. This stratified selection method
allowed the researchers to control sample participation, to
eliminate supervisor bias, to obtain a representative
sample, and to allow supervisors to evaluate enough subor-
dinates (five each) to obtain valid comparisons.
Sample size was set at ninety technicians per
souadron (approximately twenty percent of the population)
cased on the sample sizes used in similar stldes. Eizhte
corresronding supervisors per sauadron completed technician
evaluations. As the maintenance oraanization at Williams
AFB is made up of two squadrons, the total sample drawn
consisted of 169 techn~cians (some supervisory groups nal
less than five technicians) and thirty-six supervisors, .io
research dealing with Air Force maintenance technician
performance has reported useful information on the effect
of sample size on statistical tests. This research shouli
provide information on adequate sample sizes for minimizing
the probability of erroneously accepting a hypothesis (Type
II error) for certain statistical tests.
As for the maintenance officers selected to answer
the independent survey questionnaire, they are personal
acquaintences of the author and have all manaed -aintenance

51
operations graded as excellent or better by !ajor Command
inspectors. The majority are now retired and should thus
have felt no restrictions in supplying candid answers.
As has been noted, sample selection for this study
was very time-consuming. To bepin with, much time was scent
in evaluating existing rosters of personnel before it was
determined that the rosters were inadequate for drawing
the names of maintenance personnel and their immediate shift
sunervisors. The sample was randomly drawn from all
suoervisory ;roups with more than three technicians recort-
in, to a shift suiervisor. Details of the >::act !-.a
collection process follow.
Data Collection
The sample data was ccllected at Williams AF3,
Arizona. To o.rotect the orivileed nature of the supervisor
oerformance appraisals and Privacy Act reouirements, control
numbers were assiFned to the technician narticipants in the
study and the researchers supervised all appraisal and
evaluation sessions. All particioants completed the survey
forms in a central location and during specified time periods
which allowed for participation by personnel from all three
shifts.
The independent officer survey questionnaires were
mailed to eight maintenance officers an4 resconses were
received from four, as the remainder had movei and left no
forwarding addresses.

52
in Chanter 2 it was theorized that peer a...rai'sals
might deflate ratings: it was also noted that no researcn
had been done in this area. No teer a-oraisals were atem.t-
ed in this study either, due to time constraints, to :.qe
difficulty of providin the necessary information to all
169 carticiDants, an- to the wide range of e.:erience levels
found among any five technicians within a supervisory group.
The samrle size simnly made Deer ainraisais too difT Icult to
administer, which may also he the reason ,hny this -'-c4 h-d
nro, been used in the cas7.
Da-a collectio.n was soread over a of w o-an-
1 e -s -. 7 -,
..e-naef weeks, : r . turin; Srv
7e verall tecnn cians cnar .eS nf: and ...... s -
collection time oeriod also allome -e for :hangeot in vr
reuirements. These difficuli.es- were relativel: o:;o,
however, and the data collection methods were suoosu
Data Analvsis
in analyzina the data obtained from te i '
samole, the first consideration is to determine if the
or,anization is adequately represented in the samnie. !n
this case, the maintenance organization is small enouh to
comoare the sample populatiorn and the '-ase mainte.:. :oe
-co-ulation with respect to several aa terivt cs
Statistical analy.sis of the data should then esta'-
lish if it is suitable for use in a rerression analvofs.s s ant
if there are significant differences between quantity and

quality ratinzs. Next. comparisons will -also -iiK
,uantity is related t- taa-ity -ne :r'.?~e~:~Vz-
subjective appraisals of the tecrnilcians. F-4nally,
attemot to valilate the iualit y rattlr.- Sc'31e ;.i s-
correlation analys>- to find if any linear re'z-......
between 'YSEF data and -Whe performrance ia" ;o
study.
Descrioti1ve stat,-st;-c-s will lob ?r:-
lo m Eoei cal1 (3MD ) D e taie aa- Mct
ini c- ?n: d..Jl r
an! a~--. - r~n3,A o. . . . . . . . .
ve.rsus iuant_;'..y o0' a:~ r a7?~i:
T1~IS char:ter has covree tK - e ~~
obt-iining- the data for this tz;: the diata :r:z
istr'.ii ntO, sariolePs?ecti-r., -!a-ta oohiecticn.
a' ,s t.Ians. At tn 1 ccin 1- -1 , c Ina s ,
For examp~le, uncertain-,-, exjts .-ari i -. -'- r ..
by th e spe c-, '-ed sa - - 1e s Lz e, a df Ii Ktv whi:- >.
rrn. ved only sifter analvx-.-. iS ?t. .. . .

54
small number of maintenance officers surveyed concerning the
relevance and usefulness of the appraisal forms may proiuce
results of limited use. Finally, the lengthy data gatherinF
period of two-and-one-half weeks allowed for a number of
changes in personnel and policy which may affect results.
Most of these limitations will be resolved in the next
chapter on analysis.

Chapter 4
ANALYSIS
The analytic purpose of this study is to develop a
suijective cerformance rating method that provides -,e
following:
1. Per-formance data appnlicable to re-ression analysiLs
as a dependent (Y) variable.
2. Performar:oe -.na:rt has some can;oa:u.
va 7idity-- ccmpjared ex;--:,r:7 c~a~ ie---ures.
D-::ormnce .-ara w !.:r -e-raz.±e -3-c7 -:I
P-. Pr f o rman ce a ath at a,. c,;r at -lEvI r eflIec -.s t ',
or-anizaticral corposltic;3.
The analyses of hesample data th- - I)- -ie iscussed i-
t hs chaoter are c-ased on tIhe above re~uir .-en s. 7 1 :rs: n
zamcle will be aralyzed to determi-ne ;_f --I reflects c~a~
za~ional. compositt-on. -3eoondl:i, the sa-mcle data's statis-
t1-al pronerties will be ccnSidered. Thir-dlly, tne -,-antity
andi quality ratin,-s -will be compared. Fourthly, the
association between existi-ng performance measures (S?
an,' -he sam-ile qualitvy ra-tingzs will be inves-tI -ated.
Finally, the maintenance oierresponses to the o:n-;cn
survey *I!l be summarize-I.

Sample Comnosition
All of the technicians and supervisors included in
the sample were members of the maintenance organization at
Williams AFB, Arizona, a USAF pilot training base. This
maintenance organization differs from most base org-anizations
in that the avionics repair function is a branch of the
Field Ylaintenance Squadron (FMS) and not a separate s'quadron.
The Williams AFB organization structure, leolcted in Fi:ures
ot hrouzh 13, is otherwise comparable to tne 7eneral 1ir
Force orcanizati:n s-ructure depicted i i s I
5. 7he actual nuber of line technicia.s was e:tracte..
the '!aintenance anazement information ani Control System
,.,vC-) ; these figures may di -er from authcrizet .
limits and, since suoervisors are exoluded, may not =oinoide
with s')uadron strenpth fi-ures.
The random samoie of 169 tecnnicians was intendedi t2
reoresent the entire maintenance crganization. Ei hty
technicians were selected from th e Coeraitonal o*,ain-..- ... C..
Squadron (OTyS), or 22.6 percent of the stuadron. Zighty-
nine technicians were selected from the Field .ainenance
Squadron (FMS), or 18.7 percent of the s_,uadron. The grade
distributions of the sample closel.1 Parallel that found inthe organization (see Table 4). The F!YS sampie and s-uaoron
are comnosed prim.arily of sergeants and civilians, wrnie
'17 is orimarily comoosed of airmen.
The relative representation of squa4ron branohes in

57
2 3'
;,
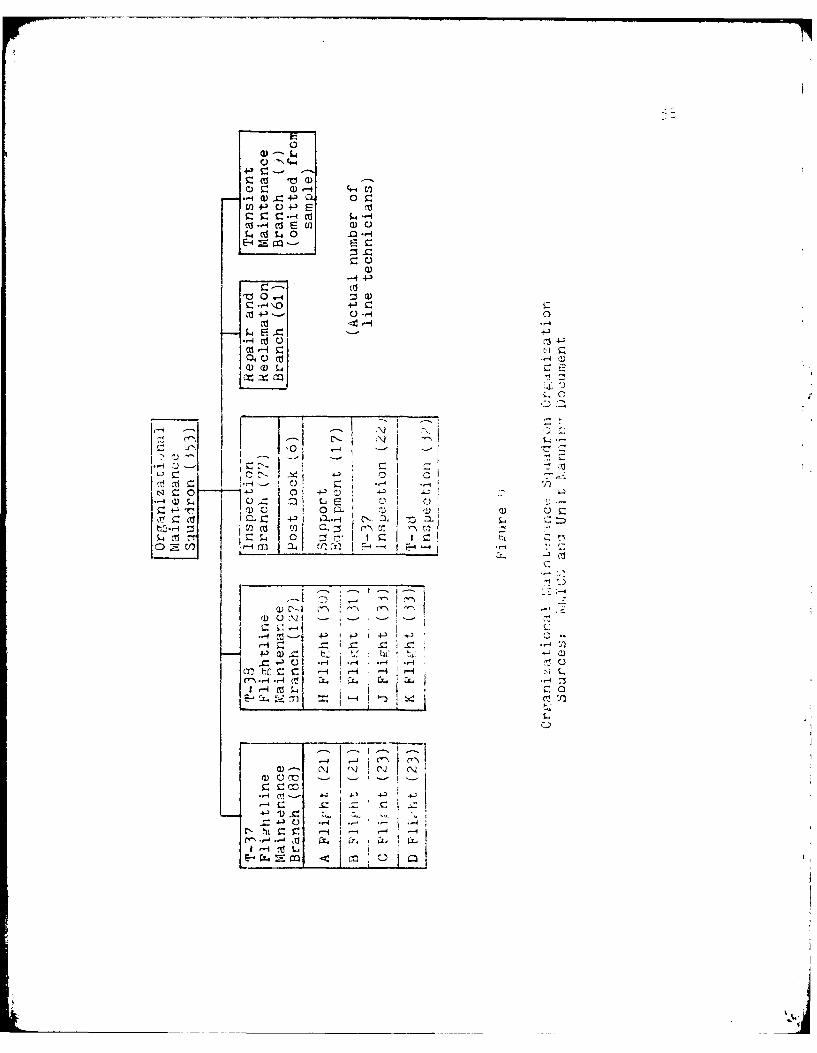
6
cli 10 Cf
U) -P 04-3 E 1
E--4
It -4 -
Cd U
Cis)
O~C12a--iI'. ~ -4-- -a-
-zt n :-
0 ~ :
C7) Z C) S4 0 1
+~E-4
c- h-- c
)-- M 4 C: C
a-sc
.,-,-.-'
l > _I S-E- rZ4

59
c, a)-a. FC\J a)
/ o0.--- 3
$4~ $4
OC:
l 4 .4-I
SC
0 E
OU -C.-) - -44-4.4-
4-0
, I
0C C)& $4~~.iC*'--4 ,t,.
4J
,~ ~4 -4
C"
[C-4-
L tV-r4 C"
o)L.- L~(
Ual ~

0- .,1 a
E-4 00 >
0i) '.0 C)-z c.)
Q) () (1)cn:Z
Er) En~ r-.
-4 0~;I
C..)
S- 4 ~ 0 -.....,-i. ---
C) a) a00
00 ) 0
0f . -4*- ,
s-A~~V 0---jC
0 L,(0-
4-) CC
N. - 4J
aJ*- ) c 0al m

61
4- W.-
14 E
In 0
co .,j>)..- 4 U
pqa
+3 ) (\40o) 4)
0 ..0
0)0.L
> O..

62
cn4-3-4 0(.)
4.
:5 :D
t44
>0
'1...--
ci C,',
SL U)
ww
-. '-" C
.=I.

'1 63the samnle is denicted in Table 5. The CiMS sample closely
parallels the squadron population. The ?~3sample is not as
representative due to the large number of work sections with
few technicians.
The 0;'S samole included ei4,7ht. day shift supervisory
-roups, eiaht swing shift gr oups, and two mid (ie. rave-
yard) shift grouos. The FIIS sample included twelve-- da.'
shift Prouns and six sw~ing shif-lt aroucs. hai :,ew sw,~
shift ~rusand f mid shift groups mitr three or- :-,ore
te:hrn.ic,-ans aije.
Grade Distributiorn of .3amole and o4 r
;irar. Total i.T! S.3't 3,7-, A 1 IAX .-
Eo7 uiation h "7 122 20 3 '6 :7 C
-,noe 23 :o?ercentage IC 3; 3 3 5 ,
?cou.a tI o n 33 . 3 7 -,,6 3?'ercentaize 10' 0 127 3 *;~
3am-;le 3Q L, ~ 4547er-c~nta~re O ' j 9 6c c
(Dcoulation infor7-ati;on from v\C3
:n. short, the sample ac-:ears to rezre-sent fa.,.lv; t.e
maintr-ance? orqanlizati--on -as a v.-hole. The rar,-d4m s-2eeCtijon of
s:i~zrv;-sor-i rrouos with -a subceo-q,,ent ran~cm Celetion of -
more t-ian five technniciars from each icroup appears to have

provided a representative sample in terms of rank structure
and ex~erience level and relative branch strenr.ths.
Table 5
Relative Squadron Branch Strengthsversus Relative Sample Branch Strengths
, of ; or
Organization Ponulation Squadron Samnle Sam'.ple
CMB Branches
T-3- 1 i ht 127 23 ....
-. insr ect.. .j"
Ret. an'l.Reclamation 61 2, 1C 1 "
Total 3}J
:,~.: Branc .es
P r'o -u I s : n "4 2 2
Aers-=saceSvzstems t11 233"3 - .-,
A. 32 6.7 .
Avionics on I s.2.r:)tal '
(zo:uiation :"formati n from
.... o. a t.,3n ,.;.] 1 I..

*~~~ 5*- - ~ *
Samnle Statistical IPronerties
All technicians included in the random sa. Ple were
rited on quality and iuantity of performance by their.
immediate su-oervisors, usiniT the recommended forms in
Appeniices 3 and -1. Cnlv the data from -,he ratin~g scale
was used; the rankings were intended to aid the su,)-ervisorcz
in their- ratinpg efforts. The data col~lected is shoan in
The r :-x'in7: :Thrns were oi~'irnaIi des-:-rnel -n- alwc~
eor ?cni. u -a,-ns e -:ween z r_ r: -~"~
hive oro ic - i iSto r~n r ; am .Sr z'I2 -_ ~ M- e*.
iL -oor:e7crE nrcced,.r- e~ a .7 0 cor'- or r:n
value result ed from a ratinz between a i ' 9.2' r . I thi s
sam-,e mcst ra-tins were grouped irmedately arounr.4 -ne rit-
.n u-ncerc, wnicn required ad.Ostmnrt To -tne fcl owin.- rat-_
Ratirn- an-pe Ratin Value
9.5 10.0
> .5-9.5 9.0
> 7.. B.Cj
>05-1.5
0.50.
:Se ofthis ratinz: system resulted in the quantit': and
4u'mlitv ratinr- valuies re-orted isAozendix D
The resultin- hi~t _rans for quantit:, and -,uali tvY of

i00
performance for OMS and FMS are presented in Fi-ures 14 an:
15. According to Bradley (1963:55), the discrete distribu-
tion case can be treated in the same way as the continuous
distribution case. Difficulties arise in the use of non-
carametric tests due to the large number of equal values and
the potential loss of test power.
The sample means and standard deviations were calcu-
lated using the BdID Detailed Data Description orogram (?-;
This information is included in Aopendix E. his Ororan
also computed values 'or skev'ness -nd kurt s s, who:. w 2 e
dIs cu ssFe d 1o- oi n r a n a n, i. I f E.....:-a..~~~......... ........... ,.. . .. ...
S. --- -), Dat a
The Maintenance Standardization an.!
rzram ('ISEIP data is also inoiuded in ... n. s
is the exist-nr in.o:ra-ion ..t "ic, iuali-w ratin s are
to be comnare : in an attemnt to esta-l'-. s: me vaAi: -, '
the sub.ective -ualitv ratin's -he > data renresen:
two years of oersonnel insoections while tne sube:i-v,,c
rat.ins represent suervisors' atzraisals at one 7artiu--r
ooint in time. The M Z2P peroonnel evaluations are '.-Ze:
on compliance to eouipment soecifications; failure of ,n
evaluation reoresents either a major sat':y .... ..
the accumulation of more than the allo'ed numoer C'
discrepancies for a narticular tas . ln orco : e n-
consideration comnleted maintenance ac-_ins , .', . . .
ma.ntenance i ns-ections ( aI), and ta_ e va.Iuitions n,

67
2O
13 15l
3 2 3 3 2
uanti ty(n=Jt:xooc =.6
S22
2 2 2. i F T...I _ _
I3 t 2 3g 5 6 7 9 i
2ua1ity,(n= 3 =7.231; s=2. I,
Fi;ure 14
FMS Histozraris
kStatistics from Appendix 3. BMDP analysis; the numcerof technicians recorded in each interval is noted
at the ,oo of each frequency column)

18 19
3 1 2 35
r 32 5
2 2 C)
2 3 5 6 7 8 iS,Qua 1i ty
(n=50; 7=7.200; s=1.958)
Figure 15
OMS Histograms
(Statistics from Appendix, 3,DP analysis; the numberof technicians recorded in each interval is noted
at the top of each frequency cournn)

Since some supervisors also work as line iec nn:zans,
comoleted supervisory inspections (CSI) a su- 'ervicr
evaluation (SE) are also included. :he _E? score uS 4d i
this analysis is based on a weiThted aviera.e of all
tions subtracted from one so tat an indi;vidual ..3.. S- 3 .rr
of 1.0 indicates that no discrepancies were no-ed duri -_
an inspection of a particular technician's wor;c.
The manapemnt of the maintenance or-anzaion 'at
Williams AFB requires that every e iin r4
inscect-cn every, e -e . m rn s, a .....:n. the---I
does not reiuire an insz.on so --, - "
7'olI I--v, a r- -. )ft: rc", e e2~~
squadrons were -ia "i'r --. .. arr--'ziaran- h
insoected (see _'abn 6. "- t"is basi-
Ratio of Personn-eI A-waitir4can/io-a1 Personnel' .....
O VS -ooulation 1i -. 4 ..
FrS Sample -,.-
F:."S Fooulation .
?orulation data I= from 4C n 1n s all su'>:and technicians.
wouli '-e incomplete an- unuseatie as a .er:,;rmarce
for t-e entirn or,-anizat4izn. t s also si4 cK'~-

7
that of those technicians irisnected who were IncludedI in th.'e
sample, O.S technicians received an averafge ofIL 2.7 rse-
tions in the past two years, comparel to 1..7 inscections in
,the past two years for -' technicians.
The histo-arams of the quality ratiros an: .2J scores
for those technicians in the sample who recei'ved ise~~
are nresented in Figures 16 and 17. The data conCern~n-:
samce means and standard dev iations was also otbtare
usinZ t.he 3M? ro-rram. A :relarniarr s'ot no the
h~sto-=ams migh-t Indicate tha t-. av=oe of
In comoariso- to :. razn.
Jased on the histozrrams Lreserted in -ohi:s e:o
the cua lit-; and ouinti-VJ of ccerformnanze ra-::i-n- da~a
nc-.:i te analyvzed wit h re~czard to n: n o~si~
-;71alities. :stsi,:ni-Iioant Is the relation e.icnt>
historam istritutions an' h omlilz~~in
,Nor7-aliov an!!.Anolioability toRezression -,na~:_,s
The maintenance techqnict:;an ratinrs were :des: sine:
use in regression analysis as the dependent (Y', variables.
One of the a-sumotlnns of multiole linear -ooscn:
that the observations for the d3nendent var. alas are
indecendent andt drawn from a normal.droioto (Net-o-r an-:
Na s,.erman; 10 'Th: 21') Nomait iS also mc.sird
narametric tests t-at couli be used to comoare th- -ouanzi..*-.

1 11
r 2,Ir
2 2 2,
. .ua !i ty
12
I ~Y SZ -- , p
'n=7'1 X=.,l ; s .'72
Figiure 16
FMS uality Ratinpgs and
(Statistics from Appendix J, Correlation -nalv,is: thenumber of technicians recorded in each int,.rvaj.
noted at the too of eaoh :requenc:y column;

72
18
C2 3 3
, ua i i tyn=4.3 S=1?
17
36 3
0 1 2 3 4 5 7 9rSEP
(n=63; R=.700; s=.263)
Fizure 17
OMS 4uality Ratings and MSEP
(Statistics from Appendix J, Correlation Analysis; thenumber of technicians recorded in each interval is
noted at the top of each frequency column)

7I3
and quality histowrams.
Tests which can be used to test the normality assunr-
tion include the Kolmogorov-Smirnov and Chi-Soiuare zoodrness-
of-fit tests. The Kolmogorov-Smirncv test is not anplic-able
in this case. as population parameter estimators can~not be
s-)ecified in advance of testinF (Lapin;Q7:J26. d h
Square test does allow the use of sample estimators for
testinga -copulation zarameters. The Ohi-Square test, 'ncwever.
ismrefiul t t o i nterpre t and1 th e rr 3bat L.__ tv f"
cctoza false null hyoothesis ,'v 7y:
weAd~iyd(ther? are several !vax's in whicn zn ? n' I
hrodsscould be false ). 2alculatlons for the Z h i-3, r'
-oodness-of-fit test for the F1,1 quality of performance data:
are included in Ancend'ix F. A summary o: t-e Ch ---7uare
results for all of hesamnle data is inclu e!1- 7 _ -'
'The smnallI Type error si zn*f; carnce ', e! z %h.
In!tcate oor fits of all th.3 diata to- tnhe rc~'al tiuin
Fri.-starnce, 1the .01 level of sig-nificance for
quality data _-dicat-es that if a distributio.n were n-orm-iI
with a mean of 7.2 and a stan-dard de-viatiLon -)f 2.2, then,
-there w-,ould be a 1 p)ercent chance that a sarple could be
obtained from this Jistribution yielir. a 21hi-So ,uare va31ue
eolUal to or areater than S.0. imilar inter- retatzns 2:
the r enaininF. Tv-ce I error levels -ndcate that ail.' tn,
samnle data have relIativelv low crobabilities of oeir- frc-n
normal iistributions.
The relatively poor fi-t of t-- sao1 dta to nor7mal
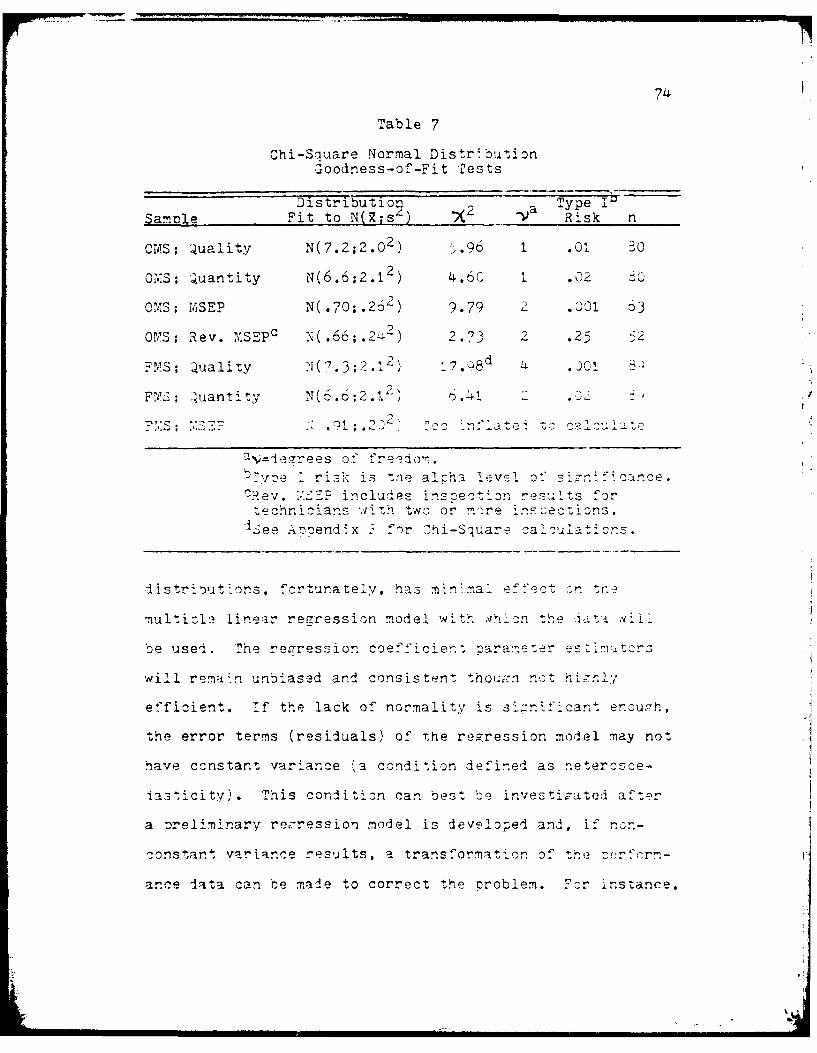
74
Table 7
Chi-Square Normal Distribu-ion
"Zoodness-o'f-Fit Tests
Distributi' x Tye 1Samole Fit to N(R;s IV~ Risk n
CM4S; uality N(7.2;2.02 ) 1. 601
201-S ; uantity N(6.6;2.1. 4.60 1 . 02
0O's ; IMSEP N(.70;.262 ) ?.79 4- . 01 63
OYS ; Rev. -\~p (.6O';.24 2) 2. 7 2 .25 2
FYS; uality :(17.3;2., 2) 1 7 *08 d 4 30
F'M; 2ua nt Ity 11(6. 6 2. i.'2 .! 2 .)-
aV=Ie~zres o." fre-dOrr.i i~- s tne aloha level! o" fni -c-nce .
t Rev. iI2Pincludes inL7oec tion resul ts fortechnicians ai-thI two or n-,re sezzs
'Iee Aocnendix f "or T7hi-Square aoltcs
a}istriout--ons, fortunately, has mnnmai ft'eo2t ton ,,
muliz3 inear rearession model with a'hLcm the Aa; a qI I
be use-i. The re Tressicn coeff"icien.; para',:e es-vmatrs
will rema;n unbiased and consistent thou~n not nl
efficient. if the lack of normality is si:-znif't cant encu,7h,
the error terms (residuals) of r7he regression model may not
have ccnstar-t variance ,a condi-ion defined as neterosce-
lasticity,). This condition can best 'Ce invest.iated after
a Preliminary reE7ression model is developed and, if ncon-
constant variance results. a transformatio.n of the 2rr-
ance data can be made to correct the croblem. tor instance,

75
if the error term standard deviation is proportional to t-e
square of the factor level mean, the reciDrocal transfor-a-
tion stabilizes variances (Neter and dasserman;1,74:597).
It is often the case that the same transformation which hel:s
stabilize the variance also helps normalize error terms.
Neter and Wasserman (1Q 4:123) state chat:
It is therefore desirable that the transformation forstabilizing the error variances be utilized first,and then the residuals studied to see if seriousdecartures from normality are still present.
Tt is thus ao.arent that normalit,- a h ... e
d stributicns is not a seri ,s ...al concern. --..
analvsis. .r.-nornality does have serious e::ecs -n ,
whic.h can diferentiate between me rean and ,' in.. o;'
sa e .istrbutions. The skewed a ...r e of th d1 sribu i !....
aoears to t.e the particular iualit'./ ieadin7 tn oor
comparison of the sample distributions to normal distri.Du-
tions. All of the samole distributions are s.vewei as ir=L
cated by the data in Table ,. The effect of s.ew- 1:eartu..
Table :-
Skewness and Kurtosis of Sample Data
-uantity ' uality ... ,uantity 'ual it$
Skewness (b - -. 000
Kurtosis 2 . " .21 . '
(data from -P'NDP analysis, Aipendx L
from normality on narametric test- to soyn:are ,eans is

76
significant for small sample sizes but insignificant for
the large sample sizes used in this study (Davies;1956:55).
Most parametric tests for the comoarison of means, however,
require equal sample variances. And tests that determine
variance equality are significantly affected by skewed
sample distributions. The sample distributions all. with
one exception, have equal variances with a Type I risk of
five percent (Table 9). A calculation to test for the
eciuality of variances for the F" "uantitv a;ri ualit-y a
is included in Anoendix H. However, accordina to .Davies
L :,,i. the decree of s-ewness and ur'.fis exhic-
iced by h [ '-la th,- ""-re i risk'- becomnes close r t:) .
oercent (s ,e Anoendix G,' Tis discrepan.y. des not iecrea1se
as samole size is increased.
in summarv, it i-s anparent that the sam;Dle _strcu-
tions exhibit mar-i--al normaiit; .due to skewnezs. As the
normalit y assumcitn is not critical i. -he iSe of -'e
mult le line-ar re-ression mcdel. this data ts a : io3bIe t
re,7resSion but should be used with caution. In carticular ,
the redress~on rr.siluais should be carefull; inspected for
heteroscedasticity and, if necessary, remedial transformations
should be utilized. The use of Darametric tests for the
comt arison of sample listributions is -uestionabie due to
the skewed nature of the distrIbutions. in particular, I:t 1
difficult to test for the eoualitv of variances with a T7-ce
I error of less than seven percent. while variance equality
is a reauirenent for most narametric tests. Non-parametric

77
Table 9
Comparison of Variance Equality(see Appendix H)
Type IVariance 1 Variance 2 F vV2 RisA
FMS iuant. FMS Qual. .9966 @,36(4.25) (4.26)
FIMS Quant. FMS MSEP 1.520 69.6 .050-91t (2.57)
FMS ,uant. FMS R SE Pb 1.86? 35.35o .20) (3.?)
C:.IS ";.uan't. 0X 1.13 1, tT ., I., 7, . .7'
C S al. C 'ual , S - 51
2-.25) (. ,I
aV=dearees of freedom.
bR:,'SPv includes insoect,_on results for technicianswith two or more inspections.
cN.S. (Not Significant). The null hy.othesi- isrejected and the variances cannot be accepted asequal.

tests may be an:clicable if the sample histogram iistributions
can be used with this type of test.
Rating Corinarisons
The next area of interest is the compcariso. of the
quantity and quality ratings within and. between squairons to
determin~e if any dif.ferences exist for the rating7 distribu-
tions. Due to the n'on-rormal distributions, cne tests for
liffere-nces will be conservative andi will eitner be non-
canametri.2 or 7-ram.etrio * with v\rira-ce e-,ualitv not
Hollander and 4olfe <3,oost ncn-.-ara7nezroc teo.s are
base4 on r-ankiru7 nrocedures. 'alii-1i1 is_ ser::usly affect;?;
b%' a larz-o nu,_oebr o' ties ;-n th-n 3a:Ie iaa an na t ro_,ur-
for thi, s tu-,iv da t a. -e non-carametric t -t tsnt is
cacle for tr- ocmjcarison of zamile dsrzt~~
K<olmonor',-tZirov two sam'ole tes-,GbzslOc22
this tst only two assumztions are neeae,4t ro-Iative t the
st:ud-y Jata: first, that the -ouanti-Ly an~l m)ail'; ratinr s
for each technician by a sinole supervisor are indecendent,
andi, secondly, that the iuantity and r;uality of iperfor-maioe
lata be c.Siiere'i as continuous variables-. ThujS tnc?
oro ab ili-. CF).j v-alues f Dr this 'test snhc,;ld cc consd-ei -,Q
7e c-nservative "J ibs-on;1?6 :25W,,'. The :omrv~'r~
*test results su-, -arized in Table 1fD indicate that tsni
-,uantitvy an-A iali ty ratina distritutiins for each 7-ialron

are diff-erent; however, the test does not, s-.ecifyf in *n',at wNa
che distributions are differen-t.
To compare means for the different sacle di4strJitu~i-'srz
the Behrens-Fisher apcroximate "t" test was useco. :'hIs test
does not reriuire eniual variances or eoua'L sam.zlesze
alth ouzh the formulation and solut ion are somewnat czntr:ver-
siaj. according to Dudewicz (1976:31'). The results of
acroximate "t tests are s,;2Trnarizei in Table 1"). 7h e se
r es3ult s i r i a t e a ,i - -_ f~ -in t d i ir e -o e ,,Alween -ne ~n s
oe r5rz: -ns oeow oer snC
a n-137 ao--traisalS lnu. cates !a di-eeee r n
li"-ene f.r YS :nth cases where
enos were fon -te o-zbiit' : erronecs-'ae::
thri te-nat e nypo*ol~3-:'; e r 7-" '<--r'~-
on -eans test-eA ran,7?d fron zero 7erc-:ent tooo;; COt0
'h- h;-:her Proc :: error_- wer- sn on n0it3ona
the? means of' t.he i.-ality anld 7.uan-iz orrnone izr>u
tions wihnsjuadrons. I't aoo:ears that the I2y-, re
size is influenced by th,. h.-sto?-ara cell it r:io.
ai Aar.-? sarmole variance.
In s,-inary, c-inservati;ve tc-sts In s- r_ atre
liffer-Pnces in the qoian- it'; an' -7uali;';i 1,3-r"zu-Lonss'1--:
th"e arl -hep s,-ralrons, nut not et- s,.unr-,r.c

Table 10
Comparison of - eans(see Appendix I)
Sig*e TypeTesa Sat.b ~ Type !I
Mean Yean Tet ttbR-,sk Risk
FN"S FYS K-S .2,(D )- .0P
Quant.(6.6 ) Qual.(7.3) 3-F 2.2(tT) 175 -0~~ 30(,G)
0 MS c I~s K-S .17(D 1 - .&P)-Quant.(6 .57) Iu a 1. 7. 2 B-? IAt7 154 §2 91
t 4!I- Non ,
ua~.c' 1a 2.5
3 -F-t 1 1 C
.(7
.-nsts; K -S, Ko1rna~orov-2':m.-rncv A;on-1-aranetri csample test; 3-F, Behrerns-Fisner AzcrDxi(.;ate
bai.u la te d t est s-t a i st+ic s; L) f~r th, -ol~r-,orov-Sm'irnov te-st, t for the -)-.rr r-:;.r-- imoa
t"test.
Cv~der.rees of freedom.
1h e MS -E means were multiclied by te. orthiese te~sts.
eSiz~nificant Ty-le I risk levels were retorted \wrePn as anificant dif erence in means was fou-nd.

necessarily mean that individuals will have siznifiant!
different quantity and quality, ratings. :he sicnc
difference does indicate that both distributions snoulj, be
used in the regression analysis. The association between
ratings and the validity of the quality of rerformance rat-
inYs N4ll be considered next.
Rating Associations
To determine the lecree of associai:n be.ecn ,:- lin
and -iuantitv ratings and btween u _:n-iTv ratinrs and .
data r027ulres some sort of as-3ciaticn :-e.sure. :cn-
carame n-ri measures wNould be -.reforred- -;.-1 .-. '5ca:3 ;
rarametric measure or linear correiaoion coe""fcient as'sues
th.a 'Ith4A istributions a r drawn from a "ivar It a te normal
distribution (Neter a, ;asserman; - a I.
sample dstributions are skewed and nrovile ... r
normal distribution, it is uiikeir that oe ba: iC
o';on for the use of the correlation coeffiient cn be met.
H-{owver, non-parametric association measures re :uire
that the data be ranked, whereas the samPle data in this
study contains too many" ties for such measures to be valia.
Since non-narametric measures cannot te used. it is
necessary to use the Pearson :.roduct-mcment correlatin coef-
ficinnt as a descrintive measure. In this regard, '-,eun4
(iQ77:2) states the followinr:
Note that the sample correlation coefficient roften used to measure the strength of a linearrelationship exhibited by samnle data ev'en if tne
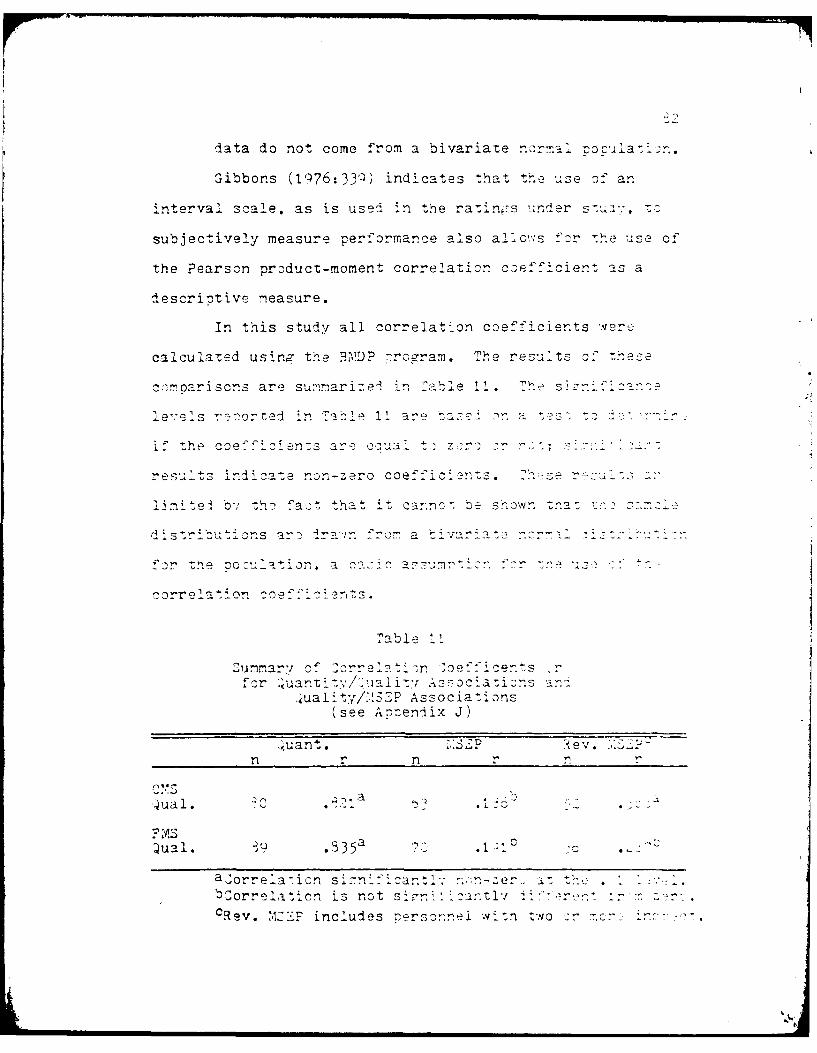
data do not come from a bivariate norrmal ouai.
Gibbons (1976:3 3 Q) indicates that the use of an
interval scale, as is used in the ra-:.njrs u-nder suv;
subjectively measure performnance also a-.7; Uo Sh ue of
the Pearson product-moment correlation coefficient as a
descriptive measure.
In this study all correlatIon coefficients were
calculated usin,- the 3L"Y'DP 7roiram. The results Of tes
c:,rmoariscns are sumnarizel in fable 1i* Th s i~- I i
levels rnnorted in -able 11 ar'e :in~ a" ~ ... .
linitel b7, "h act that it cannc' b shown tna: ;
distrcutions ar'; 1ra-in 'ron- a tivariato, ncrntl
'Por :rne po _,iin a aic um:r:r'o *o:
correla tion oe~ce~s
Table 11
Sunmaryv of 2orre.2t-n oefficer'sfor ~uni'?aiJAs:7oc,_a:ios azv''
4ualiy/M3 Associa-,,ons(see Arzendiix J)
n r n r n r
.,ual. 10 3 a:
ual . 535? a.:-
a~orrela-icn s i n~cantlvn-e'.i t',.,:b~orrel'aticn is not sir En ioantlv Ir-.....C.Rev. ~CFincludes -ersornei woon to o

83
Interp.retation of the --orrelation coefficients as
lescriztive statistics Indicates that -.uanti,.ty and quali-y
of 'Derformance ratings for individual techn~cians are rih'
correlated. There does not al--oear to be any linear corre-
lation, however, between tec.nician quality ratings and
MSEinsectins.Ifhowever, only thcse individualswn
have had two or more inso ections in the previous tw.-o -,ears
are included (revised 1 3.EP), a si _nifi':ant correla&Clon
results for O::S zersonnel. However, there :s St:_l no
:,orre~ati;_ betee ?S rati 7 and
r u3 a -r, ar s t'- a uan -. -- a 1 y
for indIvidal1 tc h-ni-c ia ns a rO e
correlation exist--s between vra-,:;=c an:_ ia .
'hese correlation st-atistIc shoul U e i-le e s
i-escr.i_vg statlstics on!.
T his secti-on concludes the anai,!7is_ cf t' e
data fro-i the_ -oerformance rat_;ngs,. .ex-., ~e~ii~
-these ratIn-s will1 be considered tased on the os,-rvations
of a few, maintenance officers.
COinion Survey Analysis
The opinions of a limited number of :.ain-.enance offi-
cers wiere oliedconcerninf- the usefulnescs o" the 7-er-
for-rance rating;S and the_ relative imoe-_r-ance of_ iuantity
-uaiity of cerformance. 'he survey -,uestions and ete
tran~rnittaliw are ce)ntained in Aczendi ,x K. Surve~v -.2e-.-'
naires were mailed to ei7h t maintenance offic~rv- tce r?

V-A090 635 AIR FORCE INST OF TECH WRIGHT-PATTERSON AFB OH F/6 5/9AIR FORCE MAINTENANCE TECHNICIAN PERFORMANCE MEASUREMENT.(UlDEC 79 J R HICKMAN
UNCLASSIFIED AFIT-CI-79-241T NL72IIIIIIIIIIIII llff...lllfffIIIIEEEEIIEIIEIIIIIEEEIIIIEI
IIIIIIIIIIIII_____________

84
knows personally; replies were received from four, as the
remaining four had moved and left no forwarding addresses.
The Deputy Commander for maintenance at Williams AF3 also
responded to the questionnaire. In all, one Major, one
Lieutenant Colonel, and three Colonels responded. The
resoonses are compiled in Appendix L and represent three
maintenance organization commanders, one squadron commander,
and one chief of maintenance quality control.
The consensus opinion of these officers is that
individual performance is important to -he organization and
is not limited to line technicians. The off~cots sr~e'.ed
felt that althcuh=.n the rating forms desef f or In s
sy m%ht be useful. theymiht not be valid if they were
used as ARs. No one, however, was able to provide a morea orooriate way to measure performance. One _i nfan-.
limitation to the aradations of quality used on -,; r-e~r.
form was noted: many maintenance tasks require on-y ccrr.l-
ance, with no gradations to the quality of work re-.uired.
All of the officers considered quality and quantity
of performance to be important, although in some cases they
felt that one cannot be considered independently of the
other. All considered quality of performance to be abso-
lutely overriding in importance compared to quantity of
performance, the only exception to this being in times of
critical emergencies, such as wartime.
This very small sample of opinions may not be repre-
sentative of management viewpoints on the subject for the
... ..... . . .. ..... . . ... 2 : -. . . c.. , . ,5,. -I, . -,.

85
entire Air Force. The author did feel. however, that some
feedback from those who might be using this information
would be useful. It was somewhat surprising to discover
that quality of performance was considered to be much more
important than quantity by all of the officers surveyed.
Summary
The results and analyses of this study have been
presented in this chanter. Considerations included study
of the samnle to determne if the entire -.-ranizaton was
well recresented and a careful analysis of the sanole datas t
stalistical oronerties. In oa--icular, the daTa was
analyzed for applicability to regression analysis. The
ratin. distributions were also tested for goodness-of-fit
to normal distributions. Quantity and 'fuaitv of perform-
ance ratins were also compared and an attempt was made
to validate the quality ratings using ,.SEP results. Finally,
maintenance officer opinions concerning quantity and quality
of performance were summarized. All of these analyses will
be discussed and interpreted in the next chapter.
.. 0

Chapter 5
DISCUSSION
The purpose of this study is to determine the
followings
1. What is the best research method for evaluating
or measuring performance of aircraft maintenance
technicians in the United States Air Force?
2. Does this method for evaluating or measuring
oerformance nrovide useful and valid statistical
data?
The discussion of the findins will therefore cover
the performance appraisal method selected and zr.e statistical
evaluation of the a.praisal method. 'his discussion may lead
to findings that revise -he existing body of enowledge
concernina subjective -erformance acpraisals or imirove
research methodologies.
The Performance Apnraisal Nethod
The recommended performance azpraisal method
(Appendices B and C) was developed through a review of the
literature on the subject. The literature review ;vas
necessary because existing rating schemes are either not
apolicable to statistical analysis, highly inflated, or
unuseable for research. Airmen Performance <azinas ' ARs;
and civil service t,7erit Ratings are used for administrative
.4

87
purDoses of promotion and demotion and seldom reflect job
performance alone. These ratings also tend to be inflated.
Callander (1979t4) reports that airmen have average APR
scores of 8.5 on a 9.0 scale, an inflated rating that is not
useable for research. Proficiency ratings are either paper
and pencil theory tests (Skill Knowledge Tests) or ISEP
evaluations. For instance, only approximately 77. of the
technicians at the test base, Williams AFB, had received
MISEP appraisals due to the high turnover rate of personnel.
Furthermore, SKT evaluations are not applicable to civil
service maintenance technicians, who make up 17 of the line
tecrn:2 at ;Iillia-s AFB. Since existin- perfor-mance
data was not aoulicable, a new ra;Ing scheme was developed
based on a review of the literature and the restrictions
imposed bv the maintenance organization.
The size of the Air ?orce maintenance organization
required a measurement scheme applicable to civilian and
military technicians of all races and sexes performlng rnany
tasks rangina from servicing aircraft to repairing missile
guidance systems. It was thus apparent that the organiza-
tion size and structure restricted useable performance
measures to general criteria, such as quantity and quality
of performance based on subjective appraisals by supervisors.
The measurement of quantity and auality of performance
presented a difficult problem.

88
Of the appraisal methods reviewed, the only anplicable
methods appeared to be straight ranking and the use of rat-
ing scales. 3oth methods are based on subjective appraisals
by immediate supervisors. Barrett (1966:71) reported that
the use of graphic scales following a forced ranking proce-
dure increases the accuracy of the ratings. This method was
adapted for this study and should have, in theory, provided
rating scale performance values which were normally distrib-
uted.
The actual rating scale fcrmat was designed to
minimize errors of leniency (see Appendices 3 and C"). These
recommended rati--- forms were assroprlate based on a revive
of the literature concerning a7:raisals and on the nature of
the Air Force maintenance organization. The suggested ratinz
forms have face vali. itv if crevious research - onclusins
are accezted.
The following sections discuss the szatistica-.
oualities that resulted from an actual test of tne rating
forms within one Air Force aircraft maint.enance organization.
In addition, the opinions on the usefulness of the rating
forms which were collected from several maintenance officers
will be discussed.
Evaluation of the Ratina ",ethod
The evaluation of the rating method was conlucted at
dillians AF3, Arizona. This is a relatively small cilot train-
ina base utilizing jet aircraft which are mechanically simile

89
compared to other aircraft in the Air Force inventory--the
T-37 and T-38 jet trainers. Thus, the conclusions of this
study may be limited by the restriction of the test to one
training base. One prerequisite of the rating form tested
was its applicability to both military and civilian mainte-
nance technicians. Both types of technicians were included
in the sample drawn from the maintenance organization.
Test Sampling Procedures
The random sampling procedure resulted in rerresen-
ative oroportions of civilian and military Technicians. Rat-chnicians Droved to be of no diffi-ulzt; to any t
of the supervisors. It is significant to noe :that a major-
ity of technicians within the FMS squadron were civilians or
had attained the rank of sergeant or better. The IC'. siuad-
ron, converselyz, was primarily military with the majority
being airmen. It can generally be concluded that the civil-
ians and the Air Force personnel with serreant rank and
above have mucn more work experience than the airmen.
The sampling procedure also provided a representative
proportion of technicians from each of the OC.'S branches. The
FVS branches were not,however, proportionately represented
by the sample. This uneven distribution was rimarilv due to
the large number of independent sections or sho2s in F...
havina very few peoole; the swing and mid shifts in the more
heavily populated shops were excluded as fewer than three
technicians worked for a supervisor at any one time.
- I

90
In general, the sampling procedure was extremely
successful in providina a representative segment of the f.organization. By randomly selecting supervisory groups ,
rather than individual technicians, the ratina process was
expedited. And by randomly selecting individuals from the
supervisory groups, the researchers controlled who would be
rated and avoided any bias had the supervisors selected the
technicians themselves.
Rating Distributions
The skewed nature of the iuanti;', and ,ua-lit. &.c-
--a-m distributions (.Fi:ures 1. and t:) was not
The rating forms were designed t.-. oro-uce symmetric, nornal
listributions that reflect the relative Der-rniance of
technicians. There are two zossible e:cDlanations for the 1:consistently h, skewed cuality ratings: ( 1 the sucer-
visors as a whole may be extremely lenient or (2) tnh super-
visors may be interested in consistent compliance and nc
more. There is no way to differentiate between these two
exolanations. It is nossible, however., that many ,aninte-
nance tasks are designed to be simple so that the technician,
accordina to one survey response (Appendix K), "either can
do the job, or he can't with no aradations in iuality." :f
supervisors rate technicians in this light, then :he ualit'y
histograms would be expected to disolay the skewed nature
observed in the test data. It would oe interestin- to
analyze technic.ian tasks to discover if -ualitv zra!a-.n

91
exist or if tasks are considered to be done or not done
without quality gradations. At any rate, these quality of
performance distributions were considered useful for lack of
any other better performance measures.
The MSEP inspection distributions are more severly
skewed than the research sample quality ratings (Figures 16 i
and 17) and omit some 20% of the line technicians. Sauer,
Campbell, and Potter (1977) observed the same difficulty with
MSEP data and also determined that the data was not applica-
ble as a measure of performance in constructing mathematicai
models.
The quantity of performance ratirngs exhibited
istrib-utions which were less s .ewed than the ,uality razings.
and the ..antit, distributions were significantly different.
The difference in the distributions was established using
the Kolmozorov-Smirnov test (Apzendix I). Despite the
differences between quantity and quality, the quantity rat-
inas were still not symmetric and still had mean values
areater than the scale mid-point. The difference in the
ratinus is worthy of note, but the skewed distributions
could also be the result of a halo effect from the quality
ratings or, again, rater leniency. There is no way to
differentiate between these influences. .n fact, there is
no existing data with which to compare quantity ratings.
This information may give an added dimension to technician
performance that is not currently considered but may be
important in contingency situations.
.. . . . . .-- ..... .. . :. ... . ,a: _. . .. . .J f., . . . , S M.V_' le , ,.' ,

92
Rating Distributions and Normality
The skewed nature of all the sample distributions
makes it unlikely that they represent normal populations
(Table 7). This does not create a serious problem for
regression analysis but does restrict the types of tests
that can be used for comparing distributions.
The skewed distributions should be used with caution
in any reression analysis. It is possible that the error
terms of the regression model may not have constant variance
(heteroscedasticity) as a result of skewsness. ziccording t2
Neter and *,asserman (l:74:123), this condition can oest be
investizated after a prelininary regression model is devel-
oped and, if necessary, a transformation of the erformance
data can be made to correct the problem. :t is often the
case that such a transformation also helps to normali - , the
data.
The skewed distributions do cresent problems with
tests that compare distribution means or variances. In
particular, the equality of variances is questionable in
this situation. This means that non-parametric tests or
tests which do not require equal variances should be used to
compare distributions.
Quantity and 4'alitv
The skewed distributions made it difticult to
determine if any difference existed between quantity and

I.
93quality ratings. The histogram distributions were based on
larger cell intervals than initially intended due to the
grouping of ratings around scale numbers. This, in turn,
produced large sample variances (s2=4.0) and many ratinzs in
separate distributions with the same values. As a result,
parametric tests for comparing means had reduced power,
while most non-parametric tests for comparing means were nct
useable due to the tied rating values.
To overcome these difficulties, conservative tests
were used. The Kolmoaorov-Smirnov non-parametric test
showaed that the quality and quantity rating distributions
were dilferent for both squadrons. The Behrens-Fisher
apzroxi7.te "t" test indicated that the means of the quantity
and quality distributions for ONIS and F:S differed. The
quantity and quality distribution means for FMS were acce:ted
as different with a Type I risk of ItO and a Type Ii risk of
13%. The quantity and qualit; distribution means for OMS
were accented as different with a Type I risk of 5: and a
Type Ii risk of J.7i. These differences indicate that
quantity and quality ratings should be considered separately
in evaluating technician performance. The differences do
not indicate that technicians' ratings on one factor will not
be reflected in the other factor.
The difficulties encountered in evaluatina the rat-
ings might be overcome by revising the scale format to
eliminate the bunching of ratinas around scale numbers and
by thus attemztina to force normal distributions. For now,

94
however, the data is useful in regression analysis with
certain restrictions and the results do differentiate between
quantity and quality ratings. Whether or not the ratings are
valid when compared with existing data will be discussed in
the next section.
Validity and Association
If the theoretical basis of the tests is sound and if
the maintenance officers surveyed are to be believed, the
performance ratings do have face validity. It is difficult,
however, to find any agreement between the qual_..t: ratings
and existing '.SEP data.
No comparative data exists for the quantity ratings.
-t is interesting to note that suoervisors tended to associate
high quantity and high quality ratings for technicians. Thls
could be due to a halo effect or could simply be based on
the ooinion that quantity and quality Df perfor-ance are
related.
Attempting to validate the qua~iy ratings using ;ZE?
data was not very successful. The limitations of the :K[E?
data were particularly difficult to deal with. ..ore than 20")
of the technicians received no ins-ections due to the rapid
turnover of personnel and in soite of a local policy of
administerina an inspection every eighteen months. The
resulting YSEP data, even after an attenpt was made to
interpret the raw data in relation to performance baselines,
proved to be even more skewed ani unuseable than the rating :

95distributions. It should be noted that the ;.:p data covers
two years and is utilized to determine section or branch
trends and not to reflect individual cerformance. iSF
inszections also emzhasize compliance and safety and notgradations of quality performance. The .,,P data was still
used--in spite of these limitations--in an attern-t-to vali-
date quality ratings, as it w-s the only exisiina record
available. The correlation analysi-s revealed no signifioant.
relation between YSEP and the quality ratings.
When only technicians vith two or more .:S inscec-
tions were included -n the correlation analysis, a lo' z"-
sinificant non-zero (.36.; correlation was noce: :or ,while no correlation at all existed for eS. ehe revse,
OT,:S ,S7? data in fact exhibited a normal distrzui n a-.Z
mean value somewhat lower than the 0:,:3 uaqua v ra-..
if such data existed for all 0'C.,. .S personnel, 1c -.i .h
superior measure of nerformance to -he ratinEs. or 003
F)!S MSEP data, it may have remained highly skeweil ie t.o
the difficulty of inspecting hi~ghly technical tasks, the
relatively fewer average inspections, or the overall hii):
experience level within the squadron. At any rate, the FC,'S
quality ratings are superior to I.'EP data for statistical
research.
In summary, the quality and quantity ratings could
not be conclusively validated using ,SEP results. it des
aDrear, however, that vothout mrere freouent YS-- -seozior.s
of all personnel, the .:erformance rating distributions

96
provide more useable and representative data for use in
statistical research. The performance ratings at least
provide face validity.
Maintenance Officer ODinions
The limited number of maintenance officer otinions
solicited concerning the quantity and quality of performance
ratings croduced some interesting results. Although quantity
and quality were considered to be important considerations,
they were not considered to be indenendent of one another.
The ma.crity of officers also felt that cuality was the nore
im-ortant factor corinared to quantity in all but the most
dangerous national emergencies. This is surDrising since
the author has personally witnessed many officers pressuring
technicians to do repairs rapidly. For zhis reason it is
f=t that both ratings should e of significant value to
maintenance managers even if the emphasis continues to remain
on quality performance.
Summary
The purposes of this study were to provide a method
for evaluating or measuring the performance of Air Force
maintenance technicians and to provide useful and valid
performance data for statistical analysis. 3ased on a
review of the literature, the performance evaluation method
developed for this study provided a measure which (1) was
understood by managers and supervisors, (2) was applicable

/ ,
to both military and civilian technicians, (3) was al7--ca .1
to different types of performance tasks. and- (4- crovilet
performance measure throurh many levels of wea7on3s':3t.
maintenance. The statistical properties f zhe ra-'ir-
method, however, were discovered to be less tfr _. .:r'..... e>"
ideal.
The test samole revealed -articular stazist' c-a-
ro erties 1ihiLch were not exoected as d on t- I li-t.rt
review; particularly surnrlslnp. -,,iere t se -''
iualitv of rerformance distritut.. ..s. Th,
butions made the da-a a,!r-
bnut 'ith resrv-:: tl-,)I, con- = in-
also made 3ommcaratva~ te-,!ts Iof t e histogram dis-ributicn made :ne use -
oara.metric tests imzossible an! re iced trne -:;wer :"
parametrt? tests even wi-,h lar-e samole :ize:, .2 n
these consideraticns, however, -z can be said 7a; The ,-
from the recommended -erformarnce rat ... I..n.l s ,:.
for regression analysis and does di--ferentia e b....
quality and quantity of -erformance.
These particular conclusions reardin- the test
statistics cannot be comnared to -he results of tests
other rating forms since such -esults o no- a= --ear -c
widely reoorted. It was certainly surnr cin.7 to
that a method based upon previous theory and research ill
not produce the symmetrical distributions other authsrs
reoorted; it should be mentioned that most reuorts lld not

98
include data on tests for symmetry or equality of variances
or means let alone the sample rating distributions.
Attempts to validate the quality of performance data
were marginally successful for one squadron. The existing
MSEP data used for the comparisons was even more skewed than
the performance rating distributions and omitted some 2C0 of
the sample. More work needs to be done to determine if the
XSEP and the rating distributions were skewed as a result of
an emnhasis on technician task compliance or simply on rater
and inspector leniency. At any rate, the data does not
sunzort the use of forced normal distributions for techni-
cian rankings :rn quantity and quaiity of performance.
It is evident that although the .7resent method has
limitations it is superior to existing information on
indiviiual technician performance. The ;otential exists
for carefully monitoring the quality of maintenance techni-
cian -erformance using YSZP data, if Air Force marna:ement
feels it useful. This information does not exist now,
however, while no information is even availaole concernin.-
the quantity of performance. Thus, for lack of any superior
system, the subjective ratings of technician quantity and
quality of rerformance are useful and acceptable as sources
of performance statistics.
:d . "_... .... . .J " - . . .. .... .. . ... - .... . . .

Chapter 6
CONCLUSION
One of the greatest needs of managers of the military
wea-ons system maintenance complex is to measure accurately
how well individuals perform on the job. Individual job
performance is one of the bases for performance by the entire
organization. If the effectiveness of weapons system main-
tenance is to be improved, then individual performance must
be measurable and subject to improvement.
,uantifyinz job effectiveness is, however, di ' icul-.
Decades of research bY psychologists and personnel experts
have failed to provide definitive answers to the question of
ho-w to measure performance or effectiveness. The main
curDose of this study was to find or develop some method for
evaluating and measurina the zerformance of aircraft nain-
tenance technicians in the United States Air Force. This
evaluation method, once developed, is to be used as a
performance measure of manpower effectiveness in another
research effort. The purpose of this subsequent research
effort wil be to develop a model or models for predicting
or evaluating the effectiveness of maintenance technician
performance (see Young, 1 178:i51.
The recommended performance appraisal method
(Ap-endices 3 and C) was developed throurh a review of the
literature on the subject. The literature review was

100
necessary as existing appraisal methods such as APRs, MSEP,
or S.,KTs either were not aoplicable to statistical analysis.
were highly inflated, or provided incomplete and non-current
coverage of the organization. The method which was developed
relied on subjective supervisor aForaisals of a technician's
quantity and quality of performance. This suggested method
has face validity, if previous research conclusions are to
be accepted.
The evaluation of the performance acpraisal method
was conducted within the aircraft maintenance organizat-.n of
one nilot traininz Air Force 3ase. Williams AFB, Arizona.
The evaluation at one base limits the generality cf the test
conclusions. A sample selection method was develozed that
actually paired supervisors and their subordinate technicians
and provided a representative portion of the maintenance
organization. A sample size of 2C- of the organization
provided adeouate statistical test errors, with the exception
that the rating scale and resulting ratinz distribution
increased the test error. A change in the rating scale
eliminating numbered gradations in quality and quantity might
eliminate this problem.
The test evaluation of the performance apcraisal
method also resulted in skewed quantity and quality ratings,
results which -,ere not expected based on the literature
review. it is difficult to determine from this present
study if these skewed ratings represented an emphasis on
technician task compliance or simply on rater leniencey.
.. . . '

101
The ratings were certainly more complete and less skewed
than existing Maintenance Standardization and Evaluation
(vSEP) personnel inspections. The skewed ratings do intro-
duce some restrictions in the development of a regression
model to predict or evaluate the effectiveness of mainte-
nance technician performance; special care should be taken
to identify and correct for heteroscedasticity. uality and
quantity ratinas were differentiable and should both be used
to represent performance, althouFn the maintenance officers
surveyed indicated That quality of performance is more
essential to mission accom lishment than zuantity of
pe' for".ance.
Attempts to validate the quality of performane were
marginally successful f-r the Operational ,:aintenance
Squadron 0203) involved in the test. The attem )sto validate
quality razinrs for the Field Maintenance Squadron (F2:Z)
were unsuccessful. Y.SEP personnel ins-ection data was used
for these compariscns and proved to be highly inflated and
non-representative of the organization. No data existed with
which to compare the quantity of performance ratings.
Despite these difficulties, the performance rating
method provides useful data with face validity which can
be obtained for a representative segment of an Air Force
maintenance organization. I is evident that the rating
data must be used with care in attempting to develop a
model of organizational effectiveness.

102
Contributions andFuture Considerations
This study makes several contributions to the field
of performance appraisal within Air Force organizations. The
recommended performance rating methcd is new and provides
useful information. In testing the performance rating
method, a sample selection technique was developed that
provided input from supervisors and their immediate suoor-
dinates and provided a representative segment of the mainte-
nance organization. Many previous studies failed ;o ensure
.hat sucervisors were actually evaluating their subordinates.
Most si-nificantly, an analysis of the tes- results ,rcvided
information on the statistical effects of sawed distribu-
tions, of ratina scales based on numbered gradations of
performance, and on the use of histograms in situations
where non-oarametric statistical tests are recuired. These
contributions ;ere offset, however, by areas which were
found to require further evaluation.
A superior rating scale might be suazested from the
results of this study. Such a scale would have only end-
and mid-point descriptions (e.g., "slowest," "where most
perform," and "fastest"), no numbered gradations, and cne
scale mark at the mid-point. Values for such a scale would
be recorded by the researcherwho would be using a separate
numbered scale. Such a scale should provide symmetrical
performance distributions with small variance about tne
means and correspondingly low Type II errors in comparative
..... .... , .... .: .... .. . - . . . .:., : , . 4

10c3
statistical tests. Such a scale, however, wouli have .ow
face validity and might not be acceptable tc superviscrs or
maintenance managers.
Whatever rating method is used, it should cer ain.,' ze
tested at more locations than the one base used in tnhs .
It might also be wise to include second-level supervisors'
ratings as a cimparative and controlling influence on tne
ratinrs of technician performance by -,-ediate u
It is unforturnate that exisZtir~z oerf orman:._ a.-a
information cannot be used to eva " ua tenni21in :'.:.-.n]:
for this research effort. 7xistino data ,vcud
to the pronosed oerformance ra:ings in -%r-.2 fv
aczeptaoility. H.owever, Airmen ?erforrane L. .
an,! Skill Knowlei7e Tests 1S:.s) are rc . .
1Z" ? data, on the other cdou- 11 b- -,ute "
7orce requirements (.: .- t) were nore s::eoif" r- i--.
rezular inspeciicns _for individuals or prov4ied ,
randomly selectin. inspections samoles. As L s .7
YSEP is supposed to provide trend anaiyZis ja :r-
nance sections or branches, but tnis data is bas-e on n. .
id sampling crocedures. The SP d-data was S us1iCiousi"
skewed with many perfect appraisals and, as a e u:- w*-
nct strongly related to current su:ervi3or r-tin 1...
data could, however, nroviie m-ore uu.iF l inf o. ...a: .-i " .r
Force nersonnel insnecticn criteria were revised.
-j . ts

104
Final Comment
It is evident from this study that although the
recommended sub-lective performance aopraisal method has
limitations, it is superior to existing information on
individual technician rerformance. The appraisal method has
face validity for the evaluation of aircraft maintenance
technicians in the United States Air Force. It also provides
useful statistical data. Existing information on tne qzuality
of terhnic'an performance is potentially useful, but ".
f2 s si -t of ceinR rerese -ta ve and i-cl.usive, Li'.le
... .n ts : ec ernLn the .a.n ity of t e C :an
r -,ance. T.u3, for lac' of any superior s:s~e . tne
Tub' .ective r-tins of technician quantit',, and qu al it' of
r-?or-ce level-rel irn this study are useful and accectab>
sources rerformanci stati-:.;cs.

REFERENCES
Barrett, Richard S. Performance Rating. Chicago: ScienceResearch Associates, 1966.
Bayroff, A.G., H.R. HagFerty, and E.A. Rundquist. "Validityof Ratings as Related to Rating Techniques and Ccndi-tions." Personnel Psychology. 1054,7, 93-112.
Bendig, A.W. "Reliability and the Number of Rating ScaleCategories." Journal of A!lied Psychology, 1954,
.3 -38-40.
3erk, Kenneth N., and ivor S. Francis. A Review of t ,-eManuals for B.,!DP and P." Journal of the AmericanStatistical Association, 1278, L1, 65-71.
Beyer , illiam Hi ed. CRC Standard Y.athematical Tables.,est Palm Beach, Fla.: CHC Press, iA73.
Bittner, R. "Developing an In-iustrial Yer: Rating 2roce-~re P Pers onn e I ?s ,,cl.' 1>, 1 , ~%<2.
Bradlev, James V. Distribution-Free Statistical Tests.-!nlewcod Cii-f 's, N.J.: Prentice-Hall, Tn3., JJo:.
Brozden, H.£., and E.K. Taylor. "The The.ry and Classifi-cation of Criterion 3ias." Educational ind Psycholozica 1:,'easuremeni, 1950, 10, 159-186.
Callanier, Bruce. "Hikes: 1 out of 3 'takes r-." ir Fr.Times, July 2, 1o7-, p.4.
Campbell, J.P., and others. .anag9erial Behavior, Performanceand Effectiveness. New York: McGraw-Hill, 1970.
Campbell, J.T., E.P. Prien, and L.G. Brailey. "PredictingPerformance Evaluations." Personnel Psychology, 19bO,1.435-440.Cu-nm.; a, L T -nio.
Cummings, L.L., and D.P. Schwab. Performance in 0ri~niza-tions. Glenview, Ill.: Scott, Foresman, inc., .
Davies, Owen L. The Design and Analysis of inustrialExneriments. London: Oliver and 3oyd, 195o.
Dixon, ".J., ed. B3,VDP 3iomedical Computer Program. LosAnaeles: University of California Press, 1977.

1o6
Dudewicz, Edward J. Introduction to Statistics and Probabil-ity. New York: Holt, Rinehart, and dinston, 1976.
Dunnette, M.D. "A Note on the Criterion." Journal ofApplied Psychology, 1963, 4i, 251-254.
Flanagan, J.C. "The Critical Incident Technique." Psycho-logical Bulletin, 1954, 51, 327-358.
Foley, John P. Evaluating raintenance Performance: AnAnalysis. AFHRL-TR-75-57(), AD-053-475. Wrigflt-Patterson AFB, OH: Advanced Systems Division, Air ForceHuman Resources Laboratory, December 1974.
Freund, John E., and Irwin fViller. Probability and Statisticsfor Engineers. Englewood Cliffs, N.J.: rentioe-iali,Inc., 1977. K
Gibbons, Jean D., Non-3araretric ?,ethods or uantitativeAnazlvsis..... ? Yr - H l ,R nhart, and :iinstcn, ,7
Glaser, R., and A..Nitko. "Yeasurement i. e--n -rninZ .n-instruction." !n A.L. Thorndike (L i.). EucT ional
.....easure"ent. ,as~hi on: A nerican Ccuncil sn .ucaticn,197l, o25-670.
Guilford, Joy 3. Psvchornetric Methods. ,e.: Ycr.<: .,.'xra'-Hill, 195-1.
Guion, Robert 2f. Personnel '2esting. :iew Y'ork:.cGra1 -Hill, 1065.
Habbe, S. "Mar~s of a Good ,dorker." ''ana Tepe . iecprd,1956, 18, 168-170.
Hollander, ""yles, and Douglas A. .olfe. Ncnoarane triStatistical Methods. New York: John ,ile:; and Sors,19711.
Hollingworth, H.!. Judain7 Human Character. New Yors:Appleton, 1922,
Holly, W.H., H.S. Feild, and N.J. Barnett. "Analyzin Per-formance Aorzisal Svstems: An Empirical 2tudy."Personnel journal, 1C)76, . 457-a5O.
Jones, L.V., and T.L. Phurstone. "The Psychophysics ofSemantics: An ZxDerimental Investigation." Journal ofADDlied Psvchology, 1955. 30, 31-36.
Latin, Lawrence L. Statistics for Modern Business Decisions.New York: Harcourt, Brace, Jovanovich, Inc., ')73.
I
- -I .______E'). ...

107
Lawler, E.E., III. "The Vultitrait-",Multirater Approach ToMeasuring Managerial Job Performance." Journal ofApplied Psychology, 1967, 51, 369-381.
Lewin, Arie Y., and A. Zwany. "A Yodel Literature Critiqueand a Paradim for Research." Personnel PsycnoloWir,1976, 2P, 423-447.
Locker, Alan H., and K.S. Teel. "Performance Ap-r~isal--ASurvey of Current Practices." Personnel Journal, 1977,56, 24c-247.
Lopez, Felix M. Evaluating Employee Performance. Chicag o:Public Personnel As-ociazion, 196d.
McDonnell, James A. "Distaff Mechanics Doinz OK." AirF-rce Magazine, 1097, 62, 73-7Q.
.. cGre.or, Dou2as, n neasvT oor at Prforma-ne Appraial."Harvard Business Review, 57, , 2 ....
Yeis - r, D. , D.- -in .ey, and .i... Thomr2sn. Relai:s.iBet.V-een Svsten Desi ; n, Techniclan 'rainin, an,!tenance job .-erf* )rance on Two Autonilot 2uoss.AFH TR-7 -2. 3unker-Rano Corooation, ,ri-hz-Patterson AFB, OH: Advanced -' .,stems Division, Air iorceHuman Resources Labora-,ry, 1)71.
:Yillarl, -Iheed 19 ,4., F. 1-ut .h ..s, ar .L . 'I't-.man- -...." , e3reakthrough for ?erfcrmance .- aisa!." 3usinessHorizons, 1076, 1, 66-73.
Yiner, J. "Yanagement by Apr-aisa!: A S:1i;sule Review andCurrent References." usiness Horizons, 1, 1,33-9L-.
.uller, Yervin E. "A Review of the Manuals for 3:DP andSPSS." Journal of the Ameridan Statistical Association,
Neter, John, William '.asserman, and G.A. dhitmore. Funda-mental Statistics. Boston: Allyn and Bacon, Inc., 1973.
Neter, John, and William Vasserman. Arnlied Linear Statis-tical Mrlels. Homewood, 11.: Richard D. Irwin, Inc.,1 7U.
bradovic, J. "Mlodification of the Forced Choice o.ethod as
a Criterion of Job Proficiency." Journal of AszliedL5ycholcy, t70, 54, 22 -2 ..

Ronan, W..., C.L. Anderson, and T.L. Talbert. "A Psycho-metric ADroach to Job Performance: Fire Fighters."Public Personnel ;,Manazement, 1076, ., 409-422.
Rush, C.H. "A Factorial Study of Sales Criteria." PersonnelPsychology, 1953, 6, 14q-157.
Sauer, D.W., W.3. Campbell, and N.R. Potter. Human ResourceFactors and Performance Relationshios in Nuclear YissileHandling Tasks. AFHRL-TR-76-85, AFVIL-TR-7o-33. .right-Patterson AF3,OH: Advanced Systems Division, "ir ForceHuman Resources Laboratory, 1977.
Snedecor, George 4., and William G. Cochran. StatisticalMethods. Ames, Iowa: The Iowa State Colle-e Press,19'?56.
Stevens, S ". and E.F. J.cnderi!. "An Sffective " evisicof the Ratin7 Techni':ue." Personnel Journal, 1 - - '>, ,125-1 }a.
S'ezev, a.n, n '3.3. Pearlstein. l i terReferenced Tests." SA Catal of S3lictev .o:,;r.=PsvjcholoF;0-, m0. 7 1, 227.
'2ailor, EK., R.S. Barrett, J.-1. Parser, and L. .. '.artens."Ratinz Scale Content: T7. - -' of Ratinz on In2ivid-ual Scales." Personnel -'Povc hc, gy , 11, 51 "1
Taylor. E.r., and Grace E. ',,anson. "Sutervised Ra ,in 7s;Yaking Granhic Scales lork." Personnel, 15, 2"
Thorton, G. "The Relationship 3etween Suzerviscrv anc Self-Apraisal of Executive Perfcrmance." Personnel .s.chol-2z__. L, 1.963, 21., 441:-455.
Tavers, R . "A Critical Review of the Valiit' andRationale of the Forced Choice Techninue." Fsv chooi aBulletin, 1'q5l, 43, 62-)-0.
Uhrbrock, R.S. "2000 Scaled Items." Personnel Psycholoo, ,1961, 1__, 375-420.
U.S. Air Force. Air Force .71anual AF" 4-1, Vyaintena-ceManaement. 10 vols. a' ir.:on: ..overnmert rlntinzOf ice, 1''7 and ln"7.
Vanzelst, R., and W. Kerr. "Worker Attitude a.ward 01eritRating." Personnel Psvcholoag, 193, _, 15'-172.

109
Whitla, Dean K., and John E. Tirrell. "The Validity ofRatings of Several Levels of Supervisors." PersonnelPsychology, 1953, 6, 461-466.
liks.rom, W.S. Yanagina by and with Objectives. NationalIndustrial Conference Board, Personal Study No. 212,1068.
Iiley, L.N. Task Level Performance Criteria Development.AFHRL-TR-77-75, AD-355-694. Brooks AFB, TX: 2ccupation-al and Mlanpower Research Division, Air Force HumanResources Laboritory, December 1978.
Young, H.H. Performance Effectiveness in the Air Force1 intenance System: Preliminary Report and Des "gn
Rn.t. driaht- PatTerson AFB, Oh: Advanced SysemsDivision, Air Force Human Resources Laboratory, 1?7.(Internal Report)
I.

APPENDIX A
MAINTENANCE TECHNICIAN SURVEYPRIVACY STATEMENT
The attached survey is part of a research effortbeing conducted by Arizona State University under contractwith the Air Force Office of Scientific Research, and withthe cooperation of the Air Force Human Resources Labora-tory, Advanced Systems Division, WPAFB, Ohio. The purposeof the survey is to further identify factors which influenceperformance effectiveness in maintaining Air Force aircraftand missile systems.
Your participation in the Survey is voluntary butstrongly desired. Your responses will be held confidentialand in no way will impact upon your career nor upon thesquadron to which you are assigned. Headquarters U3AFSurvey Control Number 80-I has been assigned to thissurvey.
A. Authority:(1) 5 U.S.C. 301, Departmental Regulations; and(2) 10 U.S.C. 8012, Secretary o tne Air eorc,
Powers, Outies, Delegation o Cornensation;(3) DOD Instruction 1100.13, 17 Apr 08, Survey,
of Department of Defense Personnel; and/or(4) AFR 30-23, 23 Sep 76, Air Force Personnel
Survey Program.
B. Principal Purposes: To collect information fromAir Force and civilian squadron maintenancepersonnel concerning their perceptions of factorswhich influence their performance effectiveness.To initiate the development of an Air ForceMaintenance Performance Effectiveness Model basedon the survey results and other inputs.
C. Routine Uses: Data will be used for researchpurposes in initiating a predictive model ofmaintenance performance effectiveness.
D. Participation is voluntary. However, yourcooperation is requested.
E. No adverse action of any kind may be taken againstany individual who elects not to participate inany or all of this survey.

r- -P 0 $4+1 C111.04 c10 c )0 "
S-r4 r4 .04 010 >> 40-~~4 O 0 ~4. CA a 0 40 0
o 0 C 039> .-4 C0.0 r- * . V
-1. X 0 c.0 Co-
ffU 000 0 c 00>40L 0 AwO0 >cUM r1-N..0*-C A0 o t.-. :
ed4 r..-4 (D :3 J. odzC>= Cd 0+ 0 a CU (D'
0 0 0
C 0 00 0- Y>)I
4-2 QM ) C Ot44 0P4 >00 * w'0L
C = " >) k ) 4.>4 cUd Av v'. S02 0 e
D) 0 1 0 4J 0
z 14 0 a 04~0 A, 3
9 .+2 4 C.0 0 3: > 4 4
*4 4 Fn9 4
>4 k .w0 4 .O +31zC0 0 .O~.4 +3, I co4 N0)RUOCc3C m DO

113
APPENDIX D
DATA0MsTech. Quant. Qual. MSEP Raw MSEP1 8.0 6.0 .667 1/3.1/32 8.0 9.0 .888 0/2.0/3.1/33 8.0 10.0 .611 0/3.1/3,1/3,1/3.3/3,1/34 7.0 8.05 8.0 6.0 .563 2/2.7/12.0/3.2/12
6 1.0 2.07 5.0- 8.0 .333 12/12,1/38 6.0 7.0 .333 2/3.2/39 5.0 8.0 .833 0/3,1/310 7.0 9.0 .667 0/3,2/3
11 9.0 9.0 .667 0/3.2/312 8.0 8.0 .883 0/3.0/3.1/313 8.0 8.0 .528 5/5.5/12,0/3
14 6.0 8.0 .611 0/3.0/3.0/3.2/3,2/315 6.0 6.0 .417 1/3.0/3,3/3,3/316 9.0 9.0 .500 6/6.0/317 2.0 4.0 .536 0/3,7/12.0/3.0/3,2/3,
3/3.3/318 8.0 8.0 .000 3/3
19 6.0 6.0 .777 1/3.1/3.0/320 8.0 8.0 .444 0/3.2/3.9/921 7.0 7.0 .381 0/3.1/3,0/3,0/3.3/3.
9/9.1/322 2.0 3.0 .b67 1/3.1/323 4.0 4.0
24 9.0 9.0 .733 0/3,1/3,2/3,1/325 8.0 9.026 7.0 7.0 .263 6/11.2/3,3/327 9.0 9.0 .625 3/4,0/3
28 9.0 9.0 .750 2/3,o/3,0/3.3/929 7.0 5.0 .472 0/3.3/3.1/3,7/930 8.0 9.0 .333 0/3,0/3,1/3,2/331 9.0 9.0 .778 0/3.1/3,1/332 5.0 3.0 .000 1/1,3/3
33 7.0 8.034 7.0 7.0 .200 3/5.2/235 6.0 6.0 1.00 0/336 5.0 8.0 1.00 0/337 5.0 7.0 1.00 0/3
38 6.0 6.0
; .. t ;- 1 : ;" " "

114
APPENDIX D (CONT.)
DATAOMSTech. Quant. Qual. MSEP Raw MSEP39 4.0 3.040 7.0 9.0 .722 5/9,0/341 3.0 2.042 10.0 7.0 1.00 0/3.0/3.0/3
43 9.0 8.0 1.00 0/344 8.0 9.0 .667 0/3.0/3.3/3.1/345 7.0 8.046 9.0 9.0 1.00 0/3.0/3
47 2.0 3.0 .689 3/5,0/31/348 8.0 7.0 .555 3/3,0/3,3/949 5.0 5.0
50 1.0 4.0 1.00 0/351 6.0 7.0 1.00 0/352 5.0 6.0
53 10.0 10.0 .861 0/1.0/1,5/1254 9.0 10.0 1.00 0/3,0/355 7.0 q.056 8.0 9.0
57 8.0 9.058 7.0 8.05) q.0 9.0 .833 0/3,1/360 7.0 8.0 .667 1/3,1/3
61 7.0 8.0 .773 5/11,0/362 5.0 7.0 .733 0/3.2/2,0/3,0/3,3/963 7.0 8.0 1.00 0/364 1.0 3.0 .500 1/1.0/365 3.0 6.0 .818 0/3,6/11,0/3
66 7.0 8.0 .583 0/3.12/12,0/3.2/367 6.0 6.0 .667 1/3,1/368 7.0 9.0 .333 2/3.2/369 7.0 7.0 1.00 0/370 8.0 9.0
71 6.0 7.0 1.00 0/3.0/372 8.0 8.0 1.00 0/3,0/3,0/3,0/373 6.0 8.0 1.00 0/3,0/374 7.0 9.0 1.00 0/2,0/3,0/3,0/3,0/375 8.0 8.0 .542 7/12,1/3
76 4.0 6.077 8.0 8.0 .'?78 1/3,0/3,1/3

115
APPENDIX D (CONT.)
DATAOMSTech, Quant. Qual. MSEP Raw MSEP78 8.0 9.0 1.00 0/3,0/3.0/379 5.0 6.0 1.00 0/380 6.0 6.0 1.00 0/3
FMS1 9.0 9.0 .833 0/3.1/32 9.0 9.0 1.00 0/3.0/33 6.0 9.0 .778 0/3.0/3.2/34 8.0 9.0 1.00 0/35 8.0 9.0 1.00 0/3,0/3
6 1.0 2.0 .833 1/3,0/37 10.0 10.0 1.00 0/38 9.0 9.0 1.00 0/30 1.0 1.0
10 6.0 5.0 1.00 0/3,0/3,0/3
11 8.0 10.0 .833 0/3,1/312 3.0 3.0 .166 2/3.3/313 6.0 9.0 1.00 0/214 5.0 7.015 2.0 4.0
16 3.0 3.017 5.0 7.0 .500 1/2.1/218 5.0 6.019 5.0 8.0 1.00 0/320 6.0 8.0 .267 3/3,2/3,3/3,1/3.2/3
21 8.0 9.022 7.0 8.0 1.00 0/3,0/323 7.0 8.0 1.00 0/324 7.0 8.0 .667 0/390/3,3/3
25 8.0 9.0 1.00 0/3,0/326 8.0 8.0 .888 0130/3,1/3 27 6.0 6.028 6.0 7.029 1.0 1.0
30 8.0 8.0 1.00 0/331 2.0 2.032 6.0 7.033 10.0 9.034 8.0 9.0 .888 1/390/3.0/3
35 6.0 8.0 1.00 0/3
. ... ' . .... ... . .. . . . .. -: -'- . _ .i .. ... . .._., .'..,,,,], ;' . J .1
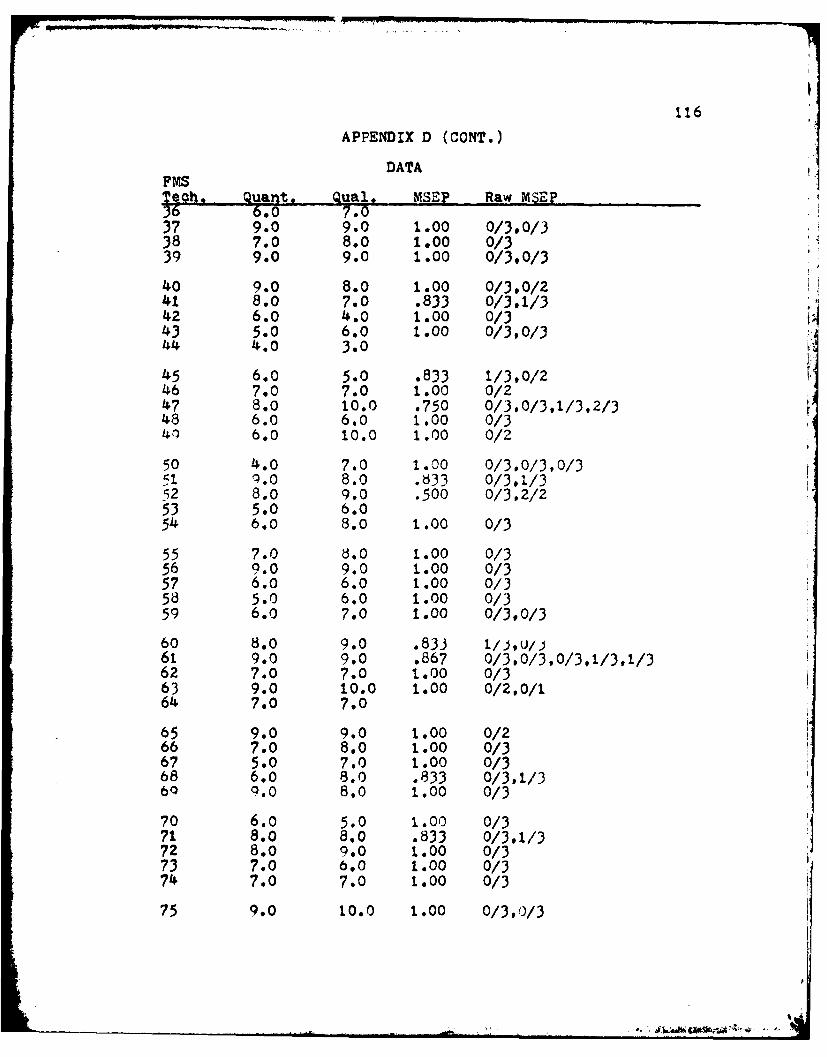
116
APPENDIX D (CONT.)
DATAFMSjech, Quant * Qual, MSlqP Raw MSEP36 6.0 7.037 9.0 9.0 1.00 0/3.0/338 7.0 8.o 1.00 0/339 9.0 9.0 1.00 0/3,0/3
40 9.0 8.0 1.00 0/3,0/241 8.0 7.0 .833 0/3.1/342 6.0 4.0 1.00 0/343 5.0 6.0 1.00 0/3,0/344 4.0 3.0
45 6.0 5.0 .833 1/3,0/246 7.0 7.0 1.00 0/247 8.0 10.0 .750 0/3,0/3,1/3,2/348 6.0 6.0 1.00 0/341 6.0 10.0 1.00 0/2
50 4.0 7.0 1.00 0/3.0/3,0/351 9.0 8.0 .833 0/3,1/352 8.0 9.0 .500 0/3,2/253 5.0 6.054 6.o 8.0 1.00 0/3
55 7.0 8.0 1.00 0/356 9.0 9.0 1.00 0/357 6.0 6.0 1.00 0/358 5.0 6.0 1.00 0/359 6.0 7.0 1.00 0/3,0/3
60 8.0 9.0 .833 I.,u/.61 9.0 9.0 .867 0/3.0/3,0/3.1/3,1/362 7.0 7.0 1.00 0/363 9.0 10.0 1.00 0/2,0/164 7.0 7.0
65 9.0 9.0 1.00 0/266 7.0 8.0 1.00 0/367 5.0 7.0 1.00 0/368 6.0 8.0 .833 0/3,1/360 9.0 8.0 1.00 0/3
70 6.0 5.0 1.00 0/371 8.0 8.0 .833 0/3.1/372 8.0 9.0 1.00 0/373 7.o .0 1.00 0/374 7.o 7.0 1.00 0/3
75 9.0 10.0 1.00 0/3,0/3
L'

117
APPENDIX D (CONT.)
DATAFMS
Tech. Quant, Qual. MSEP Raw MSEP76 8.0 8.0 1.00 0/377 4I.O 5.078 6.0 7.0 1.00 o/j
9.0 9.0 1.00 0/3,0/3
80 9.0 8.0 1.00 0/381 3.0 5.082 8.0 9.0 1.00 0/383 8.0 7.0 1.00 0/384 5.0 6.0
85 7.0 8.0 1.00 0/386 5.0 9.0 1.00 0/3,0/387 8.0 7.0 1.00 0/3,0/3,0/388 7.0 8.089 6.0 9.0 1.00 0/3
Notes, 1. The Technician numbers that appear here are notthe same as the code numbers used in the actualexperiment. The numbers were changed to protectthe identities of the technicians.
2. The Quantity and Quality ratings are based on a10.0 scale.
3. The Raw MSEP data reflects the number ofdiscrepancies found by inspectors versus thefailure baseline for the particular task inspected.
4, The MSEP data is calculated by averaging theRaw MSEP data and subtracting this value from one.

004:-a 4 - Oft. am Ca' a Za OWN. 0
* 20 3 2 0 .
haS@a 6 a.I S .a * a*~~c in~ v, S
O~~aSS Mm.
o S , 0 I .
I~ ft 'Am3.haNQ . z .-zx z zz x Ia Iaa. . . .
*x .. A 0.. .wo a a .
a ~ l
faNa a Q--a *0.
z X= Z Z X l z a0 a 0 z z z zw s z ). 40. - 1*ow o Z15 oT* 24 0 3* 0
ZTZX XZZX 0~1 . - I a ON -a4
a c22 U N a2:1. C a z*
a~- .5534£ S
co I 35- *l So '" a.co .513 co .*.. - 53*.a "
*i Co 1 . a
coo~-a IA-*-aaC*ft 0N *0 0-
j rla -. 3
I55 * I *62" z. sa, C 4z* a~~ a *~ :.w LA"
V &W z 2 - ,..On I--
4440 IA 0 a in 4@
a a~ 4-33.55
.1o coop w co a 0 4N i
.r Et v
42 . a- 4z a

119
. ~ ~ A- lotV * E*4~CWC
.zz .3 0.e4C * .ee
Z2 .CZ 4
24 S VIN
0. 0 , .
X,4 4-a (1
co a-e Z* eNftft6U2 S
-N . 2'.I.ON - -t
4..C
N I I
at a
as&a *a s95AS

120
Z' OC 1
soonr COCNL v ~ r
wani womm - W -
Ce S W -
c cJ 0 5
* ~ . . ~ . .
XX X zX2 xx*x z z :: * I 1 2 5
xxUzz z S. e Se .
O*- sr* . . . . S*z z I I; : !
C_- 4.N -
*t* * C * . C 5
C Z.Q5N C OO - wlZOZP 45S S 2.0
0= . .50
C~~~ 7 22S I I * -
.. O. *.
222zzz - N.~S zzzz~zs. N a&C
400222 S'5 -00te 122e ;
*w . S
05 20 note "w I 0
0200 00 a -
sa C-2

121
-~Cox.Nv * . v
WOOc 60 0 4
xzzz..z.. : 0
oft
ft .e a
64- 14-I
=0--
coovzzzxza *.
* -4-) I 4-
*Z . .U 4
VAs 0.1.1.*
.S SIT I. Z4
to 1 * 4.
z ao*

122
N.00
4-4.-
C n N -.4 cj 4.-4r_
' - :t ', 4C\ .
-
10 > 44 C 0C 4-. (n CC)( ) OD (IC~--C t
od 0 (2) W )10 - O C'- ( )Ll > :J)fL2; 4 C' .1 0 * .O c"
O 4J ~ .-) X4.4 4 \C0 C-4 0-4 +11 -- ~ ~
4' .
~~~~~- 4N r)-e~ \ .D. N
L4 L4 xL 4 .- 4 -4 -4 -4 U -
:L. zL 4-) 1144 4.
x 0. dj 0 U) > (n c- C-('4 xO,- D D Ui 10 .- - 1 $4 CUI co CO - o (WI zt. 0U) 4- f W cd -4 w 4 ~ C1
-4 C%- * 0 -44 LC.1 ' it 4-) O(:t< C
0C m > 0 ix + 4X C' 0 0 '..Z -fl L0. -'C w4 ::. NU.- .- 4\C, 'c'Z ,
c .. *'A4 cli 0- C a_, a b*-e 0
CUCU ~ ~ 1- 11Cd' I d.-
00.~-04 ~.4 COJ-' C~
- 4 C.4 +j .) 4 4CU E. - C- On 0Cz S- tsd O N I I ac ("N 4 *.-4 crEE U) II X . . C. .
) 0 0 d) t4 >.- -4~ -- 4 0
L 1 Z~ 4CO-2 4-0 1 0. 0 GJ- co .0 4
*Pdi -4 * l 4 - +
0 v 0 ~ .3 VC 0.0- cIlicn-4 cn
CUU i 0 AU0)/ .0 .-. L4 -i a)~
S- .-I -0a) 4'C)i--C t U.'J) O
?'l C) a En -C.U sal II ~ 0.0.-- 0WZ.
C 4I- 11* ** . ~UX0 4 '- or

123
a) 0 Q).S" 4 c)
-4
w- CU, U
4) * 4- 0o * 0 0 - Ik Ie ~
-0 w0 02 r-
~%-4~4 U) ) U -
Q)O -4 0 ~ c U 0 '
- q 4-3 -4
-d"4 >..C i
wz 0-t4- C-
~< CfL J - "4 I-
0 *.--4
C" 02 :N V)L nZ., .)iI or4-
E-IL VI.\ U)> C-4 ~ 1 1 Ik K
Po CC/) \D 0-4 U +1 4- -0~ 4 r- c4 (
II s uC- 43j U)0o~~ 1.. C-..a
U) - a)~ -4 - S-4
) 0 0' 0-*0
CdC CTI 4-' :L 4 4-3

12L4
APPENDIX H
F-Test for Equivalence of Samolp Varian~cesFMS 4uantity and Quality of Perforrnancea
1. H0 : variancel=variance2
HI: variance1 #variance2
2. ',rdegrees of freedorn=(n 1-1;n 2-1>=(8' ,88)
3. Risk=.O5=al ha
*Critical ieglon: Accept H. if
F (-,/2; ni -1,ri-2' F < (-42;n-. 2 1
.545 F <
5. Calcula'ion of F:
... Ccrcluslon: ca-nnro- re~ec' varian~ 1 re
a-Zalculation and tab -'- so,-,Arce: N-?tizr an- ,,'asser-an,\.I

125
APPENDIX I
Comparison of Sample DistributionsFMS Quantity versus uality of Performan'
1. Kolmozorov-Smirnov non-parametric two sample test.a 'b
H0 : Fl(x)=F2 (x) for all x.
Hl: F1 (x) ' 2 (x) for some x.
2. Risk: P=.05 c
3. Critical Region:
R~eject H0 if D. 1 2~ - .:.14-~=.~9
a'clzlai on of 2
1 3 2 .03 ;2- .'
-~3 74 i .12 .10.5 21 14 . 1.6 41 23 .46 .26 .2-7 54 3o .61 . 4 .178 72 61 .81 .69 .12
87 83 .o8 .9310 889 .0 .00
D_= .20
5. Conclusion: as D_ - .05' reject the null hypothesis,
conclude that F1 < F2 .
aSource: Gibbons (1976;252).
bAssume that the quantity and quality ratings for eachtechnician by the same supervisor are indezanden-samoles from two populations.
CThe risk (P) value is based on the assumption thatquantity and quality of performance are continuousvariables. If these are continuous variables, thenthe P value should be considered conservative. (Gibbons:page 258).
"I

126
APPENDIX I (CCN.)
Comparison of Sample DistributionsFMS Quantity versus 4uality of Performance
1. Behrens-Fisher approximate "t" test, (Dudewicz;i976:7 ',
for the case where variancej/variance 2 .
Ho : meanI =mean2
Ht: meant/mean2
2(s,i t~r)-
v=degrees of freedom /n nrn-777=175.7-o or !75 -
3. 1isk== .0 5
U..ri= a 1 R egion:
Reject H if t*l> tcx/2;,j)
. Calculation of "t":
______t____ -1 4.179":(s /n +s4!n.)
6. Conclusion: Reject M : meanik.ean-
7. Type I1 error: Calculated for a iven in.ervai -if:er-ence assu.mina equal variance (Freund;97?:2 ' 7
d= 0 .231
Using the tables for two-tailed tests (_ = .C5)from Freund (19'77:497), the Type I! error ((3) eclals C
a;,elch's formulation for iegrees of freedm fcr t re
Behrens-Fisher problem (Dudewicz;j76:3 1).

127
APPENDIX J
Correlation Analysis
for Quantity/Quality Associations andQuality/r.SEP Associations
1. All linear correlation coefficient calculations weremade using the BVDP Bivariate Plot (P6D) program (Dixon;1977). The bivariate plots and correlation coefficentsare --resented on pages 128 and 129. The coefficientswere tested in the following manner:
Ho: P = 0Hj: 10 o
2. RSik=o= .01
3. Critical Rea _on. Reject F. if
r > Cr*(n-2) (from Snedecor;!q56:' )
4. Calculation:
x, i (xk--,o.)(xii- x i) (X X k
5. Conclusions: See pages 128 and 129.
aRevised ?SEP data includes only personnel with two ormore inspections.

128
a4 -0
> .0
X. ft 00 Cd94
*ftQ0 -z 0.t
0 V.
0)
IC ~ I4ca C) 0.5
C-4 4 !)0 CUOd w 0
oz -C toQ 0~- '~ U) a4
* 4.3>~<4-- ..',- 0) 0 .-- 4iz a4 .
* ~ ~ .-V as~0 0"~~
*~4- -M - 4*4~
> 0 r- m-0
c
Li E0 0
- .04
ft f
SCd a*4J4+J
.1) c p 0)

129
c AI> (n Cd4 dV 0p. 0
T N ' :0= CY a) (D 4Cd Cd
so . -4 0 0
040
4- (2) u+ 0
0 zd
Z AWIN Z.
m CA- -. CTQ* . C~cM:g .~>o
W "cv&

IN0
APPENDIX KM.AINTENANCE 0?FICER SURVEY
.Dar Slr,
i am currentlY an A"L P az.r ~Univ~rslty, an assi-7-rr, ,n leoZ- 'a&w :h.n Las;irears as a f1l-,:h-r safety c27:.'Ice~- ~.co: ~ .
am ccn--ribu;Irn: to an Al:7:0 z..p2r: ormance, and -olan -3 .- ,-.y -a .i -. .
jumua.r ., upon on-J' - l f n " a, n
a e .o,, -.
s, remurn :h~ --- -. ~'-;-- *~
1 oin.- z:, encios-&< sc.. -a-.,:.>Z -
- -, _ __ _ _1;- -3n - .--a
Hi: ~1;a,;~.C.A ,.

131
APPENDIX K (CONT.)ANSWER SHEE?
1. Is individual perfcrrnance impoor-cant to L~a*- mai-L:2-r:,.ncuorg;anizati on*?
2.Are the ranking forms (Attachmen- s 2 andi 3) >::.lor auoraising -performance cr can yo-u su,--es- a o:approac':
-* .re quan,:iTy and .<,ua-,!i y useful ~u'
ali,c -do you cons--1 to oe:s:e-r..,
oeis moeirnortan- tna --u -,vc un~ucft more in-.ortan. l-, ic?

132APPENDIX L
SURVEY ANSWERS
1. Is individual performance important to the maintenanceorganization?
Answer i Definitely!
Answer 2s Of course. Maintenance production is the sumof individual performances.
Answer 3s Without doubt. The integrity of the technicianis all we can depend on. And integrity in this casetranslates into quality.
Answer 4s Yes.
Answer 5s Yes.
2. Are the ranking forms appropriate for appraisingperformance or can you suggest a better approach?
Answer Is Yes.
Answer 2: They may be useful, but are, by themselves,shallow. In many jobs the technician either can do thejob, or he can't with no gradations in quality. Qualityin trouble-shooting may not necessarily go with qualityof repair. In many jobs, particularly in avionics,poor quality will probably go undetected. Supervisorswill probably be influenced by a strong halo effect.
Answer 3: They are O.K. I can't suggest a better oneoffhand but I would be interested to know how specificsubordinates "turned out."
Answer 4& May be appropriate for research--oversimpli-fied for the many jobs in aircraft maintenance.
Answer 5: MSEP data is currently used for this.
3. Are quantity and quality useful measures of performance?
Answer Is Definitely important inputs in the totalevaluation of the individual.
Answer 21 (I guess I started answering this above.)Useful, but if they are to be the only measures, and therater knows they are the only measures, they willreflect far more than their titles. They will becomeAPR's.
.1

133
APPENDIX L CONT.)
SURVEY ANSWERS
3. Are quantity and quality useful measures of performance?
Answer 3t Yes.
Answer 4: Yes, although I am biased toward qualitybased on my experience in Q.C. Organization measuresof performance are also important.
Answer 5: Yes-measures currently in use.
4. dhich do you consider to be more important, quantity orquality?
Answer 1: One can hardly be considered without the other.Everything being equal, I would choose quality overquantity.
Answer 21 Quality standards must be met in any .1,ob.regardless of iuantity (speed). It is more compliateathan that, but "quality" comes first.
Answer 31 Quality.
Answer 4: Quality (see !-3).
Answer 5& Quality with the exception of wartimeconditions--budget is also a factor.
5. If one is more important than the other, can you indizatehow much more important it is?
Answer 1: Quality is more important only to the degreethat without quality maintenance the mission would bejeopardized, i.e., safety, aborts, out-of-commissionrates, etc.. Regardless of the amount of output, ifit's not reliable the quantity would do little formission accomplishment. Quality is considerably moreimportant.
Answer z: "Quality" is absolutely overriding In Import-ance, BUT "quality" is not an absolute. For example, ifa perfectly reliable "temporary fix" saves a mission noone will fault the loss in quality over a lengthyperianent repair. The same component in the shop foroverhaul would not be acceptable with the temporary fix.Another example of the nebulous nature of quality mi.htbe corrosion control. The Air Force, particularly ,want3 factory new paint jobs. The technician who doesa by-the-book perfect job of inhibiting corrosion on
_46*h MU'4ia! .5

134-
APPENDIX L (CONT.)
SURVEY ANSWERS
5. prominent panel may, by technical standards haveachieved quality, but by other standards, have done apoor job.
Answer 3s Quality is by far more important in mostinstances. Quantity, in my estimate, is more importantin a very few cases, probably in wartime, when battleoutcome pZ depend on speed. In such cases the decreasein quality can only be tolerated in some areas, and is, *1or should be, a calculated thing.
Answer 4t Quality is always more important with some tpossible exceptions during wartime.
Answer 5, No answer.
LI-I

3 5
Glossary
AF3. (Air Force Jase).
AGE (aerospace ground equipment;. All eIip_:)et r~i~the ground to mnake a system operatiornai ints tn'enviroinent.
APR (Airmnen Per 4'orman~ce .Ratinal. An' annrui crz~r~a~nriisal of Airmen.
cons,_str'.t estimator. An es,4-a-'-r Is a cnz'stzn: : ~of a nara,~.eter if wthz''r sa:~nle 3zie, the;_Crobatility~ that _";vae OT~ ti ~ tis ie'r~-!
t':-,t of the -,aram, ter be:m3serr ~' C
e 4 -ent esti:m-:or. An s..a aor osas -u iaT or .~nano tner t st- st-an ir4 err -r z afor thea same samnle size.
estim;ator. A sta-istic obtalned, frr.'= a sam~le c3-:1oo-uiaa'Lon n-arameter. For irst;ance, t-_. sam '- -ria partimclarlyr good estimator *7:r 'enui:
fabricaticn, ern:rne an,! aircraft sucs:,stem ~~'
he tero scedas t-iit'v. The case where ers:.irr'vri':cis not constant over all observations.
histogrram. A graphical portrayal of' a ou infetrvdstrV ibution.
*kurtosis. *Iore or less peaked than a normal IiIstrittir
:cO:ICZ (,,,ainternancp .TVaa_-een t T nformati -n ar- 2nto* System). A base level conuter s:,'st-m ie:3:T'-'ei t mrv
the eff ectiveness of -aintenan.2e ozan~zat".ons.
..-- (Yaintenance 2;taniardizatlon ari Tvlatz rzram,'.A quantitative qualityr ccr.trol pr:;ram !eci,7ned tc che>:-individual technical ccmretence an-I the Iual. ity, ofmaintenance thrxiagh evaluation- an! Innect:Dnc.
Or-S (Cr~anizational ; 'ainzenance Squadron,!. 2 is re-rrcnsi~iefor aircraft launchlng7 and recovery anj :r.3Dection..

Glossary
non-varamietric test. A test which rmaKes no nypot*'esi_ a ,-utthe value of a nopulation -carameser.
rearession anal>?sis. An anr.Jysis which indicate s *-v onevariable is related to another. Tt provicies an eiia-zicflwh-erein the known val-ue of one variab"le may be used 'Ccestimate the uinknown value of the other. is disti.ncf1rom correlati:r. analysis,-Awhich indicates te7 er e ewhichl two varia*-ies are relatei.
s ---mel .,. 'ooAa .ln is S'~e.wmncwan. meixrn, Ir-
roe Ierror * >e ooaitv errn'u . :c c
Th~~~~~~~~e~~ rr~ rj~ ' rra:l. en us: ~ n
u;nbasI, est--a-or. A taTistic tn~it nas in ~ce.
3?(UnIted .3ta-.es Air re

BIOGRAPHICAL SKETCH
Joel R. Hickman was born in Los Angeles, California,on July 20, 1948. He received his elementary education inthe Los Angeles Public Schools and his secondary educationin the Santa Monica Public Schools. He attended theUniversity of California at Los Angeles and graduated witha Bachelor of Science degree in structural and materialsengineerinF in 1971. In August, 1972, he was commissionedas a Second Lieutenant in the United States Air Force.Since that time he has served as an instructor and flightexaminer navigator and wing flight safety officer in theY.ilitary Airlift Command at MIcChord AF3, Washinz-tcn. ,hileat McChord AFB he entered the off-camtus -raduate Ibusinessschool of Southern Illinois Cniversiti, Edwardsville. aniaraduated with a raster of 3usiness Administration degreein 1 0. Tn i078 the Air Force seiected nim to cursue a,iaster of Science 4egree in lniustrial and .,.a.-.ementSystems Enfineeri.r.. at Arizona State University. Foilowin.-the comeortion of the Vaster's dezree, *Captain Hickman wilserve with the Civil Engineerina Squadron, K.'. Sawyer AFB,Michigan. He is a member of Beta Gamma Sigma, the businessand manazement honor society, and Alpha 5i '.u, the industrialengineerir. honor society. -!e is married and the father ofa son and daughter.