IFE E-2020-003 - IFE BRAGE
16
Effective Estimation of Energy Demand in the Norwegian high-speed Passenger Ferry Sector Towards 2030 Fredrik G. Aarskog Janis Danebergs IFE/E-2020/003 Research for a better future
Transcript of IFE E-2020-003 - IFE BRAGE
EffectiveEstimation of Energy Demand in the Norwegian
high-speed Passenger Ferry Sector Towards 2030
Fredrik G. AarskogJanis Danebergs
IFE/E-2020/003
Research for a better future
EffectiveIFE/E-2020/003 ISSN
2535-6380Revision No.:1
Publication date:28.04.2020
Client/Client ref.: FME NTRANS
ISBN978-82-7017-926-8
Title: Estimation of Energy Demand in the Norwegian high-speed Passenger Ferry Sector Towards 2030
Summary:The study described in this report is financed by FME NTRANS, User case 3: Radical transition in transport, Pilot 1 Hydrogen value chain. The main goal of this study is to map and estimate hydrogen consumption in the Norwegian high-speed passenger ferry sector towards 2030.
In the study two alternative zero emission solutions are evaluated; batteries with fast charging from grid, and fuel cells and hydrogen produced from a green source. A method is developed to estimate which ferry routes that may be suitable for hydrogen and which are suitable for battery electric. The energy consumption of each route is estimated based on distance travelled and estimated fuel consumption. The hydrogen consumption is mapped to a location based on end stops on current routes, and in time based on remaining contract periods of awarded tenders.
The conclusion is that there is a large potential for zero-emission operation using battery and/or hydrogen technology: Out of the 96 routes investigated 51 routes can be hydrogen powered while 30 routes can be battery powered. Hence, most of the fossil fuel consumption may be replaced by zero-emission solutions by 2027. A total yearly energy consumption of 8710 tons of hydrogen, 44 GWh of electricity and 4.1 million litres of diesel is estimated for 2030. This represents a reduction of fossil fuels by 93%, based on an estimated diesel consumption of 56 million litres in 2021.
This work is performed in coordination with the HyInfra project, work package C, task C.1, coordinated by Arena Ocean Hyway Cluster.
20 April 2020 Prepared by: Fredrik G. AarskogJanis Danebergs
(digitally signed on last page)21 April 2020 Reviewed by:
Øystein Ulleberg (digitally signed on last page)
23 April 2020 Approved by: Kari Aamodt Espegren
(digitally signed on last page)
Institute for Energy TechnologyP.O. Box 40, NO-2027 Kjeller, Norway / P.O. Box 173, NO-1751 Halden
Telephone: +47 63 80 60 00/ +47 69 21 22 00http://ife.no / [email protected]
Effective
i
Contents
1 Summary.........................................................................................................................................2
2 Introduction....................................................................................................................................2
3 Methodology ..................................................................................................................................3
3.1 Routes and fuel consumption.................................................................................................3
3.2 Tenders and contract periods.................................................................................................3
3.3 Bunkering and recharging locations .......................................................................................3
3.4 End stops and range requirements.........................................................................................3
3.5 Energy consumption per trip ..................................................................................................4
3.6 Estimated required battery and charging installations ..........................................................4
3.7 Estimated maximum battery capacity for each ship ..............................................................4
3.8 Battery or hydrogen powered? ..............................................................................................6
3.9 Yearly and average daily consumption ...................................................................................6
4 Results ............................................................................................................................................6
4.1 Estimated energy consumption from high-speed vessels in Norway.....................................6
4.2 Energy consumption per county municipality ........................................................................9
4.3 Hydrogen consumption per harbour ....................................................................................10
5 Discussion .....................................................................................................................................11
5.1 Recommendations................................................................................................................11
5.2 Uncertainties ........................................................................................................................11
6 Conclusion ....................................................................................................................................12
7 Acknowledgements ......................................................................................................................12
8 References ....................................................................................................................................13
Effective
2
1 SummaryThe study described in this report is financed by FME NTRANS, User case 3: Radical transition in transport, Pilot 1 Hydrogen value chain. The main goal of this study is to map and estimate hydrogen consumption in the Norwegian high-speed passenger ferry sector towards 2030.
In the study two alternative zero emission solutions are evaluated; batteries with fast charging from grid, and fuel cells and hydrogen produced from a green source. A method to estimate which routes that may be suitable for hydrogen and which are suitable for battery electric has been developed. The energy consumption of each route is estimated based on distance travelled and estimated fuel consumption. The hydrogen consumption is mapped to a location based on end stops on current routes, and in time based on remaining contract periods of awarded tenders.
A total of 96 routes were investigated, out of which 51 routes has the potential to be operated on hydrogen and 30 routes using batteries electric. Most of the fossil fuel consumption may be replaced by zero-emission solutions by 2027. A total yearly energy consumption of 8710 tons of hydrogen, 44 GWh of electricity and 4.1 million litres of diesel is estimated for 2030. This represents a reduction of fossil fuels by 93%, based on an estimated diesel consumption of 56 million litres in 2021.
The dataset developed in this work are published together with this report1.
This work was performed in coordination with the HyInfra project, work package C, task C.1, coordinated by Arena Ocean Hyway Cluster. The HyInfra project aims to estimate consumption from all domestic maritime consumers towards 2030. By April 2020 reports have been generated for high-speed passenger ferries (C.1), car ferries (C.2), the Coastal Express Route Bergen-Kirkenes (C.3), offshore sector (C.4) and other known projects (C.5). In addition, all consumers have been visualized on an interactive map. All resources are available on the members area on their website2.
2 IntroductionNorway has set ambitious goals for reduction of greenhouse gas (GHG) emissions from the transport sector. High-speed passenger ferries play an important role in the Norwegian public transportation system, but is unfortunately the mode of transport with highest associated CO2 emissions per passenger-km [1].
There are about 100 high-speed passenger ferry routes in Norway that in total consume about 56 million litres of diesel per year. This is equivalent to about 0.7% of the petroleum products sold in Norway. [2].
The large fuel consumption in a high-speed ferry and the fact that a ferry returns to the same port(s) daily, throughout the year, is an excellent starting point to establish a cost-effective hydrogen infrastructure. The high-speed ferry will ensure a stable long-term consumption, which is essential to establishment of the first hydrogen infrastructure.
The main objective of this study is to: (1) Estimate which high-speed passenger ferry routes may be fuelled by hydrogen, (2) Estimate the hydrogen consumption, (3) Identify suitable locations, and (4) Identify possible start-up times with hydrogen for each route.
1 https://hdl.handle.net/11250/274236 2 https://www.oceanhywaycluster.no/membersarea
Effective
3
3 Methodology
3.1 Routes and fuel consumption This study is based on the route descriptions and diesel consumption data provided in the report “Battery/fuel cell fast ferry” written by Selfa Arctic and funded by the Norwegian NOx-fund [2].
The accuracy of the fuel consumption data in the report depends on which county it is located. Oslo/Akershus and Sør-Trøndelag declared actual diesel consumption for 2015. Finnmark, Nordland, Møre og Romsdal, Sogn og Fjordane and Hordaland declared the total distance travelled. For Troms, Nord-Trøndelag, Rogaland and Vestfold the distance travelled was estimated in the report.
The report states that diesel consumption estimates were conservative, but realistic. Our consideration is that the fuel consumption data is very high. A modern high-speed catamaran with passenger capacity of 290 has a diesel consumption of about 18-20 L/NM at 35 knots, while this report states 27.5 L/NM. Therefore, in order to take a conservative approach, all consumption data is multiplied with a correction factor of 0.65. An exception is made for routes in Oslo/Akershus and Sør-Trøndelag, where the exact consumption data had been declared by the counties. For these routes the data was assumed to be accurate and general improvements in energy efficiency would lead to 10% reduction in consumption, justifying a correction factor of 0.9.
Routes with diesel consumption of less than 20.000 L/year were not evaluated.
3.2 Tenders and contract periodsIn this study it has been assumed that each route will change to a zero-emission alternative at the end of its existing contract period. The responsible County Municipality, existing contract operator and tender periods were collected from the document “Markedsoversikt båt og ferje 2019” published by the association Public Transport Norway [3].
For routes where only end of contract year is given, it is assumed 31st of December. For all contracts with extension options it is assumed that options are declared. This is considered a conservative approach regarding the actual start-up time with hydrogen.
It is assumed that no conversion to zero emission technologies will be performed in 2021. This is due to the development and construction time required to start operation with a zero-emission high speed vessel. The earliest possible start-up time with zero-emission solutions is assumed to be 2022.
3.3 Bunkering and recharging locationsDuring a high-speed ferry route, the time available for bunkering or charging under way is very short, or nearly non-existent. Increasing the waiting time at intermediate stops will significantly increase travelling time. Furthermore, intermediate stops are very often located on islands and remote places, where it can be assumed that charging is not possible due to weak electrical grids. In this study it is therefore assumed that all bunkering and recharging must occur at the route end stops.
3.4 End stops and range requirementsFor each route the end stops have been determined manually from available timetables. If one of the end stops is on an island it is assumed that charging or bunkering is not possible there, and all consumption is allocated to the remaining end stop. In this case the required range or route sailing distance is doubled. Otherwise, it is assumed that the total consumption is shared equally between the two end stops.
Effective
4
3.5 Energy consumption per tripThe diesel consumption (L/trip) is calculated from route distance (NM), diesel consumption (L/NM) and the correction factor.
The diesel consumption is converted to energy consumption by multiplying with diesel density of 0.845 kg/L, diesel lower heating value of 11.86 kWh/kg, and an estimated average diesel engine efficiency of 37%.
The hydrogen consumption (kg/trip) is calculated by multiplying with hydrogen lower heating value of 33.3 kWh/kg, and an estimated average fuel cell efficiency of 50%.
3.6 Estimated required battery and charging installationsThe required installed battery capacity if the vessel was to be operated with batteries is estimated by assuming a Depth of Discharge (DoD) of 60%. This is slightly higher than for car ferries, which typically operate with a DoD of 50%.
The selection of DoD is a design parameter that is based on an extensive evaluation of operational profile and battery degradation estimations. It could be possible to further increase the DoD, but this will cause significant increase in battery degradation. It is also important to keep a reserve energy capacity available in case of unforeseen circumstances or emergency situations.
The battery weight is estimated based on the product Corvus Dolphin Power, a Li-ion battery system designed for low-weight applications. This system has a weight of 375 kg per 47 kWh, equal to 8 kg/kWh [4].
For reference the required charging power required to recharge the trip energy in 15, 30, 60, or 120 minutes is also estimated. Very often a limiting factor with fast charging is the available charging power at the given location. A second limiting factor may be the power limit in the electrical connection between ship and the land facility.
Another alternative solution could be to swap batteries, but this has not been evaluated in this study. Battery swaps can potentially be faster than battery charging and will most likely requires less installed capacity in the local power grid. It could potentially also reduce battery degradation. However, such solutions are still only in the concept design phase and it has yet to be approved and tested. Hence, it is at this stage uncertain if swapping of battery modules t can be an acceptable solution.
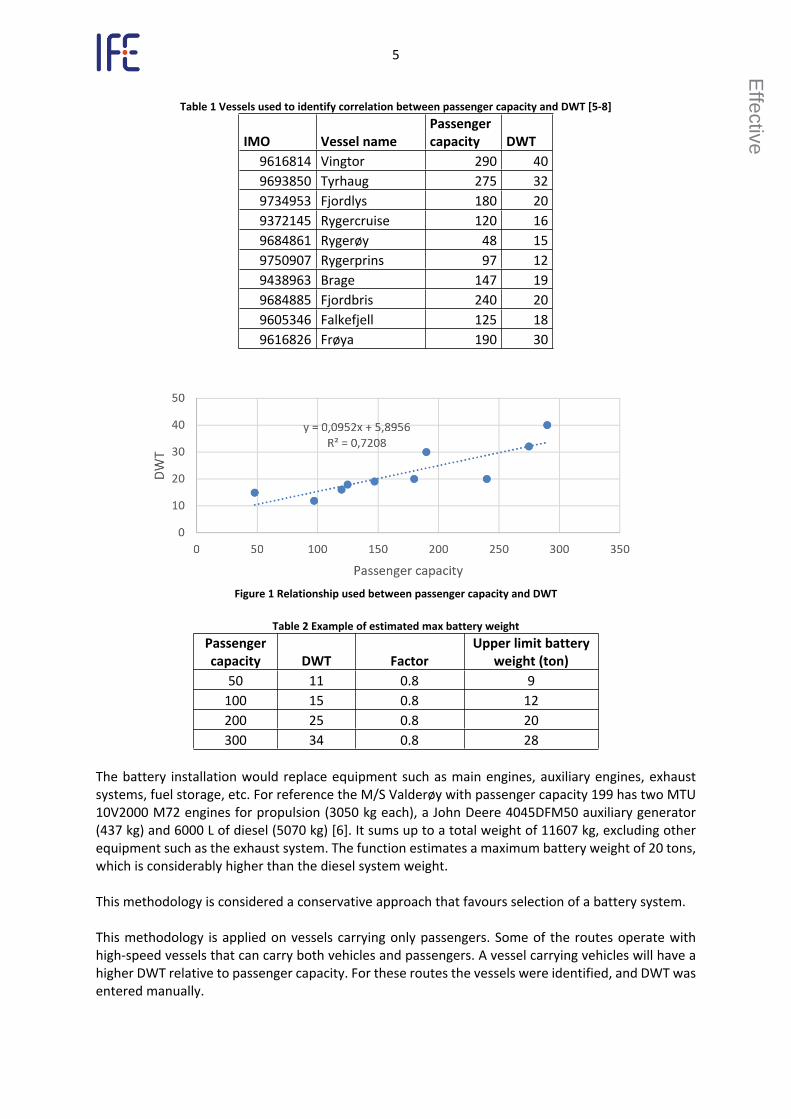
3.7 Estimated maximum battery capacity for each shipCalculating the exact maximum battery capacity for each ship is extremely challenging and would require detailed knowledge of the operational requirements and specific ship(s) operating each route. It would also be very time consuming and not possible within the scope of work in this study. Instead the maximum possible installed battery weight is estimated based on the only available information that tells something about the ship size, namely the passenger capacity (PAX).
A simplified methodology was developed by making a qualified guess that an upper limit of battery weight corresponds to 80% of the ship’s dead weight tonnage (DWT). To correlate the known passenger capacity to DWT a sample of 10 vessels of various sizes were collected (Table 1). Based on this data a linear relationship between passenger capacity and DWT was established as shown in Figure 1. The resulting estimated battery weight for various vessel sizes based on their passenger capacity are presented in Table 2.
Effective
5
Table 1 Vessels used to identify correlation between passenger capacity and DWT [5-8]
IMO Vessel namePassenger capacity DWT
9616814 Vingtor 290 409693850 Tyrhaug 275 329734953 Fjordlys 180 209372145 Rygercruise 120 169684861 Rygerøy 48 159750907 Rygerprins 97 129438963 Brage 147 199684885 Fjordbris 240 209605346 Falkefjell 125 189616826 Frøya 190 30
Figure 1 Relationship used between passenger capacity and DWT
Table 2 Example of estimated max battery weightPassenger capacity DWT Factor
Upper limit battery weight (ton)
50 11 0.8 9100 15 0.8 12200 25 0.8 20300 34 0.8 28
The battery installation would replace equipment such as main engines, auxiliary engines, exhaust systems, fuel storage, etc. For reference the M/S Valderøy with passenger capacity 199 has two MTU 10V2000 M72 engines for propulsion (3050 kg each), a John Deere 4045DFM50 auxiliary generator (437 kg) and 6000 L of diesel (5070 kg) [6]. It sums up to a total weight of 11607 kg, excluding other equipment such as the exhaust system. The function estimates a maximum battery weight of 20 tons, which is considerably higher than the diesel system weight.
This methodology is considered a conservative approach that favours selection of a battery system.
This methodology is applied on vessels carrying only passengers. Some of the routes operate with high-speed vessels that can carry both vehicles and passengers. A vessel carrying vehicles will have a higher DWT relative to passenger capacity. For these routes the vessels were identified, and DWT was entered manually.
Effective
6
3.8 Battery or hydrogen powered?It is assumed that a battery solution is preferred if it is technically possible. For each route the minimum required battery capacity is compared to the upper battery weight limit for the ship. If the required installation is less than the upper limit the route is selected to be battery powered. Otherwise, it is assumed it will be hydrogen powered.
For a few routes a manual override function is used to force a hydrogen system. This can be done if the same vessel can serve several routes, where at least one would require a hydrogen system or the combined range requirements of several routes would lead to a higher required battery weight. It can also be done if a route is a typical rush hour route. In this case it would be a significant benefit if the vessel can perform as many trips as possible during the morning and afternoon hours, without being delayed by battery charging intervals between each trip.
3.9 Yearly and average daily consumptionThe estimated yearly energy consumption is calculated from the yearly diesel consumption, multiplied with the correction factor and properties of diesel and diesel engine mentioned in chapter 3.5.
The yearly hydrogen consumption is the yearly energy consumption multiplied with hydrogen lower heating value and previously stated energy efficiency of fuel cell (50%).
The average daily hydrogen consumption is the yearly consumption divided by 365 days/year. The average daily consumption may be misleading for routes that are operated only during summer or have a significant difference between winter and summer operation.
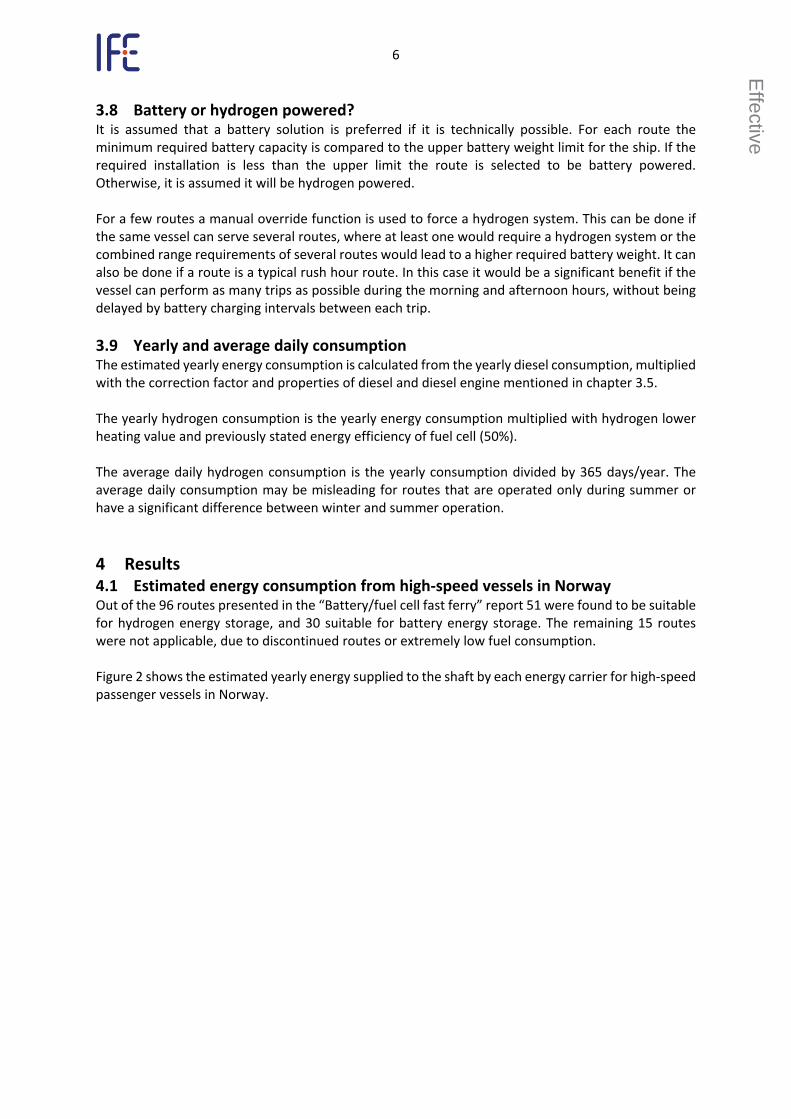
4 Results4.1 Estimated energy consumption from high-speed vessels in NorwayOut of the 96 routes presented in the “Battery/fuel cell fast ferry” report 51 were found to be suitable for hydrogen energy storage, and 30 suitable for battery energy storage. The remaining 15 routes were not applicable, due to discontinued routes or extremely low fuel consumption.
Figure 2 shows the estimated yearly energy supplied to the shaft by each energy carrier for high-speed passenger vessels in Norway.
Effective
7
2021 2022 2023 2024 2025 2026 2027 2028 2029 2030 2031 2032 2033 2034 20350
50
100
150
200
Total Hydrogen Total Battery Total Diesel
Year
Ener
gy to
shaf
t [GW
h/ye
ar]
Figure 2 Estimated yearly energy supplied to shaft for high-speed passenger vessels in Norway
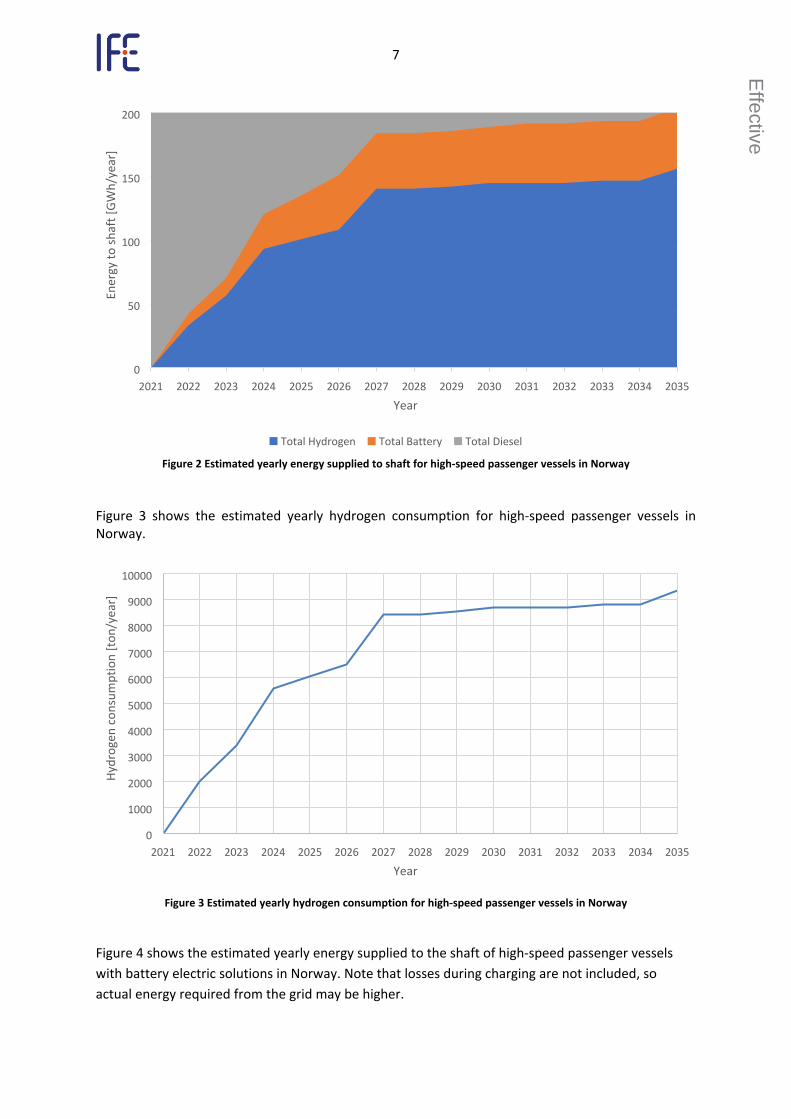
Figure 3 shows the estimated yearly hydrogen consumption for high-speed passenger vessels in Norway.
2021 2022 2023 2024 2025 2026 2027 2028 2029 2030 2031 2032 2033 2034 20350
1000
2000
3000
4000
5000
6000
7000
8000
9000
10000
Year
Hydr
ogen
con
sum
ptio
n [t
on/y
ear]
Figure 3 Estimated yearly hydrogen consumption for high-speed passenger vessels in Norway
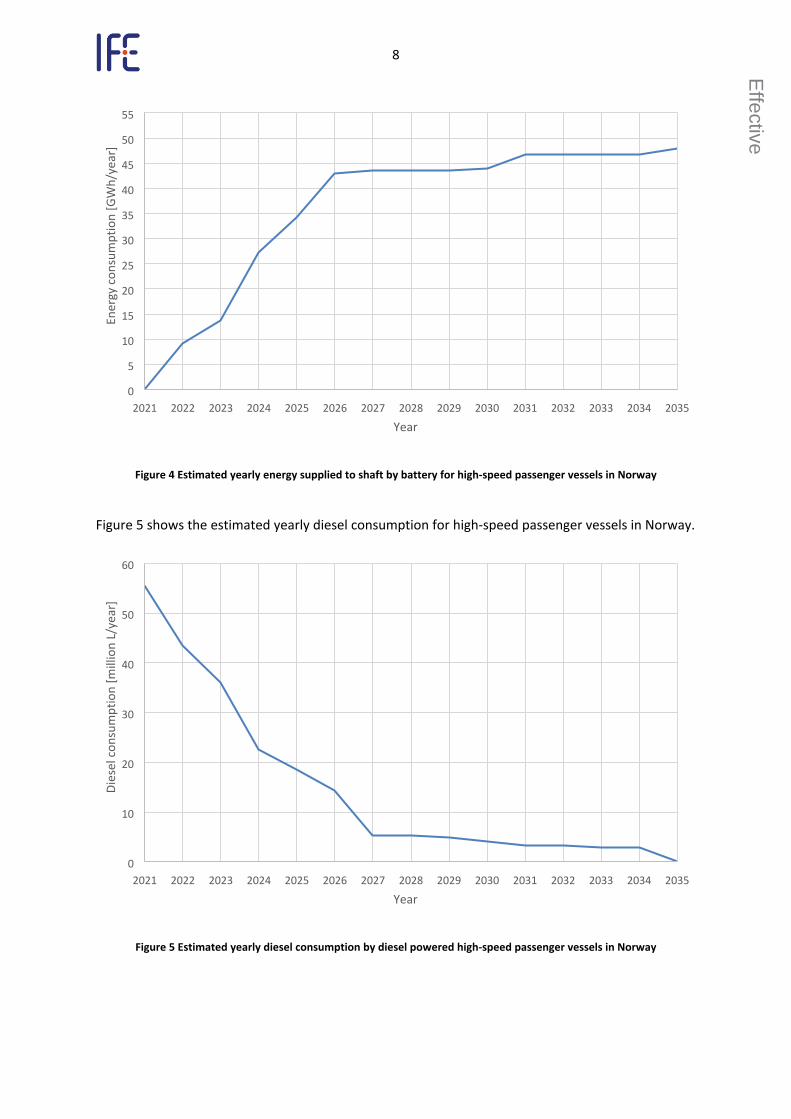
Figure 4 shows the estimated yearly energy supplied to the shaft of high-speed passenger vessels with battery electric solutions in Norway. Note that losses during charging are not included, so actual energy required from the grid may be higher.
Effective
8
2021 2022 2023 2024 2025 2026 2027 2028 2029 2030 2031 2032 2033 2034 20350
5
10
15
20
25
30
35
40
45
50
55
Year
Ener
gy c
onsu
mpt
ion
[GW
h/ye
ar]
Figure 4 Estimated yearly energy supplied to shaft by battery for high-speed passenger vessels in Norway
Figure 5 shows the estimated yearly diesel consumption for high-speed passenger vessels in Norway.
2021 2022 2023 2024 2025 2026 2027 2028 2029 2030 2031 2032 2033 2034 20350
10
20
30
40
50
60
Year
Dies
el c
onsu
mpt
ion
[mill
ion
L/ye
ar]
Figure 5 Estimated yearly diesel consumption by diesel powered high-speed passenger vessels in Norway
Effective
9
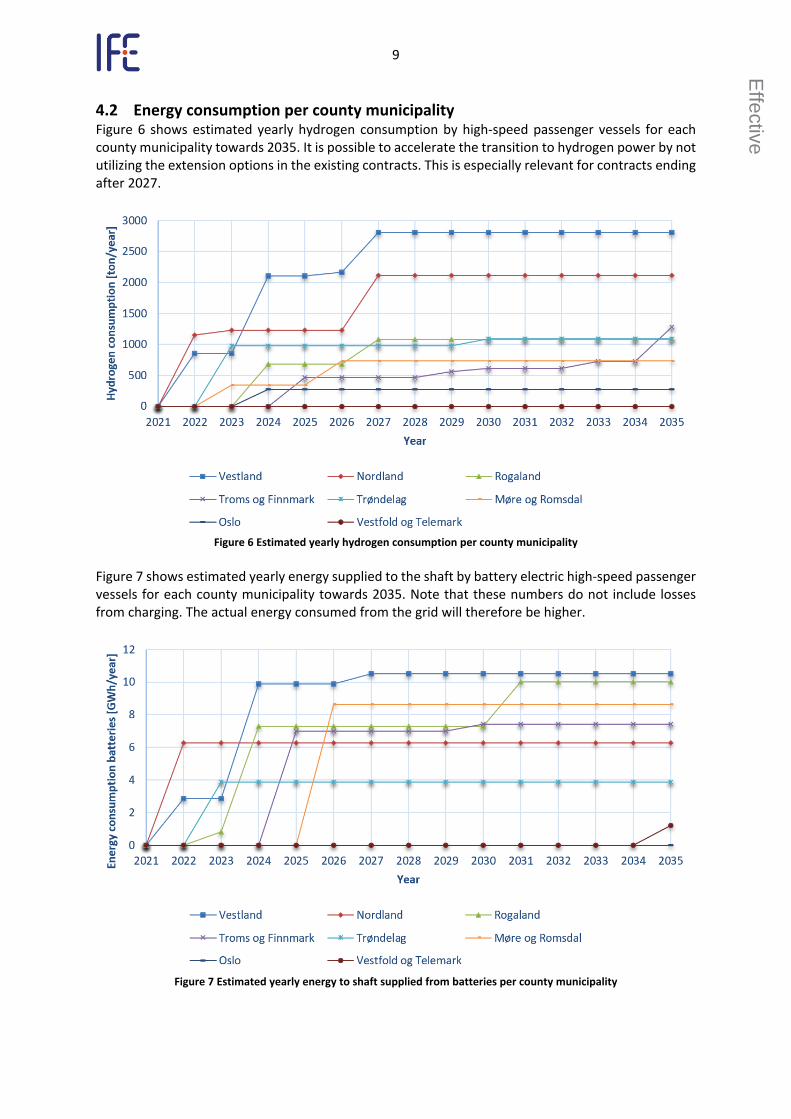
4.2 Energy consumption per county municipalityFigure 6 shows estimated yearly hydrogen consumption by high-speed passenger vessels for each county municipality towards 2035. It is possible to accelerate the transition to hydrogen power by not utilizing the extension options in the existing contracts. This is especially relevant for contracts ending after 2027.
Figure 6 Estimated yearly hydrogen consumption per county municipality
Figure 7 shows estimated yearly energy supplied to the shaft by battery electric high-speed passenger vessels for each county municipality towards 2035. Note that these numbers do not include losses from charging. The actual energy consumed from the grid will therefore be higher.
Figure 7 Estimated yearly energy to shaft supplied from batteries per county municipality
Effective
10
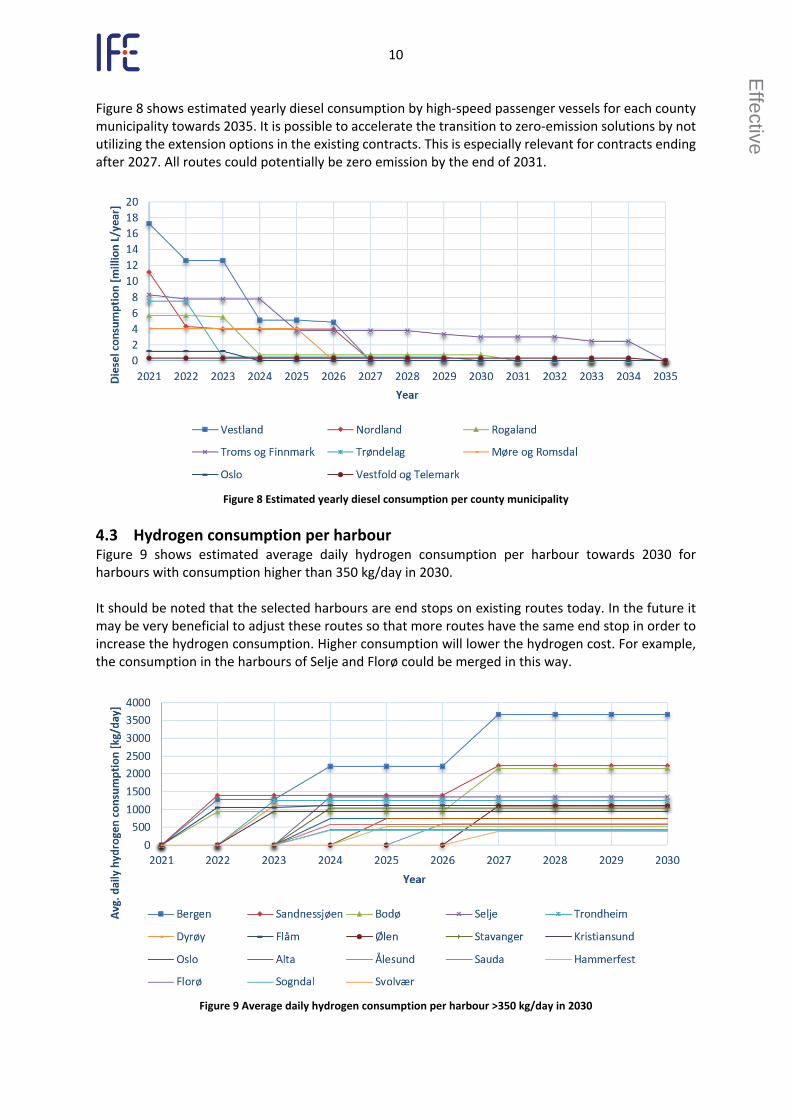
Figure 8 shows estimated yearly diesel consumption by high-speed passenger vessels for each county municipality towards 2035. It is possible to accelerate the transition to zero-emission solutions by not utilizing the extension options in the existing contracts. This is especially relevant for contracts ending after 2027. All routes could potentially be zero emission by the end of 2031.
Figure 8 Estimated yearly diesel consumption per county municipality
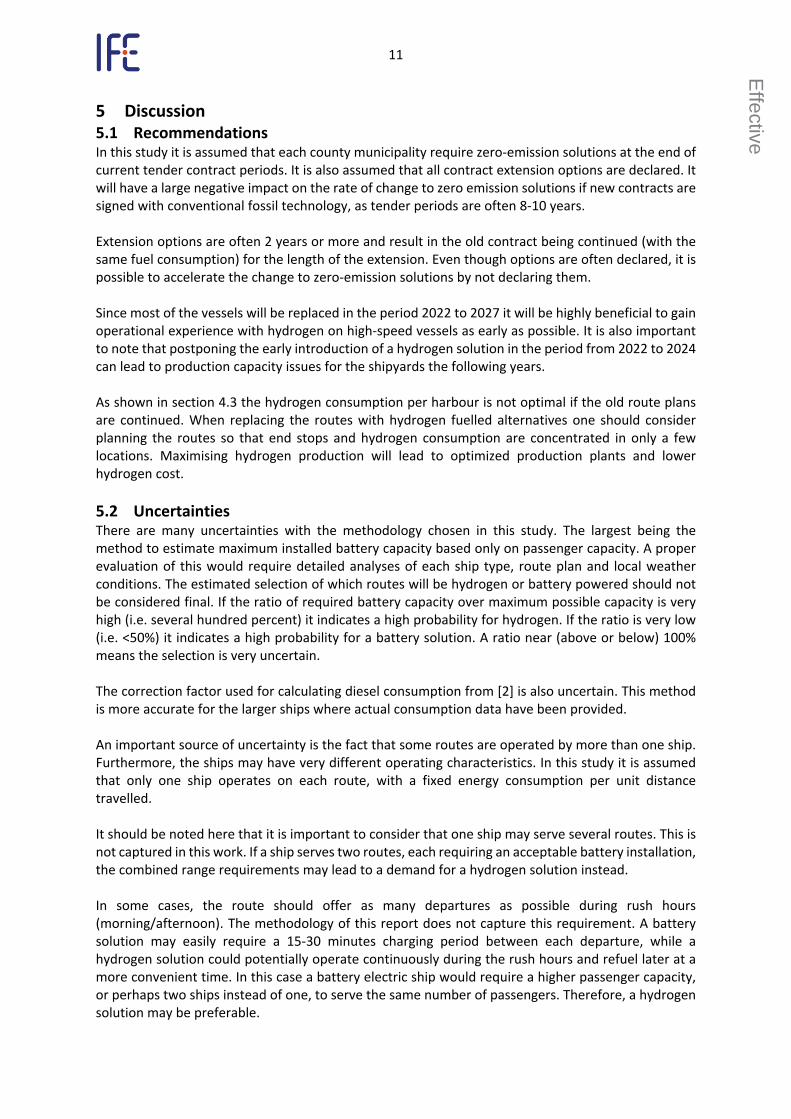
4.3 Hydrogen consumption per harbourFigure 9 shows estimated average daily hydrogen consumption per harbour towards 2030 for harbours with consumption higher than 350 kg/day in 2030.
It should be noted that the selected harbours are end stops on existing routes today. In the future it may be very beneficial to adjust these routes so that more routes have the same end stop in order to increase the hydrogen consumption. Higher consumption will lower the hydrogen cost. For example, the consumption in the harbours of Selje and Florø could be merged in this way.
Figure 9 Average daily hydrogen consumption per harbour >350 kg/day in 2030
Effective
11
5 Discussion5.1 RecommendationsIn this study it is assumed that each county municipality require zero-emission solutions at the end of current tender contract periods. It is also assumed that all contract extension options are declared. It will have a large negative impact on the rate of change to zero emission solutions if new contracts are signed with conventional fossil technology, as tender periods are often 8-10 years.
Extension options are often 2 years or more and result in the old contract being continued (with the same fuel consumption) for the length of the extension. Even though options are often declared, it is possible to accelerate the change to zero-emission solutions by not declaring them.
Since most of the vessels will be replaced in the period 2022 to 2027 it will be highly beneficial to gain operational experience with hydrogen on high-speed vessels as early as possible. It is also important to note that postponing the early introduction of a hydrogen solution in the period from 2022 to 2024 can lead to production capacity issues for the shipyards the following years.
As shown in section 4.3 the hydrogen consumption per harbour is not optimal if the old route plans are continued. When replacing the routes with hydrogen fuelled alternatives one should consider planning the routes so that end stops and hydrogen consumption are concentrated in only a few locations. Maximising hydrogen production will lead to optimized production plants and lower hydrogen cost.
5.2 UncertaintiesThere are many uncertainties with the methodology chosen in this study. The largest being the method to estimate maximum installed battery capacity based only on passenger capacity. A proper evaluation of this would require detailed analyses of each ship type, route plan and local weather conditions. The estimated selection of which routes will be hydrogen or battery powered should not be considered final. If the ratio of required battery capacity over maximum possible capacity is very high (i.e. several hundred percent) it indicates a high probability for hydrogen. If the ratio is very low (i.e. <50%) it indicates a high probability for a battery solution. A ratio near (above or below) 100% means the selection is very uncertain.
The correction factor used for calculating diesel consumption from [2] is also uncertain. This method is more accurate for the larger ships where actual consumption data have been provided.
An important source of uncertainty is the fact that some routes are operated by more than one ship. Furthermore, the ships may have very different operating characteristics. In this study it is assumed that only one ship operates on each route, with a fixed energy consumption per unit distance travelled.
It should be noted here that it is important to consider that one ship may serve several routes. This is not captured in this work. If a ship serves two routes, each requiring an acceptable battery installation, the combined range requirements may lead to a demand for a hydrogen solution instead.
In some cases, the route should offer as many departures as possible during rush hours (morning/afternoon). The methodology of this report does not capture this requirement. A battery solution may easily require a 15-30 minutes charging period between each departure, while a hydrogen solution could potentially operate continuously during the rush hours and refuel later at a more convenient time. In this case a battery electric ship would require a higher passenger capacity, or perhaps two ships instead of one, to serve the same number of passengers. Therefore, a hydrogen solution may be preferable.
Effective
12
Finally, this study does not consider new technologies that has not yet been tested. This includes for example battery swapping and hydrofoil solutions. Both technologies, if successful, could lead to a higher share of battery electric solutions.
6 ConclusionAn analysis of the energy consumption and type of zero-emission energy carrier to be used has been carried out for all high-speed passenger vessel routes in Norway. For each route the bunkering locations and estimated start-up year with a hydrogen or battery electric solution has been determined.
The main motivation for this study was to provide an overview of the high-speed passenger vessel market and its future demands for hydrogen fuel, in order to be able to plan an overall Norwegian hydrogen infrastructure.
The study shows that there is a large potential for zero-emission vessels using battery and/or hydrogen technology: Out of the 96 routes investigated 51 routes can be hydrogen powered while 30 routes can be battery powered. 15 routes were not considered in the study as these have been/will be discontinued or represent a very low consumption.
The conclusion is that most of the fossil fuel consumption may be replaced by zero-emission solutions by 2027. A total yearly energy consumption of 8710 tons of hydrogen, 44 GWh of electricity and 4.1 million litres of diesel is estimated in 2030. This represents a reduction of fossil fuels by 93%, based on an estimated diesel consumption of 56 million litres in 2021.
7 AcknowledgementsThis work was performed within NTRANS - Norwegian Centre for Energy Transition Strategies, a Norwegian Centre for Environment-friendly Energy Research (FME), cosponsored by the Research Council of Norway (project number 296205) and 42 partners from research, industry and public sector.
This work was based data and knowledge developed by MoZEES, a Norwegian Centre for Environment-friendly Energy Research (FME), cosponsored by the Research Council of Norway (project number 257653) and 40 partners from research, industry and public sector.
This report is part of the HyInfra project organised by Ocean Hyway Cluster. The HyInfra project aims to map the hydrogen demand from the Norwegian maritime sector towards 2030. Acknowledgements go to Steinar Kostøl and Trond Strømgren at Ocean Hyway Cluster for providing valuable feedback and technological insight for this report.
Effective
13
8 References1. Thune-Larsen H HR, Hovi I B, Eriksen K S. Energy efficiency and CO2 Emissions in the Norwegian
transport sector 1994-2050 [Online report]. Oslo: Institute of Transport Economics; 2009 [cited2020 Apr 20]. Available from: https://www.toi.no/transport-models/energy-efficiency-and-co2-emissions-in-the-norwegian-transport-sector-article28258-1261.html.
2. Ianssen C ST, Ianssen E. Battery/fuel cell fast ferry [Online report]. Trondheim/Sandtorg: Selfa;2016 [updated 2017; cited 2020 Apr 20]. Available from: https://www.nho.no/samarbeid/nox-fondet/artikler/rapporter/.
3. The Norwegian Public Roads Administration. Samlet oversikt over alle ferjesamband [Excel sheetonline]. Norway: The Norwegian Public Roads Administration; 2020 [updated 2020 Feb 03; cited2020 Apr 21]. Available from: https://www.vegvesen.no/fag/trafikk/ferje/markedsoversikt.
4. Corvus Energy. Corvus Dolphin Energy - Corvus Energy [Internet]. Norway: Corvus Energy; 2020[cited 2020 Apr 21]. Available from: https://corvusenergy.com/products/corvus-dolphin-energy.
5. MarineTraffic. Vessels Database [Internet]. UK: MarineTraffic; 2020 [cited 2020 Apr 21]. Availablefrom: https://www.marinetraffic.com/en/data/?asset_type=vessels&columns=shipname.
6. Skipsrevyen. Båtomtaler [Internet]. Bergen: Skipsrevyen; [updated 2020; cited 2020 Apr 21].Available from: https://www.skipsrevyen.no/batomtaler.
7. Norled. Informasjon om hurtigbåter i Norled [Internet]. Bergen: Norled; 2017 [cited 2020 Apr 21].Available from: https://www.norled.no/om-norled/kontakt-Norled/kontakt-hurtigbater.
8. Rødne Fjord Cruise. Våre båter [Internet]. Stavanger: Rødne Fjord Cruise; 2020 [cited 2020 Apr21]. Available from: https://rodne.no/vare-bater.
This report and its dataset is published here: https://hdl.handle.net/11250/2653026
The publications from the HyInfra project is found here: https://www.oceanhywaycluster.no/membersarea
Effective
Tittel: Estimation of Energy Demand in the Norwegian high-speed Passenger FerrySector Towards 2030 v3
Dokumentklasse: Research Report
Signaturer:
Content Approval: Kari Aamodt Espegrenife.no\Kari.Espegren
2020-04-30 11:20:36 (UTC+00:00)