
If you have issues viewing or accessing this file, please ... Department of Justice Office of...
95
u.s, Department of Justice Office of Justice Programs Bureau of Justice Statistics • If you have issues viewing or accessing this file, please contact us at NCJRS.gov.
-
Upload
vuongthien -
Category
Documents
-
view
224 -
download
0
Transcript of If you have issues viewing or accessing this file, please ... Department of Justice Office of...

u.s, Department of Justice Office of Justice Programs Bureau of Justice Statistics
• If you have issues viewing or accessing this file, please contact us at NCJRS.gov.

~"le • ,. 'it * -,
Bureau of Justice Statistics reports (revised April 1989)
Call toll-free 800-732-3277 (local 301-251-5500) to order BJS reports, to be added te one of the BJS mailing lists, or to speak to a reference specialist in statistics at the Justice Statistics Clearinghouse, National Criminal Justice Reference Service, Box 6000, Rockville, MD 20850, BJS maintains the following mailing lists: • Drugs and crime data (new) • White-collar crime (new) • National Crime Survey (annual) • Corrections (annual) e Juvenile corrections (annual) e Courts (annual) <II Privacy and security of criminal
history information and information policy
• Federal statistics (annual) ... BJS bulletins and special reports
(approximately twice a month) • Sourcebook of Criminal Justice
Statistics (annual)
Single copies of reports are free; use NCJ number :0 order. Postage and handling are charged for bulk orders of single reports. For single copies of multiple titles. up to 10 litles are free: 11-40 titles $10; more than 40. 520; libral'ies calf tor special rates.
Public-use tapes of BJS data sets and other criminal justice data are available from the Nation~1 Archive of Criminal Justice Data (formerly CJAIN), P.O. Box 1248, Ann Arbor, MI 48106 (toll-free 1-800-999-0960).
National Crime Survey Criminal victimization In the U.S.:
1986 (final report!. NCJ'111456, 9;88 19&5111nal report), NCJ-l04273 5i'37 1984 (Imal reportl. NCJ· 1 00435. 5186 1983 (final reportl, NCJ-96459. 10i85
BJS speCial reports. The redesi9ned National Crime
Survey: Selected new data, NCJ' 114746.1/89
Motor vehicle theft, NCJ-I09978, 3/88 Elderly victims, NCJ·l07676. 11 Illl Violent crime trends. NCJ·107217.
11/87 Robbery victims, NCJ·l04638, 4187 VIolent crime by strangers and
nonstrangers, NCJ·l03702. 1/87 Preventing domestic violence against
women, NCJ-l 02037.8/86 Crime prevention measures,
NCJ-l 00438. 3/86 The use of woapons in committing
crimes, NCJ·99643, 1/86 Reporting crimes to the pollee, NCJ·
99432. 12/85 Locating city, sUburban, and rural
crime, NCJ-99535. 12/85 /' The risk of violent crime, NCJ-97119.
5/85 The economic cost of crime to victims,
NCJ-93450.4/84 Family violence. NCJ·93449. 4/&4
BJS bulletins: Criminal victimization 1987, NCJ-
113587. 10188 Households touched by crime, 1987,
NCJ-111240.5i88 The crime of rape, NCJ·96777. 3/85 Household burglary, NCJ-96021, 1/85 Violent crime by strangers, NCJ·80829.
4/82 Crime and the elderly, NCJ·79614. 1/82 Measuring crime, NCJ-7571O, 2{81
BJS technical reports: New directions for the NCS,
NCJ·115571.3!89 Series crimes: Report of a field
test, NCJ-l04615. 4/87 Lifetime likelihood of Victimization,
NCJ·l 04274, 3/87 Response to screening questions in
the NCS, NCJ'97624,7/85
Preliminary data from the National Crime Survey, 1 988 (press release). 4/89
Redesign ot the National Crime Survey. NCJ·111457.3/89
The seasonality of crime victimization, NCJ·l11033.6:88
Crime and older Americans information package, NCJ·I04569. $10. 5187
Taenage Victims. NCJ·l 03138. 12/86 Victimi~atlon and fear of crill'e: World
jJerspectives, NCJ·93872, 1/85. $9.15 The National Crime Survey: Workin9
papers, vol. I: Current and histoncal perspectives, NCJ· 7 5374. 8182 vol. II. M 'thOdologi~al studies. NCJ-90307,12/84
Corrections BJS bulletins and speCial reports
Prisoners in 1988, NCJ- 116310,4189 Recidivism of prisoners released In
1983, NCJ-116261, 4189 Capital punishment 1987, NCJ·l11 9:39,
7188 Drug use and crime: State prison
inmate survey. 1986, NCJ-l 1 1940. 7;88
Time served in prison and on parole i 984,NCJ·l 08544. 1 i88
Profile of State prison inmates, 1986. NCJ·l09926.1188
Imprisonment in four countries, NCJ· 103967 2,'87
Population density in State prisons, NCJ,103204. 12;66
State and rederal prisoners, 1925'85, 102494.11;86
Prison admissions and releases, 1983. NCJ·l00582,3186
Examining recidivism. NCJ·96501. 2:85 Returning to prison, NCJ·95700. 11.'84 Time served in prison, NC.j·93924. 6'84
Correctional populations in the U.S.: 1986, NCJ-111611, 2:89 1985, NCJ·l03957. 2;88
Historical statistics on prisoners in State and Federal institutions. yearend 1925·86, NCJ·l11098, 6/&8
1984 census of State adult correctional facilities, NCJ-105585 7/87
Historical corrections statistics in the U.S" 1850-1984, NCJ-l 02529,4/87
1979 survey 0' Inmdtes 01 State cor'eellonal tacdities and 1979 census Of State correctional fachltles:
BJS spec'al reports The prevalence of imprisonment,
NCJ-93657.7/85 Career patterns In crime, NCJ·
88672,6183
BJS builetlns: Prisoners and drugs, NCJ-87575.
3/83 Prisoners and alcohol, NCJ-86723,
1/83 Prisons and prisoners, NCJ-80697
2/82 Veterans in prison, NCJ-79232, l1i81
Census 01 jao/s and survey of lall ,.,males: BJS bulletinS and speCIal reports
Jail Inmates. 1987, NCJ-114319, 12188
Drunk driVing, NCJ'109945, 2/88 Jail Inmates, 1986. NCJ·l07123.
10/87. The 1983 Jail census, NCJ·95536,
11/84
Census of local jails. 1983: Data for iridlvidual jaifs, vols. HV. Northeast. MIdwest, South. West. NCJ-l 12796-9; vol. V. Selected fmdings. methodology. summary tables, NCJ-112795. 1 ;;88
Our croWded jails: A national plight, NCJ-1 11846, BI88
Parole and probation BJS bulletins:
Probation and parole: 1987, NCJ-113948, ni88 1986, NCJ-l 08012,12/87 1985, NCJ-l03683.1187
Setting prison terms, NCJ-76218, 8/83
BJS special reports, Time served In prison and on parole,
1984, NCJ-l06544, 1/88 Recidivism of young parofees, NCJ-
104916,5/87
I § : BE dIU
Children in custody Census of public and private juvenile
detention, correctional, and shelter facilities, 1975-85, NCJ·114065, 5;89
Survey of youth In custody,. 1987 (speCIal report). NCJ-113365. 9/88
Public Juvenile facilities, 1985 (buffetin). NCJ· 1 02457, 10/66
1982-83 census of Juvenile detention and correctional facilities, NCJ· 101686.9186
Expenditure and employment BJS bulle/ins:
Justice expenditure and employment: 1985. NCJ·104460. 3/87 1983, NCJ·l 01776. 718S 19£12, NCJ·98327. 8/B5
Justice expenditure and employment: Extracts, 1982 and 1 983, NCJ'106629
8188 Extracts, 1980 and i 981, NCJ·9600'1,
6 1135 1971-79. NCJ·92596. 11/84
Courts BJS bulfellns.
Felony sentences in State courts. NCJ·115210.2!89
CrimIMal defense for the poor, 198\;, NCJ·112919,9:88
State felony courts and felony laws, NCJ· 1 06273, 8187
The 9rowth of appeals: i 91&·83 trends, NCJ·96381. 2/85
Case filings in State courts 1983, NCJ·95111,10'84
BJ£ specfal reports: Felony case-processing time, NCJ·
101985,8/86 Felony sentencing in 18 local jurisdic·
!fons. NCJ'97681, 6i85 The prevalence 01 guilty pleas, NCJ·
96018.12;84 Sentencing practices in 13 States,
NCJ·95399, 10184
Sentencing outcomes in 28 felony courts, NCJ·l05743. 8i87
National criminal defense systems study. NCJ-94702. 10186
The prosecution of felony arrests: 1982, NCJ'106990, 5/88 1981, NCJ·l01380, 9186.$7.60
Felony laws of the 50 States and the District of Columbia, 1986.
NCJ·105066. 2'88, $14.70 State court moc!el statistical dictionary,
Supplement, NCJ'98326, 9185 1 sl edition, NCJ·62320. 9180
Privacy and security Compendium of State privacy and security
legislation: 1987 overview, NCJ-l11097. 9/88 1987 full report (t,497 pages. mi~rofiche onlYI. NCJ-113021, 9188
Criminal justice Information policy: Strategies for improving data Quality,
NCJ-115339,5189 Public access to crtminal history record
information, NCJ·111458. 11188 Juvenile records and recordkeeping
systems, NCJ-112B1S. 11188 Automated fingerprint identification
systems: Technology and oolicy issues, NCJ· 1 04342.4187
Criminal justice "hot" files, NCJ·101850. 12/86
Crime control and criminal records (BJS speCial report). NCJ-99176. 10/85
State criminal racords repositories (BJS technical report). NCJ-99017, 10185
Cata quality of criminal history records, NCJ·9Q079.10185
Victim/witness le9lslatlon; An overview, NCJ-94365, 12/84
Proceedings of BJS/SEARCH conference:
Open vs. confidenUal records, NCJ-113560, 11188
Cata Quality policies and procedures, NCJ-l01849, 12/86
Information policy and crime control strategies, NCJ-93926. 10/84
Computer crime BJS speciat reports:
Electronic fund transfer Iraud, NCJ-96666.3/85
Electronic fund transfer and crime, NCJ'92650, 2184
Electronic fund transfer systems fraud, NCJ'1004Bl,4i86
Electronic fund transfer systems and crime, NCJ·83736. 9182
Expert v/itness manual, NCJ·17927. 9/81, $11.50
Federal justice statistics The Federal civil justice system (BJS
bulletinl. NCJ-l04769, 7/87 Employer perceptions of workplace
crime. NCJ'101851, 7/87 $6
Federal offenses and offenders BJS speCial reports.
Drug law Violators, 1980-86, NCJ-111763. 6/88
Pretrial release and detention: The BaH Reform Act 01" 1984, NCJ·109929.2/88
Whlte·collar crime, NCJ'l 06876. 9i87 Pretrial release and miscondUct, NCJ-
961321 /85
BJS bulletins. Bank robbery. NCJ·94463. 8184 Federal drug law violators, NCJ·
92692.2/84
General BJS bulletm, anrf spec,al report,s:
Profile of State and local law enfOrcement agencies, NCJ·113949. 3i89
International crime rates, NCJ-l 10776. 5/88
Tracking offenders, 1984, NCJ-l09686, 1/88
BJS telephone contacts '87, NCJ· 102909. 12/86
Tracking offenders: White-collar crime, NCJ· 1 02867, 11/86
Police employment and eXpenditure, NCJ·l00117.2/86
Tracking oHenders: The child Victim, NCJ·95785. 12/84
BJS data repo;£, 1988, NCJ-116262, 5/89 BJS annual report, fiscal 1988, NCJ-
115749.4189
Sourcebook of criminal Justice statistics, 1987, NCJ-1116t2, 9/8a
Report to the Nation on crime and justice;
Second edition, NCJ'l 05506, 6/88 Technical appendix, NCJ·112011,
8/88 Dru9s AI crime data:
Rolodex card, 800-666-3332, 8/88 Data center& clearinghouse brochure,
BC-000092.2188 Criminal justice microcomputer 9ulde
and software catalog, NCJ-112178, 8/8a
Proceedings of the third workshop on law and justice statistics, NCJ-112230, 7/88
1986 directory of automated criminal justice Information systems, NCJ-102260.1/87. $20
Publications of 8JS, 1971-84: A topical bibliography, TB030012,l::l/86.1f,l7.50
BJS publications: Selected library In microfiche, 1971-84, PR030012. 10/86, $203 domestiC
National survey of crime severity, NCJ-96017.10/85
Criminal victimization of District of Columbia residents and Capitol Hill employees, 1982-83, NCJ·97982; Summary, NCJ-98567, M85
HoW to gain access to BJS data (brochure), BC-000022, 9/84
See order form on last page
I
J

~. t ... ~_~ __ ~~~
U.S. Department of Justice Office of Justice Programs Bureau of Justice Statistics
II~S2~/
CrilTIinal Victimization in the United States, 1987
A National Crime Survey Report NCJ·115524, June 1989
U.S. Department of Justice National Institute of Justice
115224
This document has been reproduced exactly as received from the person or organization originating it. Points of view or opinions stated in this document are those of the authors and do not necessarily represent the official position or policies of the National Institute of Justice.
Permission to reproduce this s\!)~ed material has been granted by Public Domain/OJP/BJS U.S. Department or-J~U~s~tLC1~c=e
to the National Criminal Justice Reference Service (NCJRS).
Further reproduction outside of the NCJRS system requires permission of the~t owner.
-''\ i· .... ""·..a., t
~ .' .... NC*JR$.
J\'1\ 'Z9 \9t9
-.,CCQU\S'1",O'NS
-

U.s. Department of Justice Bureau of Justice Statistics
Joseph M. Bessette Acting Director
Acknowledgments. This report was prepared by Kelly H. Shim and Marshall DeBerry of the Bureau of Justice Statistics under the supervision of Patsy A. Klaus. Statistical assistance was provided by Gertrude Thomas and Ida Hines. Production assistance was furnished by Tina Dorsey. Marilyn Mal'brook administered publication, assisted by Jeanne Harris.
National Crime Survey data collection and processing activities are conducted by the Bureau of the Census. The program is currently under the super-vision of I,awrence McGinn, Chief, Crime Surveys Branch, Demographic Surveys Division, assisted by Marilyn Monahan, Patricia Bowles, Donna Brooks, Sherrie Schrama, Janice Sebold, Carol Spivey, and Bruce Wilder. Programming assistance in the Demographic Surveys Division was under the supervision of Stephen Phillips, with assistance by Chris Alaurs, Maryann McCormick, Hugh O'Connor, Charles Sheasley, and David Watt.
Guidance on technical matters related to this program was provided by Lawrence Altmayer and David Hubble, Statistical Methods Division, Bureau of the Census, under the supervision of Charles Alexander.
In the Bureau of Justice Statistics the data collection program is monitored by Michael R. Rand.
Library of Congress Cataloging in Publication Data
United States. Bureau of Justice Statistics. Criminal Victimization in the United States.
(A national crime survey report: NCJ-115524).
1. Victims of crime--United States. 2. Crime and criminals--United States.
I. Title. II. Series.
.4' ~. (' <i •. :>-,. "
The Assistant Attorney General, Offfee of: Justice Programs, coordinates the activities of the following program offices' and',bureaus: the Bureau of Justice Statistics: Nationl\l Institute of Justice, Bureau of Justice Assistance, Office of Juveilile'.Justice and Delinquency Prevention, and the Office fbr:. Victims of Crime.
ii Criminal Victimization in the United States, 1987

Preface
This report presents information on criminal victimization in the United States during 1987. It is the 15th in a series of annual reports prepared under the National Crime Survey (NCS) program. The study is based on findings from a continuous survey of a representative sample of housing units across the United States. Approximately 46,000 housing units, inhabited by about 93,000 individuals age 12 or older, took part in the survey. The participation rate for 1987 was 9696 of all eligible housing units.
As presently constituted, the NCS focuses on certain criminal offenses, whether completed or attempted, that are of major concern to the general public and law enforcement authorities. These are the personal crimes of rape, robbery, assault, and larceny and the household crimes of burglBfY' larceny, and motor vehicle theft. In this report, as in others In the series, the crimes are examined from the perspective of their frequency, the characteristics of the victims and offenders, the circumstances surrounding the offenses and their impact, and the pattern of police reporting.
The format of this report is similar to that of the 1986 edition. Selected general findings for J 987 are combined with technical information designed to aid in the interpretation of data contained in the 109 tables that follow in Appendix I.
Statistics in this report are comparable with those in the 1986 edition. Both reports are based on population controls derived from the 1980 census.
Appendix II contains a facsimile of the survey questionnaire and a brief description on administering the instrument. Note that beginning in July 1986 a revised NCS questionnaire was introduced. In order to be
lDefinitions of the measured crimes do not necessarily conform to any Federal or State statutes, which vary considerably. The NCS offense definitions (listed In the glossary at the end of this report) are generally compatible with conventional usage and with the definitions used by the Federal Bureau of Investigl!.tion in its annual publication Crime in the United States: Uniform Crime RepOrts.
compatible with previous years, the data were reformatted to match the contents of the 1979 questionnaire. Data derived from the new questionnaire will be presented in a future report. Appendix III has technical information concerning sample design, data collection, estimatIon procedures, and sources of nonsampling error and also includes instructions concerning the computation and application of standard errors. Appendix IV presents the results from a special supplementary analysis of the economic cost of crime to victims !n 1987. Besides listing crime eategory and subcategory definitions, the glossary (last section of this report) contains the meanings of variables and other terms used in the NCS.
All statistical data in this report are estimates subject to errors arising from the use of Information obtained from a sample survey rather than a complete census and to errors that occur In the collection and processing of data.
Concerning sampling errors, estimates of variability can be determined and used in analyzing survey data. In the summary findings for 1987, comparisons passed a hypothesis test at the 0.10 level of statistical significance (the 9096 "confidence level") or better. In fact, most comparisons passed the test at the 0.05 level (or the 9596 confidence level). Thus, for most comparisons cited, the estimated difference between values being examined was greater than twice the standard error of the difference. Statements of comparison qualified by the expression "some evidence" denote that the estimated difference between values being examined was within the range of 1.6 and 2.0 standard errors--statistically significant at the 0.10 level, but not at the 0.05 level (or a confidence level between 90 and 9596).
Since its inception in 1972, the National Crime Survey has been conducted for the Bureau of Justice Statistics (formerly the National Criminal Justice Information and Statistics Service of the Law Enforcement Assistance Administration) by the Bureau of the Census.
Criminal Victimization in the United States, 1987 iii

Subject and table numbers
General crime statistics Number of victimizations, 1 Victimization rates, 2* Ratio of victimizations to incidents,
52
Victim characteristics Sex, 3*, 5*, 7*, 10*, 12*, 13*, 18*,
35-37, 68, 70, 71, 77-79, 93, 94 Age, 4*,5*,9*, 10*,35,42,49,68,
71,77,78,97,98 Race, 6*, 7*, 9*, 10*, 15*, 16*,
18*, 36, 38, 43, 44, 50, 68, 70, 71, 73-79, 82-84, 87, 91, 93, 95, 104
Ethnicity, 8*, 93, 96 Marital status, 11*, 12*, 37 Relationship to household head, 13* Educational attainment, 16* Annual family income, 14*, 15*, 38,
71, 76, 105 Locality of residence, 17 *, 18 * Region, 19*
Crime characteristics Time of occurrence, 55-57 Place of occurrence, 58-63 Number of victims**, 53 Number of offenders**, 64 Weapon use**, 56, 59, 65, 66 Self-protection *"', 67~70 Physical injury", 71, 74-78 Medical expenses**, 73-75 Medical insurance coverage * *, 76 Medical care**, 72, 77-79 Value of theft loss, 63, 82, 83, 85,
101, 109 E<!onomic loss (includes property
damage), 80-82 Property recovery, 84 Days lost from work, 86-91
Offender characteristics* * Victim-offender relationship, 34*,
35-38, 45, 51, 54, 57, 60, 61, 64-57, 71, 73-75, 77-79, 81, 88, 90, 94-96, 98, 106
Age of single offender, 40, 42 Race of single offender, 41, 43, 44 Sex of single offender, 39 Age or multiple offenders, 47, 49 Race of multiple offenders, 48, 50 Sex of multiple offenders, 46
Household characteristics Race of head, 20*, 22*, 25*-27*,
29*,32*,99,107 Ethnicity of head, 21 * Age of head, 22*, 23* Sex of head, 13 * Family income, 24*-27*, 100, 108 Number of persons in household, 28* Tenure, 22*, 29*: 99 Number of units in structure, 30* Locality of residence, 31 *,32* Region, 33*
Reporting to police Whether reported, 92-101 Reasons for reporting, 102 Reasons not reported, 103-109
Type of crime Crimes of violence, 1, 2*-19*, 34*,
35-55, 57, 58, 60, 61, 64-70, 72-82, 86-98, 102-104, 106
Rape, 1, 2*-9*, 11*-19*,34*,35-41, 43-48,51-55,57,58,60,61,64-69, 72, 80, 81, 86-89, 92, 94-97, 102-104, 106
Robbery, 1, 2*-9*, 11*-19*, 34*, 35-51, 64-69, 71-75, 77-84, 86-89, 92, 94-97, 102-104, 106
Assa.ult, 1, 2*-9*, 1.1*-19*, 34*, 35-61, 64-69, 71-75, 77-82, 86-89, 92, 94-97, 102-104, 106
Crimes of theft, 1, 2*-19*, 52, 55, 80,82-84,86,87',89,91-97,102-105
Personal larceny with contact, 1, 2*-9*,11*-19*,52,55,58,80,82,84, 86, 87, 89, 92, 94-97, 102-104
Personal larceny without contact, 1, 2*-9*, 11 *-19*, 52, 55, 62, 63, 80, 82, 84, 86, 87, 89, 92, 94-97, 102-104
Household crimes, 1, 2*, 20*, 21*, 23*,24*,28*-33*,55,80,82,84-87,89,91,92,99-103,107-109
Burglary, 1, 2*, 20*, 21*, 23*-25*, 28*-33*,55, 80, 82, 84-87, 89, 91, 92,99-103, 10'{, 109
Household larceny, 1, 2*, 20*, 21*, 23*,24*,26*,28*-32*,55,62, 63, 80, 82, 84-87, 89, 91, 92, 99-103, 107, 109
Motor vehicle theft, 1,2*,20*-24*, 27*-33*, 55, 58, 80, 82, 84-87, 89, 91,92,99-103,107,109
*Victimization rate table--all others are counts or percents. * * Personal crt mes of violence only.
Iv Criminal Victimization in the United States, 1987

Contents
Preface, iii
Subject and table numbers, iv
Introduction, 1 NCB-measured crimes, 1 Crimes not measured, 1 Classifying the crimes, 1 Victimizations vs. incidents, 1 Series victimizations, 1 Locality of residence, 2 Region, 2 Changes in NCS questionnaire, 2
Summary findings, 2
Characteristics of personal crime victims, 3
Sex, age, race, and ethniclty, 3 Marital status, 3 Household composition, 3 Educational attainment, 3 Locality of residence, 3 Region, 4
Characteristics of household crime victims, 5
Sex, age, race, and ethnicity, 5 Annual family income, 5 Household size and tenure, 5 Locality of residence, 5 Region, 6
Victim-offender relationships, 6
Offender characteristics in personal crimes of violence, 7
Crime characteristics, 7 Time of occurrence, 7 Place of occurrence, 7 Number of offenders, 8 Use of weapons, 8 Victim self-protection, 8 Physical !njury to victims of
personal crimes of violence, 8 Economic loss, 9 Time lost from work, 9
Reporting crimes to the police, 10 Rates of reporting, 10 Reasons for reporting and not
reporting, 10
Appendixes
I. Survey data tables, 11 II. Survey instruments, 97
III. Survey methodology and standard errors, 119
Data collection, 119 Sample design and size, 119 Estimation procedure, 120 Series victimizations, 121 Reliability of estimates, 123 Computation and
application of standard errors, 123
IV. Survey estimate of the economic cost of crime to victims, 125
Glossary, 126
Criminal Victimization in the United States, 1987 v
Introduction
The National Crlme Survey (NCS) provides data on many crimes of major interest to the general public and the criminal justice community. The NCS does not and cannot measure all criminal activity; many crimes are difficult to examine in general population surveys.
NC8-measured crimes
Victimization surveys like the NCS have proved most successful in measuring crimes with specific victims who understand what happened to them and how it happened and are willing to report what they know. Such surveys have been shown to be most applicable to rape, robbery, assault, burglary, personal and household larceny, and motor vehicle theft--crimes measured by the NCS.
The NCS includes offenses reported to the police as well as those not reported. Details about the crimes come directly from the victims, and no attempt is made to validate the information against police records or any other source.
Crimes not measured
Murder and kidnaping are not covered. Commercial burglary and commercial robbery were dropped from the program in 1977, largely for economic reasons. The so-called victimless crimes, such as drunkenness, drug abuse, and prostitution, also are excluded, as are crimes for which it is difficult to identify know ledgeable respondents.
Crimes of which the victim may not be aware also cannot be measured effectively. Buying stolen property may fall into this category, as may some instances of fraud and embezzlement. Attempted crimes of many types probably are under-recorded for this reason.
Events in which the victim has shown willingness to participate in illegal activity also are excluded. Examples of these include gambling, various types of swindles, con games, and blackmail.
Classifying the crimes
In any encounter involving a personal crime, more than one criminal act can be committed against an individual. A rape may be associated with a robbery, for example.
In classifying the survey-measured crimes each criminal incident has been counted only once, by the most serious act that took place during the incident, ranked in accordance with the seriousness classification system used by the Federal Bureau of Investigation.
The descending order of seriousness for crimes against persons is rape, robbery, assault, and larceny. If a person is both robBed and assaulted, the event is classified as robbery; if the victim suffers physical harm, the crime is categorized as robbery with injury. Personal crimes of contact take precedence over household offenses; among the latter, burglary is the most serious and larceny the least serious.
Victimizations vs. incidents
Certain negative events, such as an automobile accident, can cause human suffering (or even death) to more than one person simultaneously. So it is with some crimes. For example, two or more individuals may be victimized together during a single personal robbery. In other words, a single robbery incident can result in the victimization of more than one individual. As used in this report, the statistical difference between the two concepts applies to crimes in the personal sector, but not to those in the household sector, because each criminal act against a household is assumed to involve only one victim--the affected household as a unit.
A victimization, the basic measure of the occurrence of crime, is a specific criminal act because it affects a single victim. The number of victimizations is determined by the number of victims of such acts. Victimization counts serve as key elements in computing rates of victimization, as described in the victim characteristics sections of
this report. Victimizations also are used in developing a variety of information on crime characteristics and on the effects of crime on victims: victim injury and medical care, economic losses, time lost from work, victim self-protection, and reporting to police. For violent personal crimes, offender characteristics also are measured by victimizations.
An incident is a specific criminal act involving one or more victims. The number of incidents of personal crime is lower than that of victimizations because some crimes are simultaneously committed against more than one individual.
Incident figures are used in describing the settings and circumstances in which crimes occurred, including the time and place of occurrence, number of victims and offenders, and use of weapons.
Series victimizations
Three or more similar but separate criminal events, which the respondent is unable separately to describe in detail to an NCS interviewer, are known as series victimizations. Prior to 1979, series victimizations were recorded by the season of O(3currence and tabulated by the quarter of the year in which the data were collected. For those and other reasons it was not possible to tabulate series and regular (nonseries) crimes together.
The question about series crimes was one of several items changed in the NCS questionnaire beginning in January 1979. This revision enabled the matching of reference periods and assessment of the effects of combining series crimes with regular crimes. Such an examination was a special featu~e of the initial release of 1980 df.\€a.
Currently, summary data on series crimes are presented separately in the NCS annual reports in Appendix III.
2See Criminal Victimization In the United States: 1979-80 Changes, 1973-80 Trends, BJS Technical Report, NCJ-80838, July 1982.
Criminal Victimization in the United States. 1987 1

Introduction
Locality of lresidence
As IlSed in the NCSs data on the locality of residence pertain to the places. where people lived at the time o:f the interview, not to the place where victimization occurrM. Basic dlistinctions are made among central. city, suburban, and nonmetropolitlan populations. Together, the first two populations represent those persons living in Metropoittan Statistical Areas (MSA's), as defined in the glossary. The nonmetropolitan population Irefers to those residing ill places outside MSA's. To further distinguish differences in the degree of victimization within metropolitan localities, residents of central cities and their surrounding suburbs have been categorized according to the following four ranges of central city size: 50,000 to 1/4 million, 1/4 to 1/2 million, 1/2 to 1 million, and 1 million or more. Geographica! areas were assigned to the appropriate type-of-locality category on the basis of the 1980 census.
Region
For the first time in the history of the NCS, criminal victimization data are presented in this report by regions of the country. As in locality of residence, data on region pertain to the area where people lived at the' time of the interview, not to the area where the victimization occurred. The Nation's four regions are defined by the Census Bureau as Midwest, Northeast, South, and West. The specific States that fall under each region are listed in the glossary.
Changes in the N CS questionnaire
Beginning in July 1986 several changes in the N CS questionnaire were implemented. Some of the answer categories in this new NCS form had to be consolidatad to comply with the existing questionnaire format to ensure compatibility with previous years. As a direct result of these changes, in some instances there are significant propor'tional changes in certain categories within tables when compared to the years prior to 1986.
:2 Criminal Victimization in. the United States, 1987
Summary findings
The statements that follow are illustrative of the information that readers can draw from this report's data tables. As a guide to readers, table source citations are in parentheses after each finding. • The National CrIme Survey (NCS) determined that rm estimated 34.7 million crimes, in~luc1ing both completed and attempted offenses, were committed against individuals or households across the United States in 1987 (table 1). • Approximately 37% of all violent crime victimizations reported to the NCS were for completed offenses. For personal crimes of theft, 9496 of the reported victimizations were for completed offenses, whe:.oeas 8496 of the re(1)rted household crimes were for completed offenses (table 1). • Rape, personal robbery, and assault--the most serious crimes measured by the NCS because they Involve confrontation between victim and offender and the threat or act of violence-made up 1696 of the victimizations reported to the NCS (table 1). • The less serious types of offenses, namely personal and household larcenies, accounted for 6396 of all victimizations that occurred in 1987. Housahold burglaries and motor vehicle thefts accounted for 2096 of the victimizations (table 1). • Violent crime rates were generally lower than property crime rates in 1987. The rate for all three violent crimes--rape, robbery, and assault-was 29 per 1,000 population age 12 or older. By contrast, the overall rate for personal crimes of theft was 68 per 1,000 (table 2).

Characteristics of personal crime victims
Victimization rates are basic mea.<lures of the occurrence of crime, computed by dividing the number of victimizations associated with a specific crime, or grouping of crimes, by the number of persons under consideration. For crimes against persons, the rates are based on the total number of individuals age 12 or older or on a portion of that population sharing a particular characteristic or set of traits. Over the years, the NCS has demonstrated that persons within certain population groups are victimized to a greater extent than others. Victimization !.'ates for personal crimes of violence tend to be relatively higher for males, blacks, the poor, younger persons, and single persons (those separated or divorced as well as those never married). For personal crimes of theft, males, whites, younger peraons, single persons, and the more affluent have higher '~ictimization rates.
Sex, age, race, and ethnicity
.. Overall, violent crime rates in 1987 were approximately 6896 higher for males than for females. Males also had higher victimization rates for crimes of theft (table 3). It Younger persons age 12 to 24 had the highest victimization rates for crimes of violence and crimes of theft, For victims age 25 or older both violent and theft crime rates decreased as age increased. Elderly persons (age 65 or oldel') had the lowest victimization rates for both violent and theft crimes (table 4). • Blacks were victims of violent crimes at a higher rate than whites or members of other minority groups (Asians, Pacific Islanders, Native Americans, and so forth, considered collectively). The rates for whites did not differ significantly from the rates for other minority groups (table 6). • Whites were victims of personal theft at a somewhat higher rate than blacks. There were no significant differences in theft victimization rates between either whites or blacks and other minorities (table 6). • Joint consideration of race and sex indicated that black males had the highest rate of violent crime victimization and white females had the lowest. For crimes of theft there
were no significant differences in victimization rates between white and black males. White femp-Ies were victimized more often than black females in crimes of theft (table 7). • Hispanics wer.e victimized by violent crimes more often than nonHispanics, whereas non-Hispanics experienced crimes of theft more often than Hispanics (table 8).
Marital status
• The overall victimization rate for violent crimes was highest for persons never married; widowed persons had the lowest rates. Persons divorced or separated had a higher violent crime victimization rate than married persons (table 11). • When gender WllS examined in conjunction with marital status, the general relationships regarding victimization rates and marital status were somewhat altered. The highest violent crime victimization rate among males was for those males who had never married, whereas among females the highest violent crime victimization rate was experienced by divorced or separated females (table 12). • As in crimes of violence, those who were never married, whether male or female, had the highest rate in personal theft victimization; widowed persons again had the lowest rate (table 12).
Household composition
• Examination of the relationship between victimization rates and the victim's relationship to the head of household disclosed that in households headed by males, persons unrelated to the household head had the highest overall victimization rate for violent crimes. Wives of the male heads of household had the lowest rate (table 13). • In households headed by females, children under 18 and nonrelativetl had the tlighest victimization rates for crimes of violence. Husbands of female heads of household and women living alone had the lowest rates (table 13). • Victimization rates for crimes of theft followed a similar pattern as those pates for crimes of violence.
. In households headed by males, persons unrelated to the household head again had the highest victimization rate for crimes of theft. Wives, other relatives, and male household heads living with others had the lowest theft victimization rates (table 13) .. • In households headed by females, persons unrelated to the household head had tl~~, highest theft victimization ratl..5. Other relatives, husbands of the female household heads, and women living alone had the lowest theft victimization rates (table 13).
Educational attainment
Victimization rates for personal crimes were calculated on the basis of years of school completed for the population age 12 or older. • Persons with either the least (0-4 ye81's of elementary) and the most (4 or more years of college) amount of education had the lowest violent crime victimization rate; otherwise, there were no discernible patterns in the rates of violent crime victimization across the various levels of educational attainment (table 16). • For crimes of theft, pei'sons with at least some college education had higher rates of victimization than individuals with lower educational attainment. Persons with the least amount of education had the lowest theft victimization rate. This relationship may exist in part beca.use education is positively associated with income levels and persons in the highest income bracket had higher theft victimization rates than persons with lower income levels, even though not all the differences in other income levels were significant (tables 14, 16).
Loeality of residence
(I For both violent and personal theft crimes, the rate of victimization was greatest for central city re!'idents, compared with persons living in suburban areas or non metropolitan environs, that is, rural and semirural areas. Within each of the four size categories of metropolitan areas, the residents of central cities had higher victimization rates than those persons residing in the respective suburban areas (table 17).
Criminal Victimization in the United States, 1987 3

Characteristics of personal crime victims
• For personal crimes of violence, the rate of victimization was highest among residents in urban areas, but the rate differences were not significant between the residents in suburban and rural areas. The rate amDng clty residents was 40 victimizations per 1,000, considerably higher than that for suburbanites (23) or rural residents (25) (table 17). • Overall, the robbery victimization rates were higher in the central cities than their respective suburbs except in the smallest metropolitan areas where no urban-suburban difference existed (table 17). • The assault victimizations were higher in central. cities than their respective suburbs except in the largest metropolitan areas where no locality difference existed (table 17). • Suburbanites had a higher personal theft victimization rate than rural residents but a lower rate than that for city dwellers. The victimization rate for personal crimes of theft for city dwellers was 80 crimes per 1,000, compared to 70 per 1,000 and 50 per 1,000 for suburbanites and rural residents, respectively (table 17). • Examination of race and sex variables with locality of residence revealed certain interesting rate differences. Compared with white females, white males had higher violent crime victimization rates, regardless of whether they lived in central cities, suburbs, or rural areas, but that was not the case among blacks; while the violent crime rates for black males living in central cities and suburbs exceeded that for black females, such rates were not significantly different fol' residents of rural areas (table 18). • Only in urban areas was the rate for violent crimes somewhat higher for black males than for white males. The violent crime rates for females did not differ at all in respect to the locality of residence (table 18). • White females had a higher personal theft victimization rate than black females living in central cities; there were no differences between white males and black males in personal theft victimization in all areas. White males had higher personal theft victimization rates than white females in all areas, whereas only in central cities was the rate for per-
sonal theft victimization higher for black males than for black females (table 18).
Region
• In both crimes of violence and personal theft, inhabitants of the West had the highest victimization rates, and those residing in the Northeast had the lowest. People in the Midwest had higher rates than those in the South (table 19). • Southerners had lower victimization rates in robbery and personal larceny with contact than those in the Northeast or the West. Assault and noncontact personal larceny in the four regions followed a pattern similar to that of crimes of violence. People in the Midwest had somewhat lower victimization rates in personal larceny with contact than those in the Northeast (table 19).
4 Criminal Victimization in the United States, 1987

Characteristics of household crime victims
Household crimes are regarded as being directed against the household as a unit rather than against individual members. In calculating a tate, therefore, the number of victimizations associated wi th a specific crime is divided by the number of households in question. Crimes against household property happened to a greater extent to Hispanic rather than non-Hispanic heads of household, black heads of household, renters, large households, and younger heads of household.
Sex, age, race, and ethnicity
e Households headed by blacks had higher victimization rates for all three major household crimes than households headed by whites or members of other minority groups. Rates of households headed by whites and members of other minority groups did not differ significantly from each other (table 20). • Hispanic heads of household had higher victimization rates than nonHispanics for total household crimes as well as individually for burglary, household larceny, and motor vehicle theft (table 21). • Based on the number of vehicles owned, white heads of household were victims of motor vehicle theft at a lower rate than blacks or members of other minority groups. The rate difference was not significant between blacks and members of other minority groups (table 22). • Total household crime victimization rates were highest for the youngest group of heads of household but decreased as age increased; this pattern is also shown in each of three major household crimes (table 23).
Annual family income
• Overall, household crime rates were fairly evenly distributed across all income categories, with one exception. Households with family incomes less than $7,500 had higher rates in total household crimes, especially in burglary, than the households with family incomes of $10,000 or more (table 24). • Households with higher family incomes ($30,000 or more) tended to experience higher rates of motor vehicle theft victimization than
-households with lower family incomes, although not all differences between the other income categories were statistically significant (table 24). • The rate of victimization for burglary was generally highel' for black households than for white households regardless of annual family incorn~; not all differences, however, were statistically significant (table 25). • Low-income (less than $15,000) black households generally had higher household larceny victimization rates than low-income white households; however, as househQld income increased, rates between the two r9,ces did not differ significantly (table 26). • In motor vehicle theft, black households with household income over $30,000 had higher rates than white households in those high-income cat",'.~ories. Rates for white and black households did not differ in other income categories (table 27).
Household size and tenure
• Household victimization rates increased as the size of the household increased. Persons living in households with six or more persons experienced the highest total household victimization rate, compared with individuals in smaller households (table 28). • All homeowners in general, and white homeowners in particular, had lower rates for all three major household crimes than renters (table 29). • There were no significant differences in household larceny or motor vehicle theft victimization rates between black renters and black owners. Black owners, however, had a lower rate of burglary victimization than black renters. White owners had a lower rate of victimizations for burglary, household larceny, and motor vehicle theft than white renters (table 29). • Black renters had a higher ra te of burglary victimization than white renters. There were no differences in household larceny or motor vehicle theft victimization rates between black and white renters (table 29). • White homeowners had lower victimization rates for all three major household crimes than black homeowners (table 29).
Localit-y of residence
• As was the case In personal crimes, in all four size categories of metropolitan areas, central city householders had higher rates of household crimes than the householders in their respective suburbs. Nonmetropolitan householders had the lowest rate of all. Within the four size categories of metropolitan areas, the household crime victimization rate was lowest in the suburban portion of the smallest metropolitan area.s (population 50,000 to 249,999) (table 31). • For household burglary, central city residents had higher victimization rates than suburban or rural area residents; no such difference was shown between suburban and rural residents. Within each of the four size categories of metropolitan areas, the household burglary rates were uniformly higher in the central cities than in their respective suburbs. Regardless of the size of metropolitan areas, burglary victimization rates among the four categories of central cities as well as among the four categories of suburbs did not differ from one another (table 31). • The household larceny victimization rate for urban residents of the largest metropolitan areas (population one mUlion or more) fell significantly below those for urban residents of the three smaller categories of metropolitan areas (table 31). • The residents of central cities in the smallest metropolitan areas had the lowest motor vehicle theft rate among the central cities in the four categories of metropolitan areas. Suburban residents in smaller metropolitan areas (population less than 500,000) had a lower motor vehicle theft rate than suburban residents in larger metropolitan areas. The motor vehicle theft rate in the rural areas was about a fourth of thai. in the central cities of the largest metropolitan areas (table 31). • Both white and black households in central cities had the highest household crime victimization rates. White households in suburbs had higher rates than white households in rural areas, whereas significant differences did not exist between black households in suburban and rural areas (table 32).
Criminal Victimization in the United States, 1987 5
Characteristics of household crime victims
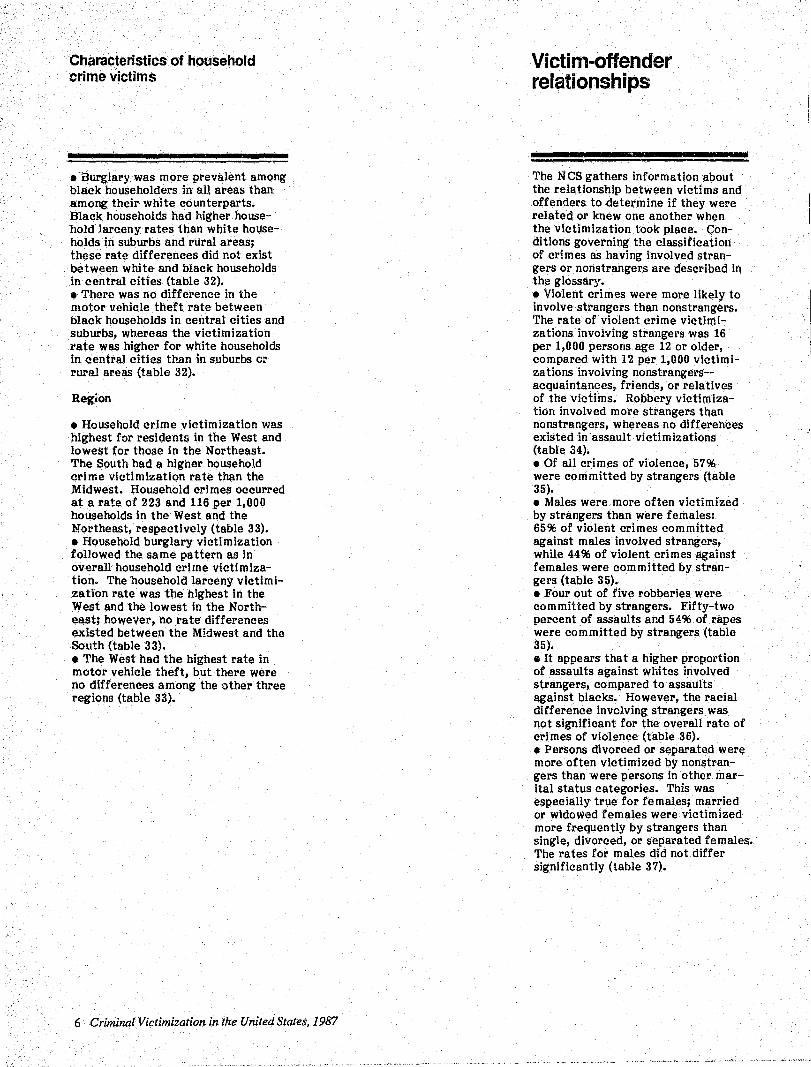
•. Burglary was more prevalent among black householders in all areas than among their white counterparts. Black hoUseholds had higher household larceny rates than white househoids in suburbs and rural areas; these rate differences did not exist between white and black households in central cities (table 32). • There was no difference in the motor vehicle theft rate between black households in central cities and suburbs, whereas the victimization rate was higher for white households in centraJ cities than in suburbs or rural areas (table 32).
Region
• Household crime victimization was highest for residents in the West and lowest for those in the Northeast. The South had a higher household crime victimization rate than the Midwest. Household cri mes occurred at a rate of 223 and 116 per 1,000 households in the West and the Northeast, respectively (table 33). • Household burglary victimization followed the same pattern as in overall household crime victimization. The. household larceny victimization rate was the highest in the West and the lowest in the Northeast; however, no rate differences existed between the M!dwest and the South (table 33). • The West had the highest rate in motor vehicle theft, but there were no differences among the other three regions (table 33).
6 Criminal Victimization. in. the United States,1987
Victim;.offender relationships
-The NCS gathers information about the relationship between victims and offenders to determine if they were related or knew one another when the victimization took place. Conditions governing the classification of crimes as having involved strangers or nonstrangers are described in the glossary. • Violent crimes were more likely to involve strangers than nonstrangers. The rate of violent crime victimizations involving strangers was 16 per 1,000 persons age 12 or older, compared with 12 per 1,000 victimiza tions involving nonstrangers-acquaintances, friends, or relatives of the victims. Robbery victimization involved more strangers than nonstrangers, whereas no differences existed in assault victimizations (table 34). • Of all crimes of violence, 57% were committed by strangers (table 35). • Males were more often victimized by strangers than were females: 65% of violent crimes committed against males involved strangers, while 44% of violent crimes against females were committed by strangers (table 35). • Four out of five robberies were committed by strangers. Fifty-two percent of assaults and 54% of rapes were committed by strangers (table 35). • It appears that a higher proportion of .8ssaults against whites involved strangers, compared to assaults against blacks. However, the racial difference involving strangers was not significant for the overall rate of crimes of vioV.mce (table 36). • Persons divorced or separated were more often victimized by nonstrangel'S than were persons in other marital status categories. This was especially true for females; married or widowed females were victimized more frequently by strangers than single, divorced, or separated females. The rates for mal.es did not differ significantly (table 37).
Offender characteristics in personal crimes of violence
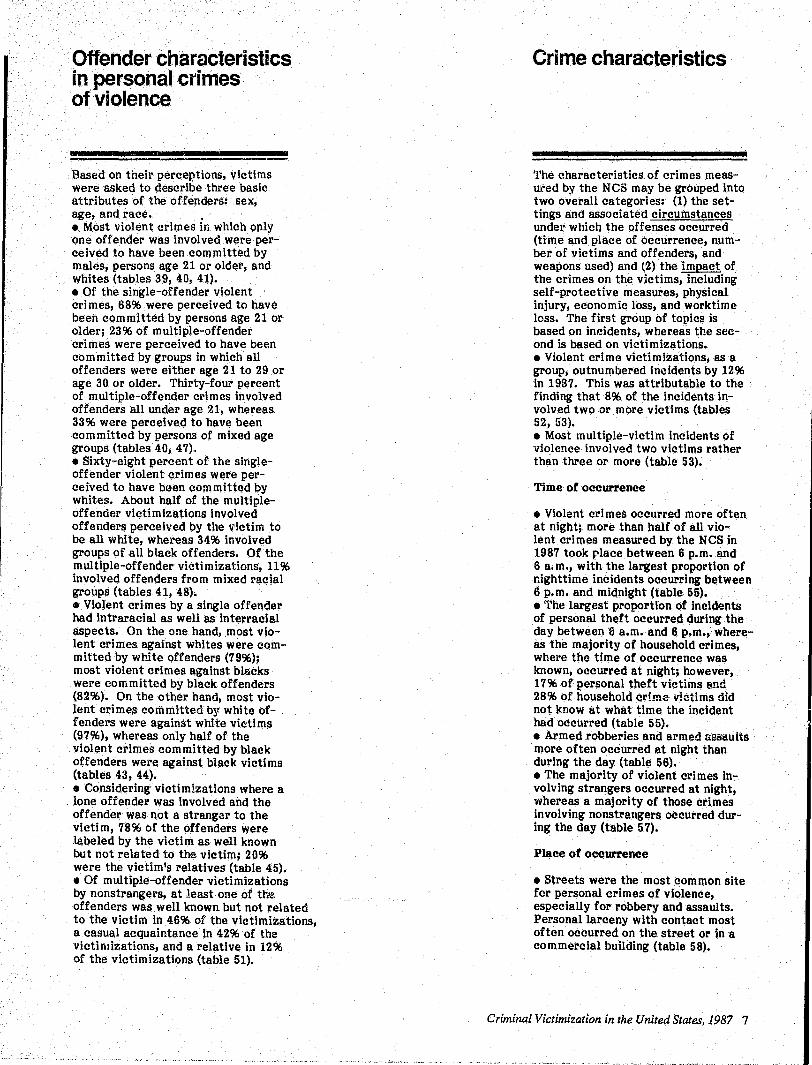
• Based on their perceptions, victims were asked to describe three basic attributes of the offenders: sex, age, and race. . • Most violent crimes in which only one offender was involved were perceived to have been committed by males, persons age 21 or older, and whites (tables 39, 40, 41). • Of the single-offender violent cri mes, 6896 were perceived to have been committed by persons age 21 or older; 2396 of multiple-offender crimes were perceived to have been committed by groups in which all offenders we.l'e either age 21 to 29 or age 30 or older. Thirty-four percent of multiple-offender crimes involved offenders all under age 21, whereas 3396 were perceived to have been committed by persons of mixed age groups (tables 40, 47). • Sixty-eight percent of the singleoffender violent crimes were perceived to have been Qommitted by whites. About half of the multipleoffender victimizations involved offenders perceived by the victim to be all white, whereas 3496 involved groups of all black offenders. Of the multiple-offender victimizations, 1196 involved offenders from mixed racial groups (tables 41, 48). . . • Violent crimes by a single offender had intraracial as well as interracial aspects. On the one hand, most violent crimes against whites were committed by white offenders (7996); most violent crimes against bl&cks were committed by black offenders (8296). On the other hand, most violent crimes committed by white offenders were against white victims (9796), whereas only half of the violent crimes committed by black offenders were against black victims (tables 43, 44). • Considering victimizations where a lone offender was involved and the offender was not a stranger to the victim, 7896 of the offenders were labeled by the victim as well known but not related to the victim; 2096 were the victim's relatives (table 45). • Of multiple-offender victimizations by nonstrangers, at least one of th>e. offenders was well known but not related to the victim in 4696 of the victimizations, a casual acquaintance in 4296 of the victinlizations, and a relative in 1296 of the victimizations (table 51).
Crime characteristics
The characteristics of crimes measill'ed by the NCS may be grouped into two overall categories: (1) the settings and associated circumstances under which the offenses occurred (time and place of occurrence, number of victims and offenders, and weapons used) and (2) the impact of the crimes on the victims, including self-protective measures, physical injury, economic loss, and worktime loss. The first group of topics is based on inf!idents, whereas the second is based on victimizations. • Violent crime victimizations, as a group, outnumbered ineidents by 1296 in 1987. This was attributable to the finding that 896 of the incidents involved two or more victims (tables 52, 53). • Most multiple-victim incidents of violence involved two victims rather than three or more (table 53).
Time of occurrence
• Violent crimes occurred more often at night; more than half of all violent crimes measured by the NCS in 1987 took place between 6 p.m. and 6 a"m., with the largest proportion of nighttime incidents occurring between 6 p.m. and midnight (table 55). • The largest proportion of incidents of personal theft occurred during the day between 6 a.m. and 6 p.m., whereas the majority of household crimes, where the time of occurrence was known, occurred at night; however, 1796 of personal theft vi!!tims 8!ld 2896 of householll ct'ime victims did not know at what time the incident had occurred (table 55). • Armed robberies and armed IlSStuH'ts more often occurred at night than during the day (table 56). • The majority of violent cri mes involving strangers occurred at night, whereas a majority of those crimes involving nonstrangers occurred during the day (table 57).
Place of occurrence
• Streets were the most common site for personal crimes of violence, especially for robbery and assaults. Personal larceny with contact most often occurred on the street or in a commercial building (table 58).
Criminal Victimization in the United States. 1987 7

Crime characteristics
• Armed and unarmed robberies as well as al'med assaults occurred most frequently on the street; unarmed assaults occurred most often on the street, inside the victim's home, on the victim's property, or on school property (table 59). • The greatest proportion of violent crimes involving strangers occurred on the street, whereas crimes involving nonstrangers occurred most frequently inside the victim's home or inside a building on the victim's property (table 60). • Of rape incidents involving nonstrangers, 5896 occurred inside the victim's home or on the victim's property, whereas 2596 of rape incidents involving strangers occurred at those places (table 60).
Number of offenders
• An estimated 76% of violent crime incidents were committed by a lone offender; 2196 involved two or more offenders (table 64). • The majority of rapes (93%) and assaults (8096) involved a single offender. The majority of robberies (57%) also involved a single offender, but to a lesser degree than the other two categories of violent crimes (table 64). • Crimes of violence committed by nonstrangers were more likely to have involved only one offender, compared with crimes of violence by strangers (table 64).
Use of weapons
a Approximately a third of violent crimes involved the presence or use of a weapon: 3096 of rapes, 31% of assaults, and 46% of robberies (table 65). • Weapons were present more fre,quently in stranger-to-stranger violel1t confrontations than in incidents involving o!Jnstrangers (table 65). • Of violent incidents committed by an armed offender, 25% involved a knife, 3796 involved a firearm, and 37% involved a weapon other than a firearm or knife (table 66). • Handguns were present in 30% of all vioh~nt crime incidents involving armed offenders and in 4 out of 5 of those incidents where a firearm was present (table 66).
• Firearms were pL'esent more frequently in stranger-to-stranger violent confrontations than in nonstranger incidents. There were no significant differences in the percentage of knives or other weapons in stranger versus nonstranger incidents (table 66).
Victim self-protection
e In approximately 7 out of 10 violent crime victimizations, victims took some self-protective measure, which included reasoning with the offender; fleeing from the offender; screaming or yelling for help; hitting, kicking, or scratching the offender; and using or brandishing a weapon (table 07). • Victims of rape were more likely
, to defend themselves than the victims of other violent crimes. Assault victims tried more often to defend themselves than robbery victims (table 67). • Victims of robbery by a nonstranger were more likely to defend themselves than victims of that crime by a stranger. No significant differences existed in the percentages of rape and assault between strangers and nonstrangers (table 67). • IIIl the incidents involving strangers it appears that when the victims took self-protective measures, the violent crimes were less likely to be completed; the percentage of the completed crimes was lower than attempted crimes when victims tried to defend themselves in stranger confrontations. However, this was not true in nonstranger confrontations (table 67). • White violent crime victims tried to defend themselves more often thnn black violent crime victims. No significant differences existed between male and female victims (table 68). • Violent crime victims age 50 or older and under age 20 were less likely to defend themselves than victims of other age categories (table 68). • Of victims who tried to defend themselves in a violent crime situation, the most common self-defense method employed was nonviolent resistance, including evasion. The use or brandishing of a weapon accounted for only 2% of the selfdefense methods employed (table 69).
8 Criminal Victimization in the United States, 1987
• Males more often than females USE\d the following self-protective measures: used or brandished weapons other than firearms or knives; used physical force; and threatened or reasoned with the offender. Females tried more often than males to get help or frighten offenders in order to protect themselves (table 70). • There was no difference in the choice of self-protection methods between whites and blacks except that blacks chose nonviolent resistance, including evasion, more often than whites (table 70).
Physical injury to victims of personal crimes of violence
• Approximately 31 % of all robbery and assault victims sustained physical injury (table 71). • Injury rates from the combined robbery and assault victimizations did not significantly differ for males and females. There were no differences in the injury rates between white and black victims for robberies and assaults combined (table 7]). • Assaults involving strangers were less likely to result in injury to the victim than crimes involving nonstrangers. No significant differences existed in robbery victimizations involving strangers and nonstrangers (table 71). • Of violent crime victims who received medical care, 29% received care at a hospital emergency room or emergency clinic; 3096 were cared for at home or at a neighbor's or friend's home; 16% received inpatient treatment at a hospital; 13% received care at a doctor's office or health clinic; and the remaining 12% received care at the scene, at a health unit or first-aid station at work, or from another source (table 72). • One out of ten violent crime victims incul'red mediaal expenses; of injured violent crime victims, 32% incurred medical expenses (tables 73, 74). • Only 13% of the medical expenses were below $50, with 21% between $50 and $249 and 31% more than $250. Thirty-five percent of the injured victims did not know the amount of their medical expenses (table 75).

• Sixty-seven percent of the injured violent crime victims had health insurance coverage or were eligible for public medical services. There was no evidence of fl difference in health coverage between the races (table 7S). • Of all violent crime victims, 796 received hospital care; of injured violent crime victims, 2396 received hospital care (tables 77, 78). • Forty-six percent of violent crime victims who received hospital treatment required inpatient care. Of the victims who received inpatient care, about half were hospitalized for less than 1 day (table 79).
Economic loss
• Ninety-seven percent of personal theft victimizations resulted in economic losses, which include both theft and damage losses. Nine out of ten household crimes resulted in economic losses, while only 2496 of violent crime victimizations resulted in economic losses (table 80). • Forty-two percent of all losses from personal crimes of theft and 3096 of losses from household crimes were valued at less than $50 per victimization; 1696 of personal crimes of theft and 2896 of household crimes resulted in losses of $250 or more (table 82). • Victims of motor vehicle theft were most likely to have recovered some of their theft losses. There was at least a partial recovery of theft losses in 72% of all motor vehicle thefts: About half of the victimizations resulted in a partial recovery of losses, while there was full recovery of losses in 2296 of the victimizations (table 34).
Time lost from work
• About 1096 of victims of violent crime lost time from work, compared with 496 of personal theft victims and 696 of household crime victims (table 86). • The victims of assault were less likely to lose time from work than the victims of robbery or rape (table 88).
• Of violent crime victims who lost time from work, 1996 were absent from work for less than 1 day, and half lost 1 to 5 days of work. Six percent lost 6 to 10 days of work, whereas 1896 lost 11 or more days from work as a result of their victimization (table 89).
Criminal Victimization in the United States, 1987 9

Reporting crimes to the police
The majority of crimes in 1987, as measured by the NCS, were not reported to the police. The NCS data permit an examination of reasons for reporting and not reporting crimes to the police as well as the characteristics of victims who did and did not report crimes.
Rates of reporting
• In 1987 only 3796 of all crimes were reported to the police. Almost h.'llf of all violent crime victimizatil)ns, 2896 of personal theft victimizations, and 4196 of household crimes were reported to the police (table 92). • The more serious or costly crimes were more likely to have been reported to the police. Violent crimes had the highest reporting rate, followed by household crimes and crimes of theft. Generally, completed crimes and victimizations resulting in injury were more likely to be reported than attempted crimes and those victimizations not resulting in injury (table 92). • The crimes most frequently reported to the police included completed motor vehicle thefts, forcible entry burglaries, completed robberies, and aggravated assaults. The most infrequently reported crimes were personal and household larcenies under $50. An 8996 reporting rate was associated with completed motor vehicle thefts, whereas less than 1596 of personal and household larceny victimizations under $50 were reported to the police (table 92). • Female victims reported violent crimes to the police at higher rates than male victims. There were no significant differences between the reporting rates for white and black victims and for Hispanic and nonHispanic victims (table 93). • Rates of reporting violent crimes to the police by victims of crimes by strangers were higher than by nonstrangers (table 94). • Teenage victims of personal crimes were least likely to report crimes to the police, compared with other age groups (table 97). • Among victims of household crimes, homeowners were more likely to report crimes to the police than renters (table 99).
• Frequency of reporting household crimes to the police tended to increase as the level of family income increased; the 110useholds with a family income of less than $10,000 had a lower reporting rate than the households in higher income categories. However, not all the differences among other income categories were statistically significant (table 100). • The greater the value of cash or property loss, the more likely the police were notified of a household crime (table 101).
Reasons for reporting and not reporting
• In 1987 the most frequently cited specific reasons for reporting a violent crime to the police were to keep the incident from happening again or to others and to intervene in the current incident (table 102). • For both personal theft and household crimes, the most frequent reason for reporting the offense to the police was the desire to recover property (table 102). • The most frequent specific reason given by victims fol' not reporting violent crimes to the police was that the event was a private or personal matter. The most common reason cited for not reporting personal theft or household crimes to the police was that the objects were recovered or the offender was unsuccessful (table 103). • Reasons for not reporting crimes to the police did not vary markedly for victims from different race or income groups (tables 104, 105, 107, 108). • Thirty-five percent of victims of a violent crime by a nonstranger did not call the police because they felt the crime was a private or personal matter, compared with 1596 of victims of that crime by a stranger (table 106). • The rate of nonreporting for incidents in which stolen objects were recovered or the offender was unsuccessful was higher for crimes involving strangers than nonstrangers. Fear of reprisal was greater in crimes by nonstrangers than in crimes by strangers (table 106).
10 Criminal Victimization in the United States, 1987
• Of household crime victims sustaining losses valued at less than $50, 46% did not report the crime to the police because the object was recovered or the offender was unsuccessful. Of victims with losses valued at $250 or more, the most frequently cited reasons for not reporting the offense to the police were lack of proof or "other" reasons. Of those who gave specific responses, that it was a private or personal matter was cited as the most frequent reason by victims with losses valued at more than $1,000 (table 109).

Appendix I Survey data tables
The 109 data tables in this appendix present results of the National Crime Survey for calendar 1987. They are grouped along topical lines, generally paralleling the summary findings.
All topics treated in the previous report, Criminal Victimization in the United States, 1986, are covered again. Labor force participation is again excluded in this report; however, a revised version of labor force participation is being planned and will be included in future reports. For the first time, criminal victimizations in the Nation's four regions-Northeast, South, Midwest, and West--are presented in this report for the crimes that occurred in 1987.
All data generated by the survey are estimates. They vary in their degree of reliability and are subject to variance, or sampling error, because they wel"e derived from a survey rather than a complete enumeration. Constraints on interpretation and other uses of the data, as well as guide,.lines for determining their reliability, are set forth in Appendix III. As a general rule, however, victimization (or incident) levels based on about 10 or fewer sample cases--representing weighted estimates of 16,000 or less-were not used for analytical purposes in this report. Although the estimated levels, rates, or percentages based on 10 or fewer sample cases are reliable estimates, such estimates, qualified by footnotes to the data bbles, may yield unreliable standard error estimates using the standard error formulas shown in Appendix III. Caution should therefore be used when comparing these estimates with other small estimates.
Victimization rate tables 3-33 display the size of each group for which a rate was computed. As with the rates, these control figures are estimates; independent population estimates derived from the 1980 census were used in generating the control figures.
Subjects covered by the data tables Ill'e described below. The list under each main subheading shows the number and title of each data table and the page on which it appears.
Criminal Victimization in the United States. 1987 11

General characteristics (Tables 1 and 2)
Table 1 displays the number and percent distribution of victimizations, whereas table 2 shows the rates of victimizatio'n. Each table covers all measured crimes, which are broken down into various subcategories.
Personal and household crimes Number and percent distribution of vlctlmlzatlons-
1 By sector and type of crime, 14
Victimization rates-2 By sector and type of crime, 15
Victim characteristics (Tables 3-33)
The tables contain victimization rate figures for crimes against persons (3-19) and households (20-33).
Personal crimes Victimization rates for persons age 12 and over-
3 By type of crime and sex of victims, 16 4 By type of crime and age of victims, 17 5 By sex and age of victims and
type of crime, 18 6 By type of crime and race of victims, 18 7 By type of crime and sex and
race of victims, 19 8 By type of crime and ethnlcity of victims, 20 9 By race and age of victims and
type of crime, 20 10 By race, sex, and age of victims and
type of crime, 22 11 By type of crime and marital status
of victims, 23 12 By sex and marital status of victims
and type of crime, 22 13 By sex of head of household, relationship
of victims to head, and type of crime, 24 14 By type of crime and annual family Income
of vicllms, 26 15 By race and annual family Income of vlcllms
and type of crime, 26 16 By level of educational attainment and race
of victims and type of crime, 28 17 By type of crime and type of locality
of residence of victims, 30 18 By type of [ocality of residence, race
and sex of victims, and type of crime, 32 19 By type of crime and region, 34
Household crimes Victimization rates, by type of crlme-
20 And race of head of household, 35 21 And ethnlcity of head of household, 35
Motor vehicle theft Victimization rates on the basis of thefts per 1,000 households and of thefts per 1,000 vehicles owned-
22 By selected household characterlslles, 36
Household crimes Victimization rates, by type of crime -
23 And age of head of household, 37 24 And annual family Income, 36
Household burglary Victimization rates-
25 By race of head of household, annual family Income, and type of burglary, 38
Household larceny Victimization rates-
26 By race of head of household, annual family Income, and type of larceny, 38
Motor vehicle theft Victimization rates-27 By race of head of household, annual family
Income, and type of theft, 39
Household crimes Victimization rates-
28 By type of crime and number of persons In household, 39
29 By type of crime, form of tenure, and race of head of household, 40
30 By type of crime and number of units In structure occupied by household, 41
31 By type of crime and type of locality of residence, 40
32 By type of locality of residence, race of head of household, and type of crime, 42
33 By type of crime and region, 42
Offender characteristics in personal crimes of violence (Tables 34-51)
Five tables (34-38) relate to the victimoffender relationship. The first is a rate table; the others are percentage distribution tables reflecting victim characteristics for stranger-to-stranger violent crimes. Of the remaining tables (39-51),6 present demographic information on the offenders only, and 7 others have such data on both victims and offenders; a basic distinction is made in these 13 tables between single-and multiple-offender victimizations.
Personal crimes of violence Number of victimizations and victimization rates for persons age 12 and over-34 By type of crime and vlctlm·offender
relationship, 43
Percent of victimizations Involving strangers -35 By sex and age of victims and
type of crime, 44 36 By sex and race of victims and
type of crime, 44 37 By sex and marital status of victims
and type of crime, 45 38 By race and annual family income of victims
and type of crime, 46
Percent distribution of single-offender vlctimlzatlons-
39 By type of crime and perceived sex of offender, 46
40 By type of crime and perceived age of offender, 47
41 By type of crime and perceived race of offender, 47
42 By type of crime, age of victims, and perceived age of offender, 48
43 Based on race of victims, by type of crime and perceived race of offender, 49
44 Based on perceived race of offender, by type of crime and race of victims, 50
45 By type of crime and detailed victim-offender relationship, 50
12 Criminal Victimization in the United States, 1987
Percent distribution of multiple-offender vlctimlzatlons-
46 By type of crime and perceived sex of offenders, 51
47 By type of crime and perceived age of offenders, 52
48 BY type of crime and perceived race of offenders, 52
49 By type of crime, age of victims, and perceived age of offenders, 53
50 By type of crime, race of Victims, and perceived race of offenders, 53
51 By type of crime and detailed victim-offender relal/onshlp, 54
Crime characteristics (Tables 52-91)
The first of these tables illustrates the distinction between victimizations and Incidents as the terms relate to crimes against persons. Table 53 displays data on the number of victims per incident, whereas table 54 gives incident levels for personal crimes of violence broken out by the victim-offender relationship. Topical areas covered by the remaining tables include: time of occurrence (55-57), place of occurrence (58-63), number of offenders (64), use of weapons (65-66), victim self-protection (67-70), physical injury to victims (71-79), economic losses (80-85), and time lost from work (86-91). As applicable, the tables cover crimes against persons or households. When the data were compatible in terms of subject matter and variable categories, both sectors were included in a table.
Personal crimes Number of Incidents and victimizations and ratio of Incidents to vlctlmlzatlons-
52 By type of crime, 54
Personal crimes of violence Percent distribution of Incidents -53 By victim-offender relationship, type
of crime, and number of victims, 55
Number and percent distribution of Incidents -54 By type of crime and victim-offender
relationship, 56
Personal and household crimes Percent distribution of Incidents -55 By type of crime and time of occurrence, 57
Personal robbery and assault by armed or unarmed offenders Percent distribution of Incidents -56 By type of crime and offender and lime
of occurrence, 58
Personal crimes of Violence Percent distribution of Incldents-
57 By victim-offender relationship, type of crime, and time of occurrence, 59
Selected personal and household crimes Percent distribution of Incidents -
58 By type of crime and place of occurrence, 58

Personal robbery and assault by armed or unarmed offenders Percent distribution of Incidents -
59 By type of crime and offender and place of occurrence, 60
Personal crimes 01 violence Percent distribution of Incldents-
60 By victim-offender relationship, type of crime, and place of occurrence, 60
Percent distribution between stranger and nonstranger Incidents within place of occurrence -
61 By type of crime, 60
Larcenies not InvolvIng vlctlm-offender contact Percent distribution of Incidents -62 By type of crime and place of occurrence, 62 63 By type of crime, place of OCC1.Jrrence,
and vaiue of theft loss, 62
Personal crimes of vlDlence Percent distribUtion of Incidents -64 By victim-offender relationship, type
of crime, and number of offenders, 63
Percent of Incidents In which offenders used weapons-
65 By type of crime and victim-offender relationship, 64
Percent dlstrlbutlon of types of weapons used In Incidents by armed offenders -
66 By victim-offender relationship, type of crime, and type of weapon, 64
Percent of victimizations In which victims took self-protective measures-
67 By type of crime and victim-offender relationship, 65
68 By characteristics of victims and type of crime, 65
Percent distribution of self-protective measures employed by vlctlms-
69 By type of measure and type of crime, 66 70 By selected characteristics of victims, 66
Personal robbery and assault Percent of victimizations In which Victims sustained physical Injury-
71 By selected characteristics of victims and type of crime, 67
Personal crimes 01 violence Percent distribution of victims receiving medical care-72 By type of crime and where care W9S
received, 68
Percent of victimizations In which victims Incurred medical expenses-
73 By selected characteristics of victims and type of crime, 68
Percent of vlctlmlzatiuns In which Injured victims Incurred medical expenses -
74 By selected characteristics of victims and type of crime, 68
Percent distribution of victlmlzations In which Injured victims Incurred medical expenses -75 By selected characteristics of victims,
type of crime, and amount of expenses, 69
Percent of victimizations In which Injured victims had hflalth Insurance coverage or were eligible for public medical services -76 By selected characteristics of vIctims, 69
Percent of victimizations In which victims received hospital care-77 By selected characteristics of vIctims
and type of crime, 70
Percent of victimizations In which Injured victims received hospital care-78 By selected characteristics of victims
and type of crime, 70
Percent distribution of victimizations In which Injured victims received hospital care-79 By selected characteristics of victims,
type of crime, and type of hospital care, 71
Personal and household crimes Percent of victimizations resUlting In economic loss-80 By type of crime and type of loss, 72
Personal crimes of vlohmce Percent of victimizations resulting In economic loss-
81 By type of crime, type of loss, and victimoffender relationshIp, 73
Personal and household crimes Percent distribution of victimizations resulting In economic los5-
82 By race of victims, type of crime, and value of/oss, 74
Selected personal crimes Percent distribution of victimizations resulting In theft loss-83 By race of victims, type of crime,
and value of loss, 76
Personal aud household crimes Percent distribution of victimizations resulting In theft loss-
84 By race of victims, type of crime, and proportion of loss recove;ad, 76
Household crImes Percent distribution of victimizations resulting In theft loss-
85 By value of loss and type of crime, T1
Personal and household crimes Percent of victimizations resulting In loss of time from work-
86 By type of crime, 77 87 By type of crime and race of victims, 77
Personal crimes of violence Percent of victimizations resulting In loss of time from work-
88 By type of crime and vIctim-offender relationship, 78
Personal and household crimes Percent distribution of victimizations resulting In loss of time from work-89 By type of crime and number of days lost, 78
Personal crimes of violence Percent dlstrlbullon of victimizations resulting In loss of time from work-
90 By number of days lost and victim-offender relationship, 79
Personal and household crImes Percent distribution of victimizations resulting In loss of time from work-
91 By race of victims, type of crime, and number of days lost, 79
Reporting of victimizations to the police (Tables 92-109)
Information is displayed on the extent of reasons for reporting and for failure to report. Certain tables display data on both personal and household crimes.
Personal and household crimes Percent distribution olvlctlmlzatlons -
92 By type of crime and whether or not reported to the police, 80
Personal crimes Percent of victimizations reported to the pOlice -
93 By selected characteristics of victims and type of crime, 81
94 By type of crime, Victim-offender relationship, and sex of victims, 81
95 By type of crime, victim-offender relationship, and race of Victims, 82
96 By type of crime, victim-offender relationship, and ethnicity of victims, 83
97 By type of crime and age of Victims, 84
Personal crimes of violence Percent of vlcllmlzatlons reported 10 the police -
98 By age or victims and victim-offender relationship, 84
Household crime .. Percent of vlcllmlzatlons reported to the police -
99 By type of crime, race of head of hOUsehold, and form of tenure, 85
100 By type of crime and annual family income, 85
101 By value of/oss and type of crime, 86
Personal and housahold crimes Percent dlslrlbutlon of reasons for reporting victimizations to the pollce-102 By type of crime, 86
Percent distribution of reasons for not reporting victimizations to the pollce-103 By type of crime, 88
Personal crimes Percent dl~lrlbutlon of reasons for not reporting victimizations to the pollce-104 By race of victims and type of crime, 90 105 By type of crime and annual famIly income,
92
Personal crimes of violence Percent distribution of reasons for not reporting victimizations to the pollce-106 By vicUm-offender relationship
and type of crime, 92
Household crimes Percent distribution of reasons for not reporting vlctlmlzallons to the pollce-107 By race of head of household
and type of crime, 94 108 By annual family Income, 95 109 By type of crime and value of Iheft loss, 94
Criminal Victimization in the United States, 1987 13

Table 1. Personal and hous.hold crlm •• , 1987
Number and percent distribution of victimizations, by sector and type of crime
sector and type of crine
All orilles
Personal aector
Crimes of violence
Completed Att;!mpted
Rape Completed Attempted
Robbery Completed
\lith injury From serious assault From minor assault
Without injury Attempted
With injury From serious assault From minor assault
Without injury
Assault Aggravated
Completed with injury Attempted with weapon
Simple Completed with iojury Attempted without weapon
Crimes of theft
Completed Attempted
Personal larceny with contact Purse snatohing
Completed Attempted
Pocket picking
Personal larceny without contact Completed
Less than $50 $50 or more Amount not available
Attempted
Total population age 12 and over
Household ~ctor
Completed Attempted
Burglary Completed
Forcible entry Unlawful entry without force
Attempted forcible entry
Household larceny Completed
Less the.:l $50 $50 or more Amount not available
Attempted
Motor vehiCle theft Completed Attempted
Total number of ho~seholds
Number
311,730,820
19,0011,560
5,660,570
2,085,950 3,574,620
140,900 64,800 76,v90
1,030,460 678,150 275,650 130,050 145,610 402,49U 352,310
97,090 44,730 52,370
255,220
4,489,220 1,543,150
480,800 1,062,350 2,946,070
862,200 2,083,860
13,343,980
12,509,770 834,210
508,690 184,940 121,"10 63,030
323,760
12,835,290 12,054,110 5,317,450 6,162,780
583,880 771,180
197,769,470
15,726,2:50
13,263,270 2,462,990
5,623,160 4,276,620 1,963,280 2,313,330 1,346,540
8,624,360 8,017 ,840 3,458,690 4,080,310
478,830 606,520
1,478,750 968,820 509,930
91,763,950
Percent of orimes within sector
100.0
29.8
11.0 18.8
.7 .3 .4
5.4 3.6 1.5
.7
.8 2.1 1.9
.5
.2 .3
1.3
23.6 8.1 2.5 5.6
15.5 4.5
11.0
70.2
65.8 4.4
2.7 1.0
.6
.3 1.7
57.5 63.5 28.0 32.4 3.1 4.1
100.0
84.3 15.7
35.8 27.2 12.5 14.7 8.6
54.8 51.0 22.0 25.9
3.0 3.9
9.4 6.2 3.2
NOTE: Detail may not add to total shown because of rounding. Percent distribution
based on unrounded figures. ••• Not applicable. ---------------------------------
14 Criminal Victimization in the United States, 1987
--,-,-,-",-' -'-' --'-------'----=-_ .• ~
Peroent of all crimes
100.0
511.7
16.3
6.0 10.3
.4
.2 .2
3.0 2.0 .8 .4 .4
1.2 1.0
.3
.1
.2 .7
12.9 4.4 1.4 3.1 8.5 2.5 6.0
38.4
36.0 2.11
1.5 .5 .4 .2 .9
37.0 34.7 15.3 17.7 1.7 2.2
115.3
38.2 7.1
16.2 12.3 5.7 6.7 3.9
24.8 23.1 10.0 11.7
1.4 1.7
4.3 2.8 1.5
J
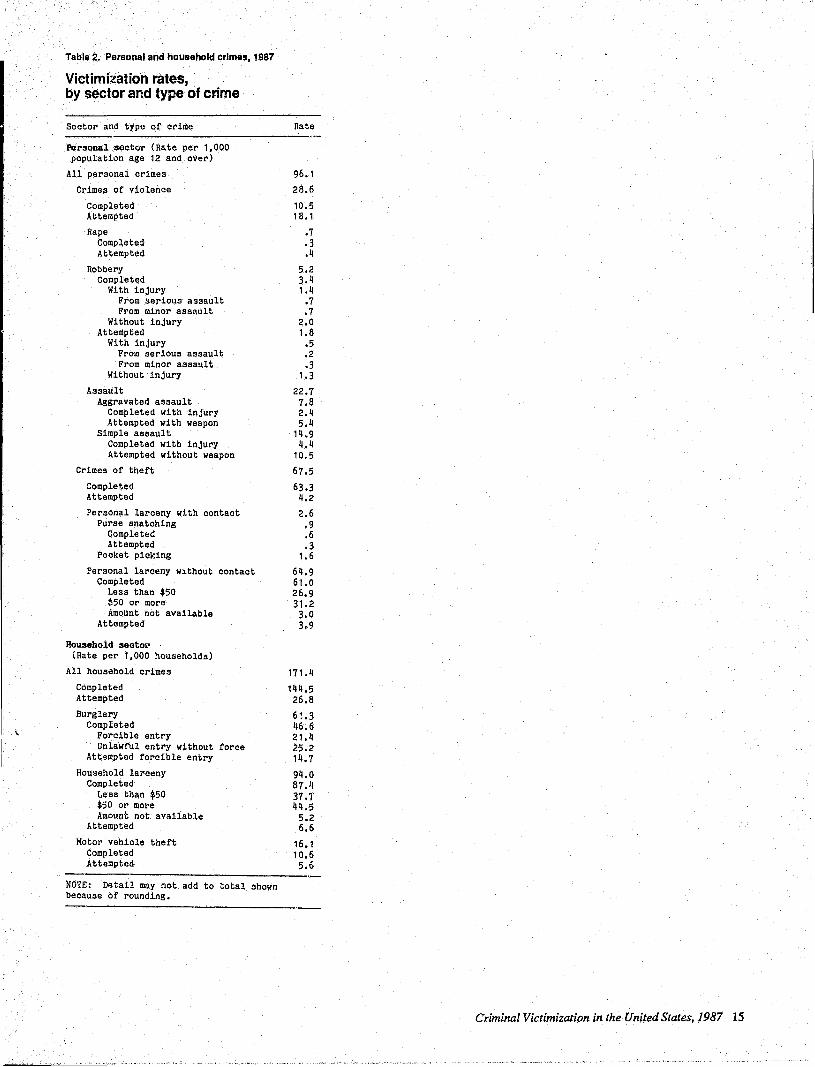
Table.2 •. Persohal and household crimes, 1987
ViCtimization rates, by sector and type of crime
Sector and type of crime
Personal sector (Rate per 1,000 population age 12 and over)
All personal crimes
Crimes of violence
Completed Attempted
Rape Completed Attempted
Robbery Completed
With injury From !lerious assault From minor assault
Without injury Attempted
With injury From serious assault From minor assault
Without injury
Assault Aggravated assault
Completed with injury Attempted with weapon
Simple assault Completed with injury Attempted without weapon
Crimes of theft
Completed Attempted
Personal larceny with contact Purse snatohing
Completed Attempted
Pocket picking
Rate
96.1 28.6
10.5 13.1
.7
.3
.4 5.2 3.4 1.4
.7
.7 2.0 1.8
.5
.2
.3 1.3
22.7 7.8 2.4 5.4
14.9 4.4
10,5
67.5
63.3 4.2 2.6
.9
.6
.3 1.6
Personal larceny without contact 64.9 Completed 61.0
Less than $50 26.9 t~o or more 31.2 AmOUnt not available 3.0
Attempted 3.9
Household secto~ (Rate per 1,000 households)
All household crimes
Completed Attempted
171.11
144.5 26.8
Burglary 6~.3 Completed 116.6
Forcible entry 21.11 Unlawful entry without force 25.2
Attempted forcible entry 14.7
Household la~ceny Completed
Less than $50 $50 or more Amount not available
Attempted
Motor vehicle theft Completed Attempted
NOTE: Detail may not add to ~otal shown because of rounding.
911.0 87.1, 37.1' 44.5
5.2 6.6
16.1 10.6 5.6
Criminal Victimization in the United States, 1987 15

Table 3. Personal crimes, 1987
Victimization rates for persons age 12 and over, by type of crime and sex of victims
(Rate per 1,000 population age 12 and over) Male Female Both sexes
(197,769,470) (94,959,780) (102,809,700)
Crt.es or Yiolence
Completed Attempted
Rape Completed Attempted
Robbery Completed
With injury From serious assault From minor assault
Without injury Attempted
With injury From serious assault From minor assault
Without injury
Assault Aggravated
Completed with injury Attempted with weapon
Simple assault Completed with injury Attempted without weapon
Crt.ea of theft
Completed Attempted
Personal larceny with oontact Purse snatching Pocket picking
Personal larceny without contact Completed
Less than $50 $50 or more Amount not available
Attempted
NOTE: Detail may not add to total shown because of rounding. Numbers in parentheses refer to population in the group.
-------------------------------28.6
10.5 18.1
.7
.3
.4 5.2 3.4 1.4 .7 .7
2.0 1.8 .5 .2 .3
1.3
22.7 7.8 2.4 5.4
14.9 4.4
10.5
67.5 63.3
11.2
2.6 .9
1.6
64.9 61.0 26.9 31.2 3.0 3.9
36.3
12.5 23.8
.1 a
.1a (z)1!.
6.6 4.0 1.8 1.1 .7
2.2 2.7
.6
.3 .3
2.1
29.5 11.4 3.7 7.8
18.1 4.8
13.3
'[2.0
67.1 4.9
2.2 (Z)a 2.1
69.8 64.9 26.8 35.5 2.6 4.9
Z: Less than .05 per 1,000. aEstimate is ba&ed on about 10 or fewer sample cases.
21.6
8.8 12.8
1.3 .6 .7
3.9 2.9 1.1
.3 .S
1.9 .9 .4 .1· .3 .5
16.4 4.4 1.3 3.1
12.0 4.0 8.0
63.3
59.7 3.6
2.9 1.8 1.2
60.3 57.4 27.0 27.1 3.3 2.9
16 Criminal Victimization in the United States, 1987
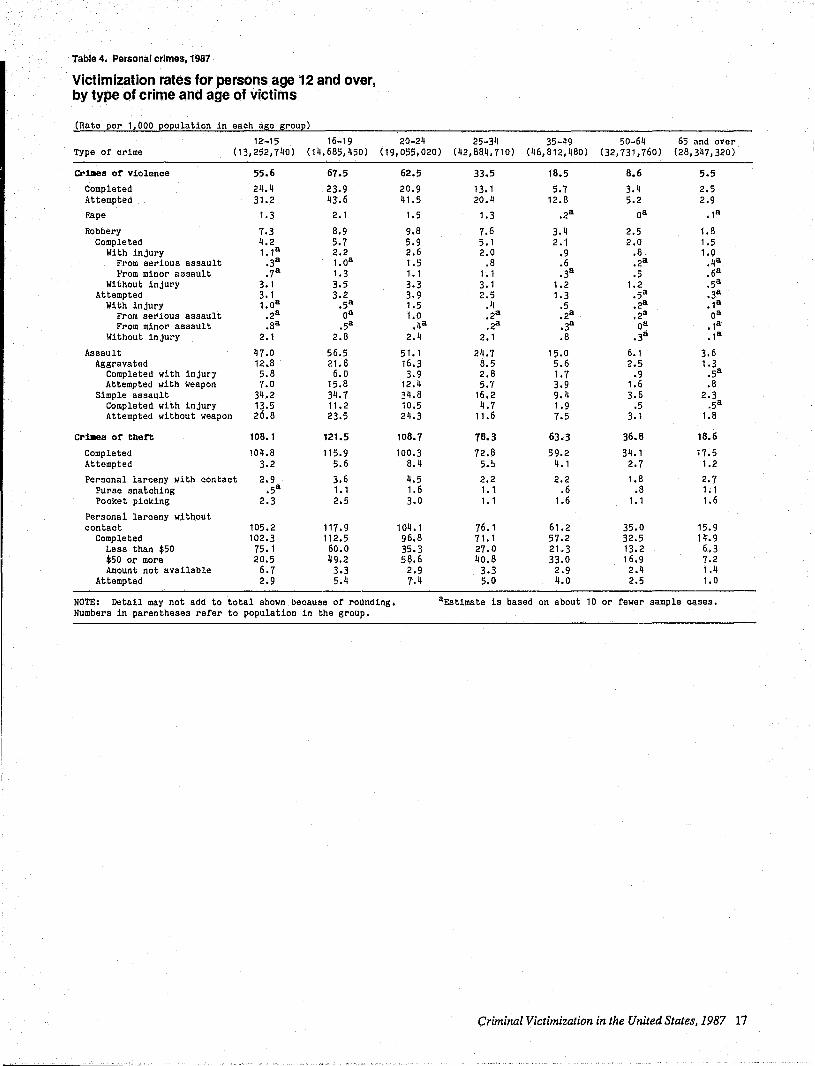
Table 4. Personal crImes, 1987
Victimization rates for persons age 12 and over, by type of crime and age of victims
(Rate per 1,000 population in each age group)
12-15 16-19 20-24 25-34 35-49 50-64 65 and over Type of crime (13,252,740) (14,685,450) (19,055,020) (42,884,710) (46,812,480) (32,731,760) (28,347,320)
CriDlels of violence 55.6 67.5 62.5 33.5 18.5 8.6 5.5 Completed 24.4 23.9 20.9 13.1 5.7 3.4 2.5 Attempted 31.2 43.6 41.5 20.4 12.8 5.2 2.9 Rape 1.3 2.1 1.5 1.3 .2a oa .1a
Robbery 7.3 8.9 9.8 7.6 3.4 2.5 1.8 Completed 4.2 5.7 5.9 5.1 2.1 2.0 1.5
With injury 1.1 a 2.2 2.6 2.0 .9 .8 1.0 From serious assault .3a 1.0a 1.5 .8 .6 .2a .4a From minor aasault .7a 1.3 1.1 1.1 .3a .5 .6a
Without injury 3.1 3.5 3.3 3.1 1.2 1.2 .5a Attempted 3.1 3.2 3.9 2.5 1.3 .5a .3a
With injury 1.0a .5a 1.5 .4 .5 .2a .1a From serious assault .2a 011 1.0 .2a .2a .2a Oa From minor assault .Sa .5a .4a .2a .3a 011 .1a
Without injury 2.1 2.8 2.4 2.1 .8 .3a .1a
Assault 47.0 56.5 51.1 24.7 15.0 6.1 3.6 Aggravated 12.8 21.8 16.3 8.5 5.6 2.5 1.3
Completed with injur'J 5.8 6.0 3.9 2.8 1.7 .9 .5a Attempted with weapon 7.0 15.8 12.4 5.7 3.9 1.6 .8
Simple assault 34.2 34.7 34.8 16.2 9.4 3.6 2.3 Completed with injury 13.5 11.2 10.5 4.7 1.9 .5 .5a Attempted without weapon 26.8 23.5 211.3 11.6 7.5 3.1 1.8
Crt.es of theft 108.1 121.5 108.7 78.3 63.3 36.8 18.6
Completed 104.8 115.9 100.3 72.8 59.2 34.1 17.5 Attempted 3.2 5.6 8.4 5.!> 4.1 2.7 1.2
Personal larceny with contaot 2.9 3.6 4.5 2.2 2.2 1.8 2.7 Purse snatching .5a 1.1 1.6 1.1 .6 .8 1.1 Pocket picking 2.3 2.5 3.0 1.1 1.6 1.1 1.6
Personal larceny without oontact 105.2 117.9 104.1 76.1 61.2 35.0 15.9
Completed 102.3 112.5 96.8 71.1 57.2 32.5 14.9 Less than $50 75.1 60.0 35.3 27.0 21.3 13.2 6.3 $50 or more 20.5 49.2 58.6 40.8 33.0 16.9 7.2 Amount not available 6.7 3.3 2.9 3.3 2.9 2.4 1.4
Attempted 2.9 5.4 7.4 5.0 4.0 2.5 1.0
NOTE: Detail may not add to total shown because of rounding. aEstimate is based on about 10 or fewer sample cases. Numbers in parentheses refer to population in the group.
Criminal Victimization in the United States, 1987 17

Table 6. Personal crimes, 1987
Victimization rates for persons age 12 and over, by type of crime and race of victims
(Rate per 1,000 pOEulation age 12 and over)
Cr~s or violence
Completed Attempted
Rape
Robbery Comple'ced
With injury From serious assault From minor assault
Without injury Attempted
With injul'y From serious assault From minor assault
Without injury
Assault Aggravated
Completed with injury Attempted with weapon
Simple Completed with injury Attempted without weapon
Cr1llll11 or then
Completed Attempted
Perao.nal laroeny with oontact Purse snatching Pocket picking
Personal laroeny without contact Completed
Less than $50 $50 or more Amount not available
Attempted
White (169,915,280)
27.3 9.8
17.5 .5
4.4 2.8 1.3
.6
.7 1.5 1.6 .4 .2 .2
1.2
22.3 7.2 2.3 4.9
15.1 4.4
10.7
68.2
64.0 4.2
2.3 .8
1.5
66.0 62.0 27.6 31.8 2.7 3.9
aEst1mate
Blaok
Table 5. Personal crimes, 1987
Victimization rates for persons age 12 and over, by sex and age of victims and type of crime
(Rate Eer 1,000 Eo~ulation in each a~e ~rou~) Crimes Completed Attempted of violent violent
Sex and age violenoe orimes orimes Rape
Male 12-15 (6,781,500) 68.4 32.8 35.6 .98
16-19 (7,390,980) 90.1 29.7 60.5 08
20-24 (9,322,410) 76.4 22.8 53.6 .28
25-34 (21,278,130) 39.7 13.6 26.2 .1 8
35-49 (22,932,150) 22.6 6.0 16.5 08
50-64 (15,496,620) 11.1 4.7 6.5 08
65 and over (11,757,990) 5.5 2.5 3.0 08
Female 12-15 (6,471,240) 42.1 1?6 26.5 1.78
16-19 (7,294,470) 44.6 18.0 26.6 4.2 20-24 (9,732,610) 49.1 19.2 29.9 2.8 25-34 (21,606,580) 27.5 12.6 14.8 '1.4 35-49 (23,880,320) 14.7 5.5 9.2 .38
50-64 (17,235,140) 6.3 2.3 4.0 08
65 and over (16,589,340) 5.4 2.5 2.9 .1 8
NOTE: Detail may not add to total shown beoause of rounding. Numbers in parentheses refer to population in the group.
Other (22,725,690) (5,128,510)
39.6 24.6
16.3 10.5 23.3 14.1
1.8 1.9a
11.8 3.08
8.3 2.3a 2.4 .88
1.1 .8a 1.3 08
6.0 1.5a 3.4 .68
1.4 08
.48 08
1.0 Oa 2.0 .68
26.1 19.7 12.0 8.9 3.5 3.1 8
8.6 5.8 14.0 10.9 3.9 3.7
10.1 7.2
62.9 62.4
58.4 59.8 4.5 2.7a
4.3 4.6 1.4 2.3a
2.9 2.3a
58.6 57.9 54.6 55.2 22.1 25.9 27.4 27.2 5.2 2.1 8
4.0 2.7a
is based on ~bout 10 NOTE: Detail may not add to total shown because of rounding. Numbers in parentheses refer to population in the group.
or fewer sample cases.
18 Criminal Victimization in the United States, 1987

Robber;l Assault Crimes Com- At- Personal larcenl With Without Aggra- of pleted tempted With Without
Total injury injury Total vated Simple theft theft tlHlft contact contact
10.4 3.1 7.3 57.1 18.2 39.0 109.2 105.8 3.4 4.2 105.0 11.9 3.3 8.6 78.3 32.8 45.5 J25.8 117.6 8.3 3.9 121.9 13.0 5.9 7.1 63.3 24.6 38.6 120.6 112.0 8.6 4.6 115.9 9.4 2.7 6.7 30.2 11.5 18.7 84.3 78.2 6.1 1.1 83.2 3.6 1.7 1.9 18.9 7.8 11.1 63.5 58.7 4.8 2.1 61.4 3.4 1.1 2.3 7.7 3.3 4. 11 37.5 34.5 3.0 .• 9a 36.6 1.2a .6a .6a 4.3 1.4 2.9 18.2 16.7 1.6 1.8 16.4
4.0 .9a 3.1 36.4 7.1 29.3 106.8 "103.8 3.0 1.5a 105.4 5.9 2.1a 3.8 34.5 10.7 23.8 117.0 114.2 2.8 3.3 113.8 6.8 2.3 4.5 39.4 8.4 31.1 97.3 89.1 8.2 4.4 92.8 5.8 2.0 3.8 19.3 5.5 13.8 72.4 67.5 5.0 3.3 69.2 3.1 1.0 2.1 11.3 3.5 7.8 63.2 59.S 3.5 i:l.3 61.0 1.6 .8a .9a 4.6 1.7 2.9 36.2 33.8 2.4 2.6 33.6 2.2 1.5 .8a 3.1 1.2 1.9 18.9 18.1 .9a 3.3 15.6
aEstimate is based on about 10 or fewer sample oases.
Table 7. Personal crimes, 1987
Victimization rates for persons age 12 and over, by type of crime and sex and race of victims
(Rate eel" 1,000 eOEulation a~e 12 and over)
Male Female White
Type of crime (82,108,740)
Crimes ot Yio1enoe 35.0 Completed 12.0 Attempted 23.0 Rape .la
Robbery 5.7 Completed 3.4
With injury 1.6 Without injury 1.7
Attempted 2.3 With injury .4 Without injury 1.9
Assault 29.2 Aggravated 10.5
Completed with injury 3.5 Attempted with weapon 7.1
Simple 18.7 Completed with injtlry 5.1 Attempted without weapon 13.6
t'rilles ot thett 72.5 Completed 67.7 Attempted 4.7 Personal larceny with contact 1.9 Personal larceny without contact 70.6
Completed 65.9 Attempted 11.7
NOTE: Detail may not add to total shown because of rounding. Numbers in parentheses refer to population in the group.
8lack White (10,382,130) (87,806,5110)
119.1 20.1 17.5 7.7 31.6 12.3
Oa .9
15.2 3.2 9.2 2.3 2.9 1.0 6.3 1.3 6.0 .9 2.2 .4 3.8 .6
33.9 15.9 18.3 4.1 4.9 1.2
13.4 2.9 15.6 11.8 3.4 3.8
12.2 8.0
70.6 6 •• 3 64.1 60.5 6.6 3.8 4.4 2.7
66.2 61.6 59.6 58.4
6.6 3.2
aEstimate is based on about 10 or fewer sample cases.
Black (12,3~3,560)
31.6
15.2 16.4
3.3
8.9 7.6 1.9 ';;.7 1.3 .8a .5a
19.5 6.8 2.3 4.5
12.7 4.3 8.4
56.4
53.7 2.8 4.2
52.2 50.4
1.8
Criminal Victimization in the United States, 1987 19

,.
1
,······.-
Table 8. Personal crimes, 1987
Victimization rates for persons age 12 and over, by type of crime and ethnicity of victims (Rate pel' 1,000 EOEulation ag;e 12 and over)
Tota18 Hispanic Non-Hispanic Type of crime (197,769,470) (12,268,100) (184,965,460)
Cri8es of violence 28.6
Completed 10.5 Attempted 18.1 ,Rape .7
Robbery 5.2 Completed 3.4
With injury 1.4 From serious assault .7 From minor assault .7
Without injury 2.0 Attempted 1.8
With injury .5 From serious assault .2 From minor assault .3
Without injury 1.3
Assault 22.7 Aggravated 7.B
Completed with injury 2.4 Attempted with weapon 5.4
Simple 14.9 Completed with injury 4.4 Attempted without weapon 10.5
Criaes of theft 67.5
Completed 63.3 Attempted 4.2
Personal larceny with contact 2.6 Purse snatching .9 Pocket picking 1.6
Personal larceny without contact 64.9 Completed 61.0
Less than $50 26.9 $50 01' more 31.2 Amount not available 3.0
Attempted 3.9
NOTE: Detail may not add to total shown hecause of rounding. Numbers in parentheses refer to population in the group.
39.0 27.8
14.3 10.2 24.7 17.6
.5b .7
9.9 4.9 5.9 3.2 2.1 1.3 1.6
b .6
.5 .8 3.8 1.9 4.1 1.6 1.2b .4
.8b .2
.4b .3 2.9 1.2
28.5 22.2 9.6 7.6 1.7 2.4 7.9 5.2
18.9 14.6 6.7 4.2
12.2 10.4
59.8 67.9
53.9 63.8 5.9 4.1
5.1 2.4 2.1 .8 3.0 1.5
54.7 05.5 49.6 61.7 16.9 27.5 31.2 31.1
1.6 3.0 5.1 3.8
aTotal includes persons whose ethnicity ~as not ascertained. Estimate is based on about 10 01'
fewer sample cases.
Table 9. Personal crimes, 11187
Victimization rates for persons age 12 and over, by race and age of victims and type of crime
20 Criminal Victimization in the United States, 1987
(Rate Eel' 1,000 population in each age group)
Crimes Completed Attempted of violent violent
Race and age violence crimes crimes
White 12-15 (10,686,480) 51.7 23.3 28.5 16-19 (12,082,870 ) 66.4 24.7 41.7 20-24 (15,958,400) 65.1 21.0 44.1 25-34 (36,312,460) 31.7 11.7 19.9 35-49 (40,344,880) 18.5 5.4 13.1 50-64 (28,925,810) 7.9 2.7 5.2 65 and over (25,604,390) 4.6 2.3 2.3
Blacll: 12-15 (2,081,050) 78.2 34.4 43.8 16-19 (2,207,900) 77.3 20.6 56.B 20-24 (2,570,380) 53.0 21.6 31.4 25-34 (5,273,990) 49.7 23.6 26.1 35-49 (4,988,680) 18.6 6.4 12.3 50-64 <3,239,450) 12.8 9.2 3.6a 65 and over (2,364,230) 14.3 4.7a 9.6
NOTE: Detail may not add to total shown beoause of rounding. Numbers in parentheses refer to population in the group.
Rape
1.0a 1.9 1.2
.9
.1 8
08
.1a
3.0a 3.38
3.48
3.0a .48
Oa Oa

Robberl Assault Crimes Com- At- Personal larcenl With Without Aggra- of pIe ted tempted With WithOut
Total injury injury Total vated Simple theft theft theft contact contact
6.2 1.8 4.4 44.5 10.4 34.1 111.2 108.0 3.2 2.1 109.1 7.8 2.4 !>.4 56.7 18.7 38.0 124.5 120.0 4.5 3.2 121.3 9.6 4.1 5.5 54.3 17.3 36.9 113.2 105.1 8.2 3.7 109.5 6.2 2.1 4.1 24.6 8.1 16.5 80.2 74.3 5.9 2.2 78.1 2.8 1.2 1.6 15.6 5.5 10.2 64.9 60.7 4.2 2.1 62.9 1.9 .,8 1.2 5.9 2.2 3,:7 37.4 34.6 2.8 1.6 35.8 1.6, .9 .7 2.9 1.3 1. 'F 18.7 17.4 1.3 2.2 16.4
13,3 3.7a 9.6 61.9 23.5 38.3 98.1 93.9 4.2a 6.6a 91.5 15.8 3.8a 11.9 58.2 38.9 19.3 98.6 87.0 11.6 5.5a 93.1 12.5 4.7a 7.8 37.1 11.0 26.1 87.1 78.4 8.7 9.5 77.5 19.0 4.7 14.3 27.6 12.5 15.2 67.4 63.9 3.6 1.0a 66.4 7.2 2.8a 4.3 11. 1 6.8 4.2 54.0 49.9 4.1 2.5a 51.5 7.8 2.8a 5.0 5.1 2.1a 3.0a 36.3 34.2 2.1a 3.8a 32.5 4.9a 4.2a .7a 9.4 1.5a 7.9 17.9 17 .9 Oa 7.5 10.4
aEstimate is based on about 10 or fewer sample cases.
Criminal Victimization in the United States, 1987 21

Table 10. Personal crimes, 1987
Victimization rates for persons age 12 and over, by race, sex and age of victims and type of crime
(Rate per 1,000 population in each age group)
Race, sex and age
White Male
12-15 (5,467,390) 16-19 (6,109,030) 20-24 (7,882,380) 25-34 (18,26!i,560) 35-49 (19,962,380) 50-64 (13,803,010) 65 and over (10,618,990)
Female 12-15 (5,219,090) 16-19 (5,973,830 ) 20-24 (8,076,010) 25-34 (18,046,900) 35-49 (20,382,500) 50-64 (15,122,800) 65 and over (14,985,400)
Blaok Male
12-15 (1,053,880) 16-19 (1,086,640) 20-24 (1,181,860) 25-34 (2,423,580 ) 35-49 (2,250,140 ) 50-64 (1,414,730) 65 and over (971,300)
Female 12-15 (1,027,170) 16-19 (1,121,260) 20-24 (1,388,520) 25-34 (2,850,410) 35-49 (2,738,540) 50-64 (1,824,730) 65 and over (1,392,930)
N,OTE: Numbers in parentheses refer to population in the group.
Crimes of violenoe Crimes of theft
65.7 11!1.0 89.4 125.3 82.1 125.1 37.3 85.2 22.9 65.2
9.7 38.0 4.5 18.1
37.1 108.2 42.9 123.7 48.5 101. 7 25.9 75.2 14.2 64.6 6.1 36.9 4.6 19.1
90.8 88.3 101.0 119.2
49.2 104.5 62.5 82.0 21.1 51.5 22.9 37.8 15.4a 19.9
65.2 108.1 54.4 78.6 56.3 72.3 38.8 55.0 16.6 56.0 5.0a 35.1
13.6 16.5
aEstimate is based on about 10 or fewer sample cases.
Table 12. Personal crImes, 1987
Victimization rates for persons age 12 and over, by sex and marital status of victims and type of crime
(Rate Eel' 1,000 population age 12 and over)
Crimes Completed Attealpted of violent violent
Sex and marital st~tus violence crimes crimes Rape
22 Criminal Victimization. in the United States. 1987
I"-le Never married (30,772,260) 69.1 24.5 44.7 Married (55,165,140) 18.2 5.3 12.9 Widowed (2,036,200) 13.1 7.3a 5.88
Divorced or separated (6,838,290) 40.7 17.2 23.4
Fellllle Never married (27,115,600) 41.1 17.1 24.0 Married (53,513,150) 8.6 2.6 6.0 Widowed (10,997,750) 9.4 4.6 4.8 Divorced or separated (10,939,870) 49.3 22.8 26.4
NOTE: Detail may not add. to total shown because of rounding. Numbers in parentheses refer to population in the group; excludes
.3a Oa Oa Oa
3.1 .3 .38
2.4

Table 11. Personal crlmes,1987.
Victimization rates for persons age 12 and over, by type of crime and marital status of victims
(Rate per 1,000 population age 12 and over)
Never married Married Widowed
Type of orime (57,887,786) (108,678,290) (13,033,960 )
Cr~a or Yiolence 56.0 13.5 10.0 Completed 21.0 4.0 5.0 Attempted 35.0 9.5 5.0 Rape 1.6 .2 .3a
Robbery 10.2 2.4 4.0 Completed 6.4 1.6 3.6
With injury 2.6 .6 1.7 From serious assault 1.2 .4 .43
From minor assault 1.4 .2 1.4 Without injury 3.9 1.0 1.8
Attempted 3.8 .8 .5a With injury 1.0 .2 .1a
From serious assault .4 .1 a Oa From minor assault .6 .1a .1a
Without injury 2.8 .6 .3a
Assault 44.2 10.9 5.6 Aggravated 14.6 4.1 2.3
Completed with injury 4.5 1.1 .98
Attempted with weapon 10.1 3.0 1.5 Simple 29.5 6.8 3.3
Completed with injury 9.3 1.2 .6a Attempted without weapon 20.2 5.6 2.7
Cr~l!I or theft 105.6 49.5 25.7
Completed 99.5 46.0 24.2 Attempted 6.1 3.5 1.5
Personal larceny with contact 3.7 1.7 3.1 Purse snatching 1.2 .7 1.7 Pooket picking 2.4 1.1 1.4
Personal larceny without contact 101.9 47.8 22.6 Completed 96.4 44.5 21.5
Le 9S than $50 48.7 17.5 7.9 $50 or more 43.6 25.0 10.4 Amount not available 4.1 2.0 3.1
Attempted 5.5 3.3 1.1a
NOTE: Detail may not add to total shown aEstimate is based on about because of rounding. Numbers in parentheses or fewer sample cases. refer to population in the group; data on persons whose marital status was not ascertained are eXCluded.
Robberl:: Assault Crimes Com- At-
Divoroed or separated (17,778,160)
46.0
20.7 25.3
1.5
6.6 4.7 2.2
.8a 1.3 2.5 1.9
.7a
.4a
.3a 1.3
37.9 12.6 5.0 7.6
25.3 10.3 15.1
83.9
79.5 4.4
3.6 1.0 2.5
80.4 76.1 27.3 114.0
4.9 4.2
10
Personal With Without Aggl'a- of pleted tempted With
Total injury injury Total vated Simple theft theft theft contaot
12.6 4.6 8.0 56.2 21.0 35.1 111.4 104.2 7.2 3.6 3.1 1.0 2.0 15.1 5.9 9.2 49.6 46.0 3.6 1.2 6.5a .8a 5.8a 6.6a 3.6a 3.0a 42.7 40.B 1.93 2.4a 8.1 3.2 4.9 32.5 15.4 17.1 84.7 76.2 6.5 3.4
7.5 2.4 5.1 30.5 7.4 23.2 99.0 94.1 4.9 3.7 1.8 .6 1.1 6.5 2.2 4.3 49.5 46.1 3.4 2.3 3.6 2.1 1.5 5.5 2.1 3.4 22.6 21.2 1.4a 3.2 5.6 2.6 3.1 41.2 10.8 30.4 83.4 60.3 3.1 3.6
data on persons whose marital status was not ascertained. aEstimate is based on about 10 or fewer sample cases.
larcenl:: WithOut contact
107.9 48.4 40.3 81.2
95.2 47.2 19.3 79.8
Criminal Victimization in the United States, 1987 23

TaI!Ite 13, Personal crimes, 1987
Victimization rates for persons age 12 and over, by HX of head of household, ret.tionship of victims to head, and type of crime
(Rate per 11 000 population a~e 12 and over)
Crimes Completed Attempted Sex of head of household of violent violent and relationship to head violence crimes orimes Rape
Bou~lds headed by .. les All male head~ (63,265,520) 25.0 7.6 1".3 OB
Male heads living alone (9,191,720) 44.5 16.1 28.4 Oa
Male heads 1iving with Oil others (54,073,800) 21.6 6.2 15.5
Wives (46,599,540) 7.6 2.3 5.3 .3a
Own ohildren under age 18 (13,844,650) 45.9 16.4 29.5 .8a
Own ohildren age 18 and over (11,643,160) 40.4 15.5 25.0 .8a
Other relatives (3,850,260) 33.1 13.6 19.5 1.7B
Nonrelatlves (4,423,600) 85.1 27.5 57.6 1.3-
BOuaeholds headed by fe .. les All female heads (31,097,610) 30.8 13.9 16.8 1.9
Fell8le heads 11 ving alone (13,482,030) 22.3 9.9 12.4 1.2-
Female heads living with others (17,615,580) 37.3 17.1 20.2 2.4
Husbands (5,102,420) 17.2 7.8 9.4 OB OWn ohildren under age
18 (5,424,640) 76.0 34.7 41.3 1.6a
Own children age 18 and over (6,305,770) 50.8 15.1 35.7 1.6B
Other relatives (2,966,220) 41.0 23.5 17.6 1.4-Honrelatives (3,246,090) 66.9 27.7 39.3 4.4-
NOTE: D!tail may not add to total shown beoause of rounding. Numbers in parentheses refer to population in the group.
24 C;imir.al-Victill,izatio;;. iii'tJ-.e UrJtecJ Stfi.tes, 19&7

Robberr Assault Crimes Com- At- Personal larceny With Without Aggra- of pIe ted tempted With Without
Total injury injury Total vated Simple theft theft theft contact oontact
4.7 1.7 3.0 20.3 7.6 12.7 62.3 57.6 4.7 1.5 60.8
11.1 4.2 6.9 33.4 11.5 21.9 102.2 92.2 10.0 4.2 98.0
3.6 1.2 2.3 18.1 7.0 11. 1 55.5 51.8 3.8 1.1 54.4 1.5 .7 .9 5.8 2.0 3.8 48.7 45.2 3.5 2.1 46.5
4.9 1.1a 3.7 40.2 12.0 28.2 107.6 104.8 2.8 2.1 105.5
5.9 2.5 3.4 33.7 11.5 22.2 71.7 69.0 2.7 2.1 69.6 10.4 2.0a 8.4 21.0 9.0 12.1 65.6 61.6 4.0a 3.48 62.2 15.6 4.7 10.9 68.1 23.3 44.8 128.6 120.2 8.5 6.8 121.8
6.7 2.6 4.1 22.1 6.3 15.9 67.5 63.9 3.6 3·9 63.6
5.8 2.4 3.5 15.3 5.3 10.0 56.2 52.1 4.1 4.2 52.0
7.4 2.8 4.6 27.4 7.0 20.4 76.2 72.9 3.2 3.7 72.5 11.9 2.4a 2.5a 12.3 5.5 6.8 52.6 44.6 8.0 3.,a 49.5
11.4 3.0 8.3 63.1 17.9 45.2 101.7 96.4 5.3 4.4 97.3
7.3 3.4 3.9 41.9 18.1 23.8 83.5 77.0 6.5 5.7 77.8 11.2 3.4a 7.8 28.5 12.5 16.0 46.5 43.7 2.8a 4.08 42.5 13.6 6.6 7.0 49.0 18.0 31.0 125.0 118.0 7.0 2.5a 122.5
aEst1~~te 1s based on about 10 or fewer sample cases.
Criminal Victimization in the United States, 1987 25
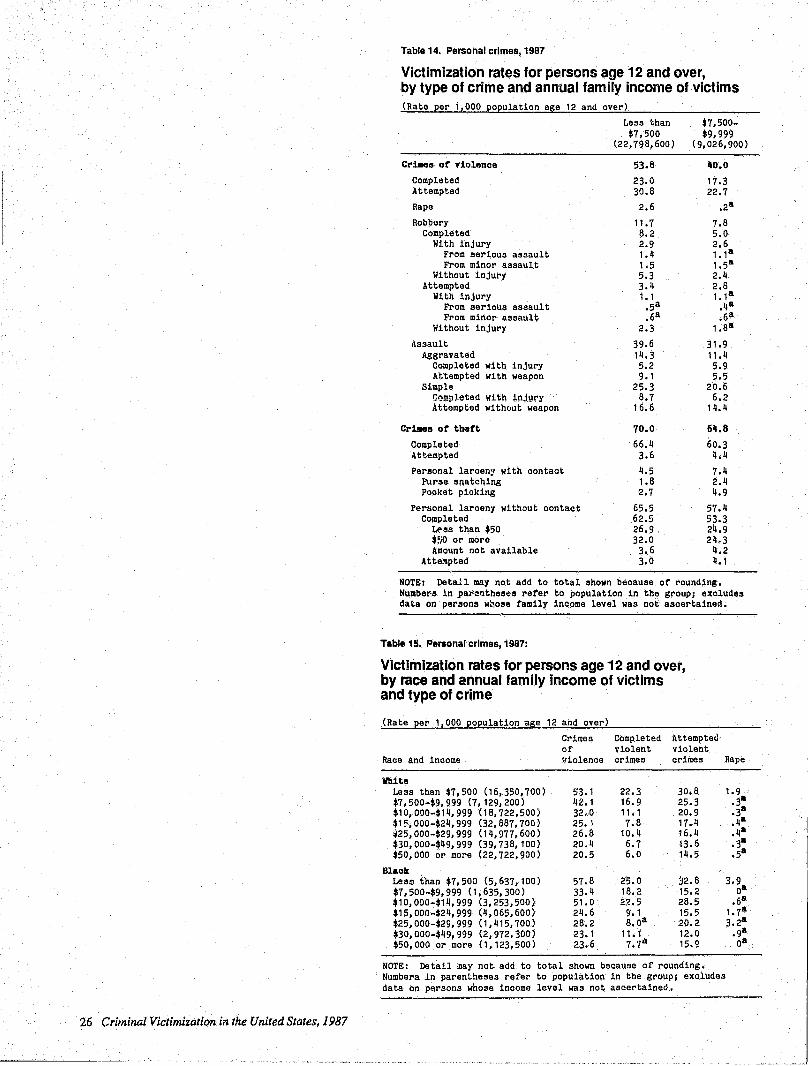
·26 Criminal Victimization in the United States, 1987
Table 14. Personal crimes, 1987
Victimization rates for persons age 12 and over, by type of crime and annual family income of victims (Rate per 1,000 population age 12 and over)
Crt.es or Ylolence
Completed Attempted
Rape
Robbery Completed
With injury From serious assault From minor assault
Without injury Attempted
With injury From serious assault From minor assault
Without injury
Assault Aggravated
Completed with injury Attempted with weapon
Simple Com~~~ted with ~njury Attempted without weapon
Crilles or thert
Completed Attempted
Personal larceny with contact Purse snatching Pocket picking
Peraonal larceny without contact Completed
LE'sS than $50 $~iO or more Amount not available
Atte~pted
Less than $7,500
(22,798,600 )
53.8
23.0 30.8 2.6
11.7 8.2 2.9 1.4 1.5 5.3 3.4 1.1
.5a
.6a 2.3
39.6 14.3 5.2 9.1
25.3 8.7
16.6
70.0
66.4 3.6
4.5 1.8 2.7
65.5 62.5 26.9 32.0 3.6 3.0
$7,500-$9,999
(9,026,900 )
lIO.O
17.3 22.7
.28
7.8 5.0 2.6 1.1 8
1.58
2.4 2.8 1.18
.48
.68
1.8s
31.9 11.4 5.9 5.5
20.6 6.2
14.4
611.8
60.3 4.4 7.4 2.4 4.9
57.4 53.3 24.9 24,.3
4.2 4.1
NOTE: Detail may not add to total shown because or rounding. Numbers in pa~~ntheses rerer to population in the group; excludes data on persons w~ose family income level was not ascertained.
Table 15. Personal crlmes,1987:
Victimization rates for persons age 12 and over, by race and annual family income of victims and type of crime
(Rate per 1,000 population age 12 and over)
Crimea Completed Attemptetl of violent violent
Race and income Violence crimes crimes Rape
'II!Ilte Less than $7,500 (16,350,700) 53.1 22.3 30.8 $7,500-$9,999 (7,129,200) 4~).1 16.9 25.3 $10,000-$14,999 (18,722,500) 32".0 11.1 20.9 $15,000-$24,999 (32,887,700) 25. I 7.8 17.4 ~25,OOO-$29,999 (14,977,600) 26.8 10.4 16.4 $30,000-$49,999 (39,738,100) 20.4 6.7 13.6 $50,000 or more (22,722,900) 20.5 6.0 14.5
Black Les6 t·han $7,500 (5,637,100) 57.8 25.0 !12.8 $7,500-$9,999 (1,635,300) 33.4 18.2 15.2 $10,000-$14,999 (3,253,500) 51.0 22.5 28.5 $15,000-$24,999 (4,065,600) 24.6 g.l 15.5 $25,000-$29,999 (1,415,700) 28.2 8.0a 20.2 *30,000-$49,999 (2,972,300) 23.1 11.1 12.0 $50,000 or more (1,123,500) 23.6 7.7'4 15.!!
NOTE: Detail ~y not add to total shown because of rounding. Numbers. 1n parentheses refer to population in the group; excludes data on persons whose income level was not ascertained.
1.9 .3a .3a .4a .4a .3a .5a
3.9 Oa
.61l
1.7s 3.2a
.9s OS
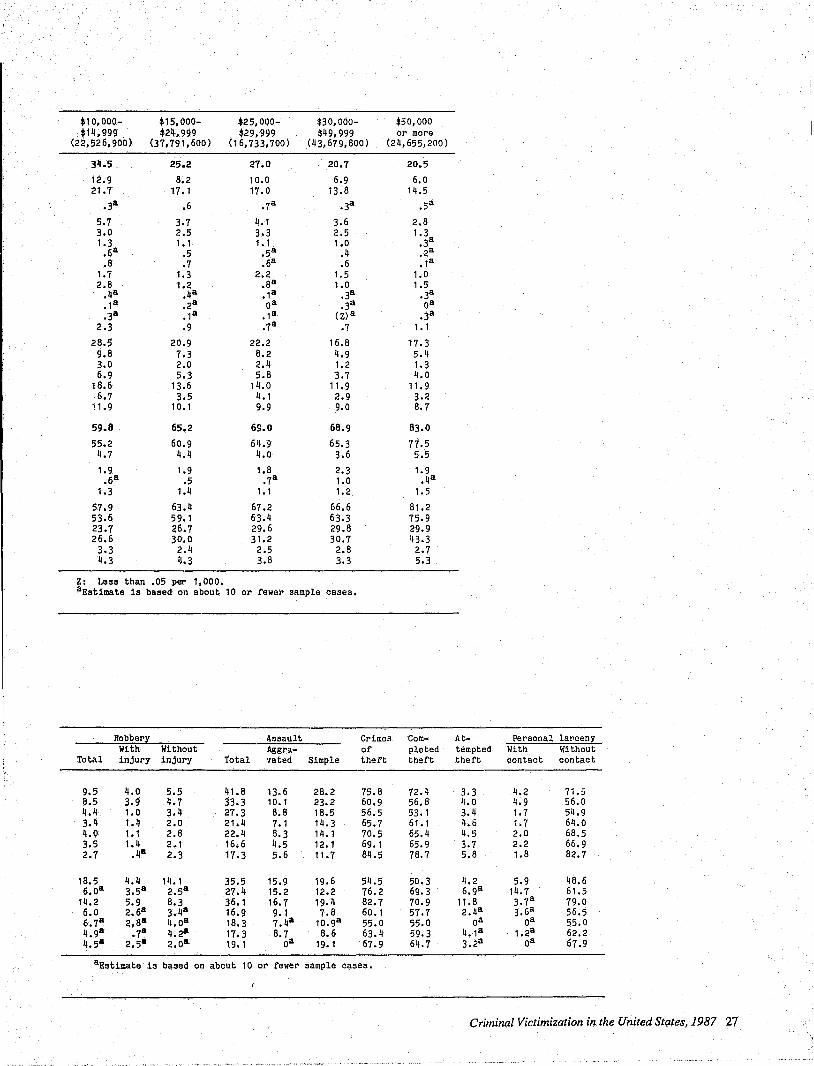
$10,000- $15,000- $25,000- $30,000- $50,000 $14,999 $24,999 $29,999 $49,999 or more
(22,526,900) <37,791,600 ) (16,733,700) (43,679,800) (24,655,200)
311.5 25.2 27.0 20.7 20.5
12.9 8.2 10.0 6.9 6.0 21.7 17.1 17.0 13.8 14.5
.3a .6 .78 .38 .58
5.7 3.7 4.1 3.6 2.8 3.0 2.5 3.3 2.5 1.3 1.3 1.1 1.1 1.0 .38
.68 .5 .58 .4 .28
.8 .7 .68 .6 .1 8
1.7 1.3 2.2 1.5 1.0 2.8 1.2 .88 1.0 1.5
.48 .48 .1a .38 .38
.1 8 .28 08 .38 08
.3a .1 8 .1 8 (Z)8 .38 2.3 .9 .78 .7 1.1
28.5 20.9 22.2 16.8 17.3 9.8 7.3 8.2 4.9 5.4 3.0 2.0 2.4 1.2 1.3 6.9 5.3 5.8 3.7 4.0
18.6 13.6 14.0 11.9 11.9 6.7 3.5 4.1 2.9 3.2
11.9 10.1 9.9 9.0 8.7
59.8 65.2 69.0 68.9 83.0
55.2 60.9 611.9 65.3 17.5 4.7 4.4 4.0 3.6 5.5
1.9 1.9 1.8 2.3 1.9 .68 .5 .78 1.0 .48
1.3 1.4 1.1 1.2 1.5
57.9 63.4 67.2 66.6 81.2 53.6 59.1 63.4 63.3 75.9 23.7 26.7 29.6 29.8 29.9 26.6 30.0 31.2 30.7 43.3 3.3 2.4 2.5 2.8 2.7 4.3 ~.3 3.8 3.3 5.3
Z: Lesa th8n .05 per 1,000. aEstimate is baaed on about 10 or fewer sample cases.
Robber;t Assault Crimes Com- At- Personal larceny With Without Aggra- of pleted tempted With Without
Total injury injury Total vated Simple theft theft theft contact contact
9.5 4.0 5.5 41.8 13 .. 6 28.2 75.8 72.4 3.3 4.2 71.5 8.5 3.9 4.7 33.3 10.1 23.2 60.9 56.8 4.0 4.9 56.0 4.4 1.0 3.4 27.3 8.8 18.5 56.5 53.1 3.4 1.7 54.9 3.4 1.4 2.0 21.4 7.1 14.3 65.7 61.1 4.6 1.7 64.0 4.0 1.1 2.8 22.4 8.3 14.1 70.5 65.4 4.5 2.0 68.5 3.5 1.4 2.1 16.6 4.5 12.1 69.1 65.9 3.7 2.2 66.9 2.7 .4a 2.3 17.3 5.6 11.7 84.5 78.7 5.8 1.8 82.7
18.5 4.4 14.1 35.5 15.9 19.6 54.5 50.3 4.2 5.9 48.6 6.08 3.58 2.58 27.4 15.2 12.2 76.2 69.3 6.9a 14.7 61.5
14.2 5.9 8.3 36.1 16.7 19.4 82.7 70.9 11.8 3.78 79.0 6.0 2.68 3.4a 16.9 9.1 7.8 60.1 57.7 2.48 3.68 56.5 6.7a 2.8a 4.08 18.3 7.4a 10.98 55.0 55.0 oa Oa 55.0 4.9a .78 4.2- 17.3 8.7 8.6 63.4 59.3 4.1 8 1.28 62.2 4.5- 2.5· 2.0· 19.1 Oa 19.1 67.9 64.7 3.28 Oa 67.9
8Estimate is based on about 10 or fewer sample cases.
Criminal Victimization in the United States, 1987 27

---------------------------------~--
Table16. Personal crimes, 1987
Victimization rates for persons age 12 and over, by level of educational attainment and race of victims and type of crime
JRate per 1,000 population age 12 and over)
Crimes Completed Attempted Robber:/: Level of educational of violent violent With Without attainment and race violence orimes crimes Rape Total injury injury
Ele.antary sohool All racesa (30, 182,470j 30.4 14.1 16.3 .5 5.3 1.9 3.4 White (24,633.350) 28.0 12.7 15.2 .40 4.3 1.6 2.7 Black (4,622,210) 43.0 21.7 21.11 1.30 11.1 3.7 7.4
0-4 yearsb All racesa (4,090,940) 16.5 6.5 10.0 00 6.4 3.3 0 3.20
White (2,990,450) 19.0 6.8 12.2 00 5.8 3.0 0 2.80
Black (878,680) 12.00 7.1 0 4,9c Oc 10.1 0 5.1 0 5.1 0
5-7 years All racesa (14,475,850) 38.1 17.4 20.',' .7c 5.8 2.0 3.8 White (11,678,120) 35.0 15.7 19.2 .30 4.7 1.8 3.0 Black (2,~24,360) 51.1 25.9 25.2 2.70 11.6 3.3 0 8.3
8 years All racesa (11,615,680) 25.8 12.7 13.1 .6c 4.2 1.2c 3.0 White (9,964,780) 22.5 11.0 11.5 .70 3.4 1.00 2.4 Black (1,419,170) 48.9 23.7 25.2 Oc 10.80 3.3 0 7.5 0
High school All racesa (99,586,320) 30.2 11.8 18.5 .9 5.8 2.1 3.7 White (85,336,960) 28.8 11.0_ 17.8 .7 4.8 1.8 2.9 Black (12,270,570) 40.6 16.6 24.0 1.6 12.9 4.1 8.8
1-3 years· All racesa (29,815,030) 42.7 15.9 26.8 1 .. 4 7.5 3.0 4.4 White (24,436,570) 42.1 15.8 26.3 1.3 6.5 2.6 3.8 Black (4,750,660) 47.8 17.7 30.1 1.4 c 13.6 5.6 8.0
4 years All raoesa (69,771,280) 211.9 10.0 14.9 .6 5.1 1.7 3.3 White (60,900,390) 23.5 9.1 14.4 .4 4.1 1.5 2.6 Black (7,519,910) 36.1 16.0 20.1 1.7 c 12.5 3.2 9.4
College All racesa (66,412,550) 25.5 7.1 18.5 .6 4.2 1.5 2.8 White (58,7118,430) 24.9 6.7 18.1 .11 3.8 1.3 2.5 Black (5,506,300) 34.2 10.3 23.9 2.60 9.8 3.4 6.4
1-3 years All racesa (33,610,070) 33.3 10.3 23.0 .7 5.7 2.1 3.5 White (29,332,710) 32.6 9.8 22.8 .4 0 5.2 2.0 3.2 Blaok (3,408,740) 40.9 13.4 27.4 2.9 0 11.0 3.50 7.5
4 or more years All raoes8 (32,802,480) 17.6 3.8 13.8 .50 2.8 .8 2.0 Wbite (29,415,720) 17.2 3.7 13.5 .30 2.4 .7 1.8 Blaok (2,097,570) 23.3 5.1 0 18.2 2.20 7.9 3.20 4.7°
NOTE: Detail may not add to total shown beoause of rounding. Numbers in parentheAes refer to population in the group; excludes data on persons age 12 and over whose level of eduoation was not ascertained.
28 Criminal Victimization in th,~ United States, 1987

Assault Crimes Com- At- Personal larcen~ Aggra- of pleted tempted With Without
Total vated Simple theft theft theft oontact contact
24.6 7.6 17.0 53.1 51.0 2.1 3.1 50.1 23.2 6.6 16.6 54.0 52.0 2.0 2.2 51.8 30.6 10.7 19.9 49.0 46.6 2.4 0 7.7 41.3
10.0 5.1 5.0 26.3 21.4 4.9 3.1 0 23.3 13.2 6.4 6.8 23.6 19.7 4.00 1.90 21.8 1.90 1.90 00 34.3 27.1 7.20 7.9 0 26.4
31..6 9.5 22.1 64.8 62.9 1.9 3.1 61.7 29.9 8.8 21.1 66.8 64.9 1.9 2.2 64.6 36.8 10.3 26.5 56.1 53.9 2.1 0 7.9 48.1
21.0 6.2 11l.8 48.1 46.7 1.40 3.1 45.0 18.4 4.2 14.2 48.2 46.6 1.60 2.4 45.8 38.1 16.8 21.3 46.7 46.7 00 7.20 39.4
23.6 8.6 15.0 61.2 57.5 3.7 2.3 58.9 23.4 7.8 15.6 60.8 57.3 3.6 1.9 58.9 26.1 14.3 11.8 63.5 58.5 5.0 4.6 58.9
33.8 11.9 21.9 69.3 65.9 3.4 2.6 65.7 34.3 10.6 23.7 70.9 67.8 3.1 2.2 68.8 32.8 19.6 13.2 60.6 55.9 4.7 5.1 55.5
19.2 7.1 12.1 57.7 5~.8 3.9 2.1 55.5 19.0 6.7 12.3 56.8 53.1 3.7 1.8 55.0 21.9 11.0 10.9 65.4 60.2 5.2 4.3 61.1
20.7 6.7 13.9 84.1 78.1 6.0 2.8 81.3 20.7 6.6 14.1 85.3 79.1 6.2 2.9 82.5 21.7 7.7 14.0 75.9 70.6 5.3 .9 0 75.1
26.9 9.4 17.5 86.3 80.2 6.1 2.4 83.9 26.9 9.3 17. '7 88.5 82.1 6.4 2.6 85.8 27.0 9.5 17.5 73.1 68.6 4.4 0 .90 72.2
14.3 4.0 10.3 81.8 75.9 5.9 3.2 78.6 14.5 4.0 10.5 82.2 76.2 6.0 3.1 79.1 13.2 4.8 0 8.4 80.6 73.8 6.80 .80 79.7
alnoludes data on "other" raoes, not shown separately. blnoludes persons who never attended or who att~nded kindergarten only. °Estimate is based on about 10 or fewer sample oases.
Criminal Victimization in the United States, 1987 29

30 Criminal Victintizationin the United States, 1987
Table 17. Personal crimes, 1987
Victimization rates for persons age 12 and over, by type of crime and type of locality of n~sidence of victims
(Rate per 1,000 resident population age 12 and over)
Total Outside
All Central central areas cities oities
Type of crime (197,769,470) (59, 529, 360)(84, 380, 200)
Crimea or violence 28.6 40.3 23.0 Completed 10.5 16.0 7.9 Attempted 18.1 24.3 15.2 Rape .7 1.2 .5
Completed .3 .5 .3 Attempted .4 .7 .3
Robbery 5.2 10.0 3.7 Completed 3.4 7.0 2.2
With injury 1.4 2.8 .9 From serious assault .7 1.3 .6 From minor assault .7 1.5 .4
Without injury 2.0 4.2 1.3 Attempted 1.8 3.0 1.5
With injury .5 .9 .3 From serious assault .2 .4 .2a From minor assault .3 .5 .2a
Without injury 1.3 2.1 1.1
Assault 22.7 29.1 18.8 Aggravated 7.8 11.5 5.7
Completed with injury 2.4 3.4 1.7 Attempted with weapon 5.4 8.1 4.0
Simple 14.9 17.6 13.1 Completed with injury 4.4 5.1 3.7 Attempted without weapon 10.5 12.5 9.4
Crill,ea or thert 67.5 79.7 69.9 Completed 63.3 73.4 65.7 Attempted 4.2 6.3 4.2
Personal larceny with contact 2.6 5.7 1.6
Purse snatching .9 2.3 .4 Completed .6 1.5 .3 Attempted .3 .8 .1 a
Pocket pioking 1.6 3.3 1.2
Personal larceny without c\1ntact 64.9 74.0 68.3
Completed 61.0 68.6 64.2 Less than $50 26.9 28.5 27.6 $50 or more 31.2 37.1 33.5 Amount not available 3.0 2.9 3.2
Attempted 3.9 5.4 4.1
NOTE: The population range categories shown under the heading ~Metropolitan areas" are based only on the size of the central city and do not

MetroEolitan areas 50,000-249,999 250!000-499,999 500,OOO-999!999 1 !OOO,OOO or more
Outside Outside Outside Olltside Nonmetro-Central central Central central Central central Central central poll tan cities cities cities cities citills oities cities cities areas
(18,582,400)(28,196,030) (11,645.750){21,023.080j (12.503.210) (17.950,080)(16,797,990) (17,211,000) (53,859.920)
38.9 22.4 110.6 19.5 '13.6 26.7 39.1 211.4 24.5
13.6 7.6 16.8 6.6 16.3 9.6 17.8 8.0 8.8 25.4 14.8 23.7 12.9 27.2 17.2 21.3 16.4 15.8
1.6 1.0 1.9 .3a .7a .5a .6a Oa .5 .8a .6 .9a .,a .2a .1a .3a Oa .2a .8a .4a 1.0a .24 .5a .4a .4a Oa ,3a
4.9 3.6 8.6 2.8 12.1 3.4 15.0 5.2 2.3 3.5 2.3 6.0 1.3 8.7 2.0 10.4 3.5 1.4 1.7 1.0 3.3 .5a 3.6 .7a 3.1 1.7 .6 1.0 .8 1.4a .3a 2.1 .1 a .8a 1.0 .1 a
.6a .2a 1.9 .2a 1.5 .6a 2.3 .6a .4 1.8 1.3 2.7 .9 5.0 1.3 7.3 1.8 .8 1.4 1.3 2.6 1.5 3.5 1.4 4.6 1.7 .9
.4a .2a .7a .4a .9a .3a 1.5 .5a .3a
.2a .la .2a .2a .1 a .1 a 1.0 .3a .l a
.2a .1 a .5a .2a .8a .2a .5a .1 a .2a 1.0 1.1 1.9 1.1 2.6 1.1 3.1 1.3 .6
32.5 17 .8 30.1 16.3 30.7 22.9 23.4 19.2 21.7 11.2 4.4 12.8 5.2 10.6 6.8 11.4 7.6 7.0 2.3 1.3 5.0 1.9 3.1 2.6 3.7 1.2 2.5 8.9 3.1 7.8 3.3 7.5 4.2 7.7 6.3 4.5
21.3 13.4 17.3 11.2 20.1 16.1 12.0 11.6 14.7 7.1 3.4 5.0 3.3 4.3 4.9 3.4 3.3 4.6
14.2 10.0 12.3 7.9 15.7 11.2 8.6 8.3 10.1
77.7 61.6 86.11 65.6 91.0 80.11 68.8 77.8 50.1
73.8 58.4 78.2 61.7 83.6 76.0 62.1 71.9 48.2 4.0 3.3 8.2 3.9 7.5 4.5 6.6 5.9 2.0
2.1 1.3 4.2 2.2 5.8 1.3 10.6 1.8 .7 .7a .3a 1.3a .5a 2.7 .3a 4.5 .7a .2a
.7a .3a .7a .3a 1.4 .3a 2.9 .3a .2a Oa Oa .6a .2a 1.3 Oa 1.6 .4a (Z)a
1.3 1.0 2.9 1.7 3.1 .9 6.1 1.1 .5
75.7 60.4 82.2 63.4 85.3 79.2 58.2 75.9 49.5 71.7 57.1 74.6 59.8 79.1 74.7 53.2 70.5 47.5 34.1 28.1 31. ~ 24.7 33.5 30.0 17 .0 27.6 24.0 34.8 26.4 4Cl.2 33.0 42.0 41.2 34.0 37.7 20.9
2.9 2.6 3.3 2.1 3.6 3.5 2.2 5.2 2.6 4.0 3.3 7.6 3.7 6.2 4.5 5.0 5.5 1.9
reflect the population of the entire metro- to total shown because of rounding. politan area. Numbers in parentheses refer aEstimate is based on about 10 or fewer sample cases. to population in the group. Detail may not add Z: Less than .05 per 1.000.
Criminal Victimization in the United States, 1987 31

Table18. Personal crimes, 1987
Victimization rates for persons age 12 and over, by type of locality of residence, race and sex of victims, and type of crime
(Rate per 1,000 population age 12 and over)
Crimes Completed Attempted Robberr o.r violent violent With Without
Raoe and inoome violenoe orimes crimes Rape Total injury injury
111 areas White male (82,108,740) 35.0 12.0 23.0 .1a 5.7 2.0 3.7 White female (87,806,540) 20.1 7.7 12.3 .9 3.2 1.3 1.9 Black male (10,382,130) 49.1 17.5 31.6 ila 15.2 5.1 10.1 Blaok female (12,343,560) 31.6 15.2 16.4 3.3 8.9 2.7 6.2
Metropolitan areas Central oities
White male (20,767,760) 48.6 18.3 30.3 .,,;!l 11.2 4.6 6.6 White female (23,570,370) 30.5 11.8 18.7 1.6 6.1 2.6 3.6 Black male (5,795,690) 59.4 22.1 37.3 Oa 19.9 5.6 14.3 Black female (7,192,700) 37.8 20.2 17.7 3.6 12.5 3.9 B.6
Metropolitan areas Outside central cities
White male (37,628,320) 30.5 10.1 20.5 .2a 4.8 1.3 3.5 White female (39,149,960) 15.4 5.8 9.5 .6 2.3 .9 1.3 Black male (2,598,990) 34.9 11.9 23.0 0- 11.2 7.2 4.1-Black female (2,904,720) 21.1 6.4 14.7 4.0a 4.2a .7- 3.5-
Nonaetropolitan areas White male (23,712,670) 30.2 9.5 20.6 0- 2.3 .9 1.4 White female (25,086,210) 17.6 6.9 10.7 ,8 2.0 .8 1.1 Black male (1,987,450) 37.7 11.6 26.1 Oa 6.8- 1.1a 5.7a Black female (2,246,130) 25.2 10.9 14.3 1.2- 3.5a 1.2- 2.38
NOTE: Detail may not add to total shown because of rounding. Numbers in parentheses refer to population in the group.
32 Criminal Victimization in the United States, 1987

Assault Crimes Com- At- Personal larcenl Aggra- of pleted tempted With Without
Total vated simple theft. theft theft contact contaot
29.2 10.5 18.7 72.5 67.7 4.7 1.9 70.0 15.9 4.1 11.8 64.3 60.5 3.8 2.7 61.6 33.9 18.3 15.6 70.6 64.1 6.6 4.!1 66.2 19.5 6.8 12.7 56.4 53.7 2,8 4.2 52.2
37.3 15.8 21.4 89.4 82.0 7.4 3.9 85.5 22.8 6.2 16.6 79.8 74.0 5.8 6.6 73.2 39.5 22.7 16.9 "9.4 69.9 9.5 6.0 73.3 21.8 8.5 13.3 56.6 53.2 3.4 6.1 50.5
25.6 8.4 17.2 74.5 69.6 4.9 1.6 72.9 12.5 3.0 9.5 65.7 61.6 4.0 1.6 64.1 23.7 11.2 12.4 70.2 70.2 03 1.26 69.0 12.9 2.1 a 10.8 68.3 65.6 2.76 2.88 65.5
27.9 9.4 18.6 54.5 52.4 2.2 .66 54.0 14.9 3.9 11.0 47.5 46.1 1.4 .66 46.9 30.9 14.7 16.2 45.7 39.0 6.78 3.96 41.8 20.5 7.4 13.2 40.6 39.8 .86 06 40.6
aSstimate is based on about 10 or fewer sample cases.
Crimiruzl Victimization in the United States. 1987 33

Table 19. Personal crimes, 1987
Victimization rates for persons age 12 and over, by type of crime and region
(Rate per 1,000 population age 12 and over)
All regions Northeast Type of crime (197,769,470) (41,648,170 )
Crimes of violence 28.6 21.1 Completed 10.5 8.9 Attempted 18.1 12.2 Rape .7 .7
Completed .3 .3a Att.empted .4 .4
Robbery 5.2 5.9 Completed 3.4 4.1
With injury 1.4 1.5 From serious assault .7 .5 From minor assault .7 1.0
Without injury 2.0 2.6 Attempted 1.8 1.8
With injury .5 .5 From serious assault .2 .2a From minor assault .3 .3a
Without injury 1.3 1.3
Assault 22.7 f4.6 Aggra'fated 7.8 4.5
Completed with injury 2.4 1.5 Attempted with weapon 5.1l 3.0
Simple 14.9 10.0 Completed with injury 4.4 3.0 Attempted without weapon 10.5 7.0
Crillell of theft 67.5 49.6
Completed 63.3 45.5 Attempted 4.2 4.1
Personal larceny with contact 2.6 3.6 Purse snatching .9 '1.1
Completed .6 .6 AtteiDpted .3 .5
Pocket picking 1.6 2.5
Personal larceny without contact 64.9 46.0 Completed 61.0 42.3
Less than $50 26.9 16.6 $50 or more 31.2 23.0 Amount not available 3.0 2.7
Attempted 3.9 3.7
NOTE: Numbers in parentheses rlefer to population in the group. De tail may not iadd to total shown because of rounding.
34 Criminal Victimization in the United States, 1987
Midwest South West (48,986,130) (67,822,030) (39,313,140)
31.4 26.6 36.5
10.8 9.8 13.2 20.6 16.8 23.3
.8 .7 .6
.2a .4 .3a
.5 .3 .3a
4.9 4.5 6.1 3.2 3.0 3.8 1.2 1.2 2.0
.5 .7 1.0
.7 .5 .9 2.0 1.8 1.8 1.7 1.5 2.3
.7 .3 .5
.4 .1a .3a
.3 .2a .2a 1.0 1.2 1.8
25.8 21.4 29.7 7.9 7.9 11.1 1.9 2.9 3.3 6.0 5.0 7.8
17 .9 13.5 18.7 5.5 3.5 5.8
12.4 10.0 12.9
69.8 64.3 88.9
65.4 60.6 84.1 4.4 3.8 4.8
2.4 1.8 3.0 1.2 .6 1.0
.8 .5 .7
.4 .1 a .3a 1.2 1.2 2.0
67.5 62.5 85.9 63.5 58.9 81.4 30.2 25.7 35.7 29.7 30.6 42.6
3.6 2.6 3.0 4.0 3.6 4.5
aEstimate is based on about 10 or fewer sample cases.

Table 20. Household crimes, 1987
Victimization rates, by type of crime and race of head of household
.(Rate 2er 1,000 households)
All races Type of crime (91,763,950)
Bouseh01d or±-es 171.4 Completed 144.5 Attempted 26.8 Burglary 61.3
Completed 46.6 Forcible entry 21.4 Unlawful entry without force 25.2
Attempted forcible entry 14.7 Household larceny 94.0
Completed 67.4 Less than $50 37.7 $50 or more 44.5 Amount not available 5.2
Attempted 6.6 Motor vehicle theft 16.1
Completed 10.6 Attempted 5.6
NOTE: Detail may not add to total shown because of rounding. Numbers in parentheses refer to households in the group.
Table 21. Household crimes, 1981
Victimization rates, by type of crime and ethnicity of head of household
(Rate per 1,000 households)
Type of crime
Household orimes
Completed Attempted
Totala (91,763,950 )
171.4
144.5 26.6
Burglary 61.3 Completed 46.6
Forcible entry 21.4 Unlawful entry without force 25.2
Attempted forcible entry 14.7
Household larceny Completed
Less than $50 $50 or more Amount not available
Attempted
Motor vehicle theft Completed Attempted
94.0 67.4 37.7 44.5 5.2 6.6
16.1 10.6 5.6
White Black Other (79,543,610) (10,229,530) (1,990,600)
163.6 232.0 169.3 139.0 169.7 135.5 24.7 42.3 33.9 57.0 94.4 62.6 44.0 66.1 50.3 16.9 39.3 26.6 25.1 26.6 21.5 13.0 26.3 12.3 91.4 116.2 62.2 84.6 11 0.2 74.7 37.7 40.1 26.5 42.3 61.5 44.7
4.6 8.5 3.68
6.7 6.0 7.58
15.2 21.4 24.5 10.2 13.4 10.4 5.0 8.0 14.1
aEstimate is based on about 10 or fewer sample oases.
Hispanic Non-Hispanic (5,041,260) (66,463,110)
226.1 168.0
167.3 141. 6 38.8 26.1
75.3 60.3 56.6 45.9 27.5 21.0 29.2 24.9 18.5 14.4
124.2 92.2 111.7 66.0 44.7 37.2 60.5 43.6 6.5 5.1
12.5 6.3
26.6 15.4 18.6 10.0 7.6 5.4
NOTE: Detail may not add to total shown because of rounding. Numbers in parentheses refer to households in the group.
aTotal includes household heads whose ethnicity was not asoertained.
Criminal Victimization in the United States, 1987 35

Tabla 22. Motor vahlcle theft, 1987
Victimization rates on the basis of thefts per 1,000 households and of thefts per 1,000 vehicles owned, by selected household characteristics
Based on households
Number of Number Rate per Characteristic households of thefts 1,000
Race or head or household All racef.! 91,763,950 1,~78,750 16.1
White 79,543,810 1,210,840 15.2 Black 10,229,530 219,120 21.~ Other 1,990,600 48,790 24.5
Age or head of household 12-19 924,120 40,630 44.0 20-34 26,525,820 592,660 22.3 35-49 26,162,310 440,110 16.8 50-64 18,956,040 296,500 15.6 65 and over 19,195,650 108,8~0 5.7
Fol'II of tenure Owned or being bought 58,715,510 746,900 12.7 Rented 33,048,430 731,850 22.1
Based on vehicles tlumber of vehicles Number owned of thefts
165,528,650 1,575,760 149,881,430 1,304,220 12,393,100 222,75,0 3,254,120 48,790
1,053,950 50,510 46,665,050 623,550 55,486,140 468,070 38,997,690 313,110 23,325,820 120,500
122,190,740 813,830 43,337,900 761,930
NOTE: The number of thefts based on personal crimes of contact and vehicles owned is equal to or higher than burglary occurring in conjunction with the corresponding figure based on households ·motor vehicle thefts take precedence in
o~med
Rate per 1,000
9.5 8.7
18.0 15.0
47.9 13.l! 8.~ 8.0 5.2
6.7 17.6
because the former includes all completed determining the final classification based or attempted vehicle thefts, regardless of on the number of households. the final classification of the event;
Table 24. Household crImes, 1987
Victimization rates, by type of crime and annual family income
(Rate per 1,000 households)
Less than $7,500
Type of crime (13,696,300)
Household crt.es 197.5
Completed 163.5 Attempted 34.0
Burglary 86.3 Completed 63.4
Forcible entry 26.0 Unlawful entry without force 37.4
Attempted forcible entry 22.9
Household larceny 98.9 Completed 91.3
Less than $50 44.6 $50 or more 41.8 Amount not available ~.9
Attempted 7.7
Motor vehicle theft 12.3 Completed 8.8 Attempted 3.5
$7,500-$9,999
(4,837,900)
179.2
150.2 29.0
73.6 58.0 26.8 31.2 15.6
90.1 82.6 34.0 40.3
8.3 7.5
15.6 9.6 6.0
NOTE: Detail may not add to totalshq~n because of rounding. Numbers in parentheses refer to houaeholds in the group; excludes data on families whose income level was not ascertained.
36 Criminaj~ Victimization in the United States,1987

Tabl.23. Household crimes, 1987
Victimization rates, by type of crime and age of head of household
(Rate per 1,000 households)
Type of crime
Houaehold crr.ea
Completed Attempted
Burglary Completed
Forcible entry Unlawful entry without
force Attempted forcible entry
Household laroeny Completed
Less than $50 $50 or more Amount not available
Attempted
Motor vehicle theft Completed Attempted
12-19 (924,120)
318.3
320.4 57.9
173.5 138.1 48.6
89.5 35.4
160.8 152.9 63.6 81.1 8.2a 8.0a
44.0 29.4 14.6a
NOTE: Detail may not add to total shown because of !'ounding. Numbers in parentheses refer to households in the group.
$10,000- $15,000- $25,000-$14,999 $24,999 $29,999
(11,322,600) (17,577,100) (1,2<}II,200)
112.1 110.1 1711.0 146.2 147.1 143.8 26.6 23.1 30.2
10.6 56.9 55.7 53.2 44.1 42.7 26.8 19.1 23.4 26.4 25.1 19.2 17.5 12.8 13.1
89.3 97.3 102.0 84.5 91.3 90.9 39.7 37.9 40.3 40.8 48.8 46.2
4.1 4.6 4.4 4;8 6.0 11.0
lie.8 16.5 16.3 tI.5 11.6 10.2 4.3 4.9 6.1
20-34 35-49 50-64 65 and over (26,525,820) (26,162,310) (18,956,040) <19,195,650)
239.0 111.11 131.1 80.0
199.1 160.7 114.6 68.2 39.9 26.7 22.5 11.8
85.0 65.5 45.1 33.2 62.5 51.4 33.8 .,16.4 31.2 22.1 15.5 11.3
31.3 29.2 1Il.3 1~\. 1 22.6 14.2 11.3 6.,8
131.6 105.0 76.4 41.1 122.0 97.11 71.1 38,',1 53.7 36.,8 31.0 19.~: 63.1 52.9 35.0 14.9 5.3 5.1 5.2 4.3 9.6 7.6 5.2 2.4
22.3 1'.& 15.6 5,.7 14.6 11.9 9.7 3.1 7.7 4,9 5.9 2.0
aEstimate is baaed on about 10 or fewer sample oaaea.
I
$30,000- $50,000 $49,999 or more
(11,623,500) (9,1110,300) .---
164.3 1'(0.1
138.3 145.4 26.0 24.7
49.5 51.6
" 37.8 40.8 19.6 15.8 18.2 25.0 ! 11.7 10.8
96.7 96.4 90.3 89.3 38.8 3~.S 45.3 49.5
6.2 5.2 6.5 7.1
18. j 22.2 10.2 15.4 7.8 6.8
Criminal Victimizati(ln in the United States, 1987 ':J)'

Table 25. HDusehDld burglary, 1987
Victimization rates, by race of head of household, annual family income, and type of burglary
(Rate per 1,000 households)
All Race and income burglaries
lihite Less than $7,500 (10,219,800) 80.6 $7,500-$9,999 (4,005,600) 55.8 $10,000-$14,999 (9,641,BOO) 65.8 $15,000-$24,999 (15,515,800) 54.3 $25,000-$29,999 (6,610,400) 5::.8 $30,000-$49,999 (16,178,100) 48.2 $50,000 or more (8,777,800) 52.1
BI,'lck l,ess than $7,500 (3,094,400) 105.8 $7,500-$9,999 (720,300) 158.4 $10,000-.14,999 (1,464,400) 1<')4.4 .15,000-$24,999 (1,733,500) B3.2 $2',;,000-$29,999 (565,500) 85.0 .3~1,000-$49,999 (1,088,000) 711.7 $50.000 or more (373,500) 2g.9a
NOTE: Detail may not add to total "hown becauiJ,; of rounding. Numbers in pal"entheses r'efer to household,~ in the gr'oup; excludes data on families whose inoOl~e
Table 26. Household larceny, 1987'
Completed burglarl Forcible entry
21.4 20.0 23.7 17.3 21.9 18.4 16.3
39.8 56.1 47.1 35.4 33.1 37.2
Oa
Unlawrul entry Attempted without force forcible entry
40.5 18.6 25.1 10.8 25.6 16.4 25.0 11.9 19.0 11.9 18.7 11.2 25.0 10.7
28.0 38.0 62.8 39.5 32.7 24.6 25.8 22.0 22.88 29.1 11.68 21.9 24.78 4.28
level was not asoertained. aEstimate is based on about 10 or fewer sample cases.
VictimiZlation rates,. by race of head of household, annual family income
" and typ~ of larceny
(Rate ~r 1,000 households)
All household R,lce and income larceniesa
lih1te Less than $7,500 (10,219,800) 97.0 $7,500-$9,999 (4,005,600) 78.4 $10,000-$14,999 (9,641,800) 86.8 $15,000-$24,999 (IS,515,800) 96.8 $25,000-$29,999 (6,610,400) 99 • .3 $.30,000-$49,999 (16,178,100) 94.8 $50,000 or more (8,777,800) 95.3
Black Less than $7,500 (3,094,400) 108.3 $" ,500 -$9,999 (720,300) 153.2 $10,000-$14,999 (1,464,400) 111.0 $15,000-*24,999 (1,733,500) 108.3 $25,000-4'29,999 (565,500) 138.5 $30, ')00-$,'19,999 (1,088,000) 127.9 $50,000 or mora (373,500) 106.7
NOTE: Detail may not add to total shown because of rounding. Numbers in parentheses l'efer to housenolds in the group; excludes data on familie,1\ whose income level was not auoel'tained.
Completed larcenl Attempted Less than $50 $50 or more larceny
45.6 38.8 9.0 32.4 31.4 7.1 39.6 38.3 4.7 38.0 47.9 5.9 41.0 43.4 11.0 39.5 43.1 6.5 35.1 47.6 7.0
b 44.3 50.8 3.5b 45.7 88.1 10.\
41.5 61.3 5.0b 37.4 61.9 6.8
28.0 b 86.3 14 Ib • b 37.5
b 69.3 7,3
b 27.1 79.6 0
alnoludes data, not shown separately, on larcenies for whioh the value of' loss was not ascertained. bEstimate is based on about 10 or fewer sample cases.
38 Criminal V,ictimization.in the United States, 1987
--'-""" ''--~-''-''

Table 27. Motor vehicle theft, 1987
Victimization rates, by race of head of household, annual family income, and type of theft
(Rate per 1,000 househO;.::lc:;d=.s)'--___________________________ _
Race and income
White Less than $7,500 (10,219,800) $7,500-$9,999 (4,005,600) $10,000-$14,999 (9,641,800) $15,000-$24,999 (15,515,800) $25,000-$29,999 (6,610,400) $30,000-$49,999 (16,178,100) $50,000 or more (8,777,,800)
Black Less than $7,500 (3,094,,400) $7,500-$9,999 (720,300) .10,000-$14,999 (1,464,400) $15,000-$24,999 (1,733,500) $25,000-$29,999 (565,500) $30,000-$49,999 (1,088,000) $50,000 or more (373,500)
All vehicle thefts
12.7 13.8 11.6 16.2 15.7 16.6 19.7
10.2 28.0 17.4 19.3 21.2a
31.6 63.5
Completed Attempted .. ~heft9 theft"
8.8 3.9 7.2 6.5 7.3 4.3
11.8 4.4 9.4 6.2 9.7 6.9
14.8 4.9
8'.6 1.6a 24.3 3.7a
13.2 4.2a 11.1 8.2a 18.4a 2.S-16.4 21.2 31.7- 31.8a
NOTE: Detail may not add t(l total shown because of rounding. Number's in parentheses refer to households in the group; excludes data on families whose income level was not ascertained.
aEstimate is based on about 10 or fewer sample cases.
Table 28. Household crlmas, 1987
Victimizc\tion rates, by type of crime and number of persons ill household
~
(Rate per 1,000 households)
One Type of crime (22,036,210)
Household crimes 120.7 Completed 97.8 Attempted 22.9 Burglary 54.8
Completed 40.0 Forcible entry 20.3 Unlawful entry without force 19.6
At~empted forCible entry 14.8
Household larceny 54.9 Completed 50.9
Less than $50 24.1 $50 or more 23.5 Amount not available 3.3
Attempted 4.0 M()tor vehicle theft 11.0
Completed 6.9 Attempted 4.1
Two-three (47,279,750)
167.1
140.4 26.7 60.6 46.1 21.9 24.2 13.8
89.9 83.3 36.9 41.4 5.1 6.6
17.3 11.0 6.3
NOTE: Detail may not add to total shown because of rounding. Numbers in parentheses refer to households in the group; excludes
Four-five (19,352,580)
218.5
187.9 30.6 68.5 52.3 20.1 32.2 16.2
132.4 123.6 50.6 66.4
6.7 8.7
17.7 11.9 5.7
data on households where the number of person~ could not be ascertained. aEstimate .is based on about 10 or fewer sample cases.
Six or more (3,081,030)
303.7
270.7 32.9 82.6 65.9 29.0 36.9 16.8
196.0 183.4 66.5
105.1 11.8 12.5
25.0 21.4 3.6a
Criminal Victimization in the United States, 1987 39

Table 29. Household crimes, 1987
Victimization rates, by type of crime, foml of tenure, and race of tread of household
(Rate pOl' 1,000 households)
Owned or bein~ bought All raoasa White
Rented Blaok All racesa White Blaok
Type of crime (58,715,510) (53,266,170) (4,498,240) (33,048,430) (2,6,277,640 ) (5,731,300 )
Household oriaas 1'10.8 135.9 Completed 121.1 117.5 Attempted 19.7' 18.4 Burglary 47.8 46.2
Completed 38.6 37.2 Foroible entry 17.7 16.7 Unlawful entry without force 20.4 20.4
Attempted forcible entry 9.7 9.1 Household laroeny 80.3 77 .9
Completed 74.7 72.4 Less than $50 33.9 33.6 $50 or more 36.2 34.4 Amount not available 4.7 4.4
Attempted 5.5 5.6 Motor vehicle theft 12.7 11.7
Completed 8.4 7.9 Attempted 4.4 3.8
NOTE: Detail may not add to total shown because of rounding. Numbers in parentheses refer to households in the group.
40 Criminal Victimization in the United States, 1987
196.1 225.8 219.9 260.1 164.0 186.2 182.5 209.9 32.2 39.6 37.4 50.2 66.5 85.3 78.8 116.3 48.7 61.8 57.9 79.8 28.1 28.0 23.4 48.1 20.7 33.8 34.4 31./ 17.8 23.5 20.9 36.5
106.7 118.4 118.8 123.6 101.7 109.!' 109.9 116.8
39.0 44.5 45.9 1:1.0 54.0 59.2 58.3 b7.5
B.8 6.1 5.7 8.3 5.0 8.5 8.9 6.8
22.9 22.1 22.4 20.3 13.5 14.5 14.8 13.3 9.3 7.7 7.6 6.9
8Includes data on "other" races, not shown separately.
Table 31. Household crlm,9s, 1'987
Victimization rates, b~' type of crime and type of locanty of .residence
(Rate per 1,000 households)
Total
All Central areas cities
Outside central cities
Type of crime (91,763,950) (29,258,750) (37,609,390)"
Household crimes 171.11 223.7 154.8
Completed 144.5 185.7 131.1 Attempted 26.8 38.0 23.7
Burglary 61.3 76.5 54.3 Completed 46.6 56.6 41.3
Forcible entry 21.4 29.8 18.4 Unlawf'ul entry without force 25.2 26.8 22.9
Attempted forcible entry 14.7 19.8 13.0
Household larceny 94.0 124.5 83.4 Completed 87.4 114.9 78.3
Less than $50 37.7 46.2 34.4 $50 or more 44.5 61.4 39.8 Amount not available !:i.2 7.3 4.0
Attempted 6.6 9.6 5.2
Motor ?ehicle theft 16.1 22.7 17.1 Completed 10.6 14.2 11.6 Attempted 5.6 8.6 5.5
NO'fg: The population range categories show" und~)r the heading "Metropolitan areas" are based on tile size of the central city and do not refleot the population of' the entire metropolitan

Table 30. Householdcrlmas, 1987
Victimization raltes, by type of crime and number of units in structure occ'upied by household
(Rate Eer 1,000 houlleholds)
Onsa Two Three Other than
Four Five-nine Ten or more hnusing \Init Type of crime (64,894,000) (6,093,400) (1,622,000) (2,887,000) (5,072,000) (10,109,800) (881,700)
Household crimes 159.9 220.2 197.0 2'7.9 220.2 156.8 258.1 Completed 136.9 179.5 171.1 194.3 181.2 127.7 226.0 Attempted 23.0 40.7 25.9 53.7 39.0 29.1 32.1 Burglary 56.0 71.5 59.2 91.8 89.1 61.4 116.2
Completed 43.6 48.8 45.9 62.9 65.8 44.9 100.9b Forcible entry 20.1 22.3 22.9 27.8 30.6 21,7 15.8
Unlawful entry witnout force 23.5 26.5 23.0 35.1 35.2 23.2 85.1
AttelDpted forcible tlntry 12.4 22.7 13.2 28.9 23.2 16.6 15.3b
Hou$~hold larceny 91.1 122.8 119.6 126.9 106.9 73.1 118.8 Completed 84.7 115.5 112.9 115.7 98.2 67.5 116.6
Less thi'll) $50 37.2 53.3 33.9 52.2 35.8 26.9 57.7 $50 or more 42.3 55.1 67.5 57.4 57.5 37.2 56.4 Amount not available 5.2 7.1 11. 4b 6.2 4.9 3.4 2.5b
Attempted 6.4 7.3 6.7 11.2 8.7 5.7 2.3 b
Motor vehicle theft 12.9 25.9 18.3 29.3 24.1 22.2 23.0 Completed 8.6 15.1 12.3
b 15.7 17.1 15.4 8.6 b Attempted 4.3 10.~ 5.9 13.6 7.1 6.8 14.4 b
NOTE: De tail may not add \;0 total shown because of rounding. alnoludes data on mobile homes, not shown separately. bEstimate is based on about 10 or fewer sample cases. Numbers in parentheses refelr to households in the group;
excludes data on households where the number of units in structure could not be ascertained.
Metropolitan a~eas 50,000-249,999 250,000-499,999 500,000-999,999 1 ,000,000 01" more
Outside Outside Central central Central central cities cities cities cities
(9,057,530)(12,505,110) (5,779,200) (9,508,200)
22\).3
186.3 34.0
70.4 54.1 23.9
30.3
16.2
138.8 125.4 57.8 60.9 6.8
13.4
11. 1 6.8 4.4
139.9
119.7 20.3
54.4 42.5 17.4
25.1
11.9
74.9 70.6 31.4 35.6
3.6 4.4
10.6 6.6 4.0
228.9
191.9 37.1
76.9 57.2 30.6
26.6
19.6
125.5 115.8 50.4 58.1
7.3 9.7
26.6 18.8 7.8
155.1
132.2 22.9
51.8 39.9 19.7
20.1
11.9
87.4 81.0 36.6 39.3 5.1 6.4
15.9 11.3 4.6
areas. Detail may not add to total shown because of rounding. Numbers in parenthese's refer to households in the group.
Central cities
(6,136,070)
2117.6
205.2 42.4
86.5 64.0 34.5
29.4
22.5
131.7 122.7 48.8 66.3 7.6 9.1
29.4 18~6 10.8
Outside central cities
(8,052,520)
165.5
137.8 27.8
51.9 36.6 13.5
23.1
15.3
90.4 85.8 39.0 43.4
3,3 4.7
23.2 15.4 7.8
Central cities
(8,285,950)
206.0
166.2 39.8
75.5 53.5 32.3
21.2
22.0
102.7 96.9 28.6 60.6 7.7 5.8
27.9 15.9 12.0
Outside central oities
(7,543,550 )
167.7 141.8 26.0
59.9 46.2 23.8
22.4
13.7
85.0 79.6 31.5 43.7 4.3 5.4
22.9 16.1 6.8
Nonmetropolitan areas
(24,895,810)
134.9 116.4
18.5
53.9 42.8 15.9
26.9
11.1
74. 'I 68.8 32.7 31.6 4.5 5.3
6.9 4.8 2.1
Criminal Victimization in the United States, 1987 41

Table 32. Household crimes, 1987
Victimization rates, by type of locality of residence, race of head of household, and type oif crime
(Rate 2er 1,000 households)
Completed Attempted Household household household
Area and race crimes crimes crimes
All areas White (79,543,810) 163.6 139.0 24.7 Black (10,229,530) 232.0 189.7 42.3
MetropolItan areas Central cities
White (22,262,750) 216.8 181.8 35.1 Black (6,147,260) 254.3 '!05.6 48.6
Outs1de central aities White (34,450,380) 151.0 128.6 22.4 Black (2,356,930) 210.6 171.6 39.0
Nonaetropolitan areas White (22,830,670) 130.8 H2.8 18.0 Black (1,725,340) 181.8 157.6 24.2
NOT8: Numbers in parentheses refer to households in the group. a8stimate is based on about 10 01' fewer sample cases.
Table 33. Household crimes, 1987
Victimization rates, by type of crime and region
(Rate per 1,000 households)
All regions Northeast Midwest Type of crime (91,763,950) (19,176,130) (22,869,500)
Household crimes 171.4 115.9 166.0
Completed 144.5 95.0 137.5 Attempted 26.8 20.9 28.5 Burglary 61.3 40.7 59.1
Completed 46.6 29.3 44.6 Forcible entry 21.4 15.2 18.1 Unlawful entry without force 25.2 14.0 26,5
Attempted forcible entry 14.7 11.5 14.5 Household larceny 94.0 60.2 91.8
Completed 87.4 56.3 84.8 Less than $50 37.7 21.0 43.0 $50 01' more 44.5 30.2 36.3 Amount not available 5.2 5.1 5.5
Attempted 6.6 3.9 7.1 Motor vehicle theft 16.1 15.0 15.0
Completed 10.6 9.5 8.2 Attempted 5.6 5.5 6.8
NOT8: Detail may not add to total shown because of rounding. Numbers in parentheses refer to households in the group.
42 Criminal Victimization in the United States, 1987
Motor Household vehicle
Burglary larceny theft
57.0 91.4 15.2 94.4 116.2 21.4
68.8 125.6 22.4 105.5 125.8 22.9
52.9 82.1 16.0 73.0 106.8 30.7
51.7 72.2 7.0 84.0 94.4 3.5&
South West (31,293,030) (18,425,290)
179.1 222.8
153.2 190.1 25.9 32.6
70.6 69.6 54.1 54.4 27.1 22.2
27.0 32.2 16.4 15.2
94.1 131.6 88.9 120.4 35.3 52.5 48.7 62.3 4.9 5.5 5.2 11.2
14.4 21.6 10.1 15.4 4.3 6.2

Table 34. Personal crimes of violence, 1987
Number of victimizations and victimization rates for persons age 12 and over, by type of crime and victimwoffender rel~ltionship
(Rate per 1/000 population aBe 12 and over)
Involving strangers
Type of orime Number Rate
Crt.es or violenoe 3,221,280 16.3 Completed 1,118,610 5.7 Attempted 2,102,670 10.6 Rape 76,660 .4
Completed 32,670 .2 Attempted 43,990 .2
Robbery 823,240 4.2 Completed 521,630 2.6
With injury 207,980 1.1 From serious assault 101,220 .5 From minor assault 106,760 .5
Without injury 313,650 1.6 Attempted 301,600 1.5
With injury 72,370 .4 From serious assault 37,010 .2 From minor assault 35,360 .2
Without injury 229,240 1.2 Assault 2,321,380 11.7
Aggravated 935,780 4.7 Completed with injury 226,330 1.1 Attempted with wee,pon 709,450 3.6
Simple 1,385,600 7.0 Completed with injury 337,970 1.7 Attempted without weapon 1,047,630 5.3
NOTE: Detail may not add to total shown beoause of rounding. aEstimate is based on about 10 or (ewer sample cases. Z: Less than .05 per 1,000.
Involving nonatransers
Number Rate
2,1139,290 12.3 967,350 4.9
1,471,950 7.4 64,230 .3 32,130 .2 32,100 .2
207,220 1.0 156,510 .8 6'7,670 .3 28,830 .1 38,840 .2 88,840 .4 50.710 .3 24,730 .1
7,720 (Z)a 17,010 .1 25,980 .1
2,167,840 11.0 607,380 3.1 254,470 1.3 352,910 1.8
1,560,460 7.9 524,230 2.7
1,036,230 5.2
Criminal Victimization in the United States, 1987 43

Table 35. Personal crimes of violence. 1987
Percent of victimizations involving strangers, by sex and age of victims and type of crime
-~
Crimes Completed Attempted of violent violent
Sex and age violenoe orimes orimes Rape
Both seltes 56.9 53.6 58.8 54.4 12-15 46.7 42.5 119.9 70.6a 16-19 55.9 54.9 56.4 53.3 20-24 59.1 53.3 62.1 65.0 25-34 58.0 50.9 62.5 46.4 35-49 58.2 58.4 58.1 51.9a 50-64 62.3 73.7 54,8 all 65 and over 68.5 72.0 65.6 all
Male 65.2 62.1 66.4 55.4a 12-15 53.9 46.5 60.7 63.3a 16-19 64.0 66.8 62.7 Oa 20-24 70.9 70.2 71.3 100.0a 25-34 67.1 61.2 70.1 Oa 35-49 65.2 68.4 64.1 Oa 50-64 68.3 73.7 64.4 Oa 65 and over 60.0 61.6 58.6 Oa
Feule 114.1 41.1 45.7 54.3 12-15 34.4 33.7 34.8 74.7a 16-19 39.2 35.1 42.0 53.3 20-24 41.5 34.0 46.2 62.8 25-34 45.0 40.0 49.3 48.3 35-49 47.8 47.8 47.9 51.9a 50-64 52.6 73.6 40.8 Oa 65 and over 74.6 79.4 70.6 oa
aEstimate is based on about 10 01' fewer sample caaes.
Table 36. Personal crimes of violence. 1987
Percent of victimizations involving strangers, by sex and race of 'lfictims and type of crime
CrimeB Completed Attempted Robber;t Assa,:,lt ot violent violent With Without
Sex and raoe violence crimes crimes Rape Total injury injury To·tal Aggravated Simple
Both lHIltell White 57.0 53.3 59.1 46.8 79.2 75.3 81.5 52.9 61.0 49.1 Black 56.81 56.9 56.8 70.3 81.6 76.3 84.2 44.7 57.9 33.4
Male White 66.1 64.0 67.2 55.411 85.1 82.3 86.6 62.5 67.2 59.8 Black 59.9 59.5 60.2 Oa 77.9 71.9 80.9 51.9 62.6 39.4
Fellllle White 42.3 37.9 45.0 45.7 69.4 65.5 72.2 36.6 46.2 33.3 Black 52.8 54.4 51.3 70.3 87.1 63.3 88.7 34.2 47.1 27.3
aEstimate is based on about 10 01' fewer sample cases.
44 Crlmintll Victimization in the United States. 1987

Robber}; Assault With Without
Total injury injury Total Aggravated Simple
79.9 75.2 82.5 51.7 60.6 117.0 77.6 85.2 74.6 41.2 46.5 39.2 67.7 46.0 77.2 54.1 63.8 48.0 79.3 77.3 80.6 55.0 63.4 51.1 80.3 75.2 82.6 51.7 59.7 47.5 82.4 79.0 84.7 52.9 60.6 48.2 91.8 78.4 100.0 50.2 67.1 38.7 88.5 86.9 91.0 59.5 70.0 53.6
83.1 79.1 85.2 61.2 66.3 57.9 77.5 89.3 72.3 49.4 49.2 '49.5 80.8 66.5 86.4 61.5 70.9 54.7 86.6 83.6 89.1 67.7 69.0 66.8 82.7 75.8 85.5 62.4 66.6 59.9 85.1 89.4 81.2 61.4 66.3 58.0 87.4 62.2a 100.0 59.8 72.0 50.6 72.1 8 69.1 a 75.28 56.5 66.38 51.7
711.9 69.4 78.2 36.0 117.2 31.9 77.9 70.08 80.2a 27.7 39.3 24.9 41.2 12.8a 56.5a 37.2 41.7 35.1 66.0 62.1a 68.0 35.7 47.7 32.4 76.4 74.4 77.5 35.2 45.5 31.1 79.3 62.7a 87.8 39.1 48.3 35.0
100.0 100.08 100.08 35.9 58.7 22.38
94.8 92.2 100.08 62.5 73.08 55.7
Table 37. Personal crImes of vlolence,1987
Percent of victimizations involving strangers, by sex and marital status of victims and type of crime
Crimes Completed Attempted Robber:/: Assault Sex and marital of violent violent With Without status violence crimes crimes Rape Total injury injury Total Aggravated Simple
Both sexes Never married 58.0 55.5 59.5 54.6 80.2 74.5 83.2 53.0 61.1 49.0 Married 6:>.5 63.8 63.4 67.98 83.4 84.4 82.9 59.0 67.9 53.7 Widowed 68.9 68.9 68.8 49.1 8 86.1 77.3 93.8 57.4 63.1 53.4 Divorced or separated 39.1 33.0 44.1 45.28 70.4 60.6 77.6 33.4 44.3 28.0
Male Never married 65.7 62.4 67.5 55.48 84.1 79.2 86.9 61.6 66.2 58.9 Married 66.3 68.7 65.4 08 85.9 84.9 86.5 62.4 70.0 57.5 Widowed 79.0 62.38 100.08 08 86.88 100.08 85.08 71.28 47.88 100.08
Divorced or separated 56.1 51.2 59.7 08 71.9 61.88 78.6 52.1 56.4 48.4
Feaale Never married 43.3 44.3 42.5 54.5 72.7 63.8 76.8 34.9 44.3 31.9 Married 57.3 53.7 58.9 67.98 78.9 83.4 76.2 50.9 62.0 45.4 Widowed 66.2 70.8 61.9 49.1 8 85.9 75.8 100.0 54.4 68.08 45.9 Divorced or separated 30.3 24.4 35.,11 45.28 69.0 59.7 76.7 24.2 33.5 20.9
aEstimate is based on about 10 or fewer sample cases.
Criminal Victimization in the United States, 1987 45

~'.
Table 38. Personal crimes of \'lolence,1987
Percent of victimizations involving strangers, by race and annual family income of victims and type of crime
Crimes Completed Attempted Robber~ Race and annual of violent violent With family income ,riolence orimes crimes Rape Total injury
All racella Less than $7,500 48.3 46.4 49.8 45.0
b 70.9 66.4
$7,500-$9,999 56.4 48.2 62.6 100.0b
74.3 69.5 $10,000-$14,999 56.1 50.4 59.4 100.0 82.6 71.1 $15,000-$24,999 56.0 55.6 56.1 59.Sb 87.2 86.2 $25,000-$29,999 63.6 59.7 65.9 38.4b 90.4 77 .6 $30,000-$49,999 59.5 57.8 60.3 48.7 b 80.5 77.4 $50,000 or more 65.1 58.9 67.7 61.6b 76.9 84.8 b
White 19.0b Less than $7,500 46.8 43.9 48.9 69.9 65.7
$7,500-$9,999 60.8 55.4 64.3 100.0~ 79.6 84.0 $10,000-$14,999 56.0 48.4 60.0 100.0
b 75.1 51.4 b
$15,000-$24,999 56.9 56.8 57.0 57.6 91.9 88.6 $25,000-$29,999 63.2 58.0 66.6 65.3~ 88.8 72.4 b $30,000-$49,999 58.4 56.6 59.4 36.2b
78.2 76.6 $50,000 or more 64.9 60.6 66.7 61.6 77.9 100.0b
Black Less than $7,500 52.1 51.0
b 52.9b
76.2b 70.3
b 65.7 b $7,500-$9,999 38.1 28.5 49.6 0 41.5 0 $10,000-$14,999 57.3 59.6 55.4 100.0b 96.2 91.0 $15,000-$24,999 50.2 49.9 50.3 68.8 b 64.0 b 75.6~ $25,000-$29,999 73.1 84.4b 68.7 Ob 100.0b 100.0
b $30,000-$49,999 65.8 67.7 64.1 100.0~ 100.0b 100.0 $50,000 or more 74.0 58.2b 81.6b
° 100.0b 100.0b
NOTE: Excludes data on persons whose family income level was not asoertained. ~Inoludes data on "other" raoes, not shown separately. Estimate is based on about 10 or fewer sample cases.
Table 39. Personal crimes of violence, 1987
Percent distribution of single-offender victimizations, by type of crime and perceived sex of offender
Perceived sex of offender
Without injury
73.2 78.6 87.6 87.9 95.9 82.3 74.6
73.0 76.0 82.3 94.2 95.3 79.3 73.6
71.7 100.0b 100.0 55.1 b
100.0~ 100.0 100.0b
Not known and not
Type of orime Total Male Female available
Crt.es of violence (4.175.130 ) 100.0 85.6 13.7 .7 Completed (1,459,690) 100.0 85.2 14.0 .88
Attempted (2,715,450) 100.0 85.8 13.5 .7
Rape (131,090) 100.0 98.3 Oe 1.7a
Robbery (567,460) 100.0 92.7 6.8 .5a Completed (355,580) 100.0 90.2 9.0 .8a
With injury (143,840) 100.0 91.2 6.9a 1.9a Without injury (211,740) 100.0 89.5 10.5 Oa
Attempted (211,880) 100.0 97.0 3.08 08
With injury (62,330) 100.0 96.4 3.68 Oa Withou& injury (149,550) 100.0 97.2 2.8a Oa
Assault (3,476,580) 100.0 84.0 15.3 .7 Agv,ravated (1,090,700) 100.0 86.6 12.7 .7a Simple (2,385,880) wo.O 82.8 16.5 .7
NOTE: Detail may not add to total shown aEatimate Is based on about 10 or because of rounding. Number of Yiotimi- or fewer sample oases. zations shown in parentheses.
46 Criminal Victimization in the United States, 1987
Assault
Total Aggravated Simple
41.9 44.8 40.3 51.7 58.9 47.7 50.2 64.1 42.9 50.3 55.9 47.4 59.4 73.7 51.0 55.2 71.9 48.3 63.3 73.1 58.9
42.8 43.6 42.4 55.7 68.1 50.3 52.5 63.7 47.0 51.4 55.9 49.2 58.7 72.5 50.4 54.6 69.2 49.2 63.0 71.9 58.7
39.9 47.8 33.6b 37.3 46.1 8 26.4
41.2 63.8 21.9b 43.4 !j7.9
b 38 Ob
76.2 • b
83.2 71.5b 54.4 86.1 22,3b 68.0b Ob 68.0

~~~~~--~----------------------------------------~~
Table 40. Personal crimes of violence, 1987
Percent distribution of single-offender victimizations, by type of crime and perceived age of offender
Peroeived ase of orfender
12-20 Type of orime Total Under 12 Total 12-14 15-17 lB-20
Crt.es or Violence (11,175,130) 100.0 .7 27.9 5.1 10.9 12.0 Completed (1,459,690) 100.0 1.l a 30,.9 5.6 11.0 14.2 Attempted (2,715,450) 100.0 .5a 26.4 4.7 10.8 10.8 Rape (131,090) 100.0 08 20.0 1.4a 10.38 B.38
Robbery (567,460) 100.0 .48 25.2 2.8 B.l 14.3 Completed (355,580) 100.0 .68 21.8 3.,a 5.9 12.8
With injury (143,840) 100.0 1.48 22.7 1.38 5.38 16.0 Without injury (211,740) 100.0 oa 21.2 4.4a 6.38 10.5
Attempted (211,880) 100.0 08 30.9 2.3& 11. 7 16,9 With injury (62,330) 100.0 Oa 21.68 2.28 9.28 10.21l
Without injury (149,550) 100.0 Oa 34.8 2.48 12.8 19.7 Assault (3,476,580) 100.0 .7 28.7 5.6 11.4 11.8
Aggrav8ted (1,090,700) 100.0 1.0a 28.3 4.0 11.5 12.8 Simple (2,365,880) 100.0 .68 28.9 6.3 11.3 11.3
NOTE: Detai~ may not add to total shown beoause of rounding. aEstimate is based on about Number of viotimizations shown in parentheses.
Table 41. Personal crimes of Violence, 1987
Percent distribution of single-offender victimizations, by type of crime and perceived race of offender
Peroeived raoe of offender Not known and not
Type of orime Total White Black Other aV8ilable
Crt.es or violenoe (11,175,130) 100.0 67.6 25.11 5.6 1.4
Completed (1,459,690) 100.0 66.0 27.1 5.6 1.2 Attempted (2,715,450) 100.0 66.4 24.4 5.6 1.5
Rape (131,090) 100.0 56.4 32.0 11.68 08
Robbery (567,460) 100.0 39.6 51.0 7.1 2.38
Completed (355,560) 100.0 37.6 53.5 6.6 1.98 With injury (143,640) 100.0 43.5 49.0 5.6 11 1.9a Without injury (211,740) 100.0 33.9 56.5 7.7 1.9a
Attempted (211,660) 100.0 42.6 46.9 7.6 3.08
With injury (62,330) 100.0 53.3 43.6 3.1a Oa Withou!: injury (149,550) 10n.0 36.1 48.2 9.5a 4.28
Assault (3,476,560) 100.0 72.5 20.9 5.2 1.4 Aggravated (1,090,700) 100.0 65.9 26.3 6.4 1.38
Simple (2,385,860) 100.0 75.6 18.5 4.6 1.4
NOTE: Detail may not add to total shown aEstimate 1s based on about 10 01'
beoause of rounding. Number ot' vic.t1mi- fewer sample cases. zations shown in parentheses.
Not known 30 and and not
21-29 over available
35.3 32.6 3.5 34.5 29.6 3.9 35.7 34.2 3.3 25.3 50.0 4.7-
42.3 24.4 7.7 45,1 24.3 8.2 50.0 15.8 10.1 a 41.8 30.2 6.aa 37.6 24.6 6.8a 49.8 28.5 Oil 32.5 23.0 9.7-
34.5 33.2 2.6 31.4 36.4 2.6 35.9 31.8 2.6
10 01' fewer sample oases.
Criminal Victimization in the United States, 1987 47

Table 42. Personal crimes of violence, 1987
Percent distribution of single-offender victimizations, by type of crime, age of victims, and perceived age of offender
Perceived age of offender
Type of crime and 12-20 age of victim Total Under 12 Total 12-14 15-17 18-20
cr:t.ea ot Ylo1encea 12-19 (1,209,620) 100.0 1.9
b 65.2 15.9
b 28.2 21.1
20-34 (1,991,020) 100.0 .2b
12.8 .\ 3.2 9.3 35-49 (674,890) 100.0 0 13.6 1.\ 6.6
b 6.0
b 50-64 (200,150) 100.0 Ob 9.4 1.8 .8b
6.8 65 and over (99,470) 100.0 2.0b 12.3b 2.e>b 3.1 7.2b
Robbery 1.6b 10.3b 12-19 (126,860) 100.0 60.6 22.3 28.0
20-34 (277,230) 100.0 Ob 14.5 Ob 4.9b 9.6b 35-49 (93,880) 100.0 Ob 13.9 b b 4 lb 1.\ 8.3
50-611 (40,610) 100.0 Ob 23.4b • b 19.4b 4.0 °b 65 and over (28,880) 100.0 Ob 11.2b Ob 0 11.2b
Assault 12-19 (1,039,470) 100.0 2.0 66.4 17.\ 28.8 20.6 20-34 (1,635,290) 100.0 .2b 12.8 .4 3.0 9.4 35-49 (5': },470) 100.0 Ob 13.8 LOb 7.\ 5.6
b 50-64 (159,540) 100.0 Ob 5.8 b 1.2b 1.0 3.6 65 and over (68,810) 100.0 2.9 b 13.1 b 2.9b 4.5 b 5.7 b
NOTE:
Not known 30 and and not
21-29 over available
20.0 11.5 1.4 47.5 35.9 3.7 28.0 53.9 4.5 35.0 47.4 8.2 27.6 49.0 9.1 b
10.0b 3.0b 24.7 50.3 30.0 5.2b 49.4 28.5
b 8.2b
29.9 b 30.3b 16.4 37.8b 32.8b 18.1 b
19.4 11.0 1.l b
47.9 35.7 3.4 24.5 57.& 3.9
b 36.3 55.3 2.6 24.0 511.5 5.6b
Detail may not add to total shown because of rounding. aIncludes data on rape, not shown separately. Number of victimizations shown in parentheses. bEstimate is based on about 10 or fewer sample cases.
4,8 Criminal Victimization in the United States. 1987

Table 43. Personal crimes of violence, 1987
Percent distribution of single-offender victimizations, based on race of victims, by type of crime and perceived race of offender
"1\ '~,
Peroeived raoe of offender Not known
Type of crime and and not race of viotim Total White Blaok Other available
Criaes of Yiolence White (3.454.930) 100.0 78.5 15.2 5.0 1.4 Bl_ok (638,lf30) 100.0 11.1 82.0 4.5 1.8-
Completed White (1,180,040) 100.0 78.9 14.9 5.0 1.2-Black (239,220) 100.0 7.2 89.9 1.1· 1.8-
Attempted White (2,274,880) 100.0 78.2 15.3 5.0 1.5 Black <399,210) 100.0 14.3 77.3 6.6 1.8-
Rape White (81,350) 100.0 78.4 14.48 7.2& 0· Black (40,260) 100.0 11.1 8 70.4 18.58 0·
Robbery White (396,770) 100.0 53.4 37.9 6.9 1.88
Black (157,400) 100.0 8.1 a 86.0 3.0· 3.0· Completed
White (241,260) 100.0 52.1 40.3 5.6 8 2.0· Blaok (102,330) 100.0 8.48 87.2 2.5· 1.98
With injury White (102,540) 100.0 57.4 36.2 3.78 2.7· Blaok (37,020) 100.0 9.8a 90.2 0· 08
Without injury White (138,720) 100.0 48.2 43.2 7.1· 1.5· Blaok (65,310) 100.0 7.68 85.5 4.08 2.9·
Attempted White (155,510) 100.0 55.3 34.2 9.08 1.48
Black (55,070) 100.0 7.58 83.7 3.9· 5.0· With injury
White (38,800) 100.0 75.1 20.08 4.9- 0· Blaok (23,530) 100.0 17.58 82.5 0· 0·
Without il1jury White (116,710) 100.0 48.8 39.0 10.38 1.9· Black (31,540) 100.0 0· 84.5 6.7· 8.7-
Assault White (2,976,810) 100.0 81.8 12.2 4.7 1.4 Black (440,780) 100.0 13.0 81.7 3.8 1.5·
Aggravated White (877,390) 100.0 78.4 14.3 6.2 1.1 8
Black (188.260) 100.0 9.4 83.7 4.38 2.6a Simple
White (2,099,420) 100.0 fl3.2 11.3 4.0 1.5 Black (252,520) 100.0 15.7 80.1 3.4- 0.8a
NOTE: Detail may not add to total shown aEstimate is based on about 10 or because of rounding. Number of victimi- fewer sample cases. zations shown in parentheses.
Criminal Victimization in the United States, 1987 49

Table 44. Personal crimes of violence, 1987
Percent diistribution of single-offender victimizations, based on perceived race of offender, by type of crime and race 'of victims
Type of crime and race of victim Total White
Cr1aes of YiolenC8 (II,O!H,360) (2,785,1'10) White 84.'1 97.3 Black 15.6 2.7
Completed (1,419,260) (948,650) White 83.1 98.2 Black 16.9 1.8
Attempted (2,674,090) (1,836,490 ) White 85.1 96.9 Black 14.9 3.1
Rape (121,610) (68,230) White 66.9 93.5 Black 33.1 6.58
Robbery (554,170) (224,550) White 71.6 94.3 Black 28.4 5.78
Completed (343,590) (134,370) White 70.2 93.6 Black 29.8 6.4a
With injury (139,560) (62,510) White 73.5 94.2 Black 26.5 5.8a
Without injury (204,030) (71,870) White 68.0 93, 1 Bl8ck 32.0 6.9a
Attempted (210,580) (90,180) White 73.8 95.4 Black 26.2 4.68
With injury (62,330) <33,240 ) White 62.2 87.6 Black 37.8 12.4a
Without injury (148,250) (56,940) White 78.7 100.0 Black 21.3 08
Assault (3,417,590) (2,492,360) White 87.1 97.7 Black 12.9 2.3
Aggravated (1,065,650) (705,680) White 82.3 97.5 Black 17.7 2.5
Simple (2,351,940) (1,786,680) White 89.3 97.8 Black 10.7 2.2
NOTE: Number of victimizations shown in parentheses. aEstimate is based on about 10 01' fewer sample cases.
50 Criminal Victimization in the United States. 1987
Perceived race of offender Not known and not
Black Other available
(1,0117,830) (201,500) (58,890) 50.0 85.7 80.6 50.0 14.3 19.411
(390,440 ) (61,940) (18,230) 44.9 95.8 77.0a 55.1 4.2a 23.0B
(657,390 ) (139,570) (40,650) 53.1 81.2 82.2 46.9 18.8 17.8a
(40,020) (13,360) (0) 29.28 44.1 8 08 70.8 55.9a Oa
(285,700) (32,250) (11,660) 52.6 85.3 60.1 8
47.4 14.78 39.9a (186,370) (16,160) (6,690 )
52.1 83.88 71.68
47.9 16.28 28.48
(70,550) (3,770) (2,730 ) 52.7 100.0a 100.08 47.3 08 08
(115,810) (12,390) (3,950) 51.8 78.9a 51.9a 48.2 21.1 8 48.1 a
(99,340) (16,090) (4,970) 53.6 86.8a 44.7a 46.4 13.28 55.38
(27,180) ( 1,900) (0 ) 28.68 100.0a 08
71.4 08 08
(72,140) (14,180) (4,970) 63.0 85.0a 44.7 a 37.0 15.0a 55.38
(722,110) (155,890) (47,220 ) 50.2 89.3 85.6 49.8 10.7 14.48
(282,950) (62,610) (14,410) 44.3 87.1 66.58 55.7 12.98 33.58
(1139,150) (93,280) (32,810) 53.9 90.9 94.1 46.1 9.1 a 5.9a
Table 45. Personal crlmas of violence, 1987
Percent- distribution of single-offender victimizations, by type of crime and detailed victim-offender relationship
Type of crime Total Total Spouse
Cr!.es of violence (2,060,050) 100.0 20.3 6.8
Completed (812,450) 100.0 27.0 12.5 Attempted (1,247,600) 100.0 15.9 3.1
Rape (55,670) 100.0 30.5 13.0b
Robbery (158,750) 100.0 25.2 b 7.3b Completed (121,800) 100.0 26.5 9.6b Attempted (36,960) 100.0 21.3b 0
Assault (1,845,620) 100.0 19.5 6.6 Aggravated (486,880) 100.0 18.3 5.0 Simple (1,358,750) 100.0 20.0 7.1
NOTE: Detail may not add to total shown because of rounding. Number of victimizations shown in pa.z'antheses. alncludes data on offenders well known to the victim whOse

Table 46. Person~1 crimes of violence, 1987
Percent distribution of multiple-offender victimizations, by type of crime and perceived sex of offenders
Peroeived sex of offenders Not known
All All Uale and and not Type. of orime Total male f·amale famale available
Crimes ot violenoe (1,378,2l10) 100.0 76.1 5.lI 17.0 1.lI Completed (597,460) 100.0 77.9 4.5 16.4 1.28
Attempted (780,790) 100.0 711.8 6.1 17.4 1.68
Rape (9,810) 100.08 100.0a OB Oa Oa
Robbery (441,780) 100.0 84.0 3.68 11.5 .98
Completed (303,490) 100.0 83.4 3.2a 12.1 1.38
With injury (125,640) 100.0 85.9 Oa 12.78 1.48
Without injury (177,840) 100.0 81.6 5.4a 11.7 1.38
Attempted (138,290) 100.0 85.5 4.4a 10.1 8 08
With injury (34,760) 100.0 83.1 5.1 a 11.7a 08
Without injury (103,530) 100.0 86.3 4.1 8 9.58 08
Assault (926,660) 100.0 72.1 6.4 19.8 1.7a Aggravated (396,730) 100.0 71.8 .98 25.1 2.2a Simple (529,930) 100.0 72.3 10.5 15.8 1.38
NOTE: Detail may not add to total shown aEstimate is based on about 10 or because of rounding. Number of viotimi- fewer sample oases. zations shown in parentheses.
Related Ex- Own 'Brother or Other Well-known Casual spouse Parent child sister relative not relateda acquaintance
lI.2 1.3 1.5 2.9 3.6 78.3 1.4
4.1 1.7b 1.8b 3.3 3.6 71.8 1.2b
4.3 1.1b 1.3 2.6 3.6 82.6 1.5
6.6 b Ob Ob Ob 10.9b 69.5 Ob
7.4 b 1.1 b 2.3b 4.5 b 2 7b 73.5 1.2b 6.1 b 1.5b 1.4b 4.4 b • b
71.9 1.6b 3.\
11.4b Ob 5.0b 4.9 b 0 78.7 ob
3.9 1.\ 1.5 b 2.8
b 3.4 79.0 1.4b 3.9 2.5b
.7 1.3 4.9 80.6 1.1 3.9 1.0 1.7 3.4 2.9 78.5 1.5
relationship to the victim could not be asoertained. bEstimate is based on about 10 or fewer sample cases.
Criminal Victimization in the United States, 1987 51

Table.47. Personal crImes of vIolence, 1987
Percent distribution of multiple-offender victimizations, by type of crime and perceived age of offenders
Perceived age of offenders
All All All Type of crime Total under 12 12-20 21-29
Cri.as of violence (1,378,2_0) 100.0 .98 3_.0 17.7
Completed (597,460) 100.0 .38 30.1 20.9 Attempted (780,790) 100.0 1.3a 37.0 15.3
Rape (9,810) 100.08 Oa 62.3a Oa
Robbery (441,780) 100.0 Oa 25.5 22.6 Completed (303,490) 100.0 Oa 22.3 27.2
With injury (125.640) 100.0 Oa 18.2 18.9 Without injury (177,840) 100.0 08 25.2 33.1
Attempted (138,290) 100.0 Oa 32.4 12.4 With injury (34,760) 100.0 08 11.7a 26.5a Without injury (103,530) 100.0 08 39.4 7.7a
Assault (926,660) 100.0 1.3a 37.8 15.6 Aggravated (396,730) 100.0 .5a 32.9 11.4 Simple (529,930) 100.0 1.9a 41.4 18.8
NOTE: Detail may not add to total shown because of rounding. Number of victimizations shown in parentheses. nEstimate is based on about 10 or fewer sample cases.
Table 48. Personal crImes of vIolence, 1987
Percent distribution of multiple-offender victimizations, by type of crime and perceived race of offenders
All 30 Mixed and over ages
5.3 33.0
5.8 33.0 4.9 33.0
08 37.7 8
8.3 28.5 10.2 27.5 19.9 34.5 3.3a 22.5 4.0a 30.8
11.48 16.48
1.5a 35.7
3.9 35.0 5.2 41.2 2.9a 30.4
Perceived race of offenders Not known
All All All Mixed and not Type of crime Total white black other races available
Crt.es of violence (1,378.2110) 100.0 46.2 33.9 6.7 to.8 2.11 Completed (597,460) 100.0 40.8 42.3 5.2 10.3 1.48
Attempted (780,790) 100.0 50.4 27.4 7.8 11.2 3.1
Rape (9,810) 100.08 08 100.0a Oa Oa 08
Robbery (4111,780) 100.0 27.9 53.2 5.4 11.6 1.98
Completed (303,490) 100.0 28.1 59.3 1.7a 10.1 .78
With injury (125,640) 100.0 45.3 41.7 08 13.1 Oa Withou t injury (177,8110) 100.0 16.0 71.8 3.0a 8.0a 1.2a
Attempted (138,290) 100.0 27.6 39.6 13.6 14.8 4.48
With injury (34,760) 100.0 30.0a 40.1 a Oa 12.5a 17.4a Without injury (103,530) 100.0 26.8 39.5 18.1 15.6 Oa
Asnault (926,660) 100.0 55.4 24.0 7.4 10.6 2.6 Aggravated (396,730) 100.0 54.1 27.1 5.7 10.4 2.8a Simple (529,930) 100.0 56.4 21.7 8.6 10.7 2.5a
NOTE: Detail may not add to total shown aEstimate is based on about 10 or because of rounding. Number of victimi- fewer sample cases. zations shown ill parentheses.
52 Criminal Victimization in the United States, 1987
Not known and not available
8.9
9.6 8.3
08
14.7 12.1 8.5~
14.6 20.3 34.1& 15.7
6.2 8.8 4.2

Tabljj 49. Personal crimes of violence, 1987
Percent distribution of multipleooffender victimizations, by type of crime, age of victims, and perceived age of offenders
Perceived a~e of offenders Not known
Type of orime All All All All 30 Mixed and not and age of victim Total under 12 12-20 21-29 and over ages available
Crilles l)f violencea 12-19 (502,260) 100.0 1 6b 60.7 9.0 .ab 24.3 3.2 20-34 (599,190) 100.0
• b 17.6 22.7 7.1 39.5 12.4 .3
b 35-119 (166,560) 100.0 0 22.6 16.5 13.5 33.6 13.8 50-64 (67,960) 100.0 Ob 22.5b 37.5 2.8b 34.5 2.6b 65 and over (42,280) 100.0 4.2b 13.3b 23.7b 4.6 b 37.8b 16.4b
Robbery Ob 10.8b Ob 11.3b 6.5b 12-19 (96,970) 100.p 69.1
20-34 (229,620) 100.0 Ob 8.2 24.3 10.2 37.8 19.5 35-49 (53,850) 100.0 Ob 21.7 b 11.1 b 20.6 b 24.5 b 22 lb 50-64 (38,440) 100.0 Ob 24.4 b 45.6 Ob 30.0b 'Ob 65 and over (22,890) 100.0 Ob 24.6b 43.7b 8. llb 15.6b 7.7b
Assault 12-19 (401,030) 100.0 b 58.2 8.7 .9 b 27.7 2.5b 2.0
b 20-34 (364,020) 100.0 .5b 23.3 22.1 5.3 b
40.2 8.\ 35-49 (112,710) 100.0 °b 23.0
b 19.1 10.0
b 37.9
b 9.\ 50-64 (29,520) 100.0 0 20.0
b 27.1 b 6.\ 40.5
b 5.9
b 65 and over (19,390) 100.0 9.3b 0 Ob 0 64.0 26.8
NOTE: Detail may not add to total shown aIncludes data on rape, not shown separately. because of rounding. Number of victimi- bEstimate is based on about 10 or zations shown in parentheses. fewer sample cases.
Table 50. Personal crimes of violence, 1987
Percent distribution of multiple-offender victimizations, by type of crime, race of victims, and perceived race of offenders
Pel'ceived race of offenders Not known
Type of crime and All All All Mixed and not race of victim Total white black other races available
Crilles of violencea White (1,094,190) 100.0 56.9 23.9 6.1 10.4 2.8
b Black (241,830) 100.0 5.1 b 82.6 .9 b 11.4 0
Robbery b White (337,870) 100.0 35.7
b 43.7 6.5 11.6
b 2.\ Black (101,890) 100.0 2.8 85.6 Ob 11.6 0
Assault White (746,510) 100.0 67.2 13.9 6.0 9.9b
3.0b Black (139,940) 100.0 6.8 b 80.5 1.6b 11.2 0
NOTE: Detail may not add to total shown aIncludes data on rape, not shown separately. because of rounding. Number of' victim i- bEstimate is based on about 10 or zations shown in parentheses. fewer sample cases.
Criminal Victimization in the United States,19B7 53

Table 51. Personal crimes of IIlolence, 1987
Percent distribution of multiple-offender victimizations, by type of crime and detailed victim-offender relationship
Some or all related Spouses, Brothers,
Type of orime Total Total ex-spouses Parents Children sisters
Cri~s of violence (361,11110) 10(1.0 12.1 6.1 1.3b Ob 1.6b ·
Completed (144,710) 100.0 15.7 11.2 b Ob 1.3b 3. 2b Attempted (216,730) 100.0 9.6 2.7b 0 Ob 1.8b
Rape (4,260) 100.0b Ob Ob Ob Ob Ob
Robbery (48,470) 100.0 21 Sb 16.6b 4.8b Ob Ob Completed (34,720) 100.0
b • b
23.2b 6 7b Ob Ob Attempted (13,750)
30.0b Ob 'Ob Ob Ob 100.0 0
Assault (308,710) 100.0 10.7 b 4.5: b Ob b .7b 1.9
b Aggravated (114,620) 100.0 12.0 7.0 2.0b
Ob 0 Simple (194,100) 100.0 10.0 3.0b 0 Ob 3.1 b
Some or all Other well known, rt1latives not relateda
3.1b 116.11 Ob 34.7
5.1 b 54.2 Ob 0 b
Ob 44.1 Ob 40.1~ Ob 54.3
3.6b 47.4 3.0b 37.1 4.0h 53.S
NOTE: Detail may not add to total shown because of alncludes data on offenders well known to the viotim
Some or all oasual aoquaintances
~1.5
49.6 36.1
100.0b
34.4 30.0b 45.7b
41.9 50.9 36.5
rounding. Number of Victimizations shown in parentheses. ~hose relationship to the viotim oould not be ascertained. Estimate is based on about 10 01' fe~lel' sample cases.
Table 52. Personal crimes, 1987
Number of incidents and victimizations and ratio of incidents to victimizations, by type of crime
Type of crime Incidents
Crimes of violence 5,032,110 Completed 1,868,430 Attempted 3,163,690 Rape 1311,880
Completed 62,470 Attempted 72,410
Robbery 946,030 Completed 622,480
With injury 260,900 From serious assault 120,760 From minor assault 140,140
Without injury 361,580 Attempted 323,550
With injury 92,810 From serious assault 42,650 From minor assault 50,160
Without injury 230,740 Assault 3,951,210
Aggravated 1,283,490 Completed with injury 408,550 Attempted with weapon 874,940
Simple 2,667,720 Completed with injury 774,930 Attempted without weapon 1,892,790
CriEs or theft 13,288,070 Completed 12,463,260 Attempted 824,810 Personal laroeny with contaot 479,490
Purse snatohing 180,010 Completed 119,030 Attempted 60,980
Pooket pioking 299,480 Personal laroeny without oontaot 12,808,580
Completed 12,044,750 Less than $50 5,312,420 $50 or more 6,151,030 Amount not available 581,300
Attempted 763,830
NOTE: Detail may not add to total shown beoause of rounding.
54 Criminal Victimization in the United States, 1987
Vi c timiza tions
5,660,570
2,085,950 3,574,620
140,900 64,800 76,090
1,030,460 678,150 275,650 130,OSO 145,610 402,490 352,310 97,090 44,730 52,370
255,220
4,489,220 1,543,150
480,800 1,062,350 2,946,070
862,200 2,083,860
13,343,980
12,509,770 834,210
508,690 184,940 121,910 63,030
323,760
12,835,290 12,064,110 5,317,450 6,162,780
583,880 771,180
Ratio
1:1.12
1: 1.12 1 :1.13
1: 1.04 1: 1.04 1: 1.05
1:1.09 1:1.09 1: 1.06 1: 1.08 1:1.04 1:1.11 1:1.09 1:1.05 1 :1.05 1: 1.04 1: 1.11
1: 1.14 1:1.20 1: 1.18 1: 1.21 1 :1.10 1: 1.11 1: 1.10
1:1.00
1: 1.00 1 :1.01
1; 1.06 1: 1.03 1:1.02 1: 1.03 1:1.08
1:1.00 1:1.00 1:1.00 1 :1.00 1:1.00 1:1.01

Tabllt 53. Personal crimes 01 violence, 1987
Percent. distribution of incidents, by victim-offender relationship, type of crime, and number of victims
Number of victims Relationship and type Four or of crime Totala One Two Three more
All inc1dents
Crimes of violence (4,952,790) 100.0 91.7 6.0 1.4 .8
Completed (1,846,180) 100.0 92.4 5.3 1.5 .9 b
Attempted (3,106,610) 100.0 91.3 6.5 1.4 .8
Rape (134,880) 100.0 96.5 2.5b 1.0b Ob
Robbery (929,590) 100.0 93.6 4.6 1.4: .4: Completed (613,340) 100.0 93.9 4.0 1.7 b .4
With injury (259,110) 100.0 95.8 2.6 b 1.5 Ob Without injury (354,230) 100.0 92.4 5.0 1 9b 6b
• b • b Attempted (316,250) 100.0 93.1 5.7b .7 b .5
b With injury (88,620) 100.0 95.2 4.8 0 0 Without injury (227,630) 100.0 92.3 6.0b .9b .7b
Assault (3,888,330) 100.0 91.1 6.5 1.5 1.0 Aggravated (1,263,320) 100.0 87.1 9.0 2.3 1.5 Simple (2,625,000) 100.0 93.0 5.2 1.1 .7
Involving strangers
Crimes of violence (2,743,320) 100.0 90.2 6.9 1.9 1.0
Completed (959,320) 100.0 90.8 6.2 2.0 .9b
Attempted (1,784,000) 100.0 89.8 7.3 1.8 1.1
Rape (70,640) 100.0 93.3 4.Sb 1.Sb Ob
Robbery (729,680) 100.0 92.6 5.2 1.6b b .5b Completed (461,570) 100.0 92.7 4.6 2;3b .4
With injury (192,600) 100.0 95.0 3.0b 2.0b Ob Without injury (268,960) 100.0 91.0 5.8b 2 5b .7b
Attempted (268,110) 100.0 92.6 6.3 • b .6b .5b With injury (65,010) 100.0 95.1 4.9 b 0 Ob
Without injury (203,100) 100.0 91.7 6.8b .7b .8b
Assault (1,943,010) 100.0 89.1 7.7 2.0 1.2 Aggravated (741,560) 100.0 85.3 9.9 2.7 2 Ob Simple (1,2Q1,440) 100.0 91.5 6.3 1.5 • b .8
Involvtng nonstrangers
Crimes of violence (2,209,460) 100.0 93.6 4.9 .9 .6b
Completed (886,860) 100.0 911.1 4.3 b ab Attempted (1,322,600) 100.0 93.3 5.3
.\ • b .9 .5
Rape (64,230) 100.0 100.0 Ob Ob Ob
Robbery (199,910) 100.0 97.1 2.3b b b .4b
.2b Completed (151,770) 100.0 97.5 2.3b 0 .3b With injury (66,510) 100.0 98.2 1.8b Ob
°b Without injury (85,270) 100.0 96.8 2.6b Ob .\ Attempted (48,140) 100.0 96.2 2.3b 1.5b 0
With injury (23,600) 100.0 95.2 4.8b Ob Ob Without injury (24,530) 100.0 97.1 Ob 2.9b Ob
Assault (1,945,320) 100.0 93.0 5.3 1.0 b .7 b
Aggravated (521,760) 100.0 89.7 7.8 1 7b .8 Simple (1,423,560) 100.0 94.3 4.4 • b .6b .7
NOTE: Detail may not add to total shown of victims could not be determined. because of rounding. Number of incidents bEstimate is based on about 10 or shown in parentheses. aExcludes incidents in which the number
fewer sample cases.
Criminal Victimization in the United States, 1987 55

Table 54. Personal crimes of vIolence, 1987
Number and percent distribution of incidents, by type of crime and victim-offender relationship
Involving Involving All inoidents stran~ers nonatran~ers
Per- Per- Per-Type or orime Number oent Number oent Number oent
Crt.ea or .iolenoo 5,032,110 100.0 2.800,580 55.7 2.231.5110 1111.3
Completed 1,868,430 100.0 979,690 52.4 888,730 47.6 Attempted 3,163,690 100.0 1,820,880 57.6 1,342,800 42.4
Rape 134,880 100.0 70,640 52.4 64,230 47.6 Completed 62,470 100.0 30,330 48.6 32,130 51.4 Att'3mpted 72,410 100.0 40,310 55.7 32,100 44.3
Robbery 946,030 100.0 746,120 78.9 199,910 21.1 Completed 622,480 100.0 470,710 75.6 151,770 24.4
With injury 260,900 100.0 194,400 74.5 66,510 25.5 From serious assault 120,760 100.0 91,940 76.1 28,830 23.9 From minor assault 140,140 100.0 102,460 73.1 37,680 26.9
Without injury 361,580 100.0 276,310 76.4 85,270 23.6 Attempted 323,550 100.0 275,410 85.1 48,140 14.9
With injury 92,810 100.0 69,200 74.6 23,600 25.4 From serious assault 42,650 100.0 36,060 84.5 6,590 15.58
From minor assault 50,160 100.0 33,150 66.1 17,010 33.9 Without :!.nJury 230,740 100.0 206,210 89.4 24,530 10.6
Assault 3,951,210 100.0 1,983,810 50.2 1,967,390 J19.8 Aggravated 1,283,490 100.0 754,660 58.6 528,830 41.2
Completed with injury 406,550 100.0 162,760 44.7 225,790 55.3 Attempted with weapon 874,940 100.0 571,690 65.4 303,050 34.6
Simple 2,667,720 100.0 1,229,160 46.1 1,438,560 53.9 Completed with injury 774,930 100.0 295,690 36.2 479,040 61.8 Attempted without weapon 1,892,790 100.0 933,270 49.3 959,520 50.7
NOTE: Detail may not add to total shown beoause of rounding. aEstimate is based on about 10 or fewer sample oases.
56 Criminal Victimization in the United States, 1987
_."'-------

Tab11l55. Personal and household crimes, 1987
Percent distribution of incidents, by type of crime and time of occurrence
Daytime Ni!jhttime Not known 6 a.m.- 6 p.m.- Midnight- Not and not
Type of orime Total 6 p.m. Total midnighi 6 a.m. known available
Cr:t.es of violence (5,032,110) 100.0 41.1 52.3 38.3 13.5 .5 .1
Completed (1,868,430) 100.0 44.6 54.9 38.2 16.2 .5a .5a Attempted (3,163,690) 100.0 48.5 50.7 38.4 12.0 .4a .7
Rape (134,880) 100.0 32.4 67.6 35.0 30.5 2.1 a Oa
Robbery (946,030) 100.0 40.6 58.7 42.2 15.8 .7a .8a Completed (622,480) 100.0 42.0 57.1 41.2 15.3 .6a .9a
With injury (260,900) 100.0 39.2 60.8 43.0 16.9 .8a Oa From serious assault
(120,760) 100.0 39.7 60.3 38.4 20.2 1.7a Oa From minor assault (140,140) 100.0 38.8 61.2 47.0 14.2 Oa Oa
Without injury (361,580) 100.0 44.1 54.4 39.9 14.1 .4a 1.5a Attempted (323,550) 100.0 37.7 61.7 44.1 16.7 1.0a .6a
With injury (92,810) 100.0 43.0 57.0 35.5 21.5 Oa Oa From serious assault
(42,650) 100.0 30.0a 70.0 44.6 25.5a Oa Oa From minor assault (50,160) 100.0 54.2 45.8 27.7a 18.1 a Oa Oa
Without injury (230,740) 100.0 35.6 63.6 47.5 14.7 1.3a .8a
Assault (3,951,210) 100.0 49.1 50.2 37.5 12.4 .38 .6 Aggravated (1,283,490) 100.0 44.4 55.2 41.9 13.0 .3a .48
Completed with injury (408,550 ) 100.0 39.0 60.8 46.4 13.B .5a .2a
Attempted with weapon (874,940) 100.0 46.9 52.6 39.7 12.6 .2,a .5a
Simple (2,667,720) 100.0 51.4 47.8 35.3 12.1 .4al .8 Completed with injury (774,930) 100.0 50.7 48.8 31.8 16.8 .2a .5a Attempted without weapon
(1,892,790) 100.0 51.7 47.5 36.8 10.2 .4a .9
Crimes of theft (13,288,070) 100.0 116.8 36.1 18.1 10.2 1.7 11.1
Completed (12,463,260) 100.0 47.5 35.1 17.7 10.0 7.5 17.4 Attempted (824,810) 100.0 37.6 50.2 25.2 14.5 10.5 12.3 Personal laroeny with oontaot
(479,490) 100.0 61.8 37.3 26.4 10.6 .4a .9a Purse snatohing (180,010) 100.0 56.1 43.9 37.7 6.3a Oa Oa Pooket pioking (299,480) 100.0 65.2 33.4 19.6 13.1 .6a 1.4a
Personal laroeny without oontaot (12,808,580) 100.0 46.3 36.0 17.8 10.2 8.0 17.7 Completed (12,044,750) 100.0 46.9 35.1 17.4 9.9 1.8 18.0
Less than $50 (5,312,420) 100.0 53.7 27.7 14.6 6.0 7.0 18.6 $50 or more (6,151,030) 100.0 40.8 42.3 20.1 13.7 8.5 16.8 Amount not available (581,300) 100.0 49.9 25.6 13.6 5.7 6.3 24.5
Attemp,ted (763,830) 100.0 35.9 50.8 24.5 15.0 11.3 13.3
Household c'r1Jaes (15,126,260) 100.0 21.0 1111.8 14.3 11.5 13.1 28.1 Completed (13,263,270) 100.0 27.6 43.6 13.7 16.8 13.1 28.8 Attempted (2,462,990) 100.0 23.9 51.6 17.0 21.6 13.0 24.5 Burglary (5,623,160) 100.0 35.2 34.9 16.4 11.5 7.0 29.9
Completed (4,276,620) 100.0 37.5 34.1 16.7 10.8 6.5 28.4 Foroible entry (1,963,280) 100.0 41.1 36.3 19.4 10.1 6.8 22.6 Unlawful entry without
force (2,313,330) 100.0 34.5 32.2 14.5 11.4 6.3 33.3 Attempted forcible entry
(1,346,540) 100.0 28.0 37.5 15.4 13.6 8.5 34.5 Household larceny (8,624,360) 100.0 22.0 48.0 11.8 19.1 17.1 29.9
Completed (13,017,840) 100.0 22.5 46.2 11.2 18.2 16.8 31.3 Less than $50 (3,458,690) 100.0 22.0 43.2 10.3 15.6 17.3 34.8 $50 or more (4,080,310) 100.0 22.4 50.0 12.2 21.0 16.7 21.6 Amount not· available (478,830) 100.0 27.0 36.5 9.1 13.9 13.5 36.5
Attempted (606,520) 100.0 15.8 71.9 19.6 30.9 21.4 12.3 Motor vehicle theft (1,478,750) 100.0 24.9 64.1 20.3 31.2 12.6 11.0
Completed (966,820) 100.0 26.0 63.6 21.3 31.0 11.4 10.3 Attempted (509,930) 100.0 ~2.6 65.0 18.4 31.8 14.8 12.4
NOTE: Detail may not add to total shown aEstimate is based on about 10 or because of rounding. Number of inoidents fewer sample cases. shown in parentheses.
Criminal Victimization in the United States, 1987 57

Table 56. Personal robbery and assauH by armed or unarmed offendeni, 1987
Percent distribution of incidents, by type of crime and offender and time of occurrence
Daytime 6 a.m.-
Type of crime and offender Total 6 p.m. Total
Robbel"7 By armed offenders {439,240) 100.0 36.7 62.9 By unarmed offenders (382,820) 100.0 48.0 51.1
Assault By armed offenders (1.208,670) 100.0 45.2 54.4 By unarmed offenders (2,453.760) 100,0 52.1 47.2
Nif!httime Not known 6 p.m.- Midnight- Not and nr.>t midnight 6 a.m. known available
42.8 18.5 1.5a .4a 39.2 11.9 Olil. .9a
41.4 12.6 .3a .4a 35.3 11.8 .1a .7
NOTE; Number of incidents shown in p~~·entheses. Excludes incidents in which
the presenoe of a weapon oould not be determined. aEstimate is based on about 10 or fewer sample cases.
Table 58. Selected personal and households crimes, 1907
Percent distribution of incidents, by type of crime and place of occurrence
Inside own home. other Near building own
Type of crime Total on property home
Crises of violence (5,032,110) 100.0 15.9 11.6
Completed (1,868,430) 100.0 21.9 9.1 Attempted (3.163,690) 100.0 12.3 13.2
Rape (134,880) 100.0 40.5 5.2a
Robbery (946,030) 100.0 18.4 10.8 Completed (622,480) 100.0 20.8 11.7
With injury (260,900) 100.0 >:>,0.4 14.3 Without injury (361,580) 100.0 21.1 9.9
Attempted (323,550) 100.0 13.6 9.1 With injury (92,810) 100.0 20.3 7.6a Without injury (230,740) 100.0 10.9 9.7
Assault (3,951,210) 100.0 14.4 12.1 Aggravated (1,283,490) 100.0 12.9 13.9 Simple (2,667.720) 100.0 15.2 11.2
Personal larceny with contact 1.3a (479,490) 100.0 5.2
Motor vehicle theft (1,478,750) 100.0 2.0 38.2 Completed (968,820) 100.0 2.6 35.6 Attempted (509.930) 100.0 1.1a 43.2
NOTE: Detail may not add to total shown because of rounding. Number of incidents shown in parentheses. aEstimate is based on about 10 or fewer sample cases.
58 Criminal Victimization in the United States, 1987
Inside Other restaurant. commercial bar buildings
4.2 6.9
11.3 3.9 4.1 8,,7
1.68 ".8a
1.0a 3.5 .9a 3.5
1.1a 2.2a .8a 4,.4
1.1 a ~.4a,
2.4a :1.3a .6a :3.5a
5.0 7.9 4.5 5.7 5.3 8.9
7.3 :~O.6
Oa .68
Oa .4a Oa 1.l a

Table 57. Parsonal crimes of vlolr.nca, 1987
Percent distribution of incidents, by victim-offender relationship, type of crime and time of occurrence
Daytime Relationship and 6 a.m.-\Jpe of orime Total 6 p.m. Total
Involving strangers
Crimes of violenoe (2,800,580) 100.0 41.'{ 57.6
Rape (70,640) 100.0 32.2 67.8 Robbery (746,120) 100.0 37.5 62.0 Assault (1,983,810) 100.0 43.6 55.6
Involving nODstrangers
Crimes of violenoe (2,231,540) 100.0 53.8 45.5
Rape (64,230) 100.0 32.7 67.3 Robbery (199,910) 100.0 52.0 46.2 Assault (1,967,390) 100.0 54.7 44.8
Ni~httime 6 p.m .... Midnight-midnight 6 a.m.
41.0 15.5
31.9 35.9 45.0 16.7 40.7 14.3
34.1 11.1
38.4 24.68
31.8 12.5 34.2 10.5
NOTE: Detail may not add to total shown aEstimate is based on about 10 or beoause of rounding. Number of inoidents fewer sample cases. shown in parentheses.
On publio Inside Fl'iend's, transpor- In a In a park, school, relative's, tation, in- On the parking field, 01' on sohool 01' neigh- Other side station street lot playground pl'oper'ty bor's home location
1.1 21.1 9.2 3.t 9.2 10.8 6.3
1.2 20.7 9.4 2.1 8.5 13.1 5.9 1.0 22.4 9.1 3.6 9.6 9.5 6.6
3.1a 13.4 5.08 Oa 1.3a 17 .6 10.5a
3.2 33.9 10.1 2.3 3.9 7.7 5.2 3.2 33.7 9.6 1.08 3.6 7.4 4.4 2.1 8 31.7 13.6 2.2a 3.1a 3.4a 5.8a 4.0a 35.1 6.7 .1 a 4.0a 10.3 3.4a
3.38 34.3 11.0 4.8a 4.48 8.2 6.7 3.9 8 20.0 16.4a 3.88 2.08 16.08 4.58
3.1 a 40.1 8.9 5.2a 5.4a 5.08 7.6
.5 19.1 9.2 3.4 10.8 11.3 6.4
.8a 20.5 9.6 4.8 5.9 15.5 6.0
.3a 18.4 8.9 2.7 13.1 9.3 6.6
12.7 27.4 6.4 .88 6.4 4.4 7.5
.1 a 12.1 33.3 .78 2.5 8.3 2.2 Oa 14.0 31.9 1.1 8 2.7 9.3 2.4
.4a 8.3 36.0 08 2.0a 6.4 1. 7a
Not known Not and not known available
.5a .6 Oa Oa
.4a .58
.6a .7a
.4a .78
4.48 08
1.98 1.98
.1 8 .68
Criminal Victimization in the United States, 1987 59

Table 59. Personal robbery and assault by armed or unarmed offenders, 1987
Percent distribution of incidents, by type of crime and offender and place of occurrence
Inside own home, other Near building own
Type of orime and offender 'rotal on property home
Robbery By armed offenders (439,240) 100.0 22.7 9.5 By unarmed offenders (382,820) 100.0 14.5 10.8
Assault By armed offenders (1,208,670) 100.0 12.7 14.7 By unarmed offenders (2,453,760) 100.0 15.7 10.3
NOTE: Detail may not add to total shown beoause of rounding. Number of inoidents shown in parentheses. Exoludes inoidents in whioh the presenoe of a weapon could not be determined.
Table 60. Personal crimes of vlolllnce, 1987
Percent distribution of incidents,
Inside Other restaurant, oommeroial bar buildings
.5a 2.2a 1.90 5.9
3.9 5.9 5.3 9.1
by victim-offender relationship, type of crime, and place of occurrence
Relationship and type of ok'ime
Involving strangers
Crimes of violenoe (2,800,580)
Rape (70,640) Robbery (746,120) Assault (1,983,810)
Involving nonstrangers
Crimes of violenoe (2,231,540)
Rape (64,230) Robbery (199,910) Assault (1,967,390)
Inside own home, other building
Total on property
100.0
100.0 100.0 100.0
10D.0
100.0 100.0 100.0
7.1
24.8 11.5 4.8
26.9
57.7 43.9 24.2
Near own home
10.6
8.0a 11.4 10.4
13.0
2.1 8
8.8 13.8
NOTE: Detail may not add to total shown beoause of rounding. Number of inoidents shown in parentheses.
Table 61. Personal crimes of violence, 1987
Percent distribution between stranger and nonstranger incidents within place of occurrence, by type of crime
Inside own Type of orime home, other Inside and viotim-offender building Near own restaurant, relationship on property home bar
Crimes of violence 100.0 100.0 100.0 Stranger 24.9 50.5 65.9 Nonstranger 75.1 49.5 34.1
Rape 100.0 100.0 100.0 Stranger 32.0 80.4a Oa Nonstranger 68.0 19.6a 100.0a
Robbery 100.0 100.0 100.0 Stranger 49.5 82.8 76.3a Nonstranger 50.5 17.2 23.7a
Assault 100.0 100.0 100.0 Stranger 16.7 43,1 66.1 Nonstranger 83.3 56.9 33.9
NOTE: Detail may not add to total shown beoause of rounding.
60 Criminal Victimization in the United States, 1987
On publio Other transpor-oommeroial tation, in-buildings side station
100.0 100.0 55.7 96.3 44.3 3.7a
100.0 100.0 43.9a 100.0a 56.1 a Oa
100.0 100.0 81.0 100.0 19.011 Oa
100.0 100.0 53.1 89.5 46.9 10.5a

On publio Inside Friend's, transpor- In a In a park, sohool, relative's, tation, in- On the parking field, or on sohool or neigh- Other aide station street lot playground property bor's home looation
1.5a 36.7 8.7 2.7a 1.4a 8.5 5.6 3.3a 28.4 12.3 2.7a 6.9 7.6 5.9
.9a 21.1 9.2 5.1 5.5 15.0 6.2
.3a 17.2 8.6 2.6 14.0 10.2 6.9
aEstimate is based on about 10 or fewer sample oases.
On public Inside Friend's, Inside Other transpor- In a In a park, school, relative's, restaurant, oommercial tation, in- On the parking field, or or. school or neigh- Other bar buildings side station street lot playground property bor's home location
5.0 6.9 1.8 31.8 11.4 4.0 6.5 7.2 7.7 Oa 1.5a 5.9a 19.1 a 9.5a Oa 2.6a 12.6a 16.0a
LOa 3.6 4.1 41.1 11.2 2.9 2.3 5.9 5.1 6.6 8.3 .8 28.8 11.6 4.5 8.2 7.5 8.4
3.2 6.9 .1 a 9.0 6.5 2.0 12.6 15.3 4.5
3.4a 2.1 a Oa 7.1 a Oa Oa Oa 23.0a 4.4a 1.l a 3.1 a Oa 6.9a 6.1 a .2a 9.9 14.2 5.7a 3.4 7.4 .1 a 9.3 6.7 2.2 13.3 15.2 4.4
aEstimate is based on about 10 or fewer sample cases.
Inside Friend's, In a In Ii park, school, relative's,
On the parking field, or on school or neigh- Other street lot playground property bor's home location
100.0 100.0 100.0 100.0 100.0 100.0 81.6 68.8 71.5 39.3 37.2 68.3 18.4 31.2 28.5 60.7 62.8 31.7
100.0 100.0 100.0 100.0 100.0 100.0 74.6a 100.0a Oa 100.0a 37.7a 80.1a 25.4a Oa Oa Oa 62.3a 19.9a
100.0 100.0 100.0 100.0 100.0 100.0 95.7 87.1 98.0 46.4 60.7 77.0 4.3a 12.9a 2.0a 53.6 39.3 23.0a
100.0 100.0 100.0 100.0 100.0 100.0 75.7 63.4 67.1 38.4 33.3 65.9 24.3 36.6 32.9 61.6 66.7 34.1
aEstimate is based on about 10 or fewer sample casea.
Criminal Victimization in the United States, 1987 61

Table 62. Larcenies not InvolvIng vlctlm-offender contact, 1987
Percent distribution of incidents, by type of crime and place of occurrence
Type of crime and Percent within place of occurrence type
Total
Household larce~ Inside own home, other building on property Near own home
Personal larceny without contact Inside restaurant, bar Other commeroial buildings On publio transportation, inside station On the street In a perking lot In a park, field, or playgr·ound Inside sohool, on school property Friend's, relative's, or neighbor's home Other location
NOTE: Detail may not add to total shown because of rounding • ••• Not applioable.
Table 63. Larcenies not Involving vlctlm-offender contact, 1987
Percent distribution of incidents, by type o~ crime, place of occurrence, and value of theft loss
Type of crime and Less than
100.0 18.7 81.3
100.0 3.4
12.1 .8
0.1 33.1 2.1
19.2 9.3
11.9
Aloount not place of ocourrenoe $50 $50 or more available
Total 100.0 100.0 100.0 Household larceny 39.14 39.9 45.2
Inside own home, other building on property 6.6 8.1 10.9 Near own home 32.8 31.8 34.3
Personal larceny without contact 60.6 60.1 514.8 Inside restaurant, bar 2.2 2.1 1.9 Other commercial buildings 8.7 6.4 8.2 On public transportation, inside station .3 .5 .7a On the street 3.1 5.9 4.6 In a parking lot 14.8 23.5 15.7 In a park, field, or playground 1.2 1.3 .8a
Inside school, on school property 18.7 6.1 11.3 Friend's, relative's, or neighbor's home 4.2 7.1 2.3 Other location 7.2 7.3 9.3
Peroent total
100.0
140.2 7.5
32.7
59.8 2.0 7.2
.5 4.9
19.8 1.3
11.5 5.5 7.1
Attempted larceny
100.0
44.3 6.7
37.6
55.7 .7a
2.6 1.6 8.9
27.2 1.9 5.3 4.4 3.3
NOTE: Detail may not add to total shown because ~f rounding.
aEst1mate is based on about 10 or fewer sample cases.
62 Criminal Victimization in the United States, 1987
of

Table 64. Personal crlms.s 0: vIolence, 1987
Percent distribution of incidents~ by victim-offender re~ationship, type of crime, and number of offenders
Number of offenders Not known
Relationship and type Four or and not of crime Total One Two Three more available
All . incidents
Crimes of violence (5,032,110) 100.0 76.3 9.8 4.;; 6.3 3.1
Completed (1,868,430) 100.0 72.7 11.2 5.4 8.1 2.5 Attempted (3,163,690) 100.0 78.3 9.0 4.0 5.2 3.5
Rape (134,880) 100.0 92.7 4.4a 1.4a Oa 1.5a
Robbery (946,030) 100.0 57.3 21.0 7.6 10.5 3.6 Completed (622,480) 100.0 55.0 22.2 7.0 12.0 3.8
With injury (260,900) 100.0 54.0 23.2 7.2 12.7 2.9a Without injury (361,580) 100.0 55.7 21.5 6.8 11.5 4.4a
Attempted (323,550) 100.0 61.6 18.8 8.7 7.7 3.28
With injuz,y (92,810) 100.0 63.8 22.1 4.9a 5.1 8 4.28
Without injury (230,740) 100.0 60.8 17 .5 10.2 8.8 2.88
Assault (3,951,210) 100.0 80.2 7.3 3.9 5.5 3.1 Aggravated (1,283,490) 100.0 73.9 9.1 5.4 6.0 5.5 Simple (2,667,720) 100.0 83.3 6.4 3.2 5.3 1.9
Involving strangel-s
Crimes of violence (2,800,580) 100.0 67.7 L.8 6.0 8.6 4.9 Completed (979,690) 100.0 59.5 15.4 8.1 13.1 3.9 Attempted (1,820,880) 100.0 72.0 11.5 4.9 6.1 5.4 Rape (70,640) 100.0 92.1 2.48 2.6a 08 2.88
Robbery (746,120) 100.0 51.5 22.7 8.9 12.3 4.5 Completed (470,710) 100.0 46.9 24.8 8.8 14.5 5.0
With injury (194,400) 100.0 44.1 26.4 9.7 15.9 3.98
Without injury (276,310) 100.0 48.9 23.7 8.1 13.5 5.88
Attempted (275,410) 100.0 59.4 19.2 9.3 8.4 3.78
With injury (69,200) 100.0 60.7 22.98 3.9a 6.88 5.78
Without injury (206,210) 100.0 59.0 18.0 11.1 B.9 3.1 8
Assault (1,983,810) 100.0 72.9 9.5 5.1 7.5 5.1 Aggravated (754,660) lCO.O 66.5 10.6 7.5 7.2 8.2 Simple (1,229,160) 100.0 76.7 8.8 3.5 7.7 3.2
Involving nonstrangers
Crimes of violence (2,231,540) 100.0 87.1 6;0 2.6 3.5 .9 Completed (888,730) 100.0 87.3 6.6 2.4 2.7 1.0a Attempted (1,342,800) 100.0 86.9 5.6 2.7 4.0 .8a
Rape (64,230) 100.0 93.4 6.68 Oa Oa Oa
Robbery (199,910) 100.0 78.8 14.7 2.4a 4.1 8 08
Completed (151,770) 100.0 80.1 14.1 1.58 4.28 Oa With injury (66,510) 100.0 83.1 13.7a Oa 3.28 08
Without injury (85,270) 100.0 77.8 14.4a 2.7a 5.08 08
Attempted (48,140) 100.0 74.4 16.6& 5.28 3.7 8 08
With injury (23,600) 100.0 72.6 19.7a 7.6a 08 08
Without injury (24,530) 100.0 76.2 13.68 2.98 7.38 08
Assault (1,967,390) 100.0 87.7 5.1 2.7 3.5 1.0 Aggravated (528,830) 100.0 84.5 7.0 2.48 4.4 1.78 Simple (1,438,560) 100.0 88.9 4.4 2.8 3.2 .88
NOTE:: Detail may not add to total shown aE:stimate is based on about 10 becaUse of rounding. Number of inCidents or fewer sample cases. shown in parentheses.
Criminal Victimization in the United States, 1987 63

Table 65. Personal crimes of violence, 1987
Percent of incidents in which offenders used weapons, by type of crime and victim-offender relationship
All Type of crime incidents
Cr!.es of violence 33.6
Completed 33.0 Attempted 33.9 Rape 30.0
Robbery 46.4 Completed 42.1
With injury 40.4 Without injury 43.3
Attempted 54.8 With injury 44.0 Without injury 59.1
Assaulta 30.6 Aggravated 94.2
aIncludes data on simple assault, which by definition does not involve the use of a weapon. bEstimate is based on about 10 or fewer sample cases.
Tabla 66. Personal crimes of violence, 1987
Involving strangers
40.0
38.4 110.8
32.8
48.8 42.8 40.5 44.4 59.0 52.1 61.2
36.9 97.1
Percent distribution of types of weapons used in incidents
Involving nonstrangers
25.5
27.1 24.4
27.0
37.7 39.9 40.1 39.7 b 30.\ 20.3 41.1 b
24.2 90.0
by armed offenders, by victim-offender relationship, type of crime, and type of weapon
Firearm Relationship and type Hand Other Type of crime Total Total gun gun Knife Other unknown
All incidents
Crimes of violence (1,774,440) 100.0 36.6 29.8 6.8 24.6 36.5 2.3
Completed (650,200) 100.0 28.1 24.5 3.5 24.4 44.0 3.5 Attempted (1,124,230) 100.0 41.5 32.8 8.7 24.7 32.1 1.6
Rape (43,210) 100.0 25.2a 25.2a oa 43.9 30.9a Oa
Robbery (458,580) 100.0 36.4 33.0 3.4a 32.3 29.3 2.0a Completed (273,780) 100.0 42.8 39.1 3.7a 29.9 24.0 3.3a
With injury (110,780) 100.0 26.4 26.4 Oa 27.0 39.0 7.7a Without injury (162,980) 100.0 54.0 47.8 6.3a 31.9 13.8 .3a
Attempted (184,810) 100.0 26.9 24.0 2.9a 35.8 37.3 Oa With injury (40,850) 100.0 4.7a 4.7a Oa 53.3 42.0 Oa Wi~,hout injury (143,950) 100.0 33.2 29.4 3.8a 30.9 36.0 Oa
Aggravated assault (1,272,650 ) 100.0 37.0 28.8 8.2 21.2 39.2 2.5 Completed with injury
(352,530 ) 100.0 16.5 12.9 3.6a 19.0 60.6 4.0a Attempted with weapon
(920,120) 100.0 44.9 34 .• 9 10.0 22.1 31.1 2.0
Involving strangers
Crimes of violence (1,182,990) 100.0 39.6 31.8 7.8 23.0 35.2 2.2
Rape (25,870) 100.0 31.2a 31.2a Oa 37.7a 31.1 a Oa Robbery (378,970) 100.0 37.1 33.5 3.6a 32.7 27.8 2.4a Aggravated assault (778,140) 100.0 41.1 31.0 10.0 17.8 39.0 .4
Involving nonstrangers
Crimes of violence (591,460) 100.0 30.6 25.7 4.9 27.8 39.0 2.6a
Rape (17,350) 100.0 16.3a 16.3a Oa 53.2a 30.5a Oa Robbery (79,590) 100.0 33.2 30.7 2.6a 30.1 36.7 Oa Aggravated assault (494,510) 100.0 30.6 25.2 5.4 26.5 39.7 3.2a
NOTE: Detail may not add to total shown aEotimate is based on about 10 or beoause of rounding. Number of weapons fewer sample cases. used shown in parentheses. Some respondents may have oited more than one weapon present.
64 Criminal Victimization in the United States. 1987
- .".,., .. -.~ ,_ .... ,

Table ~7, Personal crImes of vIolence, 1987
Percent of victimizations in which victims took self-protective measures, by type of crime and victim-offender relationship
All Involving Involving Type of orime viotimizations strangers nonstrangers
Crimes ot violence 68.9 66.1 72.6 Completed violent orimes 66.3 55.1 79.2 Attempted violent crimes 70.4 72.0 68.2 Rape 83.1 81.1 85.6 Robbery 61.2 57.0 78.0
Completed 50.1 41.5 78.7 With injury 62.0 55.9 81.0
From ~erious assault 63.8 57.8 84.9 From minor assault 60.4 54.0 78.1
Without injury 41.9 32.0 77.0 Attempted 82.6 83.8 75.5
With injury 85.2 88.8 74.5 From serious assault 91.8 94.8 'r7.5a From minor assault 79.6 82.6 73.2a
Without injury 81.6 82.2 76.5 Assault 70.2 68.9 71.7
Aggravated 69.8 68.1 72.4 Completed with injury 71.7 62.3 80.0 Attempted with weapon 68.9 69.9 67.0
Simple 70.5 69.4 71.4 Completed with injury 76.0 70.6 79.5 Attempted without weapon 68.1 69.0 67.2
aEstimate is based on about 10 or fewar sample cases.
Table ~8, Personal crimes of vIolence, 1987
Percent of victimizations in which victims took self-protective measures, by characteristics of victims and type of crime
Crimes Completed Attempted Robbery of violent violent With
Characteristic violenoe crimes crimes Rape ';ootal injury
Sex Male 68.2 63.9 70.4 63.1a 63.1 67.8 Female 70.1 69.4 70.5 84.6 58.2 68.4
Race White 69.9 68.3 70.8 88.6 64.8 67.0 Black 63.7 58.2 67.6 71.5 50.5 70.1
Age 12-19 65.0 68.3 62.9 71.0 59.6 63.9 20-34 71.9 68.2 74.1 88.1 63.7 69.1 35-49 74.3 69.8 76.3 100.0a 70.6 76.7 50-64 53.8 38.6 63.7 Oa 42.3 66.8 65 and over 57.8 50.8 63.8 100.0a 44.8 54.7
aEstimate is based on about 10 or fewer sample oases.
Assault Without injury Total Aggravated Simple
60.5 69.3 71.0 68.2 52.2 71.7 66.8 73.5
63.5 70.5 70.2 70.6 41.1 69.2 68.6 69.7
57.8 65.7 66.3 65.4 60.8 73.3 74.4 72.8 66.4 74.8 72.1 76.5 27.2a 58.5 48.9 65.,0 28.6a 63.7 60.4 6:>~5
Criminal Victimization in the United States, 1987 65

Table 70. Personal crimes of violence, 1987
Table 69. Personal crimes of vloleooii, 1987
Percent distribution of self-protective measures employed by victims, by type of measure and type of crime
Completed Attempted Crimea of violent violent violenoe orimes orimes
Self-protective measure (5,367,740) (2,075,420) (3,292,330)
Total 100.0 100.0
Used or brandiahed firearms .5 .l a
Used or brandished knife Oa Oa Used or brandished some other weapon 1.8 1.6 Used physical force 15.1 20.2 Tried to get help or frighten offender 19.8 19.2
Threatened or reasoned with offender 18.9 13.9 Nonviolent resistance, inoluding evasion 37.0 40.4
Other 6.9 4.6
NOTE: Detail may not add to total shown because of rounding. Number of self-proteotive measures employed by victims shown in parenthese3. Some respondents may have cited more than
100.0 .8 08
1.9 11.9
20.2 22.1
34.8 8.3
Percent distribution of self-protective measures employed by victims, by selected characteristics of victims
Both sexes Self-protective measure (5,367,740)
Total 100.0
Used or brandished firearm .5 Used or brandished knife Oa Used or brandished some other weapon 1.8
Used physioal foroe 5.1 Tried to get help or frighten offender 19.8
Threatened or reasoned with offender 18.9
Nonviolent resistanoe, inoluding evasion 37.0
Other 6.9
NOTE: Detail may not add to total shown beoause of rounding. Number of selfproteotive measu.res employed by victims shown in parentheses. Some respondents may
Sex Race Male Female White Black
(3,103,970) (2,263,780) (4,461,280) (798,150)
100.0 100.0 100.0 100.0
.8 .la .6 Oa Oa Oa
2.5 .9 1.8 17.1 12.4 15.2
13.5 28.4 19.9
21.6 15.2 19.5
36.8 37.2 35.8 7.6 5.8 7.2
have cited more than one self-protective measure employed. aEstimate is based on about 10 or fewer sample oases.
Oa Oa
2.2 15.8
19.1
15.7
41.6 5.6
66 Criminal Victimization in the United States, 1987
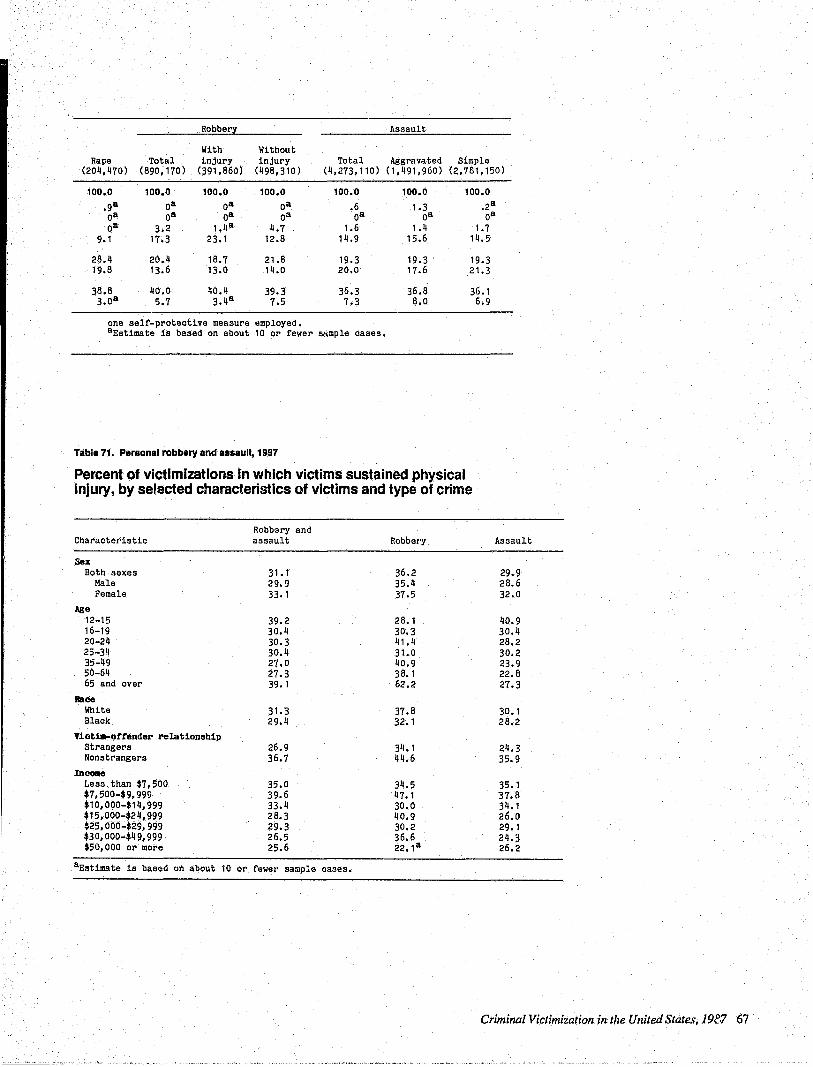
Robber:r: Assault
With Without Rape Total injury injury Total Aggravated Simple
(204,470) (890,170) <391,860) (498,310) (4,273,110) (1,491,960) (2,781,150)
100.0 100.0 100.0 100.0 100.0 100.0 100.0
.9a Oa Oa oa .6 1.3 .2a Oa Oa Oa Oa Oa Oa Oa 0: 3.2 1.4a 4.7 1.6 1.4 1.7
9.1 17.3 23.1 12.8 14 •. 9 15.6 14.5
28.4 20.4 18.7 21.8 19.3 19.3 19.3 19.8 13.6 13.0 14.0 20.0 17.6 21.3
38.6 40.0 40.4 39.3 36.3 36.8 36.1 3.0a 5.7 3.4& 7.5 7.3 8.0 6.9
one self-protective measure employed. aEstimate is based on about 10 or fewer sample cases.
Table 71. Personal robbery and assault, 1987
Percent of victimizations in which victims sustained physical injury, by selected characteristics of victims and type of crime
Robbery and Characteristic assault Robber'y Assault
Sex Both sexes 31.1 36.2 29.9
Male 29.9 35.4 28.6 Female 33.1 37.5 32.0
Age 12-15 39.2 28.1 40.9 16-19 30.4 30.3 30.4 20-24 30.3 41.4 28.2 25-34 30.4 31.0 30.2 35-49 27.0 40.9 23.9 50-64 27.3 38.1 22.8 65 and over 39.1 62.2 27.3
Race White 31.3 37.8 30.1 Black 29.4 32.1 28.2
Yiett.-offender relationship Strangers 26.9 34.1 24.3 Nonstrangers 36.7 44.6 35.9
InCOlle Less "than $7,500 35.0 34.5 35.1 $7,500-$9,999 39.6 47.1 37.8 $10,000-$14,999 33.4 30.0 34.1 $15,000-$24,999 28.3 40.9 26.0 $25,000-$29,999 29.3 30.2 29.1 $30,000-$49,999 26.5 36.6 24.3 $50,000 or more 25.6 22.,a 26.2
aEstiJllate is based 011 about to or' fewel' sample csses.
Criminal Victimization in the United States, 19e.7 67

Table 72. Personal crimes 0' vIolence, 1987
Percent distribution of victims receiving medical care, by type of crime and where care was received
At home Health or neish- unit at bOl"S or work or
At ehe friend's f.'irst aid Typ& of crime Total scene home station
Crt.es of violence (1,183,700) 100.0 6.7 30.0 2.4
Completed (1,095,770) 100.0 7.1 29.2 2.6 Attempted (87,930) 100.0 2.1 8 40.0 Oa
Rape (64,210) 100.0 3.1a 16.8a Oa
Robbery (278,820) 100.0 5.4a 34.1 2.0a Completed (208,630) 100.0 6.3a 31.8 2.7 a Attempted (70,190) 100.0 2.6a 41.0 Oa
Assault (840,670) 100.0 7.5 29.6 2.8 Aggravated (464,960) 100.0 5.1 19.8 1.9a Simple (375,710) 100.0 10.4 41.8 3.9a
Emergency Doctor's room at office or hospital, health emergency clinio clinic
13.3 29.1
13.2 29.1 14.1 a 29.6
20.3a 40.1
8.0 32.3 7.1 a 31.5
10.6a 34.6
14.5 27.2 11.9 35.7 17.7 16.7
NOTE: Detail may not add to total shown because of rounding. attention at more than one location.
Hospital Other
15.9 2.6
16.3 2.5 10.3a 3.98
19.88 08
17.0 1.2a 20.5 08
6.4a 4.9a
15.2 3.2 23.3 2.3a 5.2 4.4
Number of places where victims received medical care shown in aEstimate is based on about 10 or fewer sample cases. parentheses. Some respondents may have received medical
Table 73. Personal crImes of vIolence, 1987
Percent of victimizations in which victims incurred medical expenses, by selected characteristics of victims and type of crime
Characteristic Crimes of violenoea Robbery Assault
Race All racesb
White Black
Victt.-offender relationship Strangers Nomltrangers
NOTE: Data include victimizations in which the amount of medical expense incurred was not known.
Table 74. Personal crimes of VIolence, 1987
10.1 10.0 11.1
9.1 11.4
14.2 8.7 15.1 8.6 12.0 9.7
13.3 7.2 18.1 10.2
aIncludes data on rape, not shown separately. bInoludes data on "other" races, not shown separately.
Percent of victimizations in which injured victims incurred medical expenses, by selected characteristics of victims and type of crime
Characteristic
Race All racesb
White Black
VictiR-offender relationship Strangers Ncnstrangers
NOTE: Data include victimizations in which the amount of medical expense incurred was not known.
Crl.llIes (If' violencea Robbery Assault
31.7 39.4 28.9 31.3 39.9 28.7 36.5 37.2 34.2
33.0 38.9 29.7 30.5 40.6 28.3
~Includes data on rape, not shown separately. Includes data on "other" races, not shown
separately.
68 Criminal Victimization in the United States, 1987

Table, 75. Personal crimes of vlolenc., 1987
Percent distribution of victimizations in which injured victims incurred medical expenses, by selected characteristics of victims, type of crime, and amount of expenses
Charaoteristio and Less $50- $250 type of orime Total than $50 $249 or more
Raoe All raoesa
Crimes of violenoeb (572,250) 100.0 12.9 21.3 31.3 Robbery (146,710) 100.0 11.8 15.6 33.2 Assault (388,480) 100.0 13.3 23.2 30.7
White Crimes of violenoeb (464,500) 100.0 14.3 23.8 34.1
Robbery (112,750) 100.0 13.40 20.3 35.7 Assault (327,680) 100.0 14.2 25.5 32.5
Blaok Crimes of violenceb (100,300) 100.0 7.3 0 9.4 0 19.1
Robbery (32,000) 100.0 6.7 0 00 20.5° Assault (57,180) 100.0 9.0 0 12.0° 22.0°
Viotia-orrender relationabip Involving strangers
Crimes of violenceb (294,250) 100.0 12.5 16.8 33.1 Robbery (109,170) 100.0 7.8c 11. ll ti 40.9 Assault (167,720) 100.0 13.9 19.2 30.1
Involving nonstrangeGs Crimes of violenoe (278,000) 100.0 13.3 26.1 29.5
Robbery (37,540) 100.0 23.3 0 27.9° 10.eo Assault (220,750) 100.0 12.8 26.3 3:.1
Amount not known
34.5 39.4 32.8
27.8 30.6 27.8
64.3 72.8 57.0
37.7 39.9 36.7
31.1 37.9° 29.8
NOTE: Detail may not add to total shown bIncludes data on rape, not shown separately. °Estimate is based on about 10 or beoause of rounding. Number of viotimi-
zations shown in parentheses. aInoludes data on "other" raoes, not
fewer sample oases.
shown separately.
Table 76. Personal crimes of Violence, 1987
Percent of victimizations in which injured victims had health insurance coverage or were eligible for public medical services, by selected characteristics of victims
Charaoteristio
Race All raoesa
White Blaok
Annual raaily inOOM
Less than $7,500 $7,500-$9,999 $10, '""{)-$14, 999 $15,,-JO-$24,999 $25,000-$29,999 $30,000-$49,999 $50,000 or more
Percent oovered
6T.3 66.0 70.6
54.3 63.3 68.3 70.2 66.6 71.8 96.4
NOTE: Data inolude only those viotimizations in whioh viotims reoeived medioal attention. aInoludes data on "other" raoes, not shown separately.
Criminal Victimization in the United States, 1987 69

Table 77. Personal crimes of violence, 1987
Percent of victimizations in which victims received hospital care, by selected characteristics of victims and type of crime
Crimes of Characteristic violenoea Robbery
Sex Both sexes 7.1 10.4
Male 7.0 11.4 Female 7.4 B.B
Age 3.0b 12-19 5.9
20-34 6.3 9.6 35-49 9.3 14.2 50-64 B.B 13.2b
65 and over 21.0 35.0
Race White 7.2 10.9 Bl.aok 7.7 B.B
Victt.-offender relationship strangers 6.7 10.3 Nonstrangers 7.B 10.9
a1ncludes data on rape, not shown separately. bEstimate is based on about 10 or fewer sample cases.
Table 78. Percent crimes of violence, 1987
Percent of victimizations in which injured victims received hospital care, by selected characteristics of victims and type of crime
Crimes CJf Characteristic violencea Robbery
Sex Both sexes 22.5 2B.7
Male 23.5 32.2 Female 21.2 23.4
AtJ;e 10.3b 12-19 16.7
20-34 20.4 27.5 35-49 34.0 34.6 50-64 32.3 34.6b 65 and over 52.B 56.2
Race White 22.4 2B.B Black 25.3 27.4
Victt.-offender relationship strangers 24.3 30.1 Nonstrangers 20.B 24.1\
~Includes data on rape, not shown separately. Estimate is based on about 10 or fewer sample cases.
70 Criminal Victimization in the United States, 1987
Assault
5.9 6.0 5.9
5.3 5.3 B.O 7.0b
12.5b
6.0 6.3
5.0 7.0
Assault
19.9 21.0 1B.3
19.9 22.3
20.5 19.5

Table 79. Parsonal crimes of violence, 1987
PerceVlt distribution of victimizations in which injured victims received hospital care, by selected characteristics of victims, type of crime, and type of hospital care
Inl!atient oare Less
Characteristic and Emergency than 1-3 4 days Not type of orime Total room oare Total 1 day days or mo:"'1 available
Sex Both sexes
.6 b Crimes of violencea (406,040) 100.0 53.8 46.2 22.9 11.1 11.6 Robbery (106,920) 100.0 55.6 44.2 16.6 10.3b 17.3 Ob Assault (266,910) 100.0 52.2 47.6 25.8 11.9 9.2 .9b
Male 1 Ob Crimes of violencea (242,260) 100.0 52.3 47.7 20.1 11.0
b 15.5
Robbery (71,920) 100.0 56.5 43.5 12.4b 7.6 23.3 'Ob Assault (168,200) 100.0 49.9 50.1 23.7 12.6 12.4 1.4b
Female Crimes of violencea (163,760) 100.0 55.9 44.1 27.0 11.2 5.9 b Ob
Robbery (35,000) 100.0 54.2 45.6 25.3 b 15.6b 4.9 b Ob Assault (96,720) 100.0 56.0 44.0 29.4 10.6b 3.6b Ob
Race White
Ob Crimes of violencea (332,640) 100.0 56.6 43.5 24.3 7.8 11.4 Robbery (61,430) 100.0 61.1 38.8 14.2b 7.9b 16.7b Ob Assault (227,680) 100.0 53.0 47.0 29.6 7.6 9.8 Ob
Black Crimes of violencea (69,490) 100.0 38.3 61.7 17.5b 27.6 13.2b 3.5b
Robbery (23,530) 100.0 33.5b 66.5b 26.4 b 19.5b 20.6b OD Assault (37,280) 100.0 44.3 55.7 4.0b 39.1 b 6.1 b 6.4 b
Victim-orfender relaticnship Involving strangers
Ob Crimes of violencea (216,640) 100.0 59.7 40.3 20.4 10.3 9.6 Robbery (84,400) 100.0 56.2 41.8 16.4b 11.0b 14.4b Ob Assault (115,440) 100.0 64.0 36.0 20.8 11.3 4.0 b Ob
Involving nonstrangers 1.3b Crimes of violencea (189,390) 100.0 47.0 53.0 25.8 12.0 13.9b Robbery (22,520) 100.0 46.6b 53.4 b 17.6b 7.7b 26.1 Ob
Assault (151,470) 100.0 43.2 56.9 29.7 12.4 13.2 1.6b
NOTE: Detail may not add to total shown because ~Includes data on rape, not shown separately. of rounding. Number of victimizations shown Estimate is based on about 10 or in parentheses. fewer sample cases.
Criminal Victimization in the United States, 1987 71

Table 80. Personal and household crimes, 1987
Percent of victimizations resulting in economic loss, by type of crime and type of loss
Theft losses Dama!3e losses All All With- All With-economic theft With out damage With out
Type of crime losses losses damage damage losses theft theft
All personal crimes 711.9 69.5 9.1 60.3 14.6 9.1 5.5 Crimes of violence 23.7 12.2 2.0 10.2 13.6 2.0 11.5
Completed 47.4 32.8 5.5 27.3 20.1 5.5 14.6 Attempted 9.9 .1 a oa .1 a 10.0 Oa 10.0 Rape 22.9 8.4a Oa 8.4a 14.4 Oa 14.4 Robbery 69.4 65.8 11.1 54.7 14.7 11.1 3.6
Completed 100.0 100.0 16.9 83.1 16.9 16.9 With injury 100.0 100.0 23.7 76.3 23.7 23.7 Without injurY 100.0 100.0 12.3 8".7 12.3 12.3
Attempted 1 O. 4 10.4 10. /1 With injury 13.6a 13.6a 13.68
Without injury 9.2 9.2 9.2 Assault 13.3 13.3 13.3
Aggravated 16.6 16.6 16.6 Simple 11.6 11.6 11.6
Crimes of theft 96.6 93.7 12.1 81.6 15.0 12.1 2.9 Completed 100.0 100.0 13.0 87.0 13.0 13.0 Attempted 46.2 46.2 46.2 Personal lal'ceny with contact 89.3 87.6 1.1 a 86.5 2.7a 1.1 8 1.78
Purse snatching 70.5 65.9 2.9a 63.0 7.5a 2.98 4.68
Pooket pioking 100.0 100.0 Oa 100.0 08 Oa
Personal larceny without contact 90.9 94.0 12.6 81.4 15.5 12.6 2.9 Completed 100.0 100.0 13.4 86.6 13.4 13.4
Less than $50 100.0 100.0 4.6 95.4 4.6 4.6 $50 or more 100.0 100.0 21.1 78.9 21.1 21.1 Amount not available 100.0 100.0 11.4 88.6 11.4 11.4
Attempted 48.9 48.9 48.9
All household ort-es 91.0 79.7 111.1 65.6 25.11 111.1 11.3 Completed 96.8 94.3 16.6 77.7 19.1 16.6 2.5 Attempted 59.7 1.1 .7 .48 59.3 .7 58.6 Burglary 84.9 63.1 21.7 41.4 43.5 21.7 21.9
Completed 90.1 82.3 28.1 54.2 35.9 28.1 7.8 Foroible entry 94.5 79.7 57.6 22.2 72.4 57.6 14.6 Unlawful entry without force 86.3 84.5 3.0 81.5 4.8 3.0 1.8
Attempted forcible entry 68.6 2.0 1.3 .7a 67.9 1.3 66.6 Household larceny 95.3 93.0 8.9 84.1 11.3 8.9 2.4
Completed 100.0 100.0 9.6 90.4 9.6 9.6 Less than $50 100.0 100.0 5.2 94.8 5.2 5.2 $50 or more 100.0 100.0 13.3 86.7 13.3 13.3 Amount not available 100.0 100.0 9.0 91.0 9.0 9.0
Attempted 33.8 33.8 33.8 Motor vehicle theft 88.6 65.5 16.2 49.4 39.3 16.2 23.1
Completed 100.0 100.0 24.7 75.3 24.7 24.7 ,utempted 67.1 67.1 67.1
NOTE: Detail may not add to total does not equal the entry shown under shown because of rounding. Because both "All economic losses." theft and damage losses occurred in some ••• Not applicable. Victimizations, the sum of entries under aEstimate is based on about 10 or "All theft losses" and "All damage losses" fewer sample cases.
72 Criminal Victimization in the United States, 1987

Table 81. Personal crimes of violence, 1987
Percent of victimizations resulting in economic loss, by type of crime, type of loss, and victim-offender relationship
The ft losses Damage losses All All Involving All Involving economic victimi- Involving non- victimi- Involving non-
Type of crime losses zations strangers strangers zations strangers strangers
Cr1aes of violence 23.7 12.2 16.11 6.6 13.6 12.4 15.1 Completed 47.4 32.8 46.8 16.7 20.1 18.9 21.5 Attempted 9.9 .1 a .2a Oa 9.8 9.0 10.9
Rape 22.9 8.4a 9.2a 7.5a 14.4 7.4a 22.8a
Robbery 69.4 65.8 63.4 75.5 14.7 12.8 22.3 Completed 100.0 100.0 100.0 100.0 16.9 14.6 24.6
With injury 100.0 100.0 100.0 100.0 23.7 21.5 30.2 Without injury 100.0 100.0 100.0 100.0 12.3 10.0 20.4
Attempted 10.4 10.4 9.7 14.9a With injury 13.68 13.6a 12.9a 15.7a Without injury 9.2 9.2 8.6 14.3a
Assault 13.3 13.3 12.5 14.2 Aggravated 16.6 16.6 14.2 20.3 Simple 11.6 11.6 11.3 11.8
NOTE: BecaUse both theft and damage losses ••• Not applicable. ocourred in some victimizations, the sum of aEstimate is based on about 10 or fewer entries under each "All victimizations" c(lte- sample cases. gory does not equal entry shown under "Al! economic losses."
Criminal Victimization in the United States, 1987 73

Table 82. Personal and household. 1987
Percent distribution of victimizations resulting in economic loss, by race of victims, type of crime, and value of loss
No Less Not known monetary than $500 and not
Race and type of crime Total value $50 $50-$99 $100-$249 $250-$499 or more available
All raoesa
All personal crimes (14,238,550) 100.0 .9 39.4 14.0 16.3 7.7 8.5 13.3 Crimes of violenceb (1,343,610) 100.0 4.0 21.8 7.8 9.3 8.2 9.6 39.4
Completed (989,300) 100.0 2.0 23.3 9.8 10.5 9.6 10.9 33.8 Attempted (354,310) 100.0 9.4 17 .6 2.3° 5.6 4.1° 5.8 55.2 Robbery (714,910) 100.0 1.0° 26.3 13.0 12.0 13.7 15.1 18.9
Completed (678,150) 100.0 0° 27.1 13.7 12.7 13.8 15.3 17.4 With injury (275,650) 100.0 0° 23.8 11.7 17.2 11.1 16.5 19.7 Without injury (402,490) 100.0 0° 29.4 15.0 9.6 15.6 14.5 15.8
Attempt~d (36,770) 100.0 19.4° 12.0° 0° 0° 11.5° 10.9° 46.1 With injury (13,230) 100.0° 54.0° 0° 0° 0° 0° 0° 46.0° Without injury (23,530) 100.0 0° 18.8° 0° 0° 17.9° 17.1° 116.2°
Assault (596,490) 100.0 7.4 14.9 2.1° 6.1 1.7° 3.4 64.4 Aggravated (255,840) 100.0 '( .3 12.2 2.3° 8.2 3.1° :~.1° 64.7 Simple (340,650) 100.0 7.5 16.9 1.9° 4.50 .6° 4.4 0 64.2
Crimes of theft (12,894,940) 100.0 .6 41.2 14.7 17.1 7.6 8.4 10.5 Completed (12,509,770) 100.0 .3 42.1 14.9 17.2 7.7 8.5 9.3 Attempted (385,170) 100.0 9.1 11.3 6.2 12.2 6.3 4.9 49.9 Personal larceny with oontaot (4511,090) 100.0 0° 43.7 15.4 24.2 6.3 5.0 5.3 Personal laroeny without contaot (12,440,860) 100.0 .6 41.1 14.6 16.8 7.7 8.5 10.7
All housebold orimes (14,309,860) 100.0 1.9 28.9 12.3 13.9 6.1 19.7 15.2 Completed (12,839,440) 100.0 .8 30.0 13.0 14.8 8.5 21.5 11.4 Attempted (1,470,430) 100.0 12.2 19.4 6.4 6.0 4.,) 3.4 48.3 Burglary (4,776,120) 100.0 3.8 16.3 8.1 12.3 8.5 27.1 23.9
Completed (3,852,780) 100.0 1.2 14.9 9.2 14.2 10.4 33.3 16.9 Forcible entry (1,856,150) 100.0 1.9 7.9 3.8 7.8 8.8 44.7 25.1 Unlawful entry without force (1,996,630) 100.0 .5° 21.4 14.2 20.1 11.8 22.6 9.3
Attempted forcible entry (923,340) 100.0 15.0 21.9 3.4 4.1 .60 1.50 53.4 Household larceny (8,222,950) 100.0 1.0 40.5 16.1 16.4 8.0 7.6 10.5
Completed (8,017,640) 100.0 .7 40.9 16.3 16.6 6.2 7.6 9.7 Attempted (205,110) 100.0 12.3 25.9 6.7 5.5° 2.6° 5.3° 39.7
Motor vehiole theft (1,310,800) 100.0 1.2 2.4 3.7 4.3 6.7 68.5 13.2 Completed (968,820) 100.0 .2° .2° .4 0 1.7 3.5 90.1 3.8 Attempted (341,990) 100.0 4.2° 8.5 13.1 11.5 15.7 7.3 39.6
lihite
All personal orimes (12,258,140) 100.0 .9 39.8 13.9 16.6 7.7 8.3 12.8 Crimes of violenceb (1,039,830) 100.0 4.0 21.8 7.3 9.4 7.0 8.0 42.5
Completed (732,720) 100.0 2.00 23.4 9.5 10.6 8.2 9.6 36.7 Attempted (307,110) 100.0 8.8 18.2 1.90 6.5 4.1° 4.2 0 56.4 Robbery (511,790) 100.0 1.4° 27.6 12.8 11.6 12.2 13.7 20.7
Completed (476,940) 100.0 0° 29.1 13.7 12.5 12.2 13,8 18.6 With injury (217,750) 100.0 0° 26.9 10.4 16.3 11.2 15.1 20.0 Without injury (259,190) 100.0 0° 30.9 16.5 g.2 13.1 12.8 17.5
Attempted (34,840) 100.0 20.5° 7.2° 00 00 12.1 0 11.5° 48.7 With injury (13,230) 100.0° 54.0 0 0° 00 00 0° 0° 46.0° Without injury (21,610) 100.0 00 11.6° 0° 0° 19.5° 18.60 50.30
Assault (511,040) 100.0 6.4 15.4 2.00 7.1 2.00 2.50 64.6 Aggravated (226,170) 100.0 5.9° 13.0 2.7 0 9.3 3.5 0 2.4 63.1 Simple (284,870) 100.0 6.7 17.3 1.5° 5.3° .7° 2.6° 65.8
Crimes of theft (11,218,310) 100.0 .6 41.4 14.5 17.2 7.8 8.4 10.0 Completed (10,875,510) 100.0 .3 42.4 14.8 17.4 7.8 iI.s 8.8 Attempted (342,790) 100.0 9.2 10.4 6.6 11.3 7.1 5.5 49.9 Personal laroeny with contact (344,600) 100.0 OC 43.1 13.5 26.9 6.0 5.2 5.3 Personal larceny without contact (10,873,710) 100.0 .6 41.4 14.6 16.9 7.9 8.5 10.2
74 Criminal Victimization in the United States. 1987

.---No Less Not knOlni monetary than $500 and not
Raoe and type of orime Total value $50 $50-$99 $100-$249 $250-$499 or more available
libite
All household orimes (11,821,320) 100.0 1.9 30.2 12.0 13.9 8.0 19.6 111.4
Completed (10,678,380) 100.0 .8 31.1 12.7 14.6 8.5 21.4 10.8 Attempted (1,142,940) 100.0 11.9 21.6 5.2 6.9 3.9 3.2 47.3
Burglary (3,847,350) 100.0 3.8 17.2 8.0 12.5 8.7 27.3 22.5 Completed (3,125,520) 100.0 1.3 15.4 9.1 14.2 10.6 33.3 15.9
Forcible entry (1,420,670) 100.0 2.4 7.8 3.4 8.2 8.9 45.4 23.9 Unlawrul entry without force (1,704,850) 100.0 .4 c 21.8 13.9 19.2 12.1 23.3 9.3
Attempted forcible entry (721,830) 100.0 14.6 24.7 3.2 5.0 .5° '.2° 50.8
Household laroeny (6,908,190) 100.0 1.0 41.7 15.6 16.1 7.9 7.5 10.2 Completed (6,742,160) 100.0 .7 42.1 15.9 16.3 8.0 7.5 9.4 Attempted (166,030) 100.0 12.5 25.9 4.3° 5.7 0 3.2° 5.4° 43.0
Motor vehiole theft (1,065,780) 100.0 1.0° 2.5 3.2 4.5 6.1 70.6 12.0 Completed (810,690) 100.0 .2° .2° .5° 1.9° 3.6 90.4 3.2 Attempted (255,090) 100.0 3.7 0 9.8 11.6 12.9 14.2 7.6 40.1
Blaok
All personal ort.es (1,6112,1190) 100.0 .8° 35.9 14.6 tII.9 8.0 8.8 16.9
Crimes of violenoeb (277,830) 100.0 3.5 0 21.0 9.0 9.6 13.4 14.3 29.2
Completed (238,930) 100.0 2.3° 21.6 10.5 11.2 14.7 13.5 26.3 Attemptod (38,900) 100.0 11.3° 17.1 0 0° 0° 5.20 19.4 0 47.0
Robbery (191,130) 100.0 0° 22.6 13.1 14.0 18.4 16.8 15.2 Completed (189,210) 100.0 0° 21.8 13.2 14.1 18.6 17.0 15.3
With injury (53,620) 100.0 00 13.00 13.7° 21.9° 11.40 19.7° 20.30
Without injury (135,590) 100.0 0° 25.3 13.0 11.0° 21.4 16.0 13.4 Attempted (1,920) 100.00 00 100.0° 0° 0° 00 0° 0°
W.ith injury (0) 100.00 00 0° 0° 00 0° 0° 0° Without injury (1,920) 100.00 0° 100.0° 0° 0° 0° 0° 0°
Assault (77.140) 100.0 12.7° 13.1° 0° 0° 0° 9.8° 64.4 Aggravated (27,760) 100.0 '11).1° 6.1 0 0° 0° 0° 0° 74.8 Simple (49,380) 100.0 9,,2° 17.0° 0° 0° 0° 15.3° 58.5
Crimes of theft (1,364,660) 100.0 .3° 39.0 15.7 16.0 7.0 7.7 14.4
Completed (1,327,650) 100.0 .2° 39.6 16.1 15.8 7.1 7.9 13.3 Attempted (37,000) 100.0 5.0° 15.90 4.3° 22.0° 0° 0° 52.9
Personal larceny with oontact (86,130) 100.0 0° 46.7 20.5 17.4° 7.3° 5.9° 2.1° Peraonal larceny without contact (1,278,530) 100.0 .3° 38.4 15.4 15.9 6.9 7.8 15.2
All household ort.es (2,182,060) 100.0 2.1 22.5 13.6 13.7 8.2 19.8 20.1
Completed (1,901,530) 100.0 .6° 24.1 14.2 15.3 8.7 22.1 15.1 Attempted (280,530) 100.0 12.1 11.7 9.4 3.0° 4.8° 4.5° 54.4
Burglary (825,580) 100.0 3.8 12.1 8.3 11.2 7.6 25.4 31.6 Completed (637,280) 100.0 .5° 11.9 9.4 14.2 9.5 32.1 22.4
Forcible entry (381,670) 100.0 .50 8.8 4.6 6.0 8.8 40.6 30.8 Unlawful entry without force (255,600) 100.0 .7c 16.5 16.7 26.5 10.5 19.3 9.8
Attempted forcible entry (188,310) 100.0 14.9 12.9 4.4c 1.1° 1.2° 2.8° 62.7
Household larceny (1,158,410) 100.0 1.1° 33.5 19.0 17.0 8.6 8.3 12.5 Completed (1,126,910) 100.0 .7° 34.0 18.6 17.5 8.8 8.4 11.9 Attempted (31,500) 100.0 111.4° 13.9° 33.8° 0° 0° 5.7° 32.2°
Motor vehicle theft (198,070) 100.0 .8° 2.0° 3.8° 4.2° 8.3 63.8 17.1 Completed (137,350) 100.0 0° 0° 0° 1.3° 3.7° 88.0 7.1° Attempted (60,720) 100.0 2.50 6.6° 12.5° 10.7° 18.7° 9.1° 39.9
NOTE:: Detail may not add to total shown because of rounding. blncludes data on rape, not shown separately. Number of victimizations shown in parentheses. cE:stimate 1s based on about 10 or fewer sample cases. a1noludes data on "other" races, not shown separately.
Criminal Victimization in the United States, 1987 75
'~~-----=--

Table 83. Selected persona! crlmas,1987
Percent distribution of victimizations resulting in theft loss, by race of victims, type of crime, and value of loss
No Less Not knolln Raoe and type monetary than $1,000 and not I,f crime Total value $10 $10-$49 $50-$99 $100-$249 $250-$999 or more available
Al.l racesa P.obbery (678,15~) 100.0 00 B.4 21.8 14.6 14.3 23.5 9.4 8,1 Crimes of theft (12,5C9,770) 100.0 .3 11.7 32.1 15.8 18.8 13.2 3.3 4.8
White Robbery (476,94g) 100.0 00 9.3 22.8 14.5 13.8 20.9 9.1 9.5 Crimes of theft (10,875,510) 100.0 .3 11.9 32.2 15.6 19.0 13.4 3.4 4.3
Blaok Robbery (189,210) 100.0 OC 6.80 18.7 14.3 16.2 30.4 8.6 5.00
Crimes of theftb (1,327,650) 100.0 .20 10.4 30.2 17.4 17.0 12.8 3.0 9.1
NOTE: Detai~may not add to total shown beoause of rounding. bInoludes both personal larceny with contact and per-sonal Number of viotimizations shown in parentheses. larceny without oontaot. aIncludes data on "other" races, not shown separately. CEstimate is based on about 10 or fewer sample cases.
Table 84. Personal and household crlmes,l987
Percent distribution of victimizations resulting in theft loss, by race of victims, type of crime, and proportion of loss recovered
Some recovllred Less . Half Pro-
Raoe and type None re- than or portion All re- Not of crime Total coveredo Total half more unknownd covered available
All racesa
All personal ort.e.b (13,199,780) 100.0 73.5 5.9 1.1 1.2 3.5 3.6 17.0
Robbery (678,150) 100.0 59.8 13.8 3.5 2.1 e 8.2 6.2 20.3 Crimes of theft (12,509,770) 100.0 74.2 5.5 1.0 1.2 3.3 3.~ 16.9
Personal larceny with oontaot (445,660) 100.0 67.3 12.6 2.ge .8e 8.9 6.4 13.7 Personal larceny without contact (12,064,110) 100.0 74.5 5.2 .9 1.2 3.0 3.3 17.0
All household ort.ea (12,532,820) 100.0 70.3 7.9 1.2 1.1 5.1 5.5 16.2
Burglary (3,546,160) 100.0 62.6 6.4 1.5 1.4 3.5 4.0 27.0 Household larceny (8,017,840) 100.0 80.8 3.5 .8 .S 1.9 4.2 11.5 Motor vehicle theft (968,820) 100.0 12.0 50.1 3.0 10.1 37.0 ~2.1 15.6
White
All personal crt.eab (1,,359,~00) 100.0 72.9 6.0 1.2 1.2 3.5 3.7 17.5
Robbery (476,940) 100.0 55.4 15.2 4.6 2.6" 8.0 7.7 21.7' Crimes of theft (10,875,510, 100.0 73.6 5.6 1.1 1.2 3.3 3.5 17.3
Personal larceny with oontact (336,180) 100.0 63.8 15.1 2.7e 1.0e 11.4 7.4 13.7 Personal laroeny' without contact (10,539.340) 100.0 73.9 5.3 1.0 1.2 3.1 3.4 17.4
All household or~a (10,_30.310) 100.0 69.2 8.2 1.2 1.8 5.2 5.8 16.8
Burglary (2,877,450) 100.0 59.8 6.8 1.6 1.5 3.6 4.2 29.3 Household laroelly (6,742,160") 100.0 80.1 3.8 .8 .9 2.2 4.5 11.5 Motor vehiole theft (810,690) 100.0 12.1 49.3 2.8 10.3 36.2 22.1 16.3
Blaok
All persoaal cr:t.eeb 0,521,790) l00.C 7'Y.l 6.3 .6e 1.5 4.2 2.7 111.0
Robbery (189,210) 100.0 69.6 11.0 .ge .ge 9.~ 2.8e 16.6 Crimes of theft (1,327,650) 10.0.0 78.4 5.5 .6e 1.5 3.3 2.5 13.6
Personal larceny with oontact (86,130) 100.0 81.1 6.1 e 4.28 Oe 1.ge 00 12.8e
Personal larceny withou~ oontact (1,241,530) 100.0 78.2 5.4 .4e 1.7 3.4 2.7 13.7
All household crt.ea (1,8_2.980) 100.0 16.2 7.0 1.0 1._ 11.7 11.0 12.7
Burglary (578.730) 100.0 75.6 4.4 .6e .ge 2.9 3.4 16.7 Householdlaroeny (1,126,910) 100.0 84.5 2.1 .7e .7e :,e 2.4 11.1 Motor vehiole thoft (137,350) 100.0 10.ge 59.0 4.86 9.3e 44.9 20.2 9.98
NOTE: Detail may ,not add to total shown because of I·ounding. data on assault, which by de:rin1tion does not involve theft. Number of viotimizations shown in parentheses. °Includes items that were taleen that had no value. aIncludes data. on ·other" races, not shown separately. dIncludes items that were rellovered that had no value. bInoludes data on rape, not shown aeparately. but exoludes eEstimate ~s balled on about '10 or fewer sample cases.
76 Criminal ViCtimization in the U,..it4!d States, J987
,,;, .. , ... ,""" ..... ,~.~. '" • ".~ •• ~.' fl,. _ •• , __ .... " ~._"-.JJ __ "~.

--------------
Tabla85. Household crimes. 1987
Percent distribution of victimizations resulting in theft loss, by value of loss and type of crime
All house- Household hold crimes Burglary larceny
Value of lOse (12,532,820) (3.546,160) (8,017,640)
Total 100.0 100.0 100.0
No monetary value .6 .28 .6 Lees than $10 • 8.9 4.0 12.1 $10-$49 22.8 12.4 30.2 $50-$99 13.7 10.0 16.9 $100-$249 16.1 16.3 17.7 $250-$999 17 .0 26.6 13.1 $1,000 or more 15.2 24.3 3.1 Not available 5.7 5.9 6.0
Motor vehicle theft (966,820)
100.0
.28
08
.28
.48
1.7 12.7 61.7
3.0
NOTE: Detail may not add to total shown because of aEstimate is based on about 10 or rounding. Number of victimizatio~s shown in parentheses. fewer sample cases.
Table 86. Persolllli and household crimes. 1987
Percent of victimizations resulting in loss of time from work, by type of crime
Type of crime
All personal crilllles
Crim~s_~f violence
Completed Attempted
Rape
Robbery Completed
With injury From serious assault From minor assault
Without injury Attempted
With injury From serious assault From minor assault
Without injury
Assault Aggravated
Percent
5.5
9.5 18.1
4.4
11.9
12.8 15,5 26.7 34.9 19.4 7.8 '7.6
24.1 33.6a 16.0a 1.6a
6.4 Table 87. Personal and household crimes. 1987
SImple
Crimes of theft
Completed Attempted
12.2 6.4
3.9
4.0 2.1
Percent of victimizations resulting in loss of time from work, by type of crime and race of victims
Personal larceny with contact
Personal larceny without contact Completed
Less than $50 $50 or more Amount not available
At,tempted
All household cri.as
Completed Att,Jmpted
Burglar.i' Completed
Forcible entry Unlawful entry without force
Attempted for~ible entry
Household laroeny Completed
Le S5 than $50 $50 or more Amount not available
Attempted
Motor vehicle theft Completed Attempted
aEstimate 15 based on about 10 or f~"ersample cases.
3.4
3.9 4.0 1.4 6.3 4.3 2.0a
5.5
5.6 3.9
6.3 7.3
11.0 4.2 3.0
2.8 2.7 1.1 4.3 1.58
3.7
18.7 25.1 6.6
Type of crime White Black
All personal cr~a 5.5 6.0
Crimes of violence 9.6 9.4 Completed 16.9 15.5 Attempted 4.4 5.2 Rape 17.08 14.9a
Robbery 13.7 11.2 Asaault 6.6 6.2
Crimes cf theft 3.9 3.9 Completed 4.0 4.2 Attempted 2.4 08
Personal larceny with oontact 4.5 08
Personal larceny without contact 3.9 4.2
All household cr~a 5.5 4.9 Completed 5.9 5.0 Attempted 3.6 4.6 Burglary 6.1 5.4 Household larceny 2.9 ?-.2 Motor vehicle theft 19.2 17.8
aEstimate is based on about 10 or fewer sample cases.
Criminal Victimization in the United States, 1987 77

(,
Table 88. Personal crImes of vlulence, 1987
Percel1t of victimizations resulting in loss of time from work, by type of crime and victim-offender relationship
All Involving Involving Type of crime victimizatiolls strangers nonstrangers
Crimes of viQleDce 9.5 9.0 10.1
Completed 18.1 18.1 18.1 Attempted 4.4 4.1 4.9
Rape 17.9 25.0 9.38
Robbery 12.8 13.0 12.2 Assault 8.4 7.0 10.0
aEstimate is based on about 10 01' fewer sample cases.
Table 89. Personal and household crimes, 1987
Percent distribution of victimizations resulting in loss of time from work, by type of crime and number of days lost
Less Not known than 1-5 6-10 11 days and not
Type of crime Total 1 day days days 01' more available
All personal crimes (1,054,330) 100.0 37.9 43.1 3.6 10.4 5.1
Crimes of violence (535,460) 100.0 18.6 49.9 5.6 17.6 8.3
Completed (3'78,450) 100.0 9.7 53.1 6.9 22.7 7.7 Attempted (157,010) 100.0 40.1 42.3 2.58 5.4a 9.68
llape (25,180) 100.0 11.6a 31.58 8.38 32.38 16.28
Robbery (132,270) 100.0 19.6 51.9 6.58 17.6 4.48
Assault (378,010) 100.0 18.7 50.5 5.1 16.6 9.1
Crimes of theft (518,870) 100.0 57.8 36.0 1.58 2.9 8 1.88
Completed (501,400) 100.0 57.5 36.2 1.68 3.08 1.98
Attempted (17,470) 100.0 68.6a 31.48 Oa 08 0&
Personal larceny with contact (17,340) 100.0 36.58 41.38 08 22.28 08
Personal larceny without contact (501,530) 100.0 58.6 35.8 1.68 2.28 1.98
All household crt.es (872,190) 100.0 43.9 45.6 2.~ 2.11 4.2
Completed (775,670) 100.0 42.3 46.5 2.3 2.7 4.1 Attempted (96,510) 100.0 56.8 38.2 08 Oa 5.0a
Burglary (352, 1150 ) 100.0 39.9 48.4 1.6a 3.88 4.4& Household larceny (242,830) 100.0 59.4 32.3 Oa 1.78 4.48
Motor vehiCle theft (276,920) 100.0 35.4 53.6 4.5a 1.18 3.98
NO'EE: Detail may not add to ~,otal shown because of rounding. Number of victimizations shown in parenthesea. aEstimate is based on about 10 01' fewer sample cases.
78 Criminal Victimization in the United States,1987

----------~--------------
Table 90. Personal crimes of violence, 1987
Percent distribution of victimizations resulting in loss of time from work, by number of days lost and victim-offender relationship
All Involving vIotimizations strangers
Number of days lost (535,460) (288,370 )
Total 100.0 100.0
Less than 1 day 18.6 20.7 1-5 days 49.9 48.7 6-10 days 5.6 5.0a 11 day" or more 17.6 16.8 Not known and not available 8.3 8.8
NOTE: Detail may not add to total shown beoause of rounding. Number of victimizations shown in parentheses. aEstimate is based on about 10 or fewer sample cases.
Table 91. Personal and household crimes, 1987
Involving nonstrangers (247,090)
100.0
16.2 51.4 6.3-
18.5 7.6
Percent distribution of victimizations resulting in loss of time from work, by race of victims, type of crime and number of days lost
Less Not known than 1-5 6-10 11 days and not
Race and type of crime Total 1 day days days or more available
Iihite
All personal crilles (895,980) 100.0 39.5 1i2.3 4.0 9.0 5.2
Crimes of violence (442,850) 100.0 20.0 50.0 6.3 14.9 8.8 Crimes of theft (453,130) 100.0 58.5 34.9 1.7a 3.3a 1.78
All household cri.as (719,850) 100.0 45.1 1l5.11 1.88 1.118 •• 3
Burgla.·y (278, 560) 100.0 44.9 45.7 1.2a 2.3a 4.0a Household larceny (208,520) 1.00.0 57.3 33.0 Oa 1.98 5.1 a Motor vehicle theft (232,770) 100.0 34.3 56.0 4.0a Oa 3.9a
Black
All personal crimes (1110,610) 100.0 28.5 47.8 1.5a 18.6 3.78
Crimes of violenoe (84,850) 100.0 12.9a 47.7 2.5a 30.7 6.1 a Crimes of theft (55,760) 100.0 52.1 47.9 Oa Oa 0&
All household crimes (117,260) 100.0 38.9 117 •• 2.8a 7.1· 3.88
Burglary (52,080) 100.0 24.5a 60.0 Oa 10.l a 5.4a Household larceny (26,060) 100.0 63.0 37.0a Oa Oa Oa Motor vehicle theft (39,110) -100.0 42.0 31.7a 8.5a 7.7a 4.1 8
NOTE: Detail may not add to total shown aEstimate is based on about 10 or because of rounding. Number of victimi- fewer sample cases. zations shown in parentheses.
Criminal Victimization in the United States, 1987 79-

'1/ "
---------------------------
Table 92. Personal and hOUS0hold crimes, 1987
Percer.;t distribution of victimizations, by type of crime and whether or not reported to the police
Type 0 f crilD_e
All crt.es (34,730,820)
All personal crimes (19,004,560)
Crimes of violence (5,660,570)
Completed (2,OS5,9~0) Attempted (3,574,620)
Rape (140,900) Completed (64,800) Attempted (76,090)
Robbery (1,030,460) Completed (678,150)
With injury (275,650) From serious assault (130,050) From minor assault (145,610)
without injury (402,490) Attempted (352,310)
With injury (97,090) From serious assault (44,730) From minor assault (52,370)
Without injul'y (255,220)
Assault (4,489,220) Aggravated (1,543,150)
Completed with injury (480,800) Attempted with weapon (1.062,350)
Simple (2,946.070) Completed with injury (862,200) Attempted without weapon (2,083,860)
Crimes of 'theft (13,343,980)
Completed (12,509,770) Attempted (834,210)
Personal larceny with contact (508,690) Purse snatching (184,940)
Completed (121,910) Attem?ted (63,030)
Pooket picking (323,760)
Personal larceny without contact (12,835,290) Completed (12,064,110)
L&ss than $50 (5,317,450) $50 or more (6,162,780) Amount not available (583,880)
Attempted (771,180)
All household crimes (15,726,260)
Completed (13,263,270) Attempted (2,462,990)
Burglary (5,623,160) Completed (4,276,620)
Forcible entry (1,963,280) Unlawful entry wHhout force (2,313,330)
Attempted forcible entry (1.346,540)
Household larceny (8,624,360) Completed (8,017,840)
Less than $50 (3,45S,690) $50 or more (4,OSO,310) Amount not available (478,830)
Attempted (606,520)
Motor vehicle theft (1,478,750) Compl&ted (968,S20) Attempted (509,930)
NOTE: Detail may not add to total shown because of rounding. Number of victimizations shown in parentheses. aFigures in this column represent the rates at which victimizations were reported
Reported to the police Not known and not
Total Yesa No available
100.0
100.0
100.0
100.0 100.0
100.0 100.0 100.0
100.0 100.0 100.0 100.0 100.0 100.0 100.0 100.0 100.0 100.0 100.0
100.0 100.0 100.0 100.0 100.0 HIO.O 100.0
100.0
100.0 100.0
100.0 100.0 100.0 100.0 100.0
100.0 100.0 100.0 100.0 100.0 100.0
100.0
100,0 100.0
100.0 100.0 100.0 100.0 100.0
100.0 100.0 100.0 100.0 100.0 100.0
100.0 100.0 100.0
36.9
33 .. 8
48.4
56.5 43.6
53.2 59.9 47.6
56.1 65.7 74.6 76.9 72.5 59.7 37.5 60.6 67.5 54.6 2S.7
46.4 59.6 61.5 58.8 39.5 46.2 36.8
27.6 27.9 23.0
33.4 44.8 59.1 11.1 b
26.9
27,4 27.6 10.9 111.9 28.9 23.4
!l0.6
41.9 33.5 52.1 58.6 76.6 43.4 31.5
27.5 27.4 14.3 39.2 22.0 2S.4
73.4 88.6 44.5
62.0
64.9
50.6
42.8 55.1
46.8 40.1 52.4
42.6 33.9 25.4 23.1 27.5 39.7 59.2 33.0
b 32.5 33.5 69.2
52.5 39.0 38.1 39.4 59.6 52.5 62,6
71.0
70.7 76.1
65.7 55.2 40.9 82.9 71.S
71.2 71.0 87.8 56.6 68.8 75.5
58.5
57.3 65.3
46.9 40.5 22.8 55.5 67.1
71.8 71.8 85.3 59,8 76.0 71.6
25.6 11.1 53.1
1.1
1.3
1.1
.7b
1.3 Ob ob Ob
1 lib • b .3 Ob Ob Ob
.6b
3.3b 6.4b
Ob 11.9b
2.1 b
1.0 1.4
.4b
1.8 .9
1.3b
.7b
1.4
1.4 1.0b
Sb 'ob Ob Ob
1.3b
1.4 1.ll 1.2 1.5
b 2.3b 1.1
.9
.8 1.3
1.0 .9
b .6 1.1 1.4
.8
.8b .4
1.0 2.0b
Ob
1.1 b
.4b
2.4 b
to the police, or "police reporting rates." bEstimate is based on about 10 or fewer sample cases.
80 Criminal Victimization. in the United States,1987 ( )

Tabl" 93. Personal crlmas,1987
Percent of victimizations reported to the police, by selected characteristics of victims and type of crime
All Crl!Des of Crimes of Charaoteristio personal orimes violenoe th'ect
Sex Both sexes 33.8 48.4 27.6
Male 32.7 44.5 26.8 Female 35.0 54.3 28.5
Race White 33.5 47.9 27.8 Blaok 36.9 52.8 26.9
Etbnicity Hispanio 37.3 48.7 29.9 Non-Hispanio 33.6 48.3 27.5
It :~ --
Table 94. Personal crimes, 1987
Percent of victimizations reported to the pOlice, by type of crimf~, victim-offender relationship, and sex of victims
All viotimizations Involving strangers Involving nonstrangers Both Both Both
Type of orime sexes Male Female sexes Male Female sexes Male Female
Crimes of violence 118.11 44.5 54.3 50.11 47.8 56.3 115.7 38.11 52.7
Completed 56.5 52.8 61.3 60.2 55.8 68.9 52.2 47.9 55.8 Attempted 43.6 40.2 49.5 45.1 43.8 48.4 41.4 32.9 50.4
Rape 53.2 58.8a 52.8 54.2 66.5a 53.2 52.1 49.1 a 52.3
Robbery 56.1 47.5 69.6 55.7 46.8 71.5 57.3 51.0 64.1 Completed 65.7 58.7 74.4 68.5 60.9 78.1 56.4 51.4 62.3
With injury 74',;; 70.0 81.5 75.3 67.8 87.6 72.2 77.6 65.4 From serious assault 76.9 74.7 85.0 80.5 75.8 100.0 64.2 70.2a 49.1 a
From minor assault 72.5 62.5 80.3 70.4 53.8 83.5 78.2 86.7a 71.6a
Without injury 59.7 49.7 70.4 64.0 55.3 'f3.2 44.3 30.6a 60.0 Attempted 37.5 31.0 54.6 33.6 29.3 118.6 60.3 49.4 a 68.5
With injury 60.6 51.7 72.9 55.5 48.0 70.0 75.3 71.3a 77.5a
From serious assault 67.5 63.8 75.2a 65.4 60.8 79.3a 77.5a lOO.Oa 68.3a
Fl'om minor assault 54.6 37.9a 71.7 45.2a 29.88 64.6a 74.3a 61.8a 82.5a
Without injury 28.7 25.1 41.3 26.7 24.5 36.2a 46.0a 34.0a 57.7a
Assault 46.4 43.8 50.8 48.4 118.1 49.2 44.4 37.1 51.7 Aggravated 59.6 59.4 60.1 61.1 60.7 62.5 57.4 56.9 58.0
Completed with injury 61.5 63.3 57.0 62.5 63.8 56.6 60.6 62.7 57.1 Attempted with weapon 58.8 57.6 61.5 60.7 59.6 63.8 55.0 52.4 58.6
Simple 39.5 33.9 47.3 39.7 38.9 ·41.9 39.3 27.1 49.8 Com,leted with injury 46.2 39.8 53.2 46.2 44.6 ~) 1. 9 46.1 33.4 53.5 Attempted without weapon 36.8 31.8 44.4 37.6 36.8 39.5 35,9 24.8 47.4
Cr1aes of theft 21 .• 6 26.8 28.5
Completed 27.9 27.3 28.6 Attempted 23.0 20.1 26.7
Personal laroeny with oonta~t 33.4 28.7 36.6 33.7 28.9 36.6 26.58 26.58 Oa
Purse snatohing 44.8 100.08 43.4 44.1 100.0a 43.4 100.08 100.0a 08
Completed 59.1 100.0a 57.5 58.3 100.0a 57.:5 100.0a 100.0a Oa Attempted 17.1 a Oa 17.1 a 1,.l a Oa 17 •.. \a Oa Oa Oa
Pooket picking 26.9 27.1 26.7 27.5 28.1 26.7' 15.5a 15.5a Oa
Personal laroeny without oontaot 27.4 26.7 28.1
Completed 27.6 27.2 28.0 Less than $50 10.9 10.2 11.6 $50 or more 41.9 40.2 44.0 Amount not available 28.9 26.1 31.0
Attempted 23.4 20.1 28.1
••• Not available. The distinotion between aEstimate is based on about 10 or' stranger and nonstranger is not ~de for the fewer sample oases. nonoontaot laroenies beoause viotims rarely see the offender.
Criminal Victimization in the UnUed Slates, 1987 81

Table 95. Personal crlmes,1987
Percent of victimizations reported to the police, by type of crime victim-ofiender relationship, and race of victims I
All victimizations Involvin~ strangers
Type of cI'ime White Black
Crt.es of Yiolence 47.9 52.8
Completed 55.1 67.5 Attempted 43.9 42.5
Rape 56.2 54.1
Robbery 56.4 57.7 Completed 64.5 72.0
With injury 73.6 80.7 From serious assault 74.9 90.4 From minor assault 72.5 72.4
Without injury 56.8 68.5 Attempted 42.0 23.2
With injury 72.7 36.3a From serious assault 76.8 33.9a From minor assault 67.9 37.3a
Without injury 32.4 28.4a
Assault 46.1 50.5 Aggravated 61.8 52.0
Completed with injury 63.1 61.1 Attempted with weapon 61.2 48.4
Simple 38.6 49.1 Completed with injury 44.4 64.2 Attempted without weapon 36.1 43.3
Crt.es of theft 27.8 26.9
Completed 28.0 27.8 Attempted 24.1 15.3a
Personal laroeny with contact 35.5 31.2 Purse snatching 46.8 45.Sa
Completed 61.5 72.3a Attempted 21.1 a Oa
Po clee t p lcking 29.0 23.9a
Personal larceny without contact 27.5 26.6 Completed 27.7 27.3
Less than $50 11.0 10.8 $50 or more 42.0 40.3 Amount not available 29.5 29.4
Attempted 24.3 17.3a
Not available. The distinction between stranger and nonstranger is not made for the noncontact larcenies because victims rarely see the offender. aEstimate is based on about 10 or fewer sample cases.
82 Criminal Victimization in the United States, 1987
White Black
50.0 53.7
57.9 72.5 46.0 40.6
52.6 60.6
56.1 57.0 67.4 74.4 75.1 75.2 78.0 88.3 72.3 62.8a 61.1 74.1 38.2 20.1a 67.2 31.8a 78.2 17.3a 50.5a 38.8a
30.4 14.1 a
48.2 50.2 63.3 52.7 60.4 83.0 64.3 1j5.7 39.2 46.7 45.0 58.1 a 37.3 1j3.5
36.6 28.1 46.8 41.4a 61.5 68.5a 21.1 a Oa 30.4 21.6a
Involving nonstrangers
White Black
45.1 51.5
51.8 60.9 40.9 45.1
59.4 38.7a
57.2 60.6 55.1 63.1 69.2 100.0a 63.7a 100.0a 73.0 100.0a 42.6 47.8a 62.6 48.7a 89.3a 48.7a 70.0a 100.0a
100.0a 33.5a
46.0a Oa
43.7 50.7 59.4 51.2 65.7 47.9 55.0 53.6 38.0 50.4 44.0 66.4 34.9 43.2
Oa 69.0B Oa 100.0B Oa 100.0a Oa OB oa 53.1 a

Table 96. Personal crimes, 1987
Percent of victimizations reported to the police, by type of crime, victim-offender relationship, and ethnicity of victims
All viotimizations Involvi~ stran~ers Non- Non-
Type of orime Hispanic Hispanio Hispanio Hispanic
Crimes of Yioleace lI8.7 lI8.3 _9.0 50.7 Completed 44.8 57.3 54.4 60.8 Attempted 50.8 43.1 46.1 45.3 Rape 42.9a 53.8 57.6a 53.9 Robbery 49.9 56.9 51.4 56.6
Completed 52.6 67.0 53.8 70.6 With injury 65.7 75.3 65.7 76.4
~L"om serious assault 55.1 a 80.3 54.6a 86.2 From minor assault 100.0a 71.3 100.0a 68.6
Without injury 45.5 61.1 46.5 66.7 Attempted 46.1 36.5 47.8 31.7
With injury 87.48 55.8 87.3a 47.5 From serious assault 100.0a 58.7 100.0a 53.48
From minor assault 53.2a 53.7 63.1 a 42.2a Without injury 29.1 a 29.1 28.5a 27.0
Assault 48.3 46.3 47.4 48.6 Aggravated 66.2 59.0 75.2 59.6
Completed with injur'y 58.8a 61.0 82.1 8 60.9 Attemptp.d with weapon 67.8 58.1 73.9 59.1
Simple 39.2 39.7 26.5 41.2 Completed with injury 34.6 '17.4 42.8a 46.9 Attempted without weapon 41.8 36.6 20.8 39.4
Cr~s of theft 29.9 27.5 Completed 31.7 27.7 Attempted 12.8a 24.0
Personal larceny with contact 31.5 34.1 31.5 34.4 PurlOle snatohing 37.9a 47.0 37.9a 46.2
Completed 63.6a 60.7 63.6a 59.7 Attempted Oa 20.4a Oa 20.4a
Pocket picking 27.28 27.0 27.2a 27.7
Personal larceny without oontact. 29.7 27.3 Completed 31.2 27.5
Less than $50 14.9 10.8 $50 or more 39.5 42.1 Amount not available 41.8a 28.7
Attempted 14.9a 24.3
Not available. The distinction between strange!' and noustranger is not made for the noncontaot larcenies beoause victims rarely see the offender. aEstimate is based on about 10 or fewer sample oases.
Involving nonstrangers Non-
Hispanio Hispanic
_8.0 lI5.3
29.8 53.3 59.5 40.2
Oa 53.5
34.7a 57.8 37.0a 56.0
Oa 72.2 Oa 64.2 Oa 78.2
37.0a 42',2 32.4a 53.7
Oa 75.3 08 77.5a Oa 74.3a
32.4a 49.7a
49.4 43.9 47.2 58.2 20.0a 61.0 5~ .1 56.0 50.1 38.3 30.5 47.7 65.3 33.7
Oa 26.5a Oa 100.0a Oa 100.0a 08 Oa Oa 15.5a
Criminal Victimization in the United States, 1987 83

Table 97. Personal cl'lmes,1987
Percent of victimizations reported to the pOlice, by type of crime and age of victims
Type of orime 12-19 20-34 35-49
All personal orilles 21.6 36.9 40.3
Cr~s of violence 311.7 50.4 61.9 Completed 38.1 60.3 71.9 Attempted 32.5 44.7 57. 11 Rape 50.0 56.4 27.0a
Robbery 34.1 55.4 66.5 Completed 41.7 64.0 76.0
With injury 46.8 69.1 91.3 From serious assault 51.7a 70.2 93.2 From minor assault 43.6a 60.1 87.4a
Without injury 39.1 60.5 64.8 Attempted 22.1 39.5 51.3
With injury 30.3a 66.2 74.7 From serioull assault 43.6a 60.1 100.0a From minor assault 27.9a 76.2a 60.7a
Without injur'y 19.7a 30.8 36.7a
Assault 34.3 48.9 61.3 Aggravated 51.6 58.0 75.5
Completed with injury 51.1 61.0 83.3 Attempted with weapon 51.9 56.8 72.2
Simple 25.5 44.4 52.8 Completed with injury 29.2 56.0 60.7 Attempted without weapon 23.5 39.6 50.8
Cr1lle1l of theft 14.6 30.3 34.0 Completed 14.6 31.0 311.3 Attempted 13.9 22.0 30.0
Personal larceny with contaot 17.9 32.7 31.5 Purse snatching 51.6a 31.4 45.4a
Completed 73.8a 41.8a 49.0a Attempted Oa 21.9a 32.0a
Pocket picking 5.8a 33.8 26.3
Personal larceny without contact 14.5 30.3 34.1 Completed 14.5 30.9 34.4
Less than $50 4.4 14.8 14.4 $50 or more 34.0 40.6 47.0 Amount not available 10.2a 37.8 37.7
Attempted 14.8 22.0 30.0
aEstimate is based on about 10 or fewer sample cases.
Table 98. Personal c:wlmes of vlolenee, 1987
Percent of victimizations reported to the pOlice, by age of victims and victim-offender relationship
All Involving Age victimizations strangers
All agell 118.4 50.4
12-19 34.7 37.1 20-34 50.4 50.5 35-49 61.9 66.9 50-64 61.1 63.1 65 and over 66.1 62.5
84 Criminal Victimization in the United States; 1987
65 and 50-64 over
35.6 44.3
61.1 66.1
84.7 76.2 45.7 57.5
Oa 100.0a
82.6 85.7 89.8 96.4
100.0 100.0 100.0a 100.0a 100.0 100.0a 83.6 89.8a 52.6a 26.9a 68.7a 54.3a 68.7a Oa
Oa 54.3a 42.6a Oa
52.4 55.6 71.8 55.4 77.7 37.7a 68.4 66.8a 39.2 55.7 76.7a 51.6a 33.1 56.7
29.7 37.9 29.9 39.3 27.3 16.1 a
47.6 44.9 69.7 52.6 90.4 59.3
Oa Oa 31.5a 39.7
28.8 36.7 28.7 38.0
9.7 22.9 45.1 50.3 17.5a 43.1 29.2 18.0a
Involving nonstrangers
45.7
32.2 50.4 55.0 57.8 74.1

Table 99. Household crimes, 1987
Percent of victimizations reported to the police, by type of crime, race of head of household, and form of tenure
All householdsa Both
Type of crime forms Owned Rented
All household crimes 110.6 114. I 36.8 Completed 41.9 45.4 38.0 Attempted 33.5 36.1 31.1
Burglat'J' 52.1 57.0 47.3 Completed 58.6 62.9 54.0
Forcible entry 76.6 80.2 72.5 Unlawful entry without foroe 43.4 47.9 38.6
Attempted forcible entry 31.5 34.1 29.6 Household larceny 27.5 31.11 22.7
Completed 27.4 31.4 22.6 Less than $50 14.3 17.9 9.5 $50 or more 39.2 45.4 32.h Amount not available 22.0 20.7 23.8
Attempted 28.4 32.7 23.5 Hotor vehicle theft 73.11 75.3 71.11
Completed 88.6 91.2 85.9 Attempted 44.5 44.9 44.2
alncludes data on "other" races, not shown separately. bEstimate is based on about 10 or fewer sample cases.
Table 100. Household crimes, 1987
Percent of victimizations reported to the pollee, by type of crime and annual family income
Less than $7.500-Type of crime $7,500 $9,999
All household criMes 30.9 33.8 Completed 32.5 311.0 Attempted 23.3 33.0
Burglat'J' 39.8 40.0 Completed 45.6 42.11
Forcible entry 61.4 61.2 Unlawful entry without force 34.6 26.2
Attempted forcible entry 23.8 31.3 Household larceny 19.3 21.6
Completed 19.3 21.4 Less than $50 11.2 11.7 $50 or more 27.0 33.0 Amount r.ot available 27.9 4.78
Attempted 18.2 23.7a
Motor vehicle theft 62.3 75.3 Completed 75.0 91.7 Attempted 30.6a 48.8a
aEstimate is based on about 10 or fewer sample cases.
White Black Both Both forms Owned Rented forms Owned Rented
40.8 1111.5 36.2 39.9 111.7 38.9
42.2 45.8 37.5 40.5 42.2 39.5 32.9 36.3 29.6 37.2 39.2 36.2 52.1 57.8 115 •• 52.6 ::"1.8 52.9 58.5 63.7 51.8 59.5 56.5 60.9 77.3 82.2 70.4 73.2 66.2 76.3 44.3 48.6 39.1 39.5 43.3 37.5 30.6 33.9 27.8 36.4 39.0 35.4 28 •• 32.1 23.4 22.9 27.2 20.1
28.3 31.9 23.6 22.5 28.1 18.7 14.6 17.9 9.7 13.9 19.9 9.5 41.3 46.9 34.5 28.5 35.5
b 24.1
22.4 21.1 24.4 19.9 18.8 20.9 b 28.6 35.4 20.1 30.6 8.0 b 43.5
73.3 75.0 71.5 76.4 80.4 72.9 87.6 90.2 84.7 95.1 97.2 93.\ 44.5 43.4 45.7 45.1 56.2 33.4
$10,000- $15,000- $25,000- $30,000- $50,000 $14,999 $24,999 $29,999 $49,999 or more
40.2 1\2.6 4 •• 7 113.0 48 ••
41.7 43.0 46.1 44.2 50.3 32.2 40.2 38.2 36.4 37.2
51.9 55.5 63 •• 62.5 56.5 58.8 61.4 68.7 70.4 62.4 78.3 76.3 88.8 89.7 80.6 39.0 50.1 44.1 49.7 50.9 31.1 35.3 46.2 36.9 34.3 25.9 28.11 30.7 28.11 37 •• 26.4 28.1 31.3 28.0 37.1 16.2 17.8 18.4 10.2 21.0 37.4 36.2 43.8 44.6 49.1 16.0a 27.6 17.8a 18.8 29.78
16.8a 32.6 26.0 33.5 41.8
75.7 82.2 68.5 67.6 77.0 86.9 90.6 83.5 90.2 94.7 53.6 62.2 43.5 38.1 37.0
Criminal Victimizatiicm in the United States, 1987 85

Table101. Household crimes, 1987
Percent of victimizations reported to the pOlice, by value of loss and type of crime
Va lue Of 10Ssl
All lossesb
Less than $100
$10-$49 $50-$99 $100-$249 $250-$999 $1,000 01' more
aThe proportions refer only to losses of cash and lor property and exolude the value of property damage. b"All losses" include data for victims who did not provide a specifio value for their losses.
All Motor household Household vehiole crimes Burglary laroeny theft
41.3 59.7 27./j 88.6
12.4 14.1 11.9 100.0d 17.8 31.7 15.3 Od 24.1 31.5 22.3 Od 41.3 49.6 37.8 53.5d 64.5 72.2 55.5 82.1 87.8 89.5 70.3 91.5
°Includes items that had no value. dEstimate is based on about 10 or fewer sample cases.
Table 102. Personal and household crimes, 1987
Percent distribution of reasons for reporting victimizations to the pOlice, by type of crime
To stop or prevent To keep this it from inoident happening In order from again or to oolleot
Type of orime Total happening to others insuranoe
All personal crimes (5,929,510) 100.0 8.7 16.6 6.8
Crimes of violence (2,336,380) 100.0 15.9 27.4 .5a
Completed (1,045,230) 100.0 10.9 24.7 .7a Attempted (1,291,150) 100.0 20.0 29.5 .41
Rape (87,030) 100.0 19.2 25.5 Oa
Robbery (630,020) 100.0 9.0 19.7 1.2a Completed (540,120) 100.0 8.3 18.8 1.41
With injury (235,460) 100.0 8.0 15.4 1,6a Without injury (304,650) 100.0 8.5 21J5 1,2a
Attempted (89,900) 100.0 13.1 a 25.1 01
With injury (41,130) 100.0 10.21 19.41 01
Without injury (48,770) 100.0 15.51 30.01 01
Assault (1,619,320) 100.0 18.5 30.4 .31
Aggravated (658,810) 100.0 15.7 26.6 .71
Simple (960,510) 100.0 20.4 33.1 Oa
Crimes of theft (3,593,130) 100.0 4.1 9.7 10.9
Completed (3,446,670) 100.0 4.0 9.3 10.8 Attempted (146,470) 100.0 6.6a 17.2 14.5
Personal larceny with contact (170,060) 100.0 4.5a 14.9 3.48
Personal larceny without contact (3,423,070) 100.0 4.0 9.4 11.3
All household or~s (6,/j92,350) 100.0 6.2 13.3 6.7
Completed (5,783,840) 100.0 5.1 12,8 8.8 Attempted (708,510) 100.0 15.5 17.5 7.7
Burglary (3,136,140) 100.0 7.9 15.6 7.2 Completed (2,789,150) 100.0 6.6 15.0 7.9
Forcible entry (1,768,340) 100.0 5.8 14.7 7.4 Unlawful entry without force
(1,020,810) 100.0 7.9 15.5 8.8 Attempted foroible entry (346,990) 100.0 18,3 19.9 1.6a
Household laroeny (2,319,530) 100.0 5.2 12.4 9.8 Completed (2,,158,980) 100.0 4.2 12.2 9.6 Attempted (160,550) 100.0 18.5 15.2 11.3
Motor vehiole theft (1,036,680) 100.0 3.7 8.5 10.8 Completed (835,710) 100.0 2.6 7.,0 9.6 Attempted (200,970) 100.0 8.1 15.1 15.4
NOTE: Detail may not add to total shown beoause of rounding. Number of reasons shown in parentheses. Some respondents may have oited more than one reason for reporting viotimizations to the polioe.
86 Criminal Victimizati'on in the United States, 1987

Desire to re- Need for To punish Because Some cover help after the Respond- it was other Not property incident offender ent's duty a crime reason available
21.5 1.11 6.6 8.5 12.3 16.2 1.2 6.3 3.4 9.1 7.0 12.1 16.9 1.3
12.2 6.2 12.0 6.8 10.4 15.5 .58 1.5 1.28 6.7 7.2 13.4 18.0 2.0 3.38 2.88 16.88 2.5a 8.8a 18.8 2.38
20.5 3.6 9.1 9.7 10.4 15.6 1.3a 23.6 3.8 9.6 9.7 8.4 16.2 .38 20.6 8.7 7.8 9.8 9.9 18.2 Oa 25.9 08 10.9 9.6 7.2 14.7 .Sa
1.9a 2.08 6.2a 9.6a 22.7 11.98 7.5 8
08 Oa 9'.1 8 10.2a 34.7 8 08 16.48
3.48 3.88 3.88 9.1 8 12.68 21.9a Oa
.98 3.4 8.7 6.2 12.9 17 .3 1.3 1.28 4.1 9.4 6.6 15.2 19.4 1.08
.88 2.9 8.2 6.0 11.3 15.9 1.58
31.4 .1 8 5.1 9.4 12.5 15.7 1.2 32.6 (Z)8 5.1 9.4 12.1 15.5 1.2 2.78 1.78 5.4a 10.8a 20.2 20.8 Oa
27.7 08 5.58 6.7a 16.4 18.5 2.48
31.5 .1 8 5.0 9.6 12.3 15.6 1.1
29.6 .2a 4.7 8.2 11.2 16.7 1.2
33.1 .2a 4.7 7.9 10.5 15.7 1.2 1.58 .2a 4.6 10.4 17 .3 24.5 .7a
24.5 .2a 5.2 8.9 11.6 18.0 .9 27.5 .28 5.6 8.5 11.0 16.8 .9 26.8 .38 6.3 9.5 10.8 17.6 .78
28.8 08 4.3 6.6 11.11 15.4 1.28
.58 08 2.1 8 12.1 16.9 27.6 1.08
30.8 .1 8 3.9 B.4 11.0 16.9 1.7 32.7 .1 8 3.7 8.3 11.1 16.3 1.8 4.38 08 7.08 9.78 9.08 24.9 08
42.6 .38 5.0 5.6 10.6 12.2 .8a 52.6 .28 4.5 5.0 7.2 10.5 .S8
.8a .9a 7.0a 8.1 24.7 19.0 .8a
Z: Less th8n .05 per 1,000. 8Est1mate is b8sed on about 10 or fewer sample cases,
Criminal Victimization in the United States, 1987 87
~"., .... '.' ," ••• " """C' ' ....... _, ... ,..,."., ..... ,~"'·", •. ,,"~_"'''<>.,'''~',_~.h_'.~ .... ~·', ~.".'r ~.".~.~''"._,., •• _,,>c . .,;" ~ __ "

Table 103. Personal and household crImes, 1987
Percent distribution of reasons for nat reporting victimizations to the pOlice, by type of crime
Objeot reoovered, Not im- Private or Reported offender un- po!·tant personal to some-
Type of orime Total suooessful enough matter one else
All personal ori.es (14.906,1180) 100.0 25._ 2.9 7.6 16.3 Crimea of violence (3,316,790) 100.0 17.7 4.9 23.7 10.1
Completed (1,019,950) 100.0 11.4 3.5 24.3 11.4 Attempted (2,296,840) 100.0 20.5 5.5 23.4 9.5 Rape (85.430) 100.0 2.6a Oa 13.7a 3.5a
Robbery (528,460) 100.0 15.0 .3a 16.7 5.6 Completed (273,420) 100.0 9.6 Oa 15.8 6.9
With injury (80.260) 100.0 7.2a Oa 18.0a 7.58
Without injury (193.170) 100.0 10.5 Oa 14.8 6.7a Attempted (255,030) 100.0 20.7 .7a 17.7 4.1 a
With injury (44,060) 100.0 22.8a Oa 21.5a Oa Without injury (210,970) 100.0 20.3 .8a 17.0 4.9a
Assault (2,702,900) 100.0 18.7 5.9 25.3 11.1 Aggravated (699.110) 100.0 15.7 6.0 21.8 8.7 Simple (2,003.790) 100.0 19.7 5.9 26.6 12.0
Crimes of theft (11,589,700) 100.0 27.6 2.3 3.0 18.0 Completed (10,845,590) 100.0 26.2 2.2 2.9 18.8 Attempted (744,100) 100.0 47.8 3.7 4.6 7.1 Personal larceny with contact (397,790) 100.0 21.5 4.0a 4.1 15.1
Purse snatching (133,430) 100.0 24.7 7.3a 3.0a 8.7a Pooket picking (264,360) 100.0 19.8 2.3a 4.6a 18.3
Personal laroeny withou~ oontaot (11,191,910) 100.0 27.8 2.2 2.9 18.1 Completed (10,512,240) 100.0 26.4 2.2 2.8 18.8
Less than $50 (5,601,830) 100.0 37.8 2.5 2.6 21.0 $50 or more (4,436,890) 100.0 12.0 1.7 3.3 15.9 Amount not available (473,520) 100.0 25.9 3.4 1.5a 21.2
Attempted (679,670) 100.0 49.0 2.6 4.7 7.5
All household orlaes (11,373,440) 100.0 31.4 5.0 5.3 3.3 Completed (9,511,650) 100.0 29.2 4.6 6.0 3.2 Attempted (1,861,790) 100.0 42.6 7.1 1.8 4.3 Burglary (3,284,570) 100.0 25.5 6.2 5.9 5.7
Completed (2,262,520) 100.0 19.4 4.7 8.1 5.3 Foroible entry (593,970) 100.0 19.1 2.2a 7.3 3.7 Unlawful entry without force
(1,668,550) 100.0 19.5 5.6 8.3 5.9 Attempted forcible entry (1,022,050) 100.0 39.1 9.5 1.1 a 6.5
Household larceny (7,612,170) 100.0 33.8 4.7 4.9 2.4 Completed (7,112,500) 100.0 32.7 11.6 5.0 2.5
Less than $50 (3,595,360) 100.0 48.2 5.6 3.8 2.0 $50 or more (3,099,000) 100.0 14.6 3.4 6.3 2.7 Amount not available (418,150) 100.0 34.4 5.2 6.5 5.3
Attempted laroeny (499,670) 100.0 48.7 5.3 3.6 1.,a
Motor vehiole theft (476,700) 100.0 34.0 3.2a 7.5 2.7a Completed (136,630) 100.0 8.0a 4.3a 23.6 4.1 8
Attempted (340,070) 100.0 44.5 2.7a 1.0a 2.1 8
NOTE: Detail may not add to total shown beoause of rounding. Number of reasons shown in parentheses. Some respondents may have cited more than one reason for not reporting victimizations to the police.
88 Criminal Victimization in the United States, 1987


