IESE Cities in Motion Index · IESE Cities in Motion Strategies is a research platform launched...
80
IESE Cities in Motion Index 2017
Transcript of IESE Cities in Motion Index · IESE Cities in Motion Strategies is a research platform launched...

IESE Cities in Motion Index
2017

IESE Cities in Motion Index
2017

Preface ____________________________________________________ _07
About us _____________________________________________________09
Introduction: The Need for a Global Vision ____________________________ _10
Our Model: Cities in Motion. Conceptual Framework, Definitions and Indicators ___ 11
Limitations of the Indicators ______________________________________ 22
Geographical Coverage __________________________________________ 22
Cities in Motion. Ranking _________________________________________ 24
Cities in Motion. Ranking by Dimension _______________________________ 26
Cities in Motion. Regional Ranking ___________________________________ 37
Noteworthy Cases ____________________________________________ __40
Evolution of the Cities in Motion Index ________________________________ 43
Cities in Motion Compared with Other Indexes __________________________ 46
Cities in Motion: A Dynamic Analysis _________________________________47
Recommenations and Conclusions __________________________________ 49
Appendix 1. Indicators ___________________________________________ 51
Appendix 2. Graphical Analysis. 180 City Profiles ________________________ 56
CONTENTS


IESE Business School - IESE Cities in Motion Index (ST-442-E)7
PREFACE
For the fourth consecutive year, we are pleased to present a new edition of our IESE Cities in Motion Index (CIMI). Since its inception, the CIMI has empirically validated our conceptual model, which assesses the cities in relation to 10 key dimensions: economy, human capital, technology, the environment, international outreach, social cohesion, mobility and transportation, governance, urban planning, and public management.
Our model has emerged in response to the intensification of the urbanization process that all regions of the world, at different rates, are experiencing. Globally, two-thirds of the population are expected to reside in cities in 2050, although this level of urban population is already a reality in many geographic areas. And while this trend of agglomeration in cities has a series of positive aspects, such as innovation, wealth creation, and economic competitiveness, it also has a dark side – where great global challenges put the sustainability of cities at risk. These challenges include demographic trends (aging of the population, segregation, immigration, and refugees), economic aspects (polarization of incomes and inflation), social divisions (heterogeneous social demands, a digital divide, inequality, and poverty), and environmental impacts (energy inefficiency, waste management, and pollution).
The scope and magnitude of these challenges demonstrate the need for the world’s cities to undertake a strategic review process that covers: what type of city they want to be, what their priorities are, and what process of change they will adopt in order to take advantage of the opportunities – and minimize the threats – of urbanization. We have observed with great satisfaction how various cities included in the index have used our study to carry out a comprehensive diagnosis and an initial benchmarking of other major cities through comparative analysis.
Encouraged by the positive reception our index of cities has had in various forums linked to city management, we have decided to publish the CIMI for another year. As in previous editions, we have tried to provide an index that is objective, comprehensive, wide-ranging and guided by the criteria of conceptual relevance and statistical rigor. The 2017 edition of the CIMI includes 180 cities – 73 of them capitals – representing 80 countries. The breadth of the project establishes the CIMI as one of the city indexes with the most widespread geographical coverage available today. Furthermore, for calculating the index, we have included 79 indicators that capture both objective and subjective data, providing a comprehensive view of each city.
Our efforts have not stopped here. Over the past year, we have issued a series of publications in the field of urban management. It is worth highlighting the start of a series of “mini-books” in English that identify good practices in each of the dimensions of the IESE Cities in Motion model. At the time of publication of this report, three books on good practices for the dimensions of the environment, mobility and transportation, and the economy are available on Amazon (for more information www.ieseinsight.com). This collection will be expanded shortly to cover the rest of our model’s dimensions. Furthermore, several academic articles have been published in prestigious journals such as the California Management Review and the Harvard Deusto Business Review.*
*For a complete list of publications visit the website http://www.iese.edu/cim.

IESE Business School - IESE Cities in Motion Index (ST-442-E)8
Finally, we have strengthened the presence of the IESE Cities in Motion platform on the Internet with our Twitter account (@iese_cim) and the launch of a new blog (http://blog.iese.edu/cities-challenges-and-management/). We regard our publications and the presence in cyberspace as being the ideal complements of this index to understand the cities’ situation better.
We are convinced that this report will be useful to mayors, city managers and all those interest groups whose aim it is to improve the quality of life of its residents. We also hope it will be valuable for urban solutions companies, since internationalization strategies are defined increasingly at the city level instead of the country level.
We regard this project as a dynamic one. We continue to work so that future editions of the index will contain the best indicators, wider coverage and a growing analytical and predictive value. We rely on your comments to improve and we invite you to get in touch with the platform through our website: www.iese.edu/cim.
We are convinced that we can live in better cities, but this will be possible only if all the social actors – the public sector, private companies, civic organizations and academic institutions – contribute and collaborate to achieve this common goal. This report is our small contribution.
THE AUTHORS
Prof. Pascual Berrone
Schneider Electric Sustainability and Strategy Chair
Prof. Joan Enric Ricart
Carl Schroeder Chair of Strategic Management

IESE Business School - IESE Cities in Motion Index (ST-442-E)9
WORKING TEAM
ACADEMIC TEAM
Prof. Pascual Berrone Schneider Electric Sustainability and Strategy Chair
Prof. Joan Enric Ricart Carl Schroeder Chair of Strategic Management
Carlos CarrascoResearch Collaborator
Ana Isabel Duch T-FiguerasResearch Collaborator
TECHNICAL TEAM
David Augusto Giuliodori Econfocus Consulting
María Andrea GiuliodoriProfessor of Statistics, Institute of Stock Exchange Studies (IEB)
ABOUT US
IESE Cities in Motion Strategies is a research platform launched jointly by the Center for Globalization and Strategy and IESE Business School’s Department of Strategy.
The initiative connects a global network of experts in cities and specialist private companies with local governments from around the world. The aim is to promote changes at the local level and to develop valuable ideas and innovative tools that will lead to more sustainable and smarter cities.
The platform’s mission is to promote the Cities in Motion model, with an innovative approach to city governance and a new urban model for the 21st century based on four main factors: a sustainable ecosystem, innovative activities, equity among citizens and connected territory.
WITH THE COLLABORATION OF:

IESE Business School - IESE Cities in Motion Index (ST-442-E)10
INTRODUCTION: THE NEED FOR A GLOBAL VISION
Today more than ever, cities require strategic planning. Only then can they consider pathways to innovation and prioritize what is most important for their future.
The strategic planning process should be participatory and flexible, and a central aim should be established: to defi-ne a sustainable action plan that will make the metropolis unique and renowned. Just as two companies do not have the same recipe for success, each city must look for its own model on the basis of some common considerations.
Experience shows that large cities must avoid a short-term outlook and expand their field of vision. They should turn to innovation more frequently to improve the efficiency and sustainability of their services. Also, they should promote communication and ensure that residents and businesses are involved in their projects.
The time has come to practice intelligent governance that takes into account all the factors and social actors in a glo-bal vision. In fact, over the past few decades, various natio-nal and international organizations have produced studies focusing on the definition, creation and use of indicators with a variety of aims, although mainly to contribute to a diagnosis of the state of cities. In each of these studies, the definition of the indicators and their creation process are the result of the study’s characteristics, the statistical and econometric techniques that best fit the theoretical model and available data, and the analysts’ preferences. Today we have a lot of “urban” indicators, although many of them are neither standardized nor consistent or com-parable among cities. In fact, numerous attempts have been made to develop city indicators at the national, re-gional and international level. However, few have been sustainable in the medium term, as they were created for studies meant to cover the specific information needs of certain bodies, whose lifespan depended on how long the financing would last. In other cases, the system of indi-cators depended on a political desire in specific circum-
stances, so they were abandoned when political priorities or the authorities themselves changed. As for the indi-cators developed by international organizations, it is true that they strive for the consistency and solidity necessary to compare cities; however, for the most part, they tend to be biased or focused on a particular area (technolo-gy, the economy, and the environment, among others).
Taking all this into account, the Cities in Motion Index (CIMI) has been designed with the aim of constructing a “breakthrough” indicator in terms of its complete-ness, characteristics, comparability and the quality and objectivity of its information. Its goal is to enable mea-surement of the future sustainability of the world’s main cities as well as the quality of life of their inhabitants.
The CIMI aims to help the public and governments unders-tand the performance of 10 fundamental dimensions for a city: governance, urban planning, public management, technology, the environment, international outreach, so-cial cohesion, mobility and transportation, human capital, and the economy. All the indicators are linked with a stra-tegic aim that leads to a novel form of local economic de-velopment: the creation of a global city, the promotion of the entrepreneurial spirit, and innovation, among others.
Each city is unique and unrepeatable and has its own needs and opportunities, so it must design its own plan, set its priorities, and be flexible enough to adapt to changes.
Smart cities generate numerous business opportunities and possibilities for collaboration between the public and private sectors. All stakeholders can contribute, so an ecosystem network must be developed that will involve all of them: members of the public, organizations, institutions, government, universities, experts, research centers, etc.
Networking has its advantages: better identification of the needs of the city and its residents, the establish-ment of common aims and constant communication among participants, the expansion of learning opportu-nities, increased transparency, and the implementation of more flexible public policies. As a report by the Or-ganization for Economic Cooperation and Development (OECD) pointed out back in 2001, the network approach allows local policies to be focused on the public.Private enterprise also has much to gain from this system of networking: it can collaborate with the administration

IESE Business School - IESE Cities in Motion Index (ST-442-E)11
in the long term, access new business opportunities, gain a greater understanding of the needs of the local ecosys-tem, increase international visibility, and attract talent.
Thanks to its technical expertise and its experience in project management, private enterprise, in collaboration with universities and other institutions, is suited to lead and develop smart city projects. In addition, it can provide efficiency and significant savings to public-private bodies.
Finally, it must not be forgotten that the human fac-tor is fundamental in the development of cities. Wi-thout a participatory and active society, any strategy, albeit intelligent and comprehensive, will be doomed to failure. Beyond technological and economic develop-ment, it is the public that holds the key for cities to go from “smart” to “wise.” That is the goal to which every city should aspire: that the people who live there and their leaders use all their talent to achieve progress.
To help cities identify effective solutions, we have created an index that captures 10 dimensions in a single indicator and covers 180 cities worldwide. Thanks to its broad and inte-grated vision of the city, the Cities in Motion Index enables the strengths and weaknesses of each city to be identified.
OUR MODEL: CITIES IN MOTION. CONCEPTUAL FRAMEWORK, DEFINITIONS AND INDICATORS Our platform proposes a conceptual model based on the study of a large number of success stories and a series of in-depth interviews with city leaders, entrepreneurs, academics and experts linked to urban development.
Our model proposes a set of steps that include diagno-sis of the situation, the development of a strategy, and its subsequent implementation – and the first step to giving a good diagnosis is to analyze the status of key dimensions.
We will now, therefore, set out the 10 key dimensions of our model, as well as the indicators used in calculating the CIMI.
HUMAN CAPITALThe main goal of any city should be to improve its human capital. A city with smart governance must be capable of attracting and retaining talent, creating plans to improve education, and promoting creativity and research.
Table 1 sets out the indicators used in the human capital dimension, along with their descriptions, units of measu-rement, and information sources.
While human capital includes factors that make it more extensive than what can be measured with these indica-tors, there is international consensus that level of educa-tion and access to culture are irreplaceable components for measuring human capital. In fact, one of the pillars of human development is human capital and, taking into account that the Human Development Index published annually by the United Nations Development Program includes education and culture as dimensions, it is valid to regard these indicators as factors explaining the diffe-rences in human capital in a city.
SUSTAINABILITY
SOC
IAL
CO
HE
SIO
N
INNOVATION
CO
NN
ECT
IVIT
Y
CONDITIONSFOR CITY
PROSPERITY
AppropriateDensity
CompactGrowth
EnergyEfficiency
PublicSpaces
EfficiencyMobility
PedestrianFriendly
Commu-nications
InternationalConnections
Technology
Talent PrivateSector
CreativeActivities
DemocraticValues
Health &Safety
CommunitySpirit
InternationalConnections
Diversity

IESE Business School - IESE Cities in Motion Index (ST-442-E)12
In the case of the CIMI, the following are considered with a positive sign: the proportion of the population with se-condary education and higher, the number of business schools, the inflow of international students in each city or country, and the number of universities.
As a measure of access to culture, account is taken of the number of museums, the number of art galleries, and expenditure on leisure and recreation, all in direct relation to the indicator. These indicators show the city’s commitment to culture and human capital. Creative and dynamic cities worldwide typically have museums and art galleries open to the public and offer visits to art collec-tions and events for the preservation of art. The existen-ce of a city’s cultural and recreation provision results in greater expenditure on these activities by the population.
SOCIAL COHESIONSocial cohesion is a sociological dimension of cities defi-ned as the degree of consensus among the members of a social group or the perception of belonging to a common situation or project. It is a measure of the intensity of social interaction within the group. Social cohesion in the urban context refers to the degree of coexistence among groups of people with different incomes, cultures, ages, and pro-fessions who live in a city. Concern about the city’s social setting requires an analysis of factors such as immigration, community development, care of the elderly, the effective-ness of the health system, and public inclusion and safety. The presence of various groups in the same space and mixing and interaction between groups are essential in a sustainable urban system. In this context, social cohesion is a state in which citizens and the government share a
vision of a society based on social justice, the primacy of the rule of law, and solidarity. This allows us to understand the importance of policies that underpin social cohesion based on democratic values.
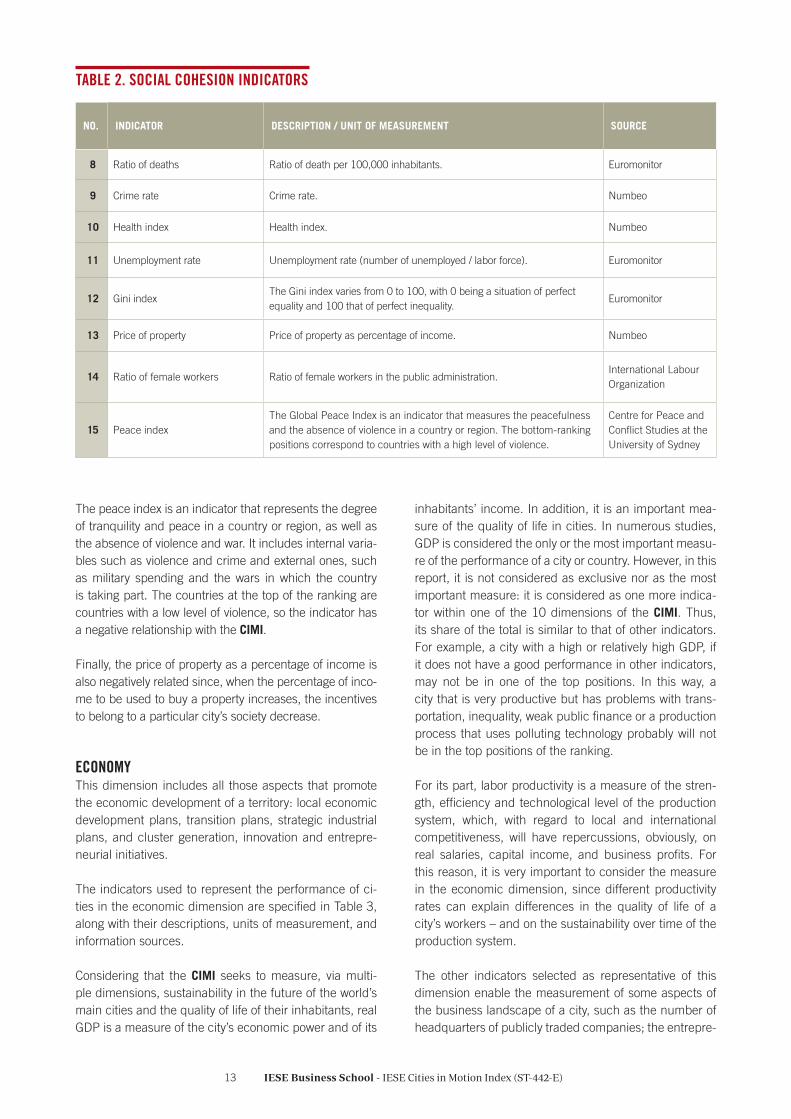
Table 2 sets out the indicators selected for this dimension, along with their descriptions, units of measurement, and information sources. This selection of indicators seeks to incorporate all the sociological subdimensions of social co-hesion, based on the different variables available.
The ratio of deaths per 100,000 inhabitants and the crime rate are incorporated with a negative sign, while the health index is incorporated with a positive sign in the creation of this dimension’s indicator.
Employment, meanwhile, is a fundamental aspect in so-cieties, to the extent that, according to historical evidence, a lack of employment can break the consensus or the im-plicit social contract. For this reason, the unemployment rate is incorporated with a negative sign in the dimension of social cohesion. However, the ratio of female workers in the public administration is incorporated with a positive sign, since it is an indicator of gender equality in access to government jobs.
The Gini index is calculated from the Gini coefficient and measures social inequality. It assumes a value equal to zero for situations in which there is a perfectly equitable income distribution (everyone has the same income) and it assumes the value equal to 100 when the income distribu-tion is perfectly inequitable (one person has all the income and the others none). This indicator is incorporated into the dimension with a negative sign, since a greater Gini coefficient has a negative effect on a city’s social cohesion.
NO. INDICATOR DESCRIPTION / UNIT OF MEASUREMENT SOURCE
1 Higher education Proportion of population with secondary and higher education. Euromonitor
2 Business schools Number of business schools (top 100). The Financial Times
3 Movement of students International movement of higher-level students. Number of students. UNESCO
4 Number of universities Number of universities. QS Top Universities
5 Museums Number of museums per city. 2thinknow
6 Art galleries Number of art galleries per city. 2thinknow
7Expenditure on leisure and recreation
Expenditure on leisure and recreation. Expressed in millions of U.S. dollars at 2014 prices.
Euromonitor
TABLE 1. HUMAN CAPITAL INDICATORS
IESE Business School - IESE Cities in Motion Index (ST-442-E)13
The peace index is an indicator that represents the degree of tranquility and peace in a country or region, as well as the absence of violence and war. It includes internal varia-bles such as violence and crime and external ones, such as military spending and the wars in which the country is taking part. The countries at the top of the ranking are countries with a low level of violence, so the indicator has a negative relationship with the CIMI.
Finally, the price of property as a percentage of income is also negatively related since, when the percentage of inco-me to be used to buy a property increases, the incentives to belong to a particular city’s society decrease.
ECONOMYThis dimension includes all those aspects that promote the economic development of a territory: local economic development plans, transition plans, strategic industrial plans, and cluster generation, innovation and entrepre-neurial initiatives.
The indicators used to represent the performance of ci-ties in the economic dimension are specified in Table 3, along with their descriptions, units of measurement, and information sources.
Considering that the CIMI seeks to measure, via multi-ple dimensions, sustainability in the future of the world’s main cities and the quality of life of their inhabitants, real GDP is a measure of the city’s economic power and of its
inhabitants’ income. In addition, it is an important mea-sure of the quality of life in cities. In numerous studies, GDP is considered the only or the most important measu-re of the performance of a city or country. However, in this report, it is not considered as exclusive nor as the most important measure: it is considered as one more indica-tor within one of the 10 dimensions of the CIMI. Thus, its share of the total is similar to that of other indicators. For example, a city with a high or relatively high GDP, if it does not have a good performance in other indicators, may not be in one of the top positions. In this way, a city that is very productive but has problems with trans-portation, inequality, weak public finance or a production process that uses polluting technology probably will not be in the top positions of the ranking.
For its part, labor productivity is a measure of the stren-gth, efficiency and technological level of the production system, which, with regard to local and international competitiveness, will have repercussions, obviously, on real salaries, capital income, and business profits. For this reason, it is very important to consider the measure in the economic dimension, since different productivity rates can explain differences in the quality of life of a city’s workers – and on the sustainability over time of the production system.
The other indicators selected as representative of this dimension enable the measurement of some aspects of the business landscape of a city, such as the number of headquarters of publicly traded companies; the entrepre-
NO. INDICATOR DESCRIPTION / UNIT OF MEASUREMENT SOURCE
8 Ratio of deaths Ratio of death per 100,000 inhabitants. Euromonitor
9 Crime rate Crime rate. Numbeo
10 Health index Health index. Numbeo
11 Unemployment rate Unemployment rate (number of unemployed / labor force). Euromonitor
12 Gini indexThe Gini index varies from 0 to 100, with 0 being a situation of perfect equality and 100 that of perfect inequality.
Euromonitor
13 Price of property Price of property as percentage of income. Numbeo
14 Ratio of female workers Ratio of female workers in the public administration.International Labour Organization
15 Peace indexThe Global Peace Index is an indicator that measures the peacefulness and the absence of violence in a country or region. The bottom-ranking positions correspond to countries with a high level of violence.
Centre for Peace and Conflict Studies at the University of Sydney
TABLE 2. SOCIAL COHESION INDICATORS

IESE Business School - IESE Cities in Motion Index (ST-442-E)14
neurial capacity and possibilities of a city’s inhabitants, represented by the percentage of people at an early busi-ness stage; entrepreneurial companies; the time required to start a business; and the ease of starting a business in regulatory terms. These indicators measure a city’s sustainability capacity over time and the potential ability to improve the quality of life of its inhabitants. The time required to start a business and the ease of launching it are incorporated into the economic dimension with a negative sign, since lower values indicate a greater ease of starting businesses. The number of headquarters of publicly traded companies, the number of entrepreneu-rs, and the entrepreneurial possibilities of a city’s inhabi-tants have a positive relationship, since the high values of these indicators reflect the economic dynamics of a city and the ease of starting a new business.
PUBLIC MANAGEMENTThe public management dimension encompasses all those actions aimed at improving the administration’s efficiency, including the design of new organizational and management models. In this area, great opportunities open up for private initiative, which can bring greater effi-ciency.
In this work, public management is understood to be highly correlated with the state of public finances of a city or country. In this sense, public accounts decisively affect people’s quality of life and a city’s sustainability, since they determine the level of present and future ta-
xes that must support the residents and the production system, the expected growth of the general level of pri-ces, the possibilities of public investment in basic social infrastructure, and incentives for private investment. In addition, if the state has funding needs, because of the weakness of the public finance system, it will compete with the private sector for funds available in the financial system, which will affect investment.
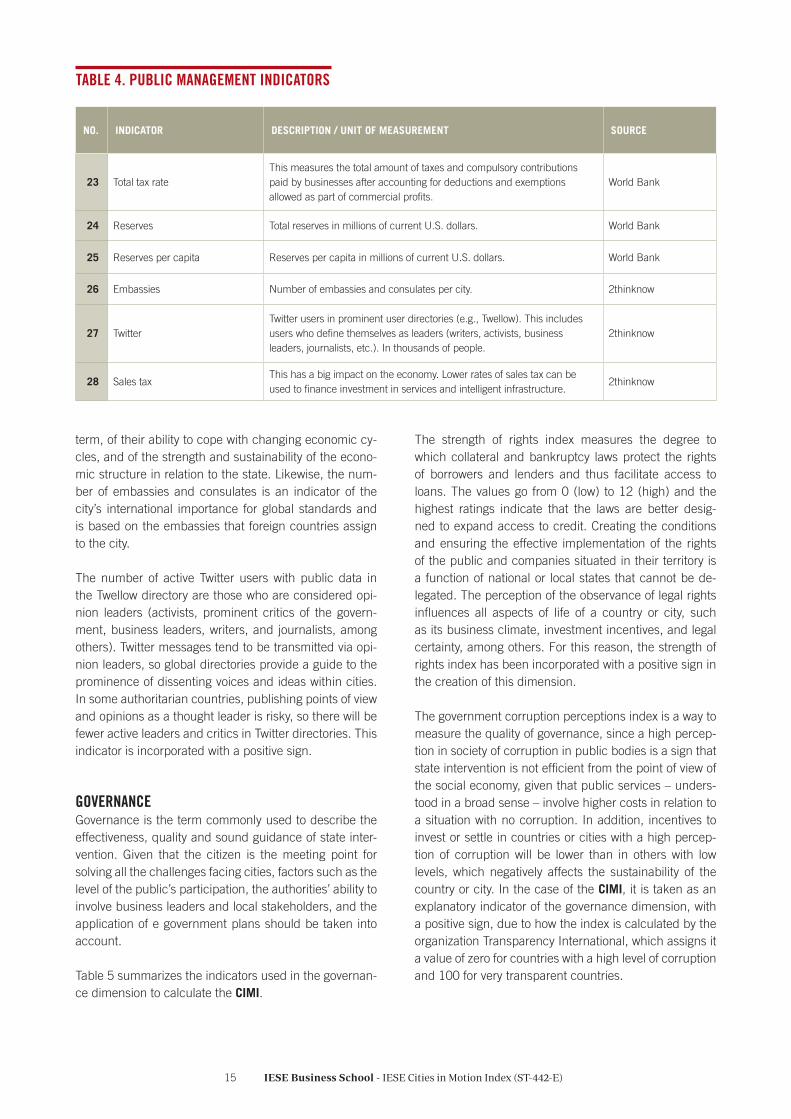
The indicators that represent the public management di-mension in this report are listed in Table 4, along with their descriptions, units of measurement, and sources of information.
The indicators related to the tax system, which are incor-porated with a negative sign in this dimension’s synthetic indicator, cover aspects of the state of public finances since the greater the relative tax burden, the weaker a city’s public accounts are. The total tax rate measures the total amount of taxes and compulsory contributions paid by businesses after accounting for deductions and exemptions allowed as part of commercial profits. Exclu-ded are taxes withheld (such as income tax for natural persons) or taxes collected and remitted to tax authori-ties (such as value added tax, sales tax, or goods and services tax). Similarly, sales tax has a big impact on the economy. Higher rates of sales tax can be used to finance investment in services and intelligent infrastructure.
In turn, the level of reserves is an indicator of the strength of the public finance system in the short and medium
NO. INDICATOR DESCRIPTION / UNIT OF MEASUREMENT SOURCE
16 Productivity Labor productivity calculated as GDP/working population (in thousands). Euromonitor
17Time necessary to start a business
Calendar days needed to complete the procedures involved in the legal operation of a company.
World Bank
18 Ease of starting a businessThe top positions in the ranking indicate a more favorable regulatory environment for creating and operating a local company.
World Bank
19 Number of headquarters Number of headquarters of publicly traded companies.Globalization and World Cities (GaWC)
20Percentage of people at early business stage
Percentage of 18 to 64-year-old population who are new entrepreneurs or owners/managers of a new business (no more than 42 months).
Global Entrepreneurship Monitor
21 Entrepreneurs Companies in an initial phase that represent a city’s economic bases. They represent economic dynamism and include a high proportion of companies devoted to technology. Used per capita.
2thinknow
22 GDP Gross domestic product in millions of U.S. dollars at 2014 prices. Euromonitor
TABLE 3. ECONOMIC INDICATORS
IESE Business School - IESE Cities in Motion Index (ST-442-E)15
term, of their ability to cope with changing economic cy-cles, and of the strength and sustainability of the econo-mic structure in relation to the state. Likewise, the num-ber of embassies and consulates is an indicator of the city’s international importance for global standards and is based on the embassies that foreign countries assign to the city.
The number of active Twitter users with public data in the Twellow directory are those who are considered opi-nion leaders (activists, prominent critics of the govern-ment, business leaders, writers, and journalists, among others). Twitter messages tend to be transmitted via opi-nion leaders, so global directories provide a guide to the prominence of dissenting voices and ideas within cities. In some authoritarian countries, publishing points of view and opinions as a thought leader is risky, so there will be fewer active leaders and critics in Twitter directories. This indicator is incorporated with a positive sign.
GOVERNANCEGovernance is the term commonly used to describe the effectiveness, quality and sound guidance of state inter-vention. Given that the citizen is the meeting point for solving all the challenges facing cities, factors such as the level of the public’s participation, the authorities’ ability to involve business leaders and local stakeholders, and the application of e government plans should be taken into account.
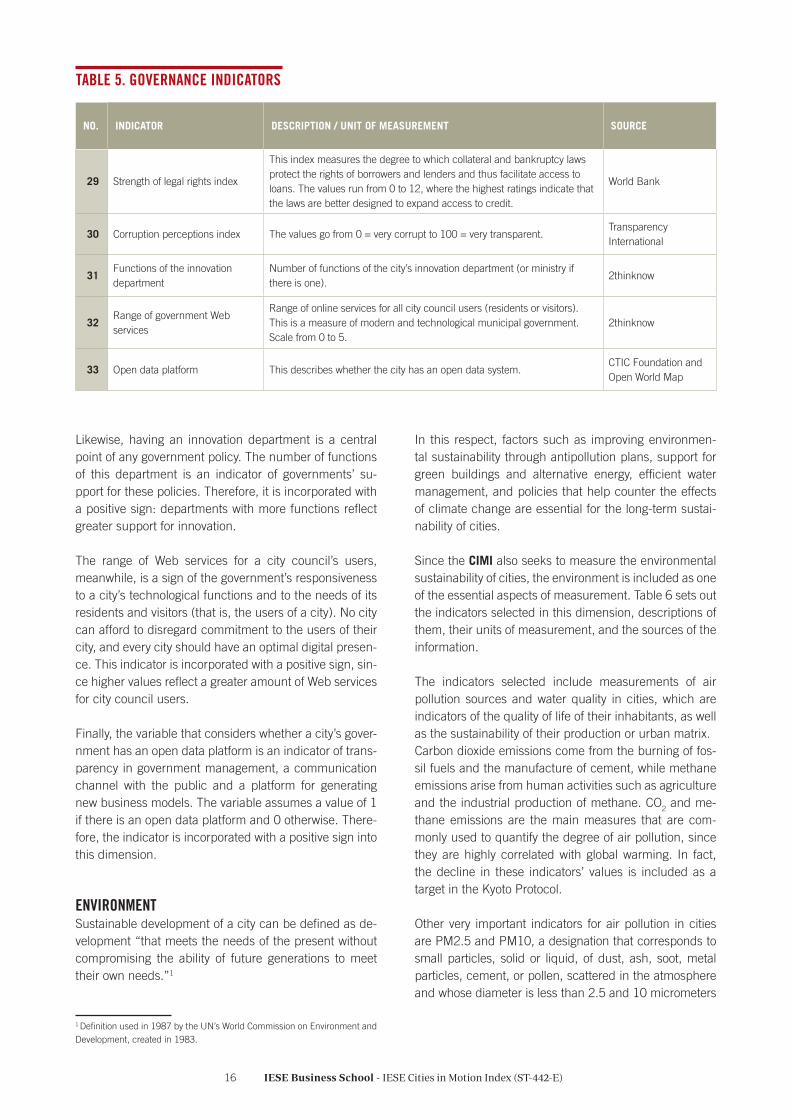
Table 5 summarizes the indicators used in the governan-ce dimension to calculate the CIMI.
The strength of rights index measures the degree to which collateral and bankruptcy laws protect the rights of borrowers and lenders and thus facilitate access to loans. The values go from 0 (low) to 12 (high) and the highest ratings indicate that the laws are better desig-ned to expand access to credit. Creating the conditions and ensuring the effective implementation of the rights of the public and companies situated in their territory is a function of national or local states that cannot be de-legated. The perception of the observance of legal rights influences all aspects of life of a country or city, such as its business climate, investment incentives, and legal certainty, among others. For this reason, the strength of rights index has been incorporated with a positive sign in the creation of this dimension.
The government corruption perceptions index is a way to measure the quality of governance, since a high percep-tion in society of corruption in public bodies is a sign that state intervention is not efficient from the point of view of the social economy, given that public services – unders-tood in a broad sense – involve higher costs in relation to a situation with no corruption. In addition, incentives to invest or settle in countries or cities with a high percep-tion of corruption will be lower than in others with low levels, which negatively affects the sustainability of the country or city. In the case of the CIMI, it is taken as an explanatory indicator of the governance dimension, with a positive sign, due to how the index is calculated by the organization Transparency International, which assigns it a value of zero for countries with a high level of corruption and 100 for very transparent countries.
NO. INDICATOR DESCRIPTION / UNIT OF MEASUREMENT SOURCE
23 Total tax rateThis measures the total amount of taxes and compulsory contributions paid by businesses after accounting for deductions and exemptions allowed as part of commercial profits.
World Bank
24 Reserves Total reserves in millions of current U.S. dollars. World Bank
25 Reserves per capita Reserves per capita in millions of current U.S. dollars. World Bank
26 Embassies Number of embassies and consulates per city. 2thinknow
27 TwitterTwitter users in prominent user directories (e.g., Twellow). This includes users who define themselves as leaders (writers, activists, business leaders, journalists, etc.). In thousands of people.
2thinknow
28 Sales taxThis has a big impact on the economy. Lower rates of sales tax can be used to finance investment in services and intelligent infrastructure.
2thinknow
TABLE 4. PUBLIC MANAGEMENT INDICATORS
IESE Business School - IESE Cities in Motion Index (ST-442-E)16
Likewise, having an innovation department is a central point of any government policy. The number of functions of this department is an indicator of governments’ su-pport for these policies. Therefore, it is incorporated with a positive sign: departments with more functions reflect greater support for innovation.
The range of Web services for a city council’s users, meanwhile, is a sign of the government’s responsiveness to a city’s technological functions and to the needs of its residents and visitors (that is, the users of a city). No city can afford to disregard commitment to the users of their city, and every city should have an optimal digital presen-ce. This indicator is incorporated with a positive sign, sin-ce higher values reflect a greater amount of Web services for city council users.
Finally, the variable that considers whether a city’s gover-nment has an open data platform is an indicator of trans-parency in government management, a communication channel with the public and a platform for generating new business models. The variable assumes a value of 1 if there is an open data platform and 0 otherwise. There-fore, the indicator is incorporated with a positive sign into this dimension.
ENVIRONMENTSustainable development of a city can be defined as de-velopment “that meets the needs of the present without compromising the ability of future generations to meet their own needs.”1
1 Definition used in 1987 by the UN’s World Commission on Environment and Development, created in 1983.
In this respect, factors such as improving environmen-tal sustainability through antipollution plans, support for green buildings and alternative energy, efficient water management, and policies that help counter the effects of climate change are essential for the long-term sustai-nability of cities.
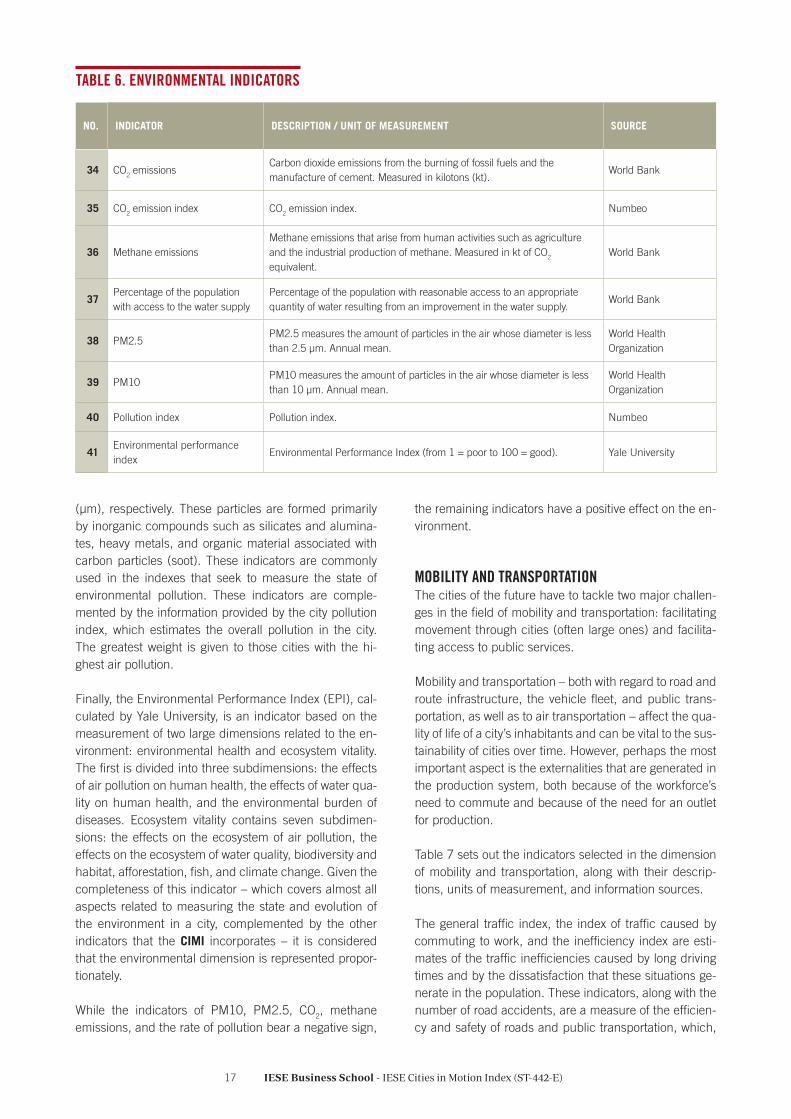
Since the CIMI also seeks to measure the environmental sustainability of cities, the environment is included as one of the essential aspects of measurement. Table 6 sets out the indicators selected in this dimension, descriptions of them, their units of measurement, and the sources of the information.
The indicators selected include measurements of air pollution sources and water quality in cities, which are indicators of the quality of life of their inhabitants, as well as the sustainability of their production or urban matrix. Carbon dioxide emissions come from the burning of fos-sil fuels and the manufacture of cement, while methane emissions arise from human activities such as agriculture and the industrial production of methane. CO2 and me-thane emissions are the main measures that are com-monly used to quantify the degree of air pollution, since they are highly correlated with global warming. In fact, the decline in these indicators’ values is included as a target in the Kyoto Protocol.
Other very important indicators for air pollution in cities are PM2.5 and PM10, a designation that corresponds to small particles, solid or liquid, of dust, ash, soot, metal particles, cement, or pollen, scattered in the atmosphere and whose diameter is less than 2.5 and 10 micrometers
NO. INDICATOR DESCRIPTION / UNIT OF MEASUREMENT SOURCE
29 Strength of legal rights index
This index measures the degree to which collateral and bankruptcy laws protect the rights of borrowers and lenders and thus facilitate access to loans. The values run from 0 to 12, where the highest ratings indicate that the laws are better designed to expand access to credit.
World Bank
30 Corruption perceptions index The values go from 0 = very corrupt to 100 = very transparent.Transparency International
31Functions of the innovation department
Number of functions of the city’s innovation department (or ministry if there is one).
2thinknow
32Range of government Web services
Range of online services for all city council users (residents or visitors). This is a measure of modern and technological municipal government. Scale from 0 to 5.
2thinknow
33 Open data platform This describes whether the city has an open data system.CTIC Foundation and Open World Map
TABLE 5. GOVERNANCE INDICATORS
IESE Business School - IESE Cities in Motion Index (ST-442-E)17
(μm), respectively. These particles are formed primarily by inorganic compounds such as silicates and alumina-tes, heavy metals, and organic material associated with carbon particles (soot). These indicators are commonly used in the indexes that seek to measure the state of environmental pollution. These indicators are comple-mented by the information provided by the city pollution index, which estimates the overall pollution in the city. The greatest weight is given to those cities with the hi-ghest air pollution.
Finally, the Environmental Performance Index (EPI), cal-culated by Yale University, is an indicator based on the measurement of two large dimensions related to the en-vironment: environmental health and ecosystem vitality. The first is divided into three subdimensions: the effects of air pollution on human health, the effects of water qua-lity on human health, and the environmental burden of diseases. Ecosystem vitality contains seven subdimen-sions: the effects on the ecosystem of air pollution, the effects on the ecosystem of water quality, biodiversity and habitat, afforestation, fish, and climate change. Given the completeness of this indicator – which covers almost all aspects related to measuring the state and evolution of the environment in a city, complemented by the other indicators that the CIMI incorporates – it is considered that the environmental dimension is represented propor-tionately.
While the indicators of PM10, PM2.5, CO2, methane emissions, and the rate of pollution bear a negative sign,
the remaining indicators have a positive effect on the en-vironment.
MOBILITY AND TRANSPORTATIONThe cities of the future have to tackle two major challen-ges in the field of mobility and transportation: facilitating movement through cities (often large ones) and facilita-ting access to public services.
Mobility and transportation – both with regard to road and route infrastructure, the vehicle fleet, and public trans-portation, as well as to air transportation – affect the qua-lity of life of a city’s inhabitants and can be vital to the sus-tainability of cities over time. However, perhaps the most important aspect is the externalities that are generated in the production system, both because of the workforce’s need to commute and because of the need for an outlet for production.
Table 7 sets out the indicators selected in the dimension of mobility and transportation, along with their descrip-tions, units of measurement, and information sources.
The general traffic index, the index of traffic caused by commuting to work, and the inefficiency index are esti-mates of the traffic inefficiencies caused by long driving times and by the dissatisfaction that these situations ge-nerate in the population. These indicators, along with the number of road accidents, are a measure of the efficien-cy and safety of roads and public transportation, which,
NO. INDICATOR DESCRIPTION / UNIT OF MEASUREMENT SOURCE
34 CO2 emissions Carbon dioxide emissions from the burning of fossil fuels and the manufacture of cement. Measured in kilotons (kt).
World Bank
35 CO2 emission index CO2 emission index. Numbeo
36 Methane emissionsMethane emissions that arise from human activities such as agriculture and the industrial production of methane. Measured in kt of CO2 equivalent.
World Bank
37Percentage of the population with access to the water supply
Percentage of the population with reasonable access to an appropriate quantity of water resulting from an improvement in the water supply.
World Bank
38 PM2.5PM2.5 measures the amount of particles in the air whose diameter is less than 2.5 μm. Annual mean.
World Health Organization
39 PM10 PM10 measures the amount of particles in the air whose diameter is less than 10 μm. Annual mean.
World Health Organization
40 Pollution index Pollution index. Numbeo
41Environmental performance index
Environmental Performance Index (from 1 = poor to 100 = good). Yale University
TABLE 6. ENVIRONMENTAL INDICATORS

IESE Business School - IESE Cities in Motion Index (ST-442-E)18
if it is effective and has good infrastructure, promotes a decrease in vehicular traffic on the roads and reduces the number of accidents. All these are included with a negative sign in the calculation of the CIMI, since they have a negative impact on the development of a sustai-nable city.
The bike-sharing indicator collects information about a city’s bicycle-sharing system. This system allows the mo-vement from one location to another using bicycles avai-lable for public use. The indicator varies between 0 and 2, where 0 refers to the lack of a bicycle-sharing system in the city and 2 refers to a highly developed system. The variable is incorporated with a positive sign in the CIMI.
In contrast, the number of metro stations is an indicator of commitment to the development of the city and in-vestment with respect to the population size. The means of transportation represent the public transportation op-tions of a city. The value of this variable increases if there are more transportation options. The lack of transporta-tion options can reduce the attractiveness of a city as a smart destination. The amount of air traffic (arrivals and departures) that a city has represents the infrastructure that it has to facilitate – i.e., commercial air routes, and, therefore, passenger circulation and transit. These three
indicators are included with a positive sign because of the positive influence they have on the dimension.
URBAN PLANNINGThe urban planning of a city has several subdimensions and is closely related to sustainability. Inadequate urban planning causes a reduction in the public’s quality of life in the medium term and also negatively affects invest-ment incentives, since a city without planning or inade-quate planning hinders and increases the costs of logis-tics and workers’ transportation, among other aspects. To improve the habitability of any territory, it is neces-sary to take into account the local master plans and the design of green areas and spaces for public use, as well as opting for smart growth. The new urban planning me-thods should focus on creating compact, well-connected cities with accessible public services.
Depending on the information available, several aspects related to urban plans, the quality of health infrastructu-re, and housing policies are incorporated as indicators of this dimension. Table 8 sets out the available indicators included in the urban planning dimension, along with their descriptions, units of measurement, and informa-tion sources.
NO. INDICATOR DESCRIPTION / UNIT OF MEASUREMENT SOURCE
42 Traffic index The traffic index is estimated by considering the time spent in traffic and the dissatisfaction this generates. It also includes estimates of CO2 consumption and the other inefficiencies of the traffic system.
Numbeo
43 Inefficiency indexThe inefficiency index is an estimate of the inefficiencies in traffic. High values represent high rates of inefficiency in driving, such as long journey times.
Numbeo
44 Number of road accidents Number of road accidents per 100,000 inhabitants. Euromonitor
45 Metro Number of metro stations per city. 2thinknow
46 Flights Number of arrival and departure flights (air routes) in a city. 2thinknow
47 Means of transportation
The means of transportation represents the public transportation options for smart cities. The value of the variable increases if there are more transportation options. The lack of transportation options can reduce the attractiveness of a city as a smart destination.
2thinknow
48Index of traffic for commuting to work
Index of traffic considering the journey time to work. Numbeo
49 Bike sharing
The bicycle-sharing system shows the automated services for the public use of shared bicycles that provide transport from one location to another within a city. The indicator varies between 0 and 2 according to how developed the system is.
The Bike-sharing World Map
TABLE 7. MOBILITY AND TRANSPORTATION INDICATORS

IESE Business School - IESE Cities in Motion Index (ST-442-E)19
The quality of health infrastructure refers to the percenta-ge of the population with at least sufficient access to sani-tation facilities that avoid the contact of humans, animals, and insects with excreta. For them to be effective, the-se facilities must be built correctly and undergo proper maintenance. This indicator is highly correlated with that of urban planning, since it can be shown that inadequate planning inevitably results in health problems in the short and medium term.
In addition, from the urban planning and housing point of view, a city with proper urban planning generally has few or no problems of overcrowding in households, sin-ce normally housing policy, in relation to the estimated growth of the urban population, is a determining factor in urban planning. For this reason, within the explanatory indicators of this dimension, the number of occupants of each household was considered with a negative sign.The bicycle is an effective, fast, economical, healthy, and environmentally friendly means of transportation. The use of this means of transportation has a positive impact on a city’s sustainable development as it does not cause pollution or use fuel, among other benefits. Considering these positive effects, two indicators related to the use of this means of mobility were incorporated in the CIMI. The number of cycling enthusiasts represents both a sustai-nable measure of transportation and a metric of the in-frastructure that the city offers for this mode. Many cities that are “historically” smart cities have a certain positive correlation with a high presence of cycling. This variable is incorporated, therefore, with a positive sign. Likewise, the number of bicycle shops is a good indicator of the actual use of the bicycle (through equipment sales and repairs). This is also incorporated with a positive sign.
Another indicator considered is the number of architec-ture firms (small, medium, and large) that are devoted to designing projects for the city. Engineers, architects, and urban planners are key to the transformation of a city and therefore this indicator is incorporated with a positive sign in the index calculation.
INTERNATIONAL OUTREACHCities that want to progress must secure a privileged pla-ce in the world. Maintaining global impact involves im-proving the city brand and its international recognition through strategic tourism plans, the attracting of foreign investment and representation abroad.
Cities can have an international outreach to a greater or lesser extent even if they are from the same country, but this is not independent of the degree of openness natio-nally. This dimension seeks to include those differences and to measure the cities’ international outreach.
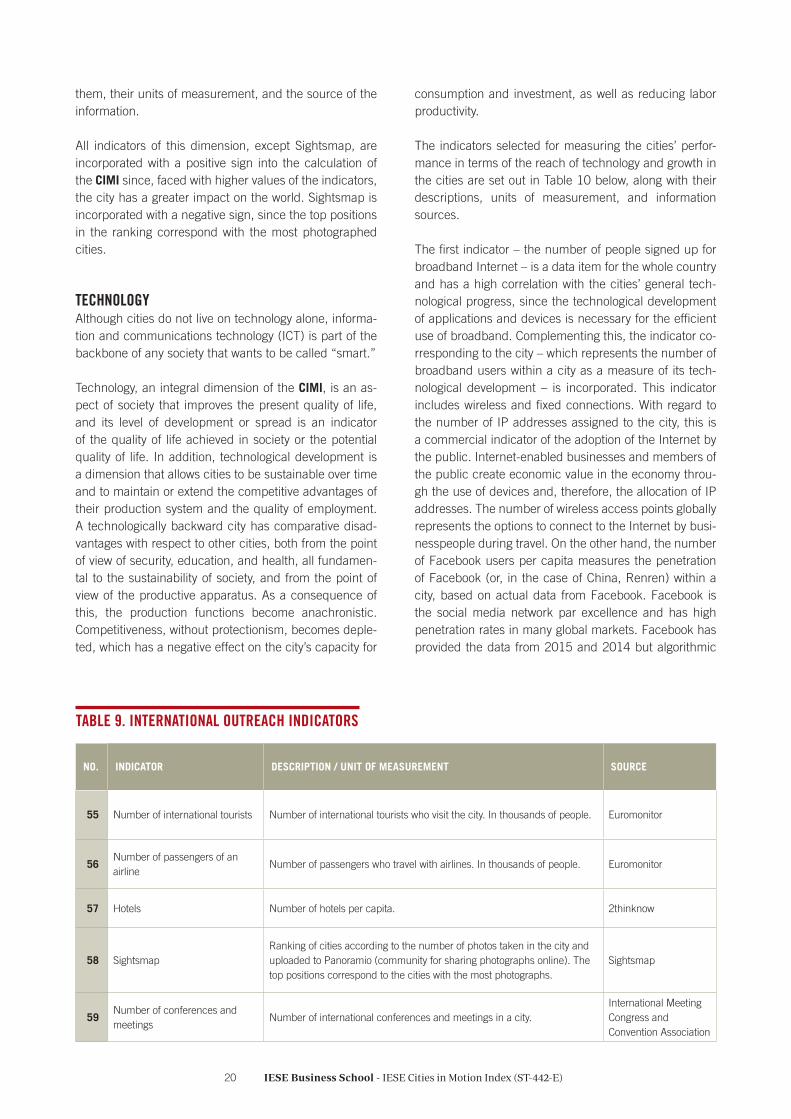
In this respect, the following indicators have been in-cluded: arrival of international tourists, number of pas-sengers by airline, number of hotels in a city, ranking of the most photographed places in the world according to Sightsmap, and the number of meetings and conferen-ces that take place in a city according to data from the International Congress and Convention Association. This last indicator is important for a city’s international repu-tation, taking into account that these events usually take place in cities with international hotels, rooms specially fitted out for such ends, good frequency of international flights, and appropriate security measures. Table 9 below summarizes these indicators, along with descriptions of
NO. INDICATOR DESCRIPTION / UNIT OF MEASUREMENT SOURCE
50Percentage of the population with access to sanitation facilities
Percentage of the population with at least sufficient access to facilities for the disposal of excreta that can efficiently avoid the contact of humans, animals and insects with excreta.
World Bank
51 Number of people per household Number of people per household. Euromonitor
52 Bicycle shops Number of bicycle shops per capita. 2thinknow
53 Architects Number of architecture firms per capita. 2thinknow
54 Cycling
Cycling enthusiasts per capita. Bicycle use represents both a sustainable measure of transportation and a metric for a city’s exercise and cultural aptitude. Many cities that historically are smart cities have a positive correlation with the presence of a cycling culture (weather permitting).
2thinknow
TABLE 8. URBAN PLANNING INDICATORS
IESE Business School - IESE Cities in Motion Index (ST-442-E)20
them, their units of measurement, and the source of the information.
All indicators of this dimension, except Sightsmap, are incorporated with a positive sign into the calculation of the CIMI since, faced with higher values of the indicators, the city has a greater impact on the world. Sightsmap is incorporated with a negative sign, since the top positions in the ranking correspond with the most photographed cities.
TECHNOLOGYAlthough cities do not live on technology alone, informa-tion and communications technology (ICT) is part of the backbone of any society that wants to be called “smart.” Technology, an integral dimension of the CIMI, is an as-pect of society that improves the present quality of life, and its level of development or spread is an indicator of the quality of life achieved in society or the potential quality of life. In addition, technological development is a dimension that allows cities to be sustainable over time and to maintain or extend the competitive advantages of their production system and the quality of employment. A technologically backward city has comparative disad-vantages with respect to other cities, both from the point of view of security, education, and health, all fundamen-tal to the sustainability of society, and from the point of view of the productive apparatus. As a consequence of this, the production functions become anachronistic. Competitiveness, without protectionism, becomes deple-ted, which has a negative effect on the city’s capacity for
consumption and investment, as well as reducing labor productivity.
The indicators selected for measuring the cities’ perfor-mance in terms of the reach of technology and growth in the cities are set out in Table 10 below, along with their descriptions, units of measurement, and information sources.
The first indicator – the number of people signed up for broadband Internet – is a data item for the whole country and has a high correlation with the cities’ general tech-nological progress, since the technological development of applications and devices is necessary for the efficient use of broadband. Complementing this, the indicator co-rresponding to the city – which represents the number of broadband users within a city as a measure of its tech-nological development – is incorporated. This indicator includes wireless and fixed connections. With regard to the number of IP addresses assigned to the city, this is a commercial indicator of the adoption of the Internet by the public. Internet-enabled businesses and members of the public create economic value in the economy throu-gh the use of devices and, therefore, the allocation of IP addresses. The number of wireless access points globally represents the options to connect to the Internet by busi-nesspeople during travel. On the other hand, the number of Facebook users per capita measures the penetration of Facebook (or, in the case of China, Renren) within a city, based on actual data from Facebook. Facebook is the social media network par excellence and has high penetration rates in many global markets. Facebook has provided the data from 2015 and 2014 but algorithmic
NO. INDICATOR DESCRIPTION / UNIT OF MEASUREMENT SOURCE
55 Number of international tourists Number of international tourists who visit the city. In thousands of people. Euromonitor
56Number of passengers of an airline
Number of passengers who travel with airlines. In thousands of people. Euromonitor
57 Hotels Number of hotels per capita. 2thinknow
58 SightsmapRanking of cities according to the number of photos taken in the city and uploaded to Panoramio (community for sharing photographs online). The top positions correspond to the cities with the most photographs.
Sightsmap
59Number of conferences and meetings
Number of international conferences and meetings in a city.International Meeting Congress and Convention Association
TABLE 9. INTERNATIONAL OUTREACH INDICATORS

IESE Business School - IESE Cities in Motion Index (ST-442-E)21
estimates have been used for previous years. This indi-cator is incorporated with a positive sign. As for the data item on the number of mobile phones per inhabitant, this is obtained through national data, population data, and demographic information. This indicator is incorporated with a positive sign, since the greater the use of mobile telephony, the more open society is to the use of tech-nology. The use of smartphones and their penetration are a good indicator for the use of technologies. The use of smartphones shows the number of applications that businesses and the government can put into practice. It is incorporated with a positive sign. For its part, the quality of a city council’s website is an indicator that re-flects the government’s commitment to information tech-nology policies. If a local government wants to promote the development of information and communications technology (ICT) among local businesses, it is necessary for the government itself to provide a good-quality online services offer, showing support for this crucial sector’s
strategies. Last but not least, the Innovation Cities Index (ICI) is calculated by carrying out assessments on the basis of various factors regarding technological innova-tion in cities, in sectors such as health, the economy in general, or the population, among others, becoming what is now the most comprehensive indicator to measure the degree of innovation development of cities, divided me-thodologically into three aspects: cultural assets, human infrastructure, and interconnected markets.
All the indicators of this dimension are related directly to the technological dimension. Therefore, they are incorpo-rated with a positive sign.
NO. INDICATOR DESCRIPTION / UNIT OF MEASUREMENT SOURCE
60Number of broadband subscribers
Number of broadband subscribers per country with a digital subscriber line, cable modem, or other high-speed technology, per 100 inhabitants.
World Bank
61 Broadband Number of broadband users within a city, including wireless and fixed connections.
2thinknow
62 IP addresses Number of IP addresses per capita. 2thinknow
63 Facebook Number of Facebook users per capita. 2thinknow
64 Mobile phones Number of mobile phones per capita 2thinknow
65 Quality of Web services
The quality of the city council’s website measures the commitment of its information technology policy, support for the development of local businesses, and other technology initiatives. Scale from 0 to 5, the maximum corresponding to the website with the best-quality services.
2thinknow
66 Innovation indexInnovation index (Innovation Cities Index). Valuation of 0 (no innovation) to 60 (a lot of innovation).
Innovation Cities Program
67 SmartphonesNumber of smartphones per capita. The use of smartphones and their penetration are a good indicator for the use of technologies.
2thinknow
68 Wi-Fi hot spotNumber of wireless access points globally. They represent the options to connect to the Internet by businesspeople while traveling.
2thinknow
TABLE 10. TECHNOLOGY INDICATORS
IESE Business School - IESE Cities in Motion Index (ST-442-E)22
LIMITATIONS OFTHE INDICATORS
Appendix 1: Indicators summarizes all the used indica-tors, descriptions, units of measurement, and sources across each dimension.
Perhaps the most significant limitation in the calculation of the CIMI is linked to the availability of data. Neverthe-less, efforts were made to minimize the impact of this li-mitation. First of all, for those indicators that did not have data for the entire period under analysis, extrapolation techniques were used. For situations where the indicator values by city were nonexistent but where there were va-lid values by country, individual values were assigned to each city, connecting the indicator at the country level via some other variable linked theoretically at the city level. Lastly, there were cases where the indicator did not have data for a particular city or group of cities for the whole period under consideration. In this case, statistical clus-ter techniques were used. The scope and detail of these tools are discussed in depth in the supplementary docu-ment “Methodology and Modeling” from 2014.
With the CIMI platform, we continue to work to obtain more complete and accurate indicators, while we urge cities to allow access to the information they generate.
GEOGRAPHIC COVERAGE
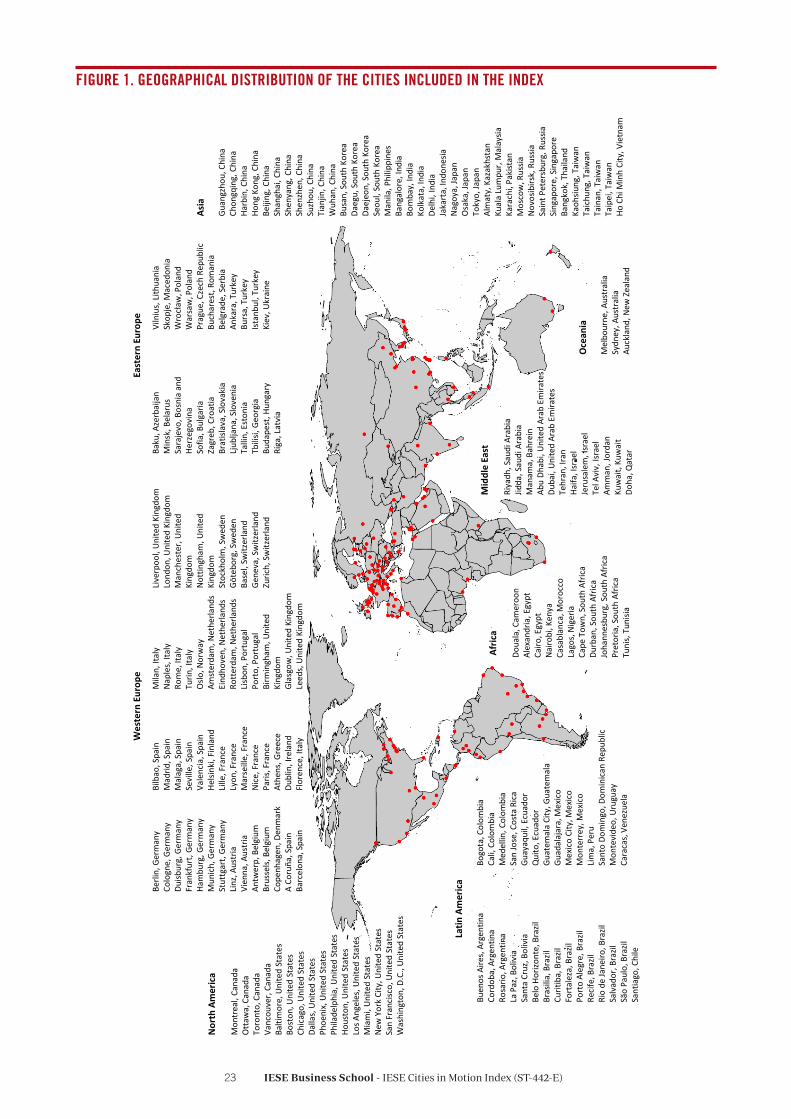
For the calculation of this year’s CIMI, 180 cities have been included, 73 of which are capitals, with the geogra-phical distribution depicted in Figure 1.
IESE Business School - IESE Cities in Motion Index (ST-442-E)23
FIGURE 1. GEOGRAPHICAL DISTRIBUTION OF THE CITIES INCLUDED IN THE INDEX
Nor
th A
mer
ica
Mon
trea
l, Ca
nada
Ott
awa,
Can
ada
Toro
nto,
Can
ada
Vanc
ouve
r, Ca
nada
Balti
mor
e, U
nite
d St
ates
Bost
on, U
nite
d St
ates
Chic
ago,
Uni
ted
Stat
esDa
llas,
Uni
ted
Stat
esPh
oeni
x, U
nite
d St
ates
Phila
delp
hia,
Uni
ted
Stat
esHo
usto
n, U
nite
d St
ates
Los A
ngel
es, U
nite
d St
ates
Mia
mi,
Uni
ted
Stat
esN
ew Y
ork
City
, Uni
ted
Stat
esSa
n Fr
anci
sco,
Uni
ted
Stat
esW
ashi
ngto
n, D
.C.,
Uni
ted
Stat
es
Latin
Am
eric
a
Buen
os A
ires,
Arg
entin
aCo
rdob
a, A
rgen
tina
Rosa
rio, A
rgen
tina
La P
az, B
oliv
iaSa
nta
Cruz
, Bol
ivia
Belo
Hor
izont
e, B
razil
Bras
ilia,
Bra
zilCu
ritib
a, B
razil
Fort
alez
a, B
razil
Port
o Al
egre
, Bra
zilRe
cife
, Bra
zilRi
o de
Jane
iro, B
razil
Salv
ador
, Bra
zilSã
o Pa
ulo,
Bra
zilSa
ntia
go, C
hile
Bogo
ta, C
olom
bia
Cali,
Col
ombi
aM
edel
lin, C
olom
bia
San
Jose
, Cos
ta R
ica
Guay
aqui
l, Ec
uado
rQ
uito
, Ecu
ador
Guat
emal
a Ci
ty, G
uate
mal
aGu
adal
ajar
a, M
exic
oM
exic
o Ci
ty, M
exic
oM
onte
rrey
, Mex
ico
Lim
a, P
eru
Sant
o Do
min
go, D
omin
ican
Rep
ublic
Mon
tevi
deo,
Uru
guay
Cara
cas,
Ven
ezue
la
Afric
a
Doua
la, C
amer
oon
Alex
andr
ia, E
gypt
Cairo
, Egy
ptN
airo
bi, K
enya
Casa
blan
ca, M
oroc
coLa
gos,
Nig
eria
Cape
Tow
n, S
outh
Afr
ica
Durb
an, S
outh
Afr
ica
Joha
nnes
burg
, Sou
th A
fric
aPr
etor
ia, S
outh
Afr
ica
Tuni
s, T
unisi
a
Oce
ania
Mel
bour
ne, A
ustr
alia
Sydn
ey, A
ustr
alia
Auck
land
, New
Zea
land
Mid
dle
East
Riya
dh, S
audi
Ara
bia
Jidda
, Sau
di A
rabi
aM
anam
a, B
ahre
inAb
u Dh
abi,
Uni
ted
Arab
Em
irate
sDu
bai,
Uni
ted
Arab
Em
irate
sTe
hran
, Ira
nHa
ifa, I
srae
lJe
rusa
lem
, Isr
ael
Tel A
viv,
Isra
elAm
man
, Jor
dan
Kuw
ait,
Kuw
ait
Doha
, Qat
ar
Asia
Guan
gzho
u, C
hina
Chon
gqin
g, C
hina
Harb
in, C
hina
Hong
Kon
g, C
hina
Beiji
ng, C
hina
Shan
ghai
, Chi
naSh
enya
ng, C
hina
Shen
zhen
, Chi
naSu
zhou
, Chi
naTi
anjin
, Chi
naW
uhan
, Chi
naBu
san,
Sou
th K
orea
Daeg
u, S
outh
Kor
eaDa
ejeo
n, S
outh
Kor
eaSe
oul,
Sout
h Ko
rea
Man
ila, P
hilip
pine
sBa
ngal
ore,
Indi
aBo
mba
y, In
dia
Kolk
ata,
Indi
aDe
lhi,
Indi
aJa
kart
a, In
done
siaN
agoy
a, Ja
pan
Osa
ka, J
apan
Toky
o, Ja
pan
Alm
aty,
Kaz
akhs
tan
Kual
a Lu
mpu
r, M
alay
siaKa
rach
i, Pa
kist
anM
osco
w, R
ussia
Nov
osib
irsk,
Rus
siaSa
int P
eter
sbur
g, R
ussia
Sing
apor
e, S
inga
pore
Bang
kok,
Tha
iland
Kaoh
siung
, Tai
wan
Taic
hung
, Tai
wan
Tain
an, T
aiw
anTa
ipei
, Tai
wan
Ho C
hi M
inh
City
, Vie
tnam
Berli
n, G
erm
any
Colo
gne,
Ger
man
yDu
isbur
g, G
erm
any
Fran
kfur
t, Ge
rman
yHa
mbu
rg, G
erm
any
Mun
ich,
Ger
man
ySt
uttg
art,
Germ
any
Linz
, Aus
tria
Vien
na, A
ustr
iaAn
twer
p, B
elgi
umBr
usse
ls, B
elgi
umCo
penh
agen
, Den
mar
kA
Coru
ña, S
pain
Barc
elon
a, S
pain
Bilb
ao, S
pain
Mad
rid, S
pain
Mal
aga,
Spa
inSe
ville
, Spa
inVa
lenc
ia, S
pain
Helsi
nki,
Finl
and
Lille
, Fra
nce
Lyon
, Fra
nce
Mar
seill
e, F
ranc
eN
ice,
Fra
nce
Paris
, Fra
nce
Athe
ns, G
reec
eDu
blin
, Ire
land
Flor
ence
, Ita
ly
Mila
n, It
aly
Nap
les,
Ital
yRo
me,
Ital
yTu
rin, I
taly
Oslo
, Nor
way
Amst
erda
m, N
ethe
rland
sEi
ndho
ven,
Net
herla
nds
Rott
erda
m, N
ethe
rland
sLi
sbon
, Por
tuga
lPo
rto,
Por
tuga
lBi
rmin
gham
, Uni
ted
King
dom
Glas
gow
, Uni
ted
King
dom
Leed
s, U
nite
d Ki
ngdo
m
Live
rpoo
l, U
nite
d Ki
ngdo
mLo
ndon
, Uni
ted
King
dom
Man
ches
ter,
Uni
ted
King
dom
Not
tingh
am, U
nite
dKi
ngdo
mSt
ockh
olm
, Sw
eden
Göte
borg
, Sw
eden
Base
l, Sw
itzer
land
Gene
va, S
witz
erla
ndZu
rich,
Sw
itzer
land
Baku
, Aze
rbai
jan
Min
sk, B
elar
usSa
raje
vo, B
osni
a an
d He
rzeg
ovin
aSo
fia, B
ulga
riaZa
greb
, Cro
atia
Brat
islav
a, S
lova
kia
Ljub
ljana
, Slo
veni
aTa
llin,
Est
onia
Tbili
si, G
eorg
iaBu
dape
st, H
unga
ryRi
ga, L
atvi
a
Viln
ius,
Lith
uani
aSk
opje
, Mac
edon
iaW
rocł
aw, P
olan
dW
arsa
w, P
olan
dPr
ague
, Cze
ch R
epub
licBu
char
est,
Rom
ania
Belg
rade
, Ser
bia
Anka
ra, T
urke
yBu
rsa,
Tur
key
Ista
nbul
, Tur
key
Kiev
, Ukr
aine
Wes
tern
Eur
ope
East
ern
Euro
pe

IESE Business School - IESE Cities in Motion Index (ST-442-E)24
CITIES IN MOTION. RANKING
The CIMI is a synthetic indicator and, as such, is a func-tion of the partial indicators available.
The model that sustains the process of creating the syn-thetic indicator is a weighted aggregation of partial in-dicators that represent each of the 10 dimensions that make up the CIMI theoretical model. The dimensions selected to describe the cities’ situations in terms of sus-tainability and the quality of life of their inhabitants, in the present and in the future, are as follows: governance, urban planning, public management, technology, the en-vironment, international outreach, social cohesion, mobi-lity and transportation, human capital, and the economy.
The partial indicators representative of each dimension also correspond to the category of synthetic indicators, which are defined as “weighted aggregations of each of the selected indicators that represent different factors of each dimension.”
Given the type of indicator that had to be calculated and the data available, for the calculation of the CIMI, the DP2 technique was used, this being the most widely used internationally and the most suitable. Its methodology is based on distances – that is, the difference between an indicator’s given value and another value taken as a reference or target. Likewise, this technique attempts to correct the dependence among the partial indicators, which would artificially increase the indicator’s sensitivity to variations in certain partial values. The correction con-sists of applying the same factor to each partial indicator, assuming a linearly dependent function2.
2 Being linear estimates, they are necessary variables that have a normal distribution, so a log transformation was applied to some variables to obtain normality. Outlier techniques were also applied to avoid bias and overestima-tions of coefficients.
Given the partial indicators, the factors are given by the complement of the coefficient of determination (R2) for each indicator compared with the rest of the partial indi-cators. The order in which the indicators of each dimen-sion were included as well as their relative weight in the CIMI are as follows: economy: 1; human capital: 0.401; international outreach: 0.704; urban planning: 0.625; environment: 0.631; technology: 0.354; governance: 0.414; social cohesion: 0.526; mobility and transporta-tion: 0.472; and public management: 0.614.
While the order in which each synthetic index of each di-mension is incorporated influences the value of the CIMI, the sensitivity studies carried out concluded that there are no significant variations in it. More details on the me-thodology can be seen in the supplementary document “Methodology and Modeling” published in 2014.
Table 11 sets out the CIMI city ranking, with the index value and the cities grouped according to their perfor-mance, measured by the value of the synthetic indicator.
Cities with a high performance (H) are considered to be those with an index greater than 90; relatively high (RH), between 60 and 90; average (A), between 45 and 60; and low (L), below 45.
For 2016, it can be observed that 52.77% of the cities (95) have a performance rated high (H) or relatively high (RH), headed by New York City and London. With an ave-rage (A) performance, we have 57 cities (31.67%), while the performances classified as low (L) include 15.55% of the selected cities. No city gets an average low (AL) rating. Of the top 25 cities, nine are European, 11 North American, three Asian, and two from Oceania.

IESE Business School - IESE Cities in Motion Index (ST-442-E)25
Ranking City Performance CIMI Ranking City Performance CIMI1 New York City-USA A 100,00 62 Birmingham-United Kingdom RA 67,102 London-United Kingdom A 98,71 63 Valencia-Spain RA 66,833 Paris-France A 91,97 64 Abu Dhabi-United Arab Emirates RA 66,674 Boston-USA RA 88,90 65 Antwerp-Belgium RA 66,515 San Francisco-USA RA 88,46 66 Dubai-United Arab Emirates RA 66,516 Washington, D.C.-USA RA 86,10 67 Budapest-Hungary RA 65,937 Seoul-South Korea RA 84,91 68 Seville-Spain RA 65,888 Tokyo-Japan RA 84,85 69 Nottingham-United Kingdom RA 65,829 Berlin-Germany RA 83,40 70 Ljubljana-Slovenia RA 65,5810 Amsterdam-Netherlands RA 82,86 71 Vilnius-Lithuania RA 65,4411 Toronto-Canada RA 82,85 72 Osaka-Japan RA 65,3912 Chicago-USA RA 82,55 73 Marseille-France RA 65,2713 Zurich-Switzerland RA 82,51 74 Nice-France RA 65,0014 Melbourne-Australia RA 82,06 75 Bilbao-Spain RA 65,0015 Vienna-Austria RA 81,94 76 Leeds-United Kingdom RA 64,7016 Sydney-Australia RA 81,14 77 Bratislava-Slovakia RA 64,6117 Geneva-Switzerland RA 81,14 78 A Coruña-Spain RA 64,3518 Los Angeles-USA RA 80,82 79 Lille-France RA 64,1019 Munich-Germany RA 80,71 80 Shanghai-China RA 63,7320 Baltimore-USA RA 79,82 81 Nagoya-Japan RA 63,7121 Vancouver-Canada RA 79,70 82 Riga-Latvia RA 63,6722 Singapore RA 79,22 83 Buenos Aires-Argentina RA 63,3223 Dallas-USA RA 78,24 84 Zagreb-Croatia RA 63,2224 Ottawa-Canada RA 77,78 85 Santiago-Chile RA 62,7425 Stockholm-Sweden RA 77,76 86 Bangkok-Thailand RA 62,2326 Oslo-Norway RA 77,75 87 Mexico City-Mexico RA 62,2227 Copenhagen-Denmark RA 77,56 88 Gothenburg-Sweden RA 61,8528 Madrid-Spain RA 77,00 89 Moscow-Russia RA 61,8329 Helsinki-Finland RA 76,91 90 Beijing-China RA 61,8330 Philadelphia-USA RA 76,59 91 Sofia-Bulgaria RA 61,5731 Montreal-Canada RA 76,49 92 Kuala Lumpur-Malaysia RA 61,1332 Houston-USA RA 75,97 93 Naples-Italy RA 60,9933 Dublin-Ireland RA 74,47 94 Athens-Greece RA 60,9034 Hamburg-Germany RA 74,20 95 Wrocław-Poland RA 60,6435 Barcelona-Spain RA 74,10 96 Medellín-Colombia M 59,9136 Frankfurt-Germany RA 74,03 97 Duisburg-Germany M 59,8537 Phoenix-USA RA 73,66 98 Porto-Portugal M 59,1038 Milan-Italy RA 73,66 99 Montevideo-Uruguay M 59,0939 Glasgow-United Kingdom RA 73,18 100 Busan-South Korea M 59,0340 Brussels-Belgium RA 72,89 101 São Paulo-Brazil M 58,9441 Prague-Czech Republic RA 71,87 102 Guangzhou-China M 57,4742 Hong Kong-China RA 71,69 103 St Petersburg-Russia M 57,4643 Rome-Italy RA 71,64 104 Istanbul-Turkey M 57,3944 Auckland-New Zealand RA 71,23 105 Daejeon-South Korea M 57,2945 Stuttgart-Germany RA 70,83 106 Tel Aviv-Israel M 56,8646 Linz-Austria RA 70,22 107 Córdoba-Argentina M 56,7047 Basel-Switzerland RA 70,13 108 Jerusalem-Israel M 56,4648 Miami-USA RA 70,06 109 Bucharest-Romania M 56,1049 Florence-Italy RA 70,02 110 Daegu-South Korea M 56,0150 Lyon-France RA 70,00 111 Monterrey-Mexico M 55,7451 Málaga-Spain RA 69,71 112 San José-Costa Rica M 55,7452 Lisbon-Portugal RA 69,42 113 Bogotá-Colombia M 55,3053 Tallinn-Estonia RA 69,25 114 Rio de Janeiro-Brazil M 54,8454 Warsaw-Poland RA 68,96 115 Haifa-Israel M 54,6555 Liverpool-United Kingdom RA 68,77 116 Lima-Peru M 54,6156 Taipei-Taiwan RA 68,65 117 Porto Alegre-Brazil M 54,1557 Manchester-United Kingdom RA 68,59 118 Shenzhen-China M 53,9658 Eindhoven-Netherlands RA 68,55 119 Kiev-Ukraine M 53,0259 Rotterdam-Netherlands RA 68,26 120 Jeddah-Saudi Arabia M 52,9160 Cologne-Germany RA 67,81 121 Guadalajara-Mexico M 52,8561 Turin-Italy RA 67,53 122 Cali-Colombia M 52,19
TABLE 11. CITY RANKING

IESE Business School - IESE Cities in Motion Index (ST-442-E)26
CITIES IN MOTION. RANKING BY DIMENSION
This section sets out the ranking according to each of the dimensions that make up the index, with the overall posi-tion of the city and its position in each dimension. To faci-litate a more intuitive visual observation, the darker greens represent the highest positions, and the darker reds the least favorable, via intermediate positions in yellow sha-des.
New York City (United States) is first in the overall ranking, driven by its performance in the dimensions of the eco-nomy (first place), technology (second place), human ca-pital and public management (fourth place), international outreach and urban planning (fifth place), and governan-ce (sixth place). However, it continues to be in very low positions in the dimensions of social cohesion (position 153) and environment (position 82).
U.S. cities achieve the top positions in the overall ranking. Of the 12 cities, nine are in the top 30, and New York City, Boston, and San Francisco are in the top five.
The interpretation of Table 12 is very important for the analysis of the results, since the relative position of all cities in each of the dimensions can be observed. In Figure 2, the positions of the cities on the world map can be seen. Each city is represented by a color. The more intense green shades correspond to the top positions on the CIMI ranking, while the worst-positioned cities are re-presented in red shades. A more detailed description of the ranking by dimension is provided below.
Table 13 shows the top 10 positions in the ranking for each dimension. In this way, we can visualize better the regional representativeness in the various dimensions.
HUMAN CAPITALThe city that ranks first in this dimension is London (United Kingdom). This city stands out for being the one that has the most top-level business schools, as well as for being the one with the highest number of universi-ties. Likewise, a high proportion of its population has secondary and higher education. Although the number one city is London, the top 10 ranking for this dimension has seven American cities, as shown in Table 13.
Ranking City Performance CIMI Ranking City Performance CIMI123 Almaty-Kazakhstan M 52,18 152 Novosibirsk-Russia M 45,15124 Belgrade-Serbia M 52,11 153 Belo Horizonte-Brazil B 44,98125 Tbilisi-Georgia M 51,89 154 Bursa-Turkey B 44,91126 Wuhan-China M 51,84 155 Johannesburg-South Africa B 44,88127 Minsk-Belarus M 51,72 156 Jakarta-Indonesia B 44,81128 Kuwait City-Kuwait M 51,67 157 Chongqing-China B 44,33129 Suzhou-China M 51,27 158 Durban-South Africa B 43,35130 Quito-Ecuador M 51,05 159 Mumbai-India B 43,19131 Curitiba-Brazil M 50,76 160 Guayaquil-Ecuador B 43,08132 Doha-Qatar M 50,55 161 Tehran-Iran B 42,80133 Cape Town-South Africa M 50,38 162 Shenyang-China B 42,70134 Sarajevo-Bosnia-Herzegovina M 49,88 163 Cairo-Egypt B 42,30135 Salvador-Brazil M 49,62 164 Tianjin-China B 41,73136 Fortaleza-Brazil M 49,07 165 Pretoria-South Africa B 41,16137 Tunis-Tunisia M 48,75 166 Alexandria-Egypt B 40,92138 Riyadh-Saudi Arabia M 48,32 167 Harbin-China B 40,63139 Rosario-Argentina M 47,49 168 Delhi-India B 40,55140 Manama-Bahrain M 47,30 169 Santo Domingo-Dominican Republic B 40,34141 Kaohsiung-Taiwan M 47,24 170 La Paz-Bolivia B 39,25142 Skopje-Macedonia M 47,21 171 Casablanca-Morocco B 39,09143 Brasília-Brazil M 47,18 172 Santa Cruz-Bolivia B 38,11144 Baku-Azerbaijan M 47,08 173 Caracas-Venezuela B 38,03145 Taichung-Taiwan M 47,03 174 Bangalore-India B 37,30146 Ho Chi Minh City-Vietnam M 46,99 175 Amman-Jordan B 36,70147 Ankara-Turkey M 46,76 176 Douala-Cameroon B 36,49148 Manila-Philippines M 46,51 177 Nairobi-Kenya B 36,26149 Guatemala City-Guatemala M 46,44 178 Kolkata-India B 34,54150 Tainan-Taiwan M 45,98 179 Lagos-Nigeria B 32,87151 Recife-Brazil M 45,40 180 Karachi-Pakistan B 32,74
IESE Business School - IESE Cities in Motion Index (ST-442-E)27
SOCIAL COHESIONHelsinki (Finland) is the city with the highest rating in this dimension. It is a city with a low unemployment rate, an equitable distribution of income and the highest percentage of women in government positions (more than 70%). It is worth noting that the top 10 cities in this ranking are European.
ECONOMYThe city that heads the ranking in this dimension is New York City (United States). This city achieves relatively high levels in all indicators but it stands out especially for its high GDP and number of headquarters of publicly traded companies. It is important to mention that the top 10 for this dimension has eight U.S. cities.
PUBLIC MANAGEMENTIn this case, Geneva placed first, with good values in al-most all the indicators, and it stands out especially for its low sales taxes and its reserves per capita. The top 10 for this dimension is made up of five U.S. cities and four Middle Eastern cities.
GOVERNANCEIn this dimension, Ottawa (Canada) ranks first, standing out in the strength of legal rights index and the corrup-tion perceptions index. Among the top 10 cities in this dimension’s ranking, there are four Canadian cities.
ENVIRONMENTIn this dimension, the cities that are best positioned are Zurich (Switzerland) and Tallinn (Estonia). These cities are in the top of the Environmental Performance Index (EPI) and have low levels of pollution and CO2 emissions. Eight of the cities in the top 10 for this dimension are European.
MOBILITY AND TRANSPORTATIONThe city of London (United Kingdom) comes first in the ranking and stands out in almost all the dimensions. Of the top 10 cities in the ranking for this dimension, there are eight European cities.
URBAN PLANNINGIn this dimension, Amsterdam (Netherlands) ranks first and is among the highest-ranking in almost all the in-dicators. It stands out because almost 100% of the po-pulation has access to adequate sanitation facilities and because of its low number of people per household. It is important to mention that eight European cities are in the top 10 for this dimension.
INTERNATIONAL OUTREACHParis (France) is the top-ranking city for this dimension and London (United Kingdom) is in second place. This is because Paris is the city with the second-highest num-ber of international tourists and ranks first in the ranking of cities by the number of photos taken in the city and uploaded to Panoramio. It is also the city where the most international conferences and meetings are organized. London, in turn, is the city that attracts a higher number of airline passengers, which is consistent with the fact that it is one of the cities with the largest number of air routes. Of the top 10 cities for this dimension, there are six European and two Asian cities.
TECHNOLOGYTaipei (Taiwan) is the city at the pinnacle of this ranking. This city achieves good levels in all the indicators and stands out especially for the percentage of broadband users in the city, the number of Facebook users per ca-pita, and the number of mobile phones per capita. Of the cities that occupy the top 10 positions, there are six Asian cities and three U.S. cities.
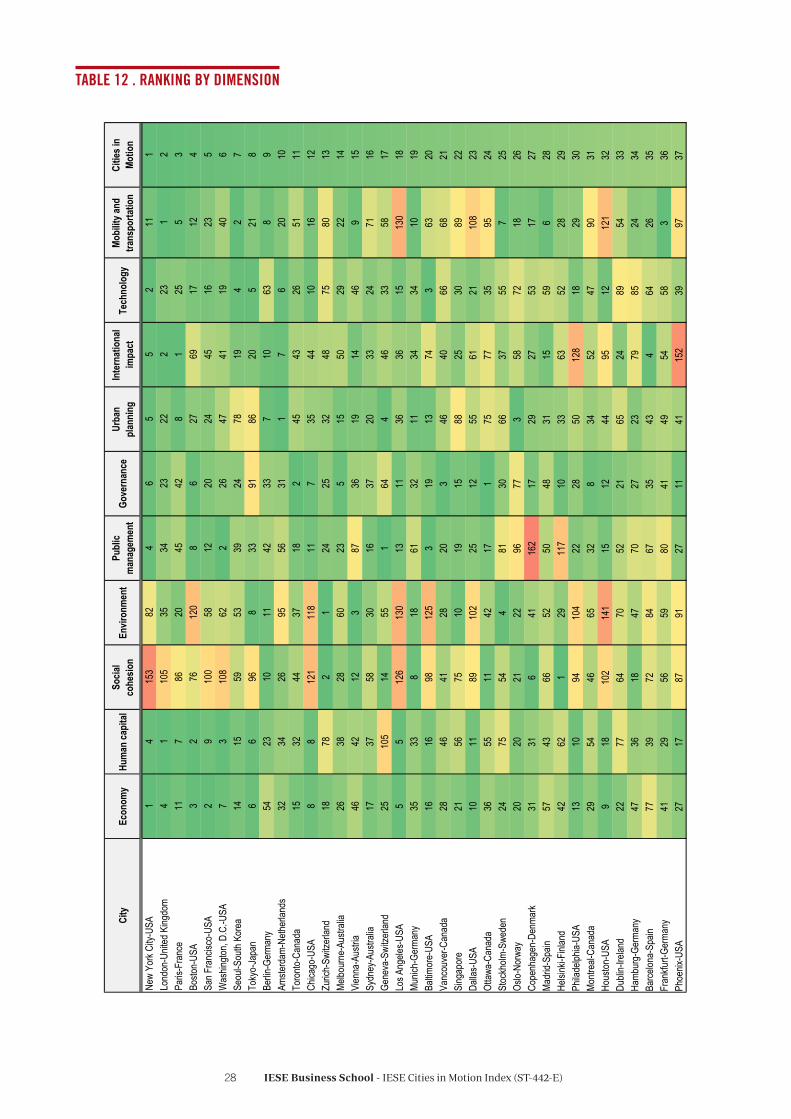
IESE Business School - IESE Cities in Motion Index (ST-442-E)28
City
Econ
omy
Hum
an ca
pita
lSo
cial
cohe
sion
Envir
onm
ent
Publ
ic m
anag
emen
tGo
vern
ance
Urba
n pl
anni
ngIn
tern
atio
nal
impa
ctTe
chno
logy
Mobi
lity a
nd
trans
porta
tion
Citie
s in
Motio
n
New
York
City-
USA
14
153
824
65
52
111
Lond
on-U
nited
King
dom
41
105
3534
2322
223
12
Paris
-Fra
nce
117
8620
4542
81
255
3Bo
ston-
USA
32
7612
08
627
6917
124
San F
ranc
isco-
USA
29
100
5812
2024
4516
235
Was
hingto
n, D.
C.-U
SA7
310
862
226
4741
1940
6Se
oul-S
outh
Kore
a14
1559
5339
2478
194
27
Toky
o-Ja
pan
66
968
3391
8620
521
8Be
rlin-G
erma
ny54
2310
1142
337
1063
89
Amste
rdam
-Neth
erlan
ds32
3426
9556
311
76
2010
Toro
nto-C
anad
a15
3244
3718
245
4326
5111
Chica
go-U
SA8
812
111
811
735
4410
1612
Zuric
h-Sw
itzer
land
1878
21
2425
3248
7580
13Me
lbour
ne-A
ustra
lia26
3828
6023
515
5029
2214
Vien
na-A
ustria
4642
123
8736
1914
469
15Sy
dney
-Aus
tralia
1737
5830
1637
2033
2471
16Ge
neva
-Swi
tzerla
nd25
105
1455
164
446
3358
17Lo
s Ang
eles-U
SA5
512
613
013
1136
3615
130
18Mu
nich-
Germ
any
3533
818
6132
1134
3410
19Ba
ltimor
e-US
A16
1698
125
319
1374
363
20Va
ncou
ver-C
anad
a28
4641
2820
346
4066
6821
Sing
apor
e21
5675
1019
1588
2530
8922
Dalla
s-USA
1011
8910
225
1255
6121
108
23Ot
tawa-
Cana
da36
5511
4217
175
7735
9524
Stoc
kholm
-Swe
den
2475
544
8130
6637
557
25Os
lo-No
rway
2020
2122
9677
358
7218
26Co
penh
agen
-Den
mark
3131
641
162
1729
2753
1727
Madr
id-Sp
ain57
4366
5250
4831
1559
628
Helsi
nki-F
inlan
d42
621
2911
710
3363
5228
29Ph
ilade
lphia-
USA
1310
9410
422
2850
128
1829
30Mo
ntrea
l-Can
ada
2954
4665
328
3452
4790
31Ho
uston
-USA
918
102
141
1512
4495
1212
132
Dubli
n-Ire
land
2277
6470
5221
6524
8954
33Ha
mbur
g-Ge
rman
y47
3618
4770
2723
7985
2434
Barce
lona-
Spain
7739
7284
6735
434
6426
35Fr
ankfu
rt-Ge
rman
y41
2956
5980
4149
5458
336
Phoe
nix-U
SA27
1787
9127
1141
152
3997
37
TABLE 12 . RANKING BY DIMENSION

IESE Business School - IESE Cities in Motion Index (ST-442-E)29
City
Econ
omy
Hum
an ca
pita
lSo
cial
cohe
sion
Envir
onm
ent
Publ
ic m
anag
emen
tGo
vern
ance
Urba
n pl
anni
ngIn
tern
atio
nal
outre
ach
Tech
nolo
gyMo
bilit
y and
tra
nspo
rtatio
nCi
ties i
n Mo
tion
Milan
-Italy
5635
7146
6979
1423
6115
38Gl
asgo
w-Un
ited K
ingdo
m53
4016
5791
1852
9348
5939
Brus
sels-
Belgi
um49
6847
8984
3453
3045
3040
Prag
ue-C
zech
Rep
ublic
9373
514
114
114
2116
105
6741
Hong
Kon
g-Ch
ina19
2213
910
873
1389
3111
3742
Rome
-Italy
7841
115
3660
8916
960
6543
Auck
land-
New
Zeala
nd30
124
4010
041
482
7644
8544
Stutt
gart-
Germ
any
4570
333
119
5928
124
110
5245
Linz-A
ustria
5524
275
163
4061
2871
161
46Ba
sel-S
witze
rland
3410
14
6837
6257
119
146
5347
Miam
i-USA
2321
127
115
963
3042
3814
948
Flore
nce-
Italy
9865
1531
100
5817
2696
126
49Ly
on-F
ranc
e64
4724
2394
8639
9065
5050
Málag
a-Sp
ain12
313
435
5111
656
6213
7645
51Lis
bon-
Portu
gal
7199
6044
9239
5822
8611
052
Tallin
n-Es
tonia
6369
92
126
102
7462
8710
153
War
saw-
Polan
d95
5929
1614
293
683
7041
54Liv
erpo
ol-Un
ited K
ingdo
m50
5220
2112
816
9111
014
972
55Ta
ipei-T
aiwan
9028
4215
726
4413
129
199
56Ma
nche
ster-U
nited
King
dom
5225
3773
6322
7610
310
012
557
Eind
hove
n-Ne
therla
nds
6294
3681
156
3818
8731
109
58Ro
tterd
am-N
ether
lands
6061
3071
120
539
111
9310
659
Colog
ne-G
erma
ny59
5748
6713
866
5653
112
2760
Turin
-Italy
103
109
8017
139
5012
9299
3261
Birm
ingha
m-Un
ited K
ingdo
m48
3031
7513
39
9815
314
370
62Va
lencia
-Spa
in11
112
639
4510
560
5480
7834
63Ab
u Dha
bi-Un
ited A
rab E
mira
tes12
171
5315
26
7815
089
1356
64An
twer
p-Be
lgium
7295
740
127
4726
135
153
107
65Du
bai-U
nited
Ara
b Emi
rates
4310
265
149
570
159
1184
4866
Buda
pest-
Hung
ary
105
4573
7215
881
4832
9225
67Se
ville-
Spain
118
130
4550
130
4359
6569
6468
Nottin
gham
-Unit
ed K
ingdo
m61
5025
2416
822
8515
812
887
69Lju
bljan
a-Sl
oven
ia10
286
239
124
8879
117
9475
70Vi
lnius
-Lith
uania
8364
387
135
105
7299
106
8871
Osak
a-Ja
pan
3327
6776
5510
410
472
4212
972
Marse
ille-F
ranc
e73
6383
5411
182
4210
697
4773
Nice
-Fra
nce
8072
1927
129
101
6051
171
7974
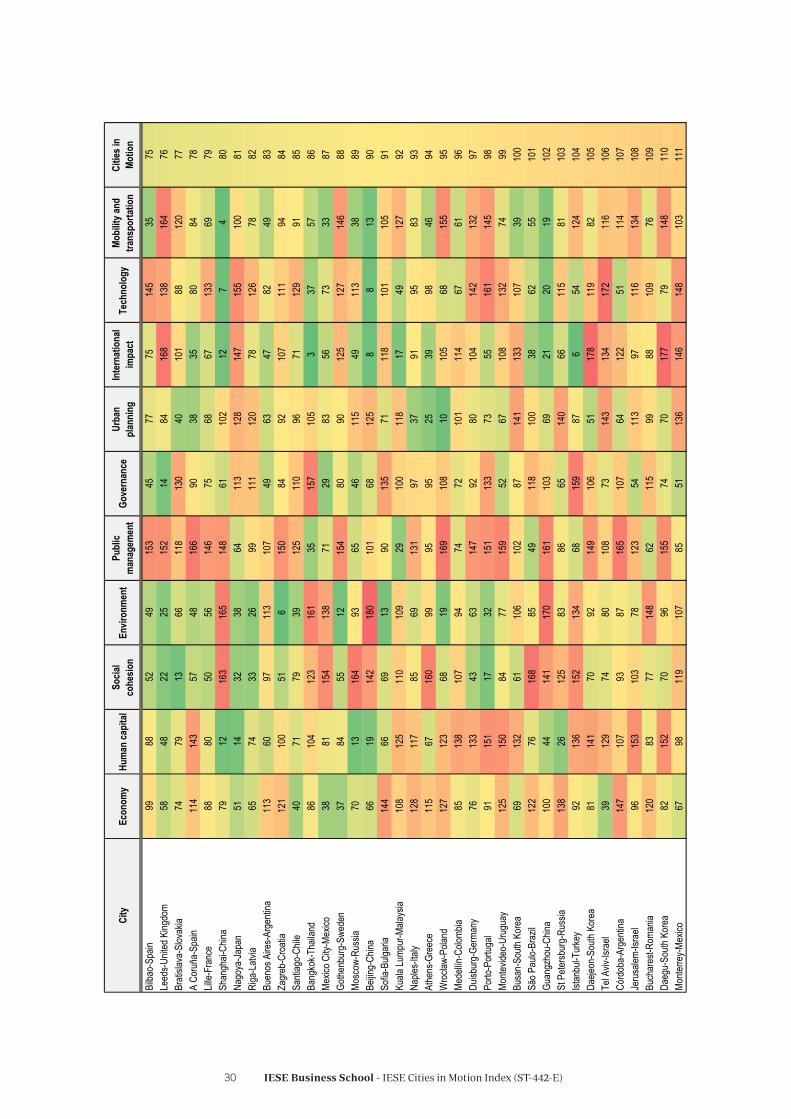
IESE Business School - IESE Cities in Motion Index (ST-442-E)30
City
Econ
omy
Hum
an ca
pita
lSo
cial
cohe
sion
Envir
onm
ent
Publ
ic m
anag
emen
tGo
vern
ance
Urba
n pl
anni
ngIn
tern
atio
nal
impa
ctTe
chno
logy
Mobi
lity a
nd
trans
porta
tion
Citie
s in
Motio
n
Bilba
o-Sp
ain99
8852
4915
345
7775
145
3575
Leed
s-Unit
ed K
ingdo
m58
4822
2515
214
8416
813
816
476
Brati
slava
-Slov
akia
7479
1366
118
130
4010
188
120
77A
Coru
ña-S
pain
114
143
5748
166
9038
3580
8478
Lille-
Fran
ce88
8050
5614
675
6867
133
6979
Shan
ghai-
China
7912
163
165
148
6110
212
74
80Na
goya
-Japa
n51
1432
3864
113
128
147
155
100
81Ri
ga-L
atvia
6574
3326
9911
112
078
126
7882
Buen
os A
ires-A
rgen
tina
113
6097
113
107
4963
4782
4983
Zagr
eb-C
roati
a12
110
051
615
084
9210
711
194
84Sa
ntiag
o-Ch
ile40
7179
3912
511
096
7112
991
85Ba
ngko
k-Tha
iland
8610
412
316
135
157
105
337
5786
Mexic
o City
-Mex
ico38
8115
413
871
2983
5673
3387
Gothe
nbur
g-Sw
eden
3784
5512
154
8090
125
127
146
88Mo
scow
-Rus
sia70
1316
493
6546
115
4911
338
89Be
ijing-
China
6619
142
180
101
6812
58
813
90So
fia-B
ulgar
ia14
466
6913
9013
571
118
101
105
91Ku
ala Lu
mpur
-Mala
ysia
108
125
110
109
2910
011
817
4912
792
Naple
s-Ital
y12
811
785
6913
197
3791
9583
93At
hens
-Gre
ece
115
6716
099
9595
2539
9846
94W
roc ła
w-Po
land
127
123
6819
169
108
1010
568
155
95Me
dellín
-Colo
mbia
8513
810
794
7472
101
114
6761
96Du
isbur
g-Ge
rman
y76
133
4363
147
9280
104
142
132
97Po
rto-P
ortug
al91
151
1732
151
133
7355
161
145
98Mo
ntevid
eo-U
rugu
ay12
515
084
7715
952
6710
813
274
99Bu
san-
South
Kor
ea69
132
6110
610
287
141
133
107
3910
0Sã
o Pau
lo-Br
azil
122
7616
885
4911
810
038
6255
101
Guan
gzho
u-Ch
ina10
044
141
170
161
103
6921
2019
102
St P
etersb
urg-
Russ
ia13
826
125
8386
6514
066
115
8110
3Ist
anbu
l-Tur
key
9213
615
213
468
159
876
5412
410
4Da
ejeon
-Sou
th Ko
rea
8114
170
9214
910
651
178
119
8210
5Te
l Aviv
-Isra
el39
129
7480
108
7314
313
417
211
610
6Có
rdob
a-Ar
genti
na14
710
793
8716
510
764
122
5111
410
7Je
rusa
lem-Is
rael
9615
310
378
123
5411
397
116
134
108
Buch
ares
t-Rom
ania
120
8377
148
6211
599
8810
976
109
Daeg
u-So
uth K
orea
8215
270
9615
574
7017
779
148
110
Monte
rrey-M
exico
6798
119
107
8551
136
146
148
103
111

IESE Business School - IESE Cities in Motion Index (ST-442-E)31
City
Econ
omy
Hum
an ca
pita
lSo
cial
cohe
sion
Envir
onm
ent
Publ
ic m
anag
emen
tGo
vern
ance
Urba
n pl
anni
ngIn
tern
atio
nal
impa
ctTe
chno
logy
Mobi
lity a
nd
trans
porta
tion
Citie
s in
Motio
n
San J
osé-
Costa
Rica
136
166
9534
7614
710
811
615
110
411
2Bo
gotá-
Colom
bia68
9315
711
053
7294
8610
415
411
3Ri
o de J
aneir
o-Br
azil
155
8517
090
7576
9560
102
4311
4Ha
ifa-Is
rael
8912
178
1517
011
613
459
170
147
115
Lima-
Peru
8411
813
513
783
5514
264
124
118
116
Porto
Aleg
re-B
razil
168
9712
879
109
8310
613
615
010
211
7Sh
enzh
en-C
hina
9449
146
162
177
149
8118
2736
118
Kiev
-Ukra
ine13
258
149
9798
143
111
149
154
3111
9Je
ddah
-Sau
di Ar
abia
146
179
130
135
1015
213
015
143
9812
0Gu
adala
jara-
Mexic
o75
108
109
105
121
120
133
131
168
7712
1Ca
li-Colo
mbia
8716
514
412
154
6997
170
123
137
122
Alma
ty-Ka
zakh
stan
9790
6311
488
164
151
174
157
4412
3Be
lgrad
e-Se
rbia
149
111
122
9810
312
811
010
091
136
124
Tbilis
i-Geo
rgia
117
120
106
6113
213
110
914
213
616
612
5W
uhan
-Chin
a12
453
9915
917
513
612
684
4114
126
Mins
k-Bela
rus
101
8288
6414
116
815
515
916
486
127
Kuwa
it City
-Kuw
ait14
515
662
111
2112
917
111
283
162
128
Suzh
ou-C
hina
129
9211
317
317
813
22
8232
6012
9Qu
ito-E
cuad
or10
713
511
886
3817
116
112
016
096
130
Curiti
ba-B
razil
170
9112
412
472
9612
311
511
713
313
1Do
ha-Q
atar
4415
549
153
1416
716
810
217
615
813
2Ca
pe T
own-
South
Afric
a16
314
415
914
540
7113
994
9013
513
3Sa
rajev
o-Bo
snia-
Herze
govin
a17
910
614
874
171
125
112
126
130
6213
4Sa
lvado
r-Bra
zil17
411
015
510
110
614
812
113
213
166
135
Forta
leza-
Braz
il17
515
413
812
615
767
124
156
139
9313
6Tu
nis-T
unisi
a15
217
010
111
212
213
810
716
112
015
613
7Ri
yadh
-Sau
di Ar
abia
109
178
120
155
714
015
313
977
177
138
Rosa
rio-A
rgen
tina
150
112
111
8817
612
710
314
114
111
513
9Ma
nama
-Bah
rain
137
103
3412
731
172
175
7018
014
314
0Ka
ohsiu
ng-T
aiwan
133
137
8216
613
411
216
596
1414
414
1Sk
opje-
Mace
donia
116
168
151
4311
214
211
714
016
217
614
2Br
asília
-Bra
zil16
214
213
714
358
139
127
121
159
113
143
Baku
-Aze
rbaij
an10
489
166
122
143
163
138
155
121
7314
4Ta
ichun
g-Ta
iwan
135
128
8116
814
098
163
123
916
714
5Ho
Chi
Minh
City
-Viet
nam
148
159
158
128
113
123
144
7311
812
314
6An
kara
-Tur
key
119
131
136
142
7815
413
714
413
414
014
7Ma
nila-
Philip
pines
131
139
140
147
5716
014
568
103
174
148

IESE Business School - IESE Cities in Motion Index (ST-442-E)32
City
Econ
omy
Hum
an ca
pita
lSo
cial
cohe
sion
Envir
onm
ent
Publ
ic m
anag
emen
tGo
vern
ance
Urba
n pl
anni
ngIn
tern
atio
nal
outre
ach
Tech
nolo
gyMo
bilit
y and
tra
nspo
rtatio
nCi
ties i
n Mo
tion
Guate
mala
City-
Guate
mala
134
175
117
103
9712
115
816
212
516
514
9Ta
inan-
Taiw
an14
014
590
169
7715
316
098
2217
015
0Re
cife-
Braz
il17
314
813
214
493
134
116
166
114
150
151
Novo
sibirs
k-Rus
sia14
287
116
131
160
5716
616
515
816
315
2Be
lo Ho
rizon
te-Br
azil
169
9613
414
613
714
513
213
815
611
715
3Bu
rsa-T
urke
y13
011
591
116
173
156
157
113
169
131
154
Joha
nnes
burg
-Sou
th Af
rica
154
146
169
150
4694
149
150
108
153
155
Jaka
rta-In
done
sia12
612
716
516
036
122
174
8550
159
156
Chon
gqing
-Chin
a14
316
214
317
617
410
993
8156
119
157
Durb
an-S
outh
Afric
a16
716
015
612
311
085
156
173
147
138
158
Mumb
ai-Ind
ia15
916
416
116
459
124
146
109
4016
015
9Gu
ayaq
uil-E
cuad
or11
216
913
315
151
166
152
171
135
173
160
Tehr
an-Ir
an15
712
217
211
947
151
162
130
166
122
161
Shen
yang
-Chin
a13
914
714
317
817
213
712
913
736
111
162
Cairo
-Egy
pt17
211
317
415
848
150
119
148
7415
716
3Tia
njin-
China
106
5111
217
418
015
514
814
557
4216
4Pr
etoria
-Sou
th Af
rica
165
114
114
140
4415
815
417
517
317
916
5Al
exan
dria-
Egyp
t17
611
616
712
982
146
147
129
165
172
166
Harb
in-Ch
ina15
114
014
317
717
913
612
212
728
9216
7De
lhi-In
dia15
614
914
517
914
499
167
5781
142
168
Santo
Dom
ingo-
Domi
nican
Rep
ublic
141
172
171
132
8916
913
516
317
715
216
9La
Paz
-Boli
via16
015
814
713
979
161
179
157
122
139
170
Casa
blanc
a-Mo
rocc
o16
417
712
911
716
416
516
416
017
417
117
1Sa
nta C
ruz-B
olivia
158
157
131
133
136
173
176
172
163
141
172
Cara
cas-V
enez
uela
180
119
173
136
3017
411
416
417
811
217
3Ba
ngalo
re-In
dia16
616
110
417
516
712
617
014
313
712
817
4Am
man-
Jord
an17
117
492
156
6617
016
915
416
718
017
5Do
uala-
Came
roon
161
167
150
154
104
144
172
180
140
151
176
Nairo
bi-Ke
nya
153
176
177
163
4311
717
316
714
417
517
7Ko
lkata-
India
177
163
162
167
115
119
177
169
152
178
178
Lago
s-Nige
ria11
017
317
617
128
162
180
179
179
168
179
Kara
chi-P
akist
an17
818
017
517
214
514
117
817
617
516
918
0Ka
rach
i-Paq
uistán
170
180
174
169
151
122
180
177
181
157
181

IESE Business School - IESE Cities in Motion Index (ST-442-E)33
FIGURE 2. MAP OF CITIES IN THE CIMI RANKING

IESE Business School - IESE Cities in Motion Index (ST-442-E)34
TABLE 13. TOP 10 BY DIMENSION
ECONOMY
ENVIRONMENT
HUMAN CAPITAL
PUBLIC MANAGEMENT
SOCIAL COHESION
New York City-USA 1
San Francisco-USA 2
Boston-USA 3
London-United Kingdom 4
Los Angeles-USA 5
Tokyo-Japan 6
Washington, D.C.-USA 7
Chicago-USA 8
Houston-USA 9
Dallas-USA 10
Zurich-Switzerland 1
Tallinn-Estonia 2
Vienna-Austria 3
Stockholm-Sweden 4
Linz-Austria 5
Zagreb-Croatia 6
Vilnius-Lithuania 7
Tokyo-Japan 8
Ljubljana-Slovenia 9
Singapore 10
London-United Kingdom 1
Boston-USA 2
Washington, D.C.-USA 3
New York City-USA 4
Los Angeles-USA 5
Tokyo-Japan 6
Paris-France 7
Chicago-USA 8
San Francisco-USA 9
Philadelphia-USA 10
Geneva-Switzerland 1
Washington, D.C.-USA 2
Baltimore-USA 3
New York City-USA 4
Dubai-United Arab Emirates 5
Abu Dhabi-United Arab Emi-
rates6
Riyadh-Saudi Arabia 7
Boston-USA 8
Miami-USA 9
Jeddah-Saudi Arabia 10
Helsinki-Finland 1
Zurich-Switzerland 2
Stuttgart-Germany 3
Basel-Switzerland 4
Prague-Czech Republic 5
Copenhagen-Denmark 6
Antwerp-Belgium 7
Munich-Germany 8
Tallinn-Estonia 9
Berlin-Germany 10

IESE Business School - IESE Cities in Motion Index (ST-442-E)35
GOVERNANCE
TECHNOLOGY
URBAN PLANNING
MOBILITY AND TRANSPORTATION
INTERNATIONAL OUTREACH
Ottawa-Canada 1
Toronto-Canada 2
Vancouver-Canada 3
Auckland-New Zealand 4
Melbourne-Australia 5
New York City-USA 6
Chicago-USA 7
Montreal-Canada 8
Birmingham-United Kingdom 9
Helsinki-Finland 10
Taipei-Taiwan 1
New York City-USA 2
Baltimore-USA 3
Seoul-South Korea 4
Tokyo-Japan 5
Amsterdam-Netherlands 6
Shanghai-China 7
Beijing-China 8
Taichung-Taiwan 9
Chicago-USA 10
Amsterdam-Netherlands 1
Suzhou-China 2
Oslo-Norway 3
Geneva-Switzerland 4
New York City-USA 5
Warsaw-Poland 6
Berlin-Germany 7
Paris-France 8
Rotterdam-Netherlands 9
Wrocław-Poland 10
London-United Kingdom 1
Seoul-South Korea 2
Frankfurt-Germany 3
Shanghai-China 4
Paris-France 5
Madrid-Spain 6
Stockholm-Sweden 7
Berlin-Germany 8
Vienna-Austria 9
Munich-Germany 10
Paris-France 1
London-United Kingdom 2
Bangkok-Thailand 3
Barcelona-Spain 4
New York City-USA 5
Istanbul-Turkey 6
Amsterdam-Netherlands 7
Beijing-China 8
Rome-Italy 9
Berlin-Germany 10

IESE Business School - IESE Cities in Motion Index (ST-442-E)36
“IN ORDER TO EXECUTE THE STRATEGIC PLANS,
IT IS NECESSARY TO ACKNOWLEDGE THAT CITIES
CANNOT DO IT ALL ALONE. THE TRANSFORMATION
OF A CITY IS NOT AN INDIVIDUAL UNDERTAKING
BUT INSTEAD A COLLECTIVE ENDEAVOR, SO
COLLABORATION IS ESSENTIAL”.
Pascual Berrone and Joan Enric Ricart
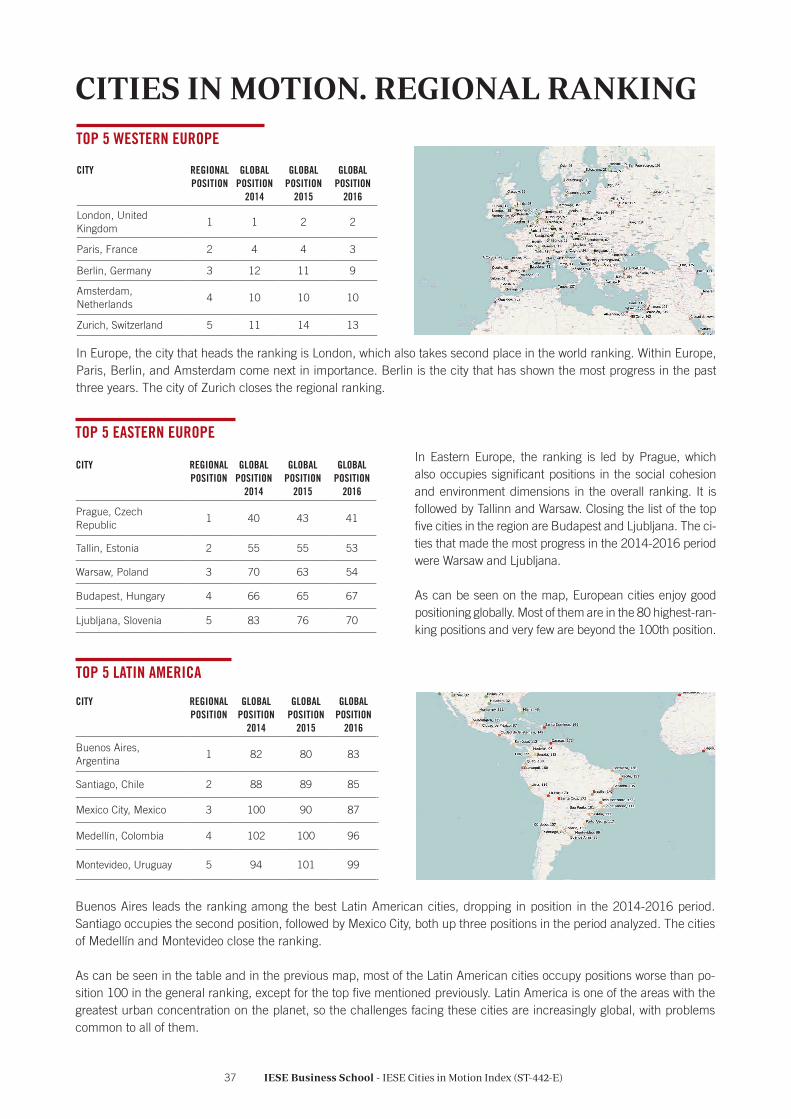
IESE Business School - IESE Cities in Motion Index (ST-442-E)37
CITIES IN MOTION. REGIONAL RANKING
TOP 5 WESTERN EUROPE
TOP 5 LATIN AMERICA
CITY REGIONAL POSITION
GLOBAL POSITION
2014
GLOBAL POSITION
2015
GLOBAL POSITION
2016
London, United Kingdom
1 1 2 2
Paris, France 2 4 4 3
Berlin, Germany 3 12 11 9
Amsterdam, Netherlands
4 10 10 10
Zurich, Switzerland 5 11 14 13
CITY REGIONAL POSITION
GLOBAL POSITION
2014
GLOBAL POSITION
2015
GLOBAL POSITION
2016
Buenos Aires, Argentina
1 82 80 83
Santiago, Chile 2 88 89 85
Mexico City, Mexico 3 100 90 87
Medellín, Colombia 4 102 100 96
Montevideo, Uruguay 5 94 101 99
In Europe, the city that heads the ranking is London, which also takes second place in the world ranking. Within Europe, Paris, Berlin, and Amsterdam come next in importance. Berlin is the city that has shown the most progress in the past three years. The city of Zurich closes the regional ranking.
Buenos Aires leads the ranking among the best Latin American cities, dropping in position in the 2014-2016 period. Santiago occupies the second position, followed by Mexico City, both up three positions in the period analyzed. The cities of Medellín and Montevideo close the ranking.
As can be seen in the table and in the previous map, most of the Latin American cities occupy positions worse than po-sition 100 in the general ranking, except for the top five mentioned previously. Latin America is one of the areas with the greatest urban concentration on the planet, so the challenges facing these cities are increasingly global, with problems common to all of them.
TOP 5 EASTERN EUROPE
CITY REGIONAL POSITION
GLOBAL POSITION
2014
GLOBAL POSITION
2015
GLOBAL POSITION
2016
Prague, Czech Republic
1 40 43 41
Tallin, Estonia 2 55 55 53
Warsaw, Poland 3 70 63 54
Budapest, Hungary 4 66 65 67
Ljubljana, Slovenia 5 83 76 70
In Eastern Europe, the ranking is led by Prague, which also occupies significant positions in the social cohesion and environment dimensions in the overall ranking. It is followed by Tallinn and Warsaw. Closing the list of the top five cities in the region are Budapest and Ljubljana. The ci-ties that made the most progress in the 2014-2016 period were Warsaw and Ljubljana.
As can be seen on the map, European cities enjoy good positioning globally. Most of them are in the 80 highest-ran-king positions and very few are beyond the 100th position.

IESE Business School - IESE Cities in Motion Index (ST-442-E)38
TOP 5 ASIA-PACIFIC
CITY REGIONAL POSITION
GLOBAL POSITION
2014
GLOBAL POSITION
2015
GLOBAL POSITION
2016
Seoul, South Korea 1 14 8 7
Tokyo, Japan 2 9 12 8
Singapore, Singapore 3 29 28 22
Hong Kong, China 4 38 38 42
Taipei, Taiwan 5 63 59 56
Seoul leads the ranking in the Asia-Pacific region, coming in seventh globally, up seven places since 2014. It is followed by Tokyo, both in the regional ranking and at eighth place in the overall ranking. The cities of Singapore, Hong Kong and Taipei close the regional ranking. It is interesting to note that, except for Hong Kong, the other four cities that lead the region have improved their positions in the overall ranking in the 2014-2016 period.
TOP 5 MIDDLE EAST
CITY REGIONAL POSITION
GLOBAL POSITION
2014
GLOBAL POSITION
2015
GLOBAL POSITION
2016
Abu Dhabi, United Arab Emirates
1 62 60 64
Dubai, United Arab Emirates
2 48 62 66
Tel Aviv, Israel 3 101 105 106
Jerusalem, Israel 4 104 108 108
Haifa, Israel 5 113 117 115
The Middle East ranking is headed by the city of Abu Dhabi, which is in position number 64 of the global ranking. Just one position behind is the city of Dubai. Completing the ranking of the five best in the region are Tel Aviv, Jerusalem, and Haifa. Unlike other emerging regions where the top five positions are spread among different countries, in the Middle East the top five cities are located in only two countries (the United Arab Emirates and Israel). In addition, it can be seen that all the cities in the top five have dropped positions in the global ranking for the 2014-2016 period.
TOP 5 AFRICACITY REGIONAL
POSITIONGLOBAL
POSITION 2014
GLOBAL POSITION
2015
GLOBAL POSITION
2016
Cape Town, South Africa
1 120 128 133
Tunis, Tunisia 2 145 145 137
Johannesburg, South Africa
3 155 155 155
Durban, South Africa 4 157 160 158
Cairo, Egypt 5 168 166 163
Africa’s ranking is headed by the South African city of Cape Town, followed by Tunis. Completing the list of the top five in the region are Johannesburg, Durban, and Cairo. It is worth noting that, of the African cities included in the index, all of them are in the last places in the overall ranking.

IESE Business School - IESE Cities in Motion Index (ST-442-E)39
TOP 5 NORTH AMERICA
CITY REGIONAL POSITION
GLOBAL POSITION
2014
GLOBAL POSITION
2015
GLOBAL POSITION
2016
New York City, United States
1 2 1 1
Boston, United States 2 3 3 4
San Francisco, United States
3 5 5 5
Washington, D.C., United States
4 7 6 6
Toronto, Canada 5 19 20 11
In North America, the ranking is led by New York City, which also leads in the overall classification. It is followed by Boston and San Francisco, which are also in the top five of the overall ranking. Closing the list of the top five North American cities are Washington, D.C., and Toronto. Unlike previous years, this year a Canadian city is in the region’s top five, occupying position 11 in the overall ranking.
As can be seen in the graphic of the region, North American cities occupy the top places in the overall ranking. In the case of the United States, nine of the 12 U.S. cities included in the study are among the top 30 in the overall ranking.
TOP 3 OCEANIA
CITY REGIONAL POSITION
GLOBAL POSITION
2014
GLOBAL POSITION
2015
GLOBAL POSITION
2016
Melbourne, Australia 1 8 9 14
Sydney, Australia 2 17 17 16
Auckland, New Zealand
3 34 35 44
In Oceania, the ranking is led by Melbourne, which is also in the top 20 in dimensions such as governance and urban plan-ning. It is followed in the regional ranking by the city of Sydney and this ranking closes with the city of Auckland. The two cities other than Sydney have dropped positions in the overall ranking in the 2014-2016 period.
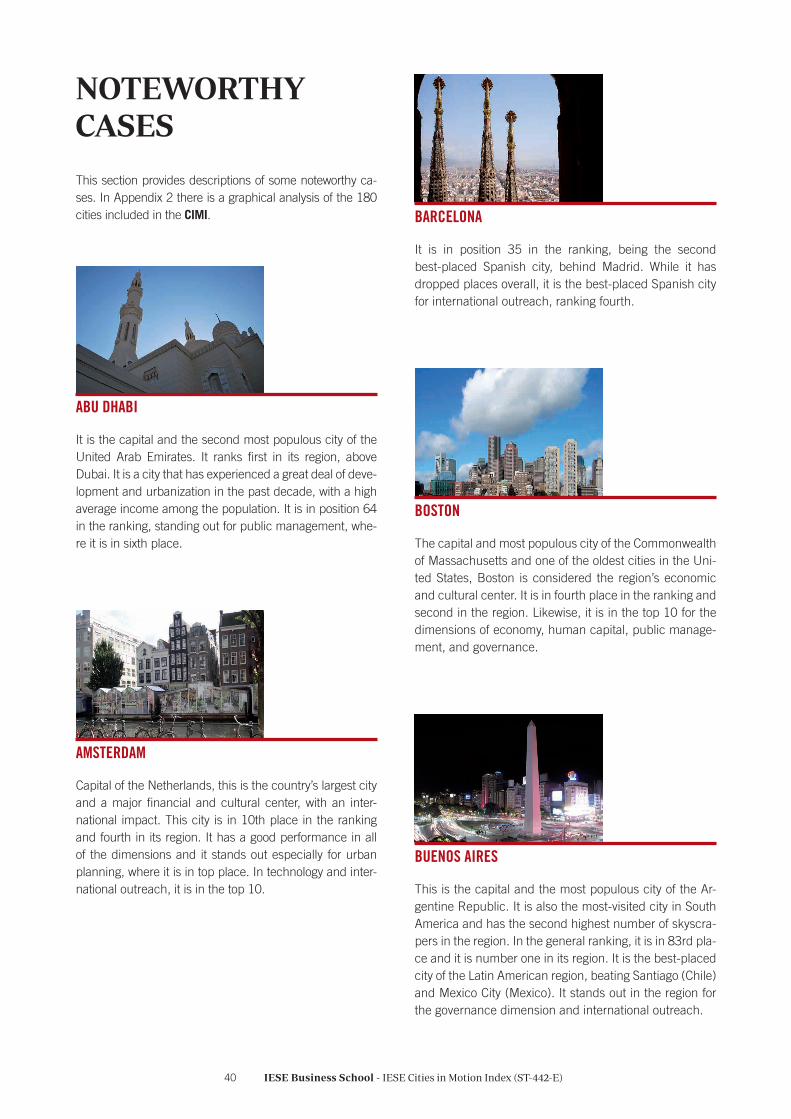
IESE Business School - IESE Cities in Motion Index (ST-442-E)40
NOTEWORTHY CASES
BARCELONA
It is in position 35 in the ranking, being the second best-placed Spanish city, behind Madrid. While it has dropped places overall, it is the best-placed Spanish city for international outreach, ranking fourth.
BOSTON
The capital and most populous city of the Commonwealth of Massachusetts and one of the oldest cities in the Uni-ted States, Boston is considered the region’s economic and cultural center. It is in fourth place in the ranking and second in the region. Likewise, it is in the top 10 for the dimensions of economy, human capital, public manage-ment, and governance.
BUENOS AIRES
This is the capital and the most populous city of the Ar-gentine Republic. It is also the most-visited city in South America and has the second highest number of skyscra-pers in the region. In the general ranking, it is in 83rd pla-ce and it is number one in its region. It is the best-placed city of the Latin American region, beating Santiago (Chile) and Mexico City (Mexico). It stands out in the region for the governance dimension and international outreach.
This section provides descriptions of some noteworthy ca-ses. In Appendix 2 there is a graphical analysis of the 180 cities included in the CIMI.
ABU DHABI
It is the capital and the second most populous city of the United Arab Emirates. It ranks first in its region, above Dubai. It is a city that has experienced a great deal of deve-lopment and urbanization in the past decade, with a high average income among the population. It is in position 64 in the ranking, standing out for public management, whe-re it is in sixth place.
AMSTERDAM
Capital of the Netherlands, this is the country’s largest city and a major financial and cultural center, with an inter-national impact. This city is in 10th place in the ranking and fourth in its region. It has a good performance in all of the dimensions and it stands out especially for urban planning, where it is in top place. In technology and inter-national outreach, it is in the top 10.

IESE Business School - IESE Cities in Motion Index (ST-442-E)41
MADRID It is Spain’s highest-placed city in the ranking. It stands out in the dimensions of mobility and transportation, in sixth place, and in international outreach, in position 15.
MELBOURNE Melbourne is in 14th place in the general ranking, being the top city in its region. It stands out in the dimensions of governance and urban planning. It is a city with low poverty and crime rates and high levels of health and education, both public and private. It is the city that shows the most homogeneity in all the dimensions of the CIMI.
New York City is one of the three largest and most popu-lous urban agglomerations in the world and is the second largest urban concentration in North America after Mexi-co City. New York City is in the top position in the ranking. It is the world’s most important economic center, ranking first in this dimension. Likewise, it is in second place in technology and is in the top five in the dimensions of hu-man capital, public management, urban planning, and international outreach.
GENEVA Geneva is the second most populous city in Switzerland, which hosts the highest number of international organizations in the world. It is in 17th place in the overall ranking and is first in the dimension of public management. It also stands out in urban planning and social cohesion.
HELSINKI This is the capital and the most populous city of Finland. Helsinki is the largest political, financial and research center as well as one of the most important cities of northern Europe. About 70% of foreign companies that operate in Finland set up in Helsinki or its surroundings. It is in 29th place in the ranking and is in top place for social cohesion.
LONDON The capital of England and the United Kingdom, London is the largest city and urban area of Great Britain. It is a nerve center in the field of the arts, commerce, education, entertainment, fashion, finance, the media, research, tourism, and transportation. For this reason, London takes second place in the ranking, with high levels in almost all the dimensions. It stands out in the dimensions of human capital and mobility and transportation, with top place in the ranking. However, it is in the top five in the international outreach and economy dimensions. It underperforms in social cohesion, reaching only position 105.
NEW YORK CITY

IESE Business School - IESE Cities in Motion Index (ST-442-E)42
PARIS
The French capital is the world’s most popular tourist destination, with more than 42 million foreign tourists a year. Europe’s main business district is found here, hos-ting the head office of almost half of big French compa-nies, as well as the headquarters of 20 of the 100 biggest companies in the world. It is in third place in the ranking and is first for international outreach. Likewise, it excels in human capital, urban planning, mobility and transpor-tation, and the economy.
SAN FRANCISCO
This city is the fourth most populous city in the state of California. It is the most important cultural, financial, and transportation hub of the San Francisco Bay Area. Tourism is the most important activity of San Francisco’s economy. It is in fourth place in the overall ranking and second in the economy dimension. It also stands out in human capital and public management. It is the third city in the regional ranking.
SEOUL
The capital of South Korea is one of the world’s largest metropolitan areas. Headquarters to some of the world’s biggest companies – such as Samsung, LG Group, Hyun-dai, and Kia Motors, among others – it is in seventh place in the ranking and is first in its region. It stands out in mo-
bility and transportation (second) and technology (four-th). In addition, it is in the top 20 in the dimensions of the economy, human capital, and international outreach.
TAIPEI
It is the capital and the most populous city of Taiwan. It ranks first in the technology dimension and is in 56th place in the overall ranking. It is known as the Asian Si-licon Valley since it is in this city that most of the world’s technology is manufactured. It is a city that makes a li-ving from exporting chips and computers to the rest of the world.
ZURICH
Zurich is the main city in Switzerland and is the country’s financial engine and cultural center. It was chosen as the city with the world’s highest quality of life in 2006 and 2008, currently being in second place. It is in 13th place in the CIMI ranking and in first place in the environment dimension. It also comes in second in the social cohesion
dimension.
IESE Business School - IESE Cities in Motion Index (ST-442-E)43
EVOLUTION OF THE CITIES IN MOTION INDEX
A city’s evolution is vitally important in understanding the focus of its development target. Therefore, this section sets out the evolution of the past three years of the CIMI for the top 50 cities in the ranking of 2016.
The results show a certain stability in the top seven posi-tions. The first and second positions in the ranking varied between New York City and London between 2014 and 2016. The third and fourth positions varied between Pa-ris and Boston throughout the period, while San Francis-co has held onto fifth place since 2014. It is interesting to analyze the evolution of cities such as Toronto, which climbed nine positions from 2015 and 2016. Its progress is reflected in the position that it occu-pies in the general ranking for social cohesion, the envi-ronment, and urban planning. Another city that has evol-ved very favorably is Singapore, which rose seven places in the 2014-2016 period. This evolution is also due to advances in the general ranking for social cohesion and
the environment. Finally, the city of Milan also shows a positive evolution, rising 12 places in the ranking. This is explained in particular by its improved performance in the dimensions of social cohesion and urban planning.
As for the rest of the cities, they were fairly stable throu-ghout the period except for Auckland, which had a worse performance in the period, falling 10 places in the ran-king. This variation is explained in particular by its worse performance in the environment dimension, particularly pollution levels and CO2.
Table 14 sets out the evolution of the index during the past three years for the top 50 cities in the 2016 ranking.

IESE Business School - IESE Cities in Motion Index (ST-442-E)44
TABLE 14. EVOLUTION OF THE INDEX FOR THE TOP 50 CITIES IN THE 2016 RANKING
City 2014 2015 2016 2014-2015 2015-2016New York-USA 2 1 1 1 0London-United Kingdom 1 2 2 -1 0Paris-France 4 4 3 0 1Boston-USA 3 3 4 0 -1San Francisco-USA 5 5 5 0 0Washington-USA 7 6 6 1 0Seoul-South Korea 14 8 7 6 1Tokyo-Japan 9 12 8 -3 4Berlin-Germany 12 11 9 1 2Amsterdam-Netherlands 10 10 10 0 0Toronto-Canada 19 20 11 -1 9Chicago-USA 6 7 12 -1 -5Zurich-Switzerland 11 14 13 -3 1Melbourne-Australia 8 9 14 -1 -5Vienna-Austria 18 18 15 0 3Sydney-Australia 17 17 16 0 1Geneva-Switzerland 16 15 17 1 -2Los Angeles-USA 20 16 18 4 -2Munich-Germany 15 13 19 2 -6Baltimore, MD-USA 13 19 20 -6 -1Vancouver-Canada 24 23 21 1 2Singapore-Asia Pacific 29 28 22 1 6Dallas, TX-USA 22 24 23 -2 1Ottawa -Canada 25 25 24 0 1Stockholm-Sweden 30 27 25 3 2Oslo-Norway 21 21 26 0 -5Copenhagen-Denmark 28 22 27 6 -5Madrid-Spain 31 32 28 -1 4Helsinki-Finland 23 26 29 -3 -3Philadelphia-USA 26 30 30 -4 0Montreal-Canada 32 29 31 3 -2Houston-USA 27 31 32 -4 -1Dublin-Ireland 37 33 33 4 0Hamburg-Germany 35 37 34 -2 3Barcelona-Spain 33 34 35 -1 -1Frankfurt-Germany 36 36 36 0 0Phoenix-USA 42 42 37 0 5Milan-Italy 50 40 38 10 2Glasgow-United Kingdom 39 39 39 0 0Brussels-Belgium 41 41 40 0 1Prague-Czech Republic 40 43 41 -3 2Hong Kong, China 38 38 42 0 -4Rome-Italy 57 54 43 3 11Auckland-New Zealand 34 35 44 -1 -9Stuttgart-Germany 44 44 45 0 -1Linz-Austria 52 53 46 -1 7Basel-Switzerland 43 49 47 -6 2Miami-USA 45 46 48 -1 -2Florence-Italy 56 48 49 8 -1Lyon-France 49 47 50 2 -3

IESE Business School - IESE Cities in Motion Index (ST-442-E)45
New YorkLondonParisBostonSan FranciscoWashington SeoulTokyoBerlinAmsterdam TorontoChicago ZurichMelbourne
ViennaSydneyGenevaLos AngelesMunichBaltimore, MD VancouverSingaporeDallas, TXOttawa StockholmOslo CopenhagenMadridHelsinkiPhiladelphiaMontrealHouston DublinHamburgBarcelonaFrankfurt Phoenix MilanGlasgowBrusselsPragueHong Kong, China RomeAuckland Stuttgart LinzBaselMiami FlorenceLyon
0
10
20
30
40
50
60
0 10 20 30 40 50 60
Rank
ing
Citie
s in
Motio
n 20
16
Ranking Cities in Motion 2014
FIGURE 3
Figure 3 sets out the positions in 2014 and 2016 for the top 50 cities in the ranking. Those cities that show a po-sitive evolution are below the 45 degree angle formed by the diagonal line, while the cities whose evolution was not positive are above that line. For example, Auckland, as
mentioned previously, shows a clearly negative evolution since it was in 34th place in the ranking in 2014 and moved to 44th place in 2016. In contrast, Milan shows a positive evolution, going from position 50 to 38 in 2016.

IESE Business School - IESE Cities in Motion Index (ST-442-E)46
CITIES IN MOTION COMPARED WITH OTHER INDEXES
In this section we conduct a comparative study of the CIMI and other indexes. Table 15 shows a comparison of the CIMI index with other city indexes from various organiza-tions. While the indexes under consideration vary in ter-ms of methodology and indicators, all agree that a city is more powerful, prosperous, and competitive if it manages to develop in its various dimensions. From the economy and finance, via the ease of creating businesses, the qua-lity of life, and the use of high technology, to its cultural importance, which could be the promotion of music and fashion. It can be seen that the cities of New York and London appear in the top 10 of six of the nine indexes compared. In addition, Paris appears in the top 10 in se-ven of the nine indexes. These three cities are characte-rized by strong economic and financial power and they likewise stand out in the dimensions of human capital, international outreach, and mobility and transportation, as we have been able to verify through the CIMI.
The cities of Amsterdam, Boston, San Francisco, Seoul, Tokyo, and Washington, D.C., also appear frequently in other rankings among the 10 most prosperous cities in the world or those with the best quality of life. The only city that does not appear among the top 10 cities consi-dered by other indexes is the city of Berlin. This differen-ce is due to the fact that our index has a higher number of dimensions (and, hence, indicators) and greater geo-graphical coverage than most of the rankings considered. On the other hand, most of the cities that occupy the top positions in other rankings but are not in the top 10 of the CIMI are found in the top 25 of our index.
None of the cities that make up the top 10 of the CIMI is in the top positions of the Quality of Living Ranking (Mer-cer) or the Global Liveability Ranking (The Economist). However, four cities in the top 10 of these indexes are in the top 20 positions of the CIMI.
TABLE 15. COMPARISON WITH OTHER INDEXES. TOP 10
City ranking
CIMI 2016 (IESE)
Global Cities Index 2016 (A.T. Kearney)
City Prosperity Index 2015 (United Nations)
Global Financial Centres Index-2016 (Z/Yen)
Global City Competitiveness Index- 2014 (The Economist)
Global Metro Monitor Map-2014 (Brookings)
Global Power City Index- 2016 (MMF)
Cities Opportunities Ranking 2016
Quality of Living Index 2016 (Mercer)
Global Liveability Ranking 2016 (The Economist)
1New York
CityLondon Oslo London New York City Tokyo London London Vienna Melbourne
2 LondonNew York
CityCopenhagen
New York
CityLondon New York City New York City Singapore Zurich Vienna
3 Paris Paris Stockholm Singapore Singapore Los Angeles Tokyo Toronto Auckland Vancouver
4 Boston Tokyo Helsinki Hong Kong Hong Kong Seoul Paris Paris Munich Toronto
5San
FranciscoHong Kong Paris Tokyo Tokyo London Singapore Amsterdam Vancouver Calgary
6Washington,
D.C.Los Angeles Vienna
San
Francisco Sydney Paris Seoul New York City Dusseldorf Adelaide
7 Seoul Chicago Melbourne Boston Paris Osaka Hong Kong Stockholm Frankfurt Perth
8 Tokyo Singapore Montreal Chicago Stockholm Shanghai Amsterdam San Francisco Geneva Auckland
9 Berlin Beijing Toronto Zurich Chicago Chicago Berlin Hong Kong Copenhagen Helsinki
10 AmsterdamWashington,
D.C.Sydney
Washington,
D.C.Toronto Moscow Vienna Sydney Basel Hamburg

IESE Business School - IESE Cities in Motion Index (ST-442-E)47
CITIES IN MOTION: A DYNAMIC ANALYSIS
To assess the growth trends and potential of cities, we have created a graph that seeks to capture these as-pects. Figure 5 sets out the current position of each city in the CIMI index (horizontal axis) and the trend (vertical axis). As a measure to calculate the trend, the change in terms of number of positions in the CIMI ranking between 2014 and 2016 has been used. This assumes that the cities in the top part of the graph are those that have gai-ned position and those in the bottom part of the graph are those that have lost position. The cities in the center of the graph are those that have not experienced significant changes of location in the years analyzed. The graph area has been divided into four quadrants of cities, namely: consolidated, challenging, potential, and vulnerable.
The first group, that of consolidated cities (bottom right quadrant), includes cities that have a middle to high ove-rall position but have maintained their position throughout the period or even lost position somewhat. It is made up of cities from different geographical regions: Baltimore, Chicago, and Philadelphia from North America; London,
Zurich, and Geneva representing Europe, together with the Nordic capitals Oslo and Helsinki; Melbourne and Auckland from Oceania; and Dubai and Bangkok repre-senting Asia.
The challenger cities are the second group that can be observed in the graph (top right quadrant). It is made up of cities that have improved their positions in the index at a fast rate and are already in the middle to high area. In this quadrant we can find cities such as Milan, Toronto, and Rome.
The third group is of cities with great potential and is made up of those that, despite their current position, are in the middle to low area of the index and are evolving positively at great speed (top left quadrant). In that qua-drant, we can find cities such as Tehran, Jakarta, and Kiev, Latin American capitals such as Quito, Lima, and Santo Domingo, and Asian cities such as Ho Chi Minh City.
The last group of cities includes those that are in a vul-nerable position (bottom left quadrant). This is a group that is growing at a slower pace than the rest and is in the middle to low position of the classification. It is made up of cities such as Ankara, Pretoria, Caracas, and Riyadh.
Complementing Figure 4 is an analysis of variance of the dimensions concerning the cities. That is, the aim is to understand not only how much they have grown but also
Consolidated
Vulnerable
ChallengersPotential
New York
London
Paris
BostonSan Francisco
Washington
Seoul
Tokyo
Berlin
Amsterdam
Toronto
Chicago
Zurich
Melbourne
Vienna
Sydney
Geneva
Los Angeles
Munich
Baltimore, MD
Vancouver
Singapore
Ottawa
Stockholm
Oslo
Copenhagen
Madrid
Helsinki
Philadelphia
Montreal
Houston
DublinHamburg
BarcelonaFrankfurt am Main
Phoenix
Milan
Glasgow
Brussels
Prague
Hong Kong
Rome
Auckland
Miami
Malaga
Lisbon
Warsaw
Taipei
Rotterdam
Valencia
Abu Dhabi
Antwerp
Dubai
Budapest
Seville
Nottingham
Ljubljana
Nice
BilbaoA Coruña
Shanghai
Buenos Aires
Zagreb
Santiago
Bangkok
Mexico City
Gothenburg
Moscow
Beijing
Kuala LumpurAthens
Medellin
Montevideo
Sao Paulo
GuangzhouIstanbul
Tel Aviv
Jerusalem
Bucharest
San Jose
Bogota
Haifa
Lima
Shenzhen
Kiev
Cali
Suzhou
Quito
Doha
Cape Town
Sarajevo
Riyadh
Ho Chi Minh City
Ankara
Manila
Johannesburg
Jakarta
Durban
Mumbai
Tehran
Cairo
Pretoria
DelhiSanto Domingo
La Paz
Caracas
Nairobi
Kolkata
Lagos
Karachi
FIGURE 4

IESE Business School - IESE Cities in Motion Index (ST-442-E)48
how they have done so. To do this, the variation of the different dimensions was calculated for each of the cities that are set out in Figure 5. Cities in the bottom of the graph below have similar positions in all dimensions and therefore show a more homogeneous distribution. The cities in the top stand out in one or more dimensions but in others they are in a relatively low position. This infor-mation, combined with the position of each city, allows us to identify four categories of cities.
The first category is that of “balanced” cities (bottom right quadrant): those cities that are in the upper middle part of the table and have relatively high values in all the di-mensions. Within this category are cities such as Dublin, Montreal, Barcelona, Madrid, Sydney, Paris, Melbourne, Seoul, and Stockholm.
The second category consists of the “differentiated” cities (top right quadrant) – that is, those cities that are in high positions in the ranking and that get exceptional results in several dimensions but relatively poor ones in others. An example is New York City, which is among the top po-sitions in eight of 10 dimensions but among the worst po-
sitions in social cohesion. Another example is the city of Los Angeles, which ranks among the top positions in eco-nomy, human capital, public management, governance, technology, urban planning, and international outreach, but in the last positions for environment, social cohesion, and mobility and transportation. In this category we find cities such as Taipei, Abu Dhabi, and Houston.
The third quadrant (top left quadrant) corresponds to “unbalanced” cities – that is, cities that are in bottom positions of the table but stand out in one dimension. For example, the cities of Doha, Jakarta, and Suzhou, which in most of the dimensions are in positions beyond 100. However, they stand out in the public management dimension. In this category we also find cities such as Shenzhen, Guangzhou, and Riyadh.
In the last quadrant (bottom left quadrant) are “stag-nant” cities, which achieve poor results in (almost) all the dimensions. An example is the city of Ankara, which is below position 100 in nine of the 10 dimensions. In this category we find cities such as Kolkata, Ho Chi Minh City, and Santo Domingo.
Unbalanced
Stalled
Differentiated
Balanced
Current position
Varia
nce
New York
London
Paris
Boston
San Francisco
Washington
Seoul
Tokyo
Berlin
Amsterdam
Chicago
Zurich
Melbourne
Vienna
Sydney
Geneva
Los Angeles
Munich
Baltimore
Vancouver
Singapore
OttawaStockholm
Oslo
Copenhagen
Madrid
Helsinki
Philadelphia
Montreal
Houston
DublinHamburg
Barcelona
Frankfurt am Main
Phoenix
Milan
Glasgow
Brussels
PragueHong Kong
Rome
Auckland
Miami
Malaga
Lisbon
Warsaw
Taipei
Rotterdam
Valencia
Abu Dhabi
Antwerp
Dubai
Budapest
Seville
Nottingham
Ljubljana
Nice
Bilbao
A Coruña
Shanghai
Buenos Aires
Zagreb
Santiago
Bangkok
Mexico City
Gothenburg
Moscow
Beijing
Kuala Lumpur
Athens
Medellin
Montevideo
Sao Paulo
Guangzhou
Istanbul
Tel Aviv
Jerusalem
Bucharest
San Jose
Bogota
Rio de Janeiro
Haifa
Lima
Shenzhen
Kiev
Cali
Suzhou
Quito
Doha
Cape Town
Sarajevo
Riyadh
Ho Chi Minh City
Ankara
ManilaJohannesburg
Jakarta
Durban
Mumbai
Tehran
Cairo
PretoriaDelhi
Santo Domingo
La Paz
Caracas
Nairobi
Kolkata
Lagos
FIGURE 5

IESE Business School - IESE Cities in Motion Index (ST-442-E)49
RECOMMENDATIONS AND CONCLUSIONS
The CIMI synthetic index allows us, through an objective calculation methodology, to compile a ranking of cities taking into account various aspects. The 10 dimensions analyzed offer a broad and holistic vision of what a city represents, while allowing greater understanding of its composition and its evolution over time.
The results of the index and our experience of using it to assess different cities allow us to make the following re-commendations and reach some significant conclusions:
• Cities need to define their identity and establish a strategic plan. One of the most important (and most di-fficult) questions a city has to ask itself is: What kind of city do you want in the future? The answer to this ques-tion will not only define the identity of the city but also set out the path of transformation that it must travel to achieve that identity. That is, it must consider what its strategic plan will be. A sound strategic plan will prevent changes that veer away from the city’s iden-tity as circumstances or governments change. Strate-gic plans must be unique and individual for each city. This means that cities must escape the one-size-fits-all approach. The CIMI makes clear that there is no single model of success. The cities that top the ranking are not identical but prioritize various dimensions. (See the graphical analysis appendix.) There are various ways through which a city can succeed in getting to the top of the index.
• The first step is a good diagnosis. One of the first ac-tivities in any strategic definition is to understand the place in which we find ourselves. In this regard, the CIMI can be used as a diagnostic tool to carry out a first assessment of the current status of the city in the 10 dimensions of our model. The CIMI allows a quick snapshot to be taken of the cities, identifying their strengths and pointing out places where there is room for improvement.
• The benchmark as the beginning of change. The abi-lity to compare 180 cities in 10 different dimensions allows us to identify those that perform best in the di-fferent areas of the city. In this sense, cities that find themselves lagging behind or stagnant in one or more dimensions can study the best cities in each category to identify the best practices that allow them to perform better. This comparison will allow cities to start moving in the right direction. That said, it must be borne in mind that, while the challenges facing cities are glo-
bal, their effects are local. Therefore, the benchmark should serve as a source of inspiration rather than as a road map for action.
• Need for an overview. The CIMI makes clear that it is not enough to be good in only one dimension. There are cities that are at the top of the ranking in some dimensions. This is the case of Riyadh, Haifa, Istanbul, and Porto, which do relatively well in the dimensions of public management, the environment, internatio-nal outreach, and social cohesion, respectively, but in the general ranking are located in positions 138, 115, 104, and 98. These are the cities that we have called “unbalanced” in the analysis of variance. The recom-mendation for these cities is that, if they seek to play in the big leagues, they should be capable of reaching acceptable minimums in the dimensions as a whole. This message must also reach those cities that unders-tand technology as the main (or only) ingredient of a smart city and do not take into account other critical dimensions that define the urban situation. If they do not see the whole picture, it will be difficult for them to become smart.
• The CIMI is not a “beauty contest.” It has surprised us how many cities included in the index are more concerned about their position in the ranking than the analysis that can be derived from it. Our perspective is that the value of the CIMI lies not only in its ability to identify strengths and weaknesses but also in its tem-poral component, which enables identification of the direction in which each city is moving. In this regard, our recommendation to urban managers is that they pay more attention to the trend (dynamic analysis) than to the position.
• Collaboration as the cornerstone of success. Our experience tells us that the cities that do best in the ranking understand fully that the challenges facing ci-ties are too big to be tackled individually. Collaboration is needed between different social partners, whether these be public, private, educational institutions, or nonprofit organizations. This collaboration can take on various formats (from PPP to collaborative eco-nomy structures) but they are essential for achieving long-term success. The notion of collaboration and cooperation should be extended within city councils themselves, where there are often “silos” that prevent people from seeing the relationships and the possible synergies that can occur among the 10 dimensions of our conceptual model. In addition, collaboration must be fluid between residents and the administration be-cause otherwise any solutions that might be adopted will not be efficient when it comes to responding to the real needs of the community.

IESE Business School - IESE Cities in Motion Index (ST-442-E)50
• There are many good cities but the perfect city does not exist. It is very difficult for a city to maximize all the dimensions. Even those cities in the top positions of the rankings have weak points. For example, cities such as London and New York have a long way to go in the so-cial cohesion dimension. These cities have been clas-sified as “differentiated” cities and we recommend that they make the most of the advantages they have in the dimensions where they are leaders in order to progress in the positions where they are lagging behind. For example, a city can make the most of its technological leadership to improve its environmental dimension. In addition, for the cities that we have classified as “ba-lanced” (e.g., Melbourne, Munich, Sydney, and Van-couver), the main recommendation is that they should not rest on their laurels. Despite their more harmonious growth, they still have room for improvement.
• Change is slow for most cities. While our temporal analysis of the CIMI indicates that there are cities capa-ble of making great progress in a relatively short time and of moving to higher positions quickly (Moscow, Warsaw, Rome, and Toronto), in general it shows us that, for most of the cities, a city’s position in the ran-king does not change significantly from one year to the next. This is due, to a large extent, to the time that pro-jects of any magnitude need to crystallize. Therefore, when seeking to generate changes needed to become smart and sustainable, cities should adopt long-term policies as soon as possible, especially those cities that are the worst placed and that we have called “stag-nant” in our analysis. There are many cities that still have problems when it comes to dealing with the major challenges of cities, including: the lack of collaboration between public and private bodies, civic institutions, and the public; the impossibility of promoting new bu-siness models that provide financing for new busines-ses; and a shortsighted vision of smart cities.
The urbanization process is one of the most significant challenges of the 21st century. As the world population moves toward cities, existing problems grow and new ones are generated that, in addition, are influenced pro-foundly by the globalization process. This trend means a closer relationship between global dynamics and cities, generating local impacts: effects on the economy, demo-graphics, social divisions, or environmental impacts.
Despite these challenges, cities and their leaders should understand the positive aspect that cities have. From our perspective, the city offers a much more delimited sphe-re of action, which enables work to be done more directly for people’s benefit. However, urban managers must take a step back and analyze their problems, try to discover what other cities do, and learn what good practices are
being carried out elsewhere in the world. The day-to-day management of a city makes it difficult for cities to ask themselves how to promote the positive effects of the ur-banization process and how to reduce the negative ex-ternalities. That is why, from the IESE Cities in Motion platform, we aim to create awareness and generate in-novative tools to achieve smarter governments. With this index, we hope to have contributed to this goal.

IESE Business School - IESE Cities in Motion Index (ST-442-E)51
NO. INDICATOR DESCRIPTION / UNIT OF MEASUREMENTDIMENSION /
CLUSTERSOURCE
1 Higher educationProportion of population with secondary and higher education.
Human capital Euromonitor
2 Business schools Number of business schools (top 100). Human capitalThe Financial Times
3 Movement of studentsInternational movement of higher-level students. Number of students.
Human capital UNESCO
4 Number of universities Number of universities. Human capital QS Top Universities
5 Museums Number of museums per city. Human capital 2thinknow
6 Art galleries Number of art galleries per city. Human capital 2thinknow
7Expenditure on leisure and recreation
Expenditure on leisure and recreation. Expressed in millions of U.S. dollars at 2014 prices.
Human capital / country cluster
Euromonitor
8 Ratio of deaths Ratio of death per 100,000 inhabitants. Social cohesion Euromonitor
9 Crime rate Crime rate. Social cohesion Numbeo
10 Health index Health index. Social cohesion Numbeo
11 Unemployment rateUnemployment rate (number of unemployed / labor force).
Social cohesion Euromonitor
12 Gini indexThe Gini index varies from 0 to 100, with 0 being a situation of perfect equality and 100 that of perfect inequality.
Social cohesion Euromonitor
13 Price of property Price of property as percentage of income. Social cohesion Numbeo
14 Ratio of female workersRatio of female workers in the public administration.
Social cohesionInternational Labour Organization
15 Peace index
The Global Peace Index is an indicator that measures the peacefulness and the absence of violence in a country or region. The bottom-ranking positions correspond to countries with a high level of violence.
Social cohesion
Centre for Peace and Conflict Studies at the University of Sydney
16 ProductivityLabor productivity calculated as GDP/working population (in thousands).
Economy Euromonitor
17 Time required to start a businessNumber of calendar days needed so a business can operate legally.
Economy World Bank
18 Ease of starting a business
Ease of starting a business. Top positions in the ranking indicate a more favorable regulatory environment for creating and operating a local company.
Economy World Bank
19 Number of headquartersNumber of headquarters of publicly traded companies.
EconomyGlobalization and World Cities (GaWC)
20Percentage of people at early business stage
Percentage of 18 to 64-year-old population who are new entrepreneurs or owners/managers of a new business (no more than 42 months).
EconomyGlobal Entrepreneurship Monitor
APPENDIX 1: INDICATORS

IESE Business School - IESE Cities in Motion Index (ST-442-E)52
NO. INDICATOR DESCRIPTION / UNIT OF MEASUREMENTDIMENSION /
CLUSTERSOURCE
21 Entrepreneurs
Companies in an initial phase that represent a city’s economic bases. They represent economic dynamism and include a high proportion of companies devoted to technology. Used per capita.
Economy 2thinknow
22 GDP Gross domestic product in millions of U.S. dollars at 2014 prices.
Economy Euromonitor
23 Total tax rate
This measures the total amount of taxes and compulsory contributions paid by businesses after accounting for deductions and exemptions allowed as part of commercial profits.
Public management
World Bank
24 Reserves Total reserves in millions of current U.S. dollars.Public management
World Bank
25 Reserves per capitaReserves per capita in millions of current U.S. dollars.
Public management
World Bank
26 Embassies Number of embassies per city.Public management
2thinknow
27 Twitter
Twitter users in prominent user directories (e.g., Twellow). This includes users who define themselves as leaders (writers, activists, business leaders, journalists, etc.). In thousands of people.
Public management
2thinknow
28 Sales taxSales tax. This has a big impact on the economy. Lower rates of sales tax can be used to finance investment in services and intelligent infrastructure.
Public management
2thinknow
29 Strength of legal rights index
The strength of legal rights index measures the degree to which collateral and bankruptcy laws protect the rights of borrowers and lenders and thus facilitate access to loans. The values run from 0 to 12, where the highest ratings indicate that the laws are better designed to expand access to credit.
Governance World Bank
30 Corruption perceptions indexCorruption perceptions index. The values go from 0 (very corrupt) to 100 (very transparent).
GovernanceTransparency International
31Functions of the innovation department
Number of functions of the city’s innovation department (or ministry if there is one).
Governance 2thinknow
32 Range of government Web services
Range of online services for all city council users (residents or visitors). This is a measure of modern and technological municipal government. Scale from 0 to 5.
Governance 2thinknow
33 Open data platformThis describes whether the city has an open data system.
GovernanceCTIC Foundation and Open World Map
34 CO2 emissions Carbon dioxide emissions from the burning of fossil fuels and the manufacture of cement. Measured in kilotons (kt).
Environment World Bank
35 CO2 emission index CO2 emission index. Environment Numbeo

IESE Business School - IESE Cities in Motion Index (ST-442-E)53
NO. INDICATOR DESCRIPTION / UNIT OF MEASUREMENTDIMENSION /
CLUSTERSOURCE
36 Methane emissionsMethane emissions that arise from human activities such as agriculture and the industrial production of methane. Measured in kt of CO2 equivalent.
Environment World Bank
37Percentage of the population with
access to the water supply
Percentage of the population with reasonable access to an appropriate quantity of water resulting from an improvement in the water supply.
Environment World Bank
38 PM2.5PM2.5 measures the amount of particles in the air whose diameter is less than 2.5 μm. Annual mean.
EnvironmentWorld Health Organization
39 PM10 PM10 measures the amount of particles in the air whose diameter is less than 10 μm. Annual mean.
EnvironmentWorld Health Organization
40 Pollution index Pollution index. Environment Numbeo
41 Environmental performance indexEnvironmental Performance Index (from 1 = poor to 100 = good).
Environment Yale University
42 Traffic index
The traffic index is estimated by considering the time spent in traffic and the dissatisfaction this generates. It also includes estimates of CO2 consumption and the other inefficiencies of the traffic system.
Mobility and transportation
Numbeo
43 Inefficiency index
The inefficiency index is an estimate of the inefficiencies in traffic. High values represent high rates of inefficiency in driving, such as long journey times.
Mobility and transportation
Numbeo
44 Number of road accidentsNumber of road accidents per 100,000 inhabitants.
Mobility and transportation
Euromonitor
45 Metro Number of metro stations per city.Mobility and transportation
2thinknow
46 Flights Number of arrival and departure flights (air routes) in a city.
Mobility and transportation
2thinknow
47 Means of transportation
The means of transportation represents the public transportation options for smart cities. The value of the variable increases if there are more transportation options. The lack of transportation options can reduce the attractiveness of a city as a smart destination.
Mobility and transportation
2thinknow
48Index of traffic for commuting to
work
Index of traffic considering the journey time to work.
Mobility and transportation
Numbeo
49 Bike sharing
The bicycle-sharing system shows the automated services for the public use of shared bicycles that provide transport from one location to another within a city. The indicator varies between 0 and 2 according to how developed the system is.
Mobility and transportation
Bike-Sharing World Map

IESE Business School - IESE Cities in Motion Index (ST-442-E)54
NO. INDICATOR DESCRIPTION / UNIT OF MEASUREMENTDIMENSION /
CLUSTERSOURCE
50Percentage of the population with
access to sanitation facilities
Percentage of the population with at least sufficient access to facilities for the disposal of excreta that can efficiently avoid the contact of humans, animals and insects with excreta.
Urban planning World Bank
51 Number of people per household Number of people per household. Urban planning Euromonitor
52 Bicycle shops Number of bicycle shops per capita. Urban planning 2thinknow
53 Architects Number of architecture firms per capita. Urban planning 2thinknow
54 Cycling
Cycling enthusiasts per capita. Bicycle use represents both a sustainable measure of transportation and a metric for a city’s exercise and cultural aptitude. Many cities that historically are smart cities have a certain correlation with the presence of a significant cycling culture (weather permitting).
Urban planning 2thinknow
55 Number of international touristsNumber of international tourists who visit the city. In thousands of people.
International outreach
Euromonitor
56 Number of passengers of an airlineNumber of passengers who travel with airlines. In thousands of people.
International outreach
Euromonitor
57 Hotels Number of hotels per capita.International outreach
2thinknow
58 Sightsmap
Ranking of cities according to the number of photos taken in the city and uploaded to Panoramio (community for sharing photographs online). The top positions correspond to the cities with the most photographs.
International outreach
Sightsmap
59Number of conferences and
meetings
Number of international conferences and meetings in a city.
International outreach
International Congress and Convention Association
60 Number of broadband subscribersNumber of broadband subscribers per country with a digital subscriber line, cable modem or other high-speed technology, per 100 inhabitants.
Technology World Bank
61 Broadband Number of broadband users within a city, including wireless and fixed connections.
Technology 2thinknow
62 IP addresses Number of IP addresses per capita. Technology 2thinknow
63 Facebook Number of Facebook users per capita. Technology 2thinknow
64 Mobile phones Number of mobile phones per capita. Technology 2thinknow
65 Quality of Web services
The quality of the city council’s website measures the commitment of its information technology policy, support for the development of local businesses and other technology initiatives. Scale from 0 to 5, the maximum corresponding to the website with the best-quality services.
Technology 2thinknow
66 Innovation indexInnovation index (Innovation Cities Index). Valuation of 0 (no innovation) to 60 (a lot of innovation).
TechnologyInnovation Cities Program

IESE Business School - IESE Cities in Motion Index (ST-442-E)55
NO. INDICATOR DESCRIPTION / UNIT OF MEASUREMENTDIMENSION /
CLUSTERSOURCE
67 SmartphonesNumber of smartphones per capita. The use of smartphones and their penetration are a good indicator for the use of technologies.
Technology 2thinknow
68 Wi-Fi hot spotNumber of wireless access points globally. These represent the options to connect to the Internet of people on business trips.
Technology 2thinknow
69 Disposable incomeDisposable income (annual average). Decile 1. Expressed in U.S. dollars.
City cluster Euromonitor
70 Disposable incomeDisposable income (annual average). Decile 2. Expressed in U.S. dollars.
City cluster Euromonitor
71 Disposable incomeDisposable income (annual average). Decile 5. Expressed in U.S. dollars.
City cluster Euromonitor
72 Disposable incomeDisposable income (annual average). Decile 7. Expressed in U.S. dollars.
City cluster Euromonitor
73 Disposable incomeDisposable income (annual average). Decile 9. Expressed in U.S. dollars.
City cluster Euromonitor
74 Population Number of inhabitants.City/country cluster
Euromonitor
75 Percentage of population employed Percentage of population employed. Country cluster Euromonitor
76Expenditure on education per inhabitant
Expenditure on education per inhabitant. Expressed in millions of U.S. dollars at 2014 prices.
Country cluster Euromonitor
77Expenditure on medical and health services per inhabitant
Expenditure on medical and health services per inhabitant. Expressed in millions of U.S. dollars at 2014 prices.
Country cluster Euromonitor
78Expenditure on hospitality and catering services per inhabitant
Expenditure on hospitality and catering services per inhabitant. Expressed in millions of U.S. dollars at 2014 prices.
Country cluster Euromonitor
79Expenditure on housing per inhabitant
Expenditure on housing per inhabitant. Expressed in millions of U.S. dollars at 2014 prices.
Country cluster Euromonitor
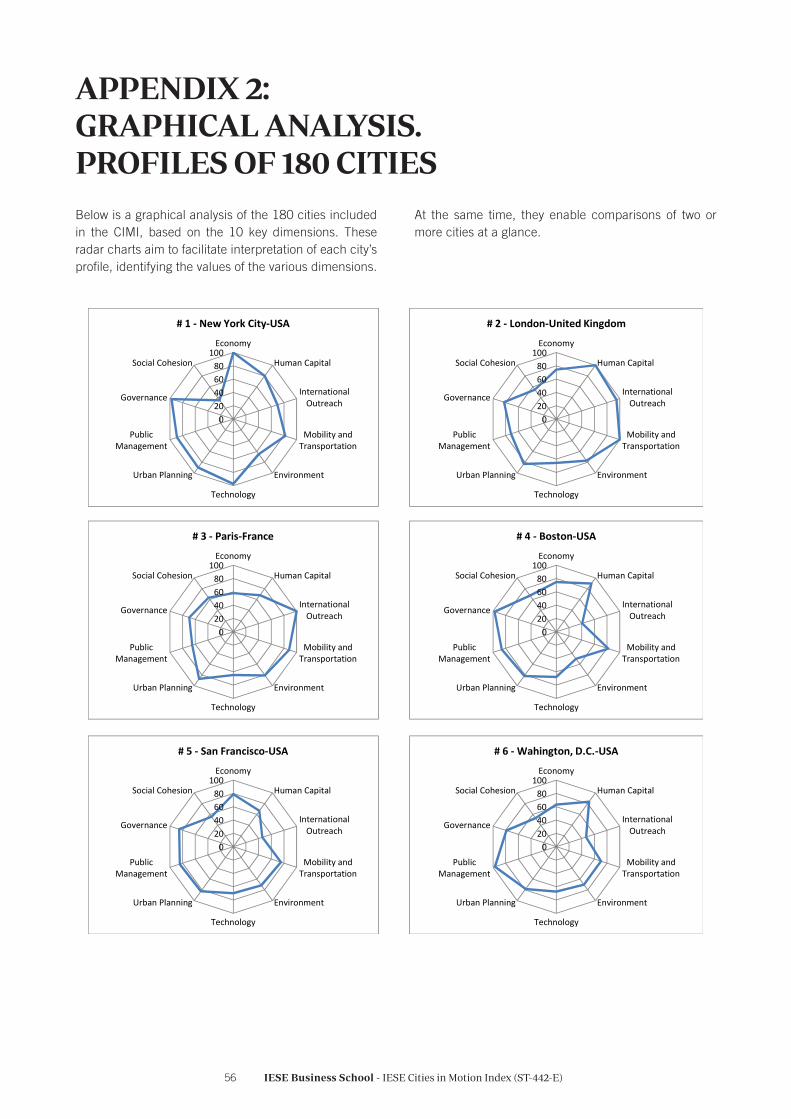
IESE Business School - IESE Cities in Motion Index (ST-442-E)56
Below is a graphical analysis of the 180 cities included in the CIMI, based on the 10 key dimensions. These radar charts aim to facilitate interpretation of each city’s profile, identifying the values of the various dimensions.
APPENDIX 2: GRAPHICAL ANALYSIS. PROFILES OF 180 CITIES
At the same time, they enable comparisons of two or more cities at a glance.
020406080
100Economy
Human Capital
InternationalOutreach
Mobility andTransportation
Environment
Technology
Urban Planning
PublicManagement
Governance
Social Cohesion
# 1 ‐ New York City‐USA
020406080
100Economy
Human Capital
InternationalOutreach
Mobility andTransportation
Environment
Technology
Urban Planning
PublicManagement
Governance
Social Cohesion
# 2 ‐ London‐United Kingdom
020406080
100Economy
Human Capital
InternationalOutreach
Mobility andTransportation
Environment
Technology
Urban Planning
PublicManagement
Governance
Social Cohesion
# 3 ‐ Paris‐France
020406080
100Economy
Human Capital
InternationalOutreach
Mobility andTransportation
Environment
Technology
Urban Planning
PublicManagement
Governance
Social Cohesion
# 4 ‐ Boston‐USA
020406080
100Economy
Human Capital
InternationalOutreach
Mobility andTransportation
Environment
Technology
Urban Planning
PublicManagement
Governance
Social Cohesion
# 5 ‐ San Francisco‐USA
020406080
100Economy
Human Capital
InternationalOutreach
Mobility andTransportation
Environment
Technology
Urban Planning
PublicManagement
Governance
Social Cohesion
# 6 ‐Wahington, D.C.‐USA
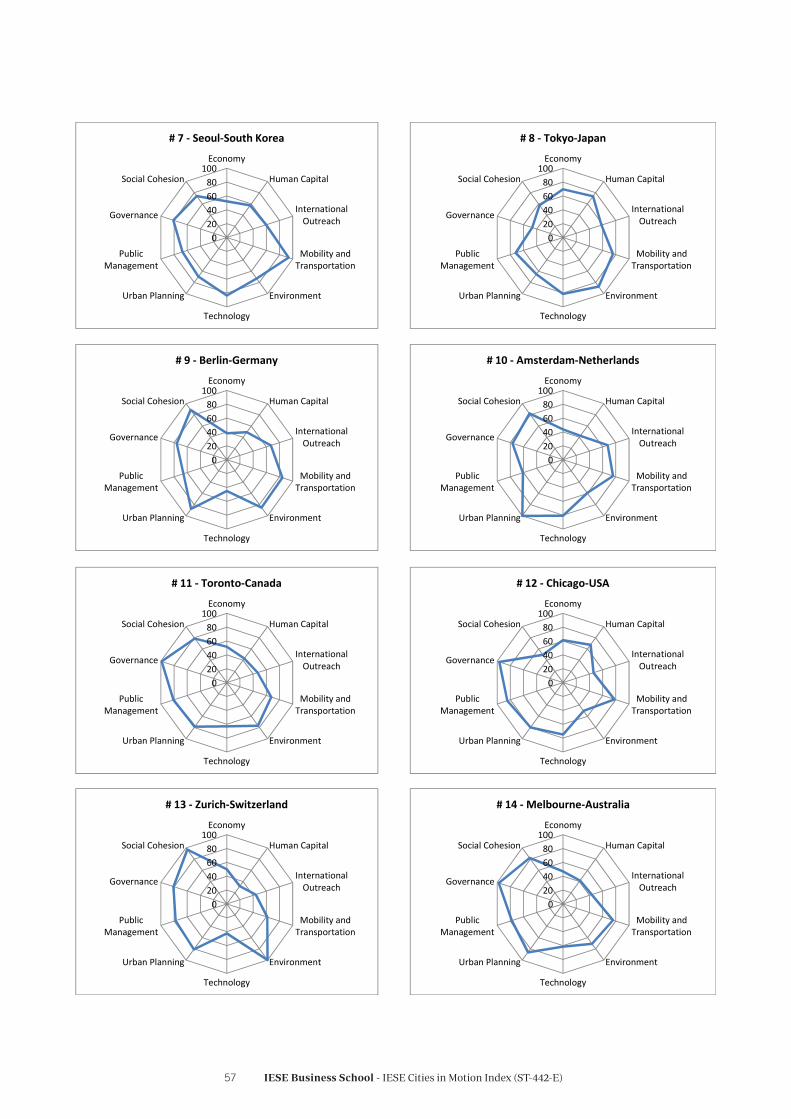
IESE Business School - IESE Cities in Motion Index (ST-442-E)57
020406080
100Economy
Human Capital
InternationalOutreach
Mobility andTransportation
Environment
Technology
Urban Planning
PublicManagement
Governance
Social Cohesion
# 7 ‐ Seoul‐South Korea
020406080
100Economy
Human Capital
InternationalOutreach
Mobility andTransportation
Environment
Technology
Urban Planning
PublicManagement
Governance
Social Cohesion
# 8 ‐ Tokyo‐Japan
020406080
100Economy
Human Capital
InternationalOutreach
Mobility andTransportation
Environment
Technology
Urban Planning
PublicManagement
Governance
Social Cohesion
# 9 ‐ Berlin‐Germany
020406080
100Economy
Human Capital
InternationalOutreach
Mobility andTransportation
Environment
Technology
Urban Planning
PublicManagement
Governance
Social Cohesion
# 10 ‐ Amsterdam‐Netherlands
020406080
100Economy
Human Capital
InternationalOutreach
Mobility andTransportation
Environment
Technology
Urban Planning
PublicManagement
Governance
Social Cohesion
# 11 ‐ Toronto‐Canada
020406080
100Economy
Human Capital
InternationalOutreach
Mobility andTransportation
Environment
Technology
Urban Planning
PublicManagement
Governance
Social Cohesion
# 12 ‐ Chicago‐USA
020406080
100Economy
Human Capital
InternationalOutreach
Mobility andTransportation
Environment
Technology
Urban Planning
PublicManagement
Governance
Social Cohesion
# 13 ‐ Zurich‐Switzerland
020406080
100Economy
Human Capital
InternationalOutreach
Mobility andTransportation
Environment
Technology
Urban Planning
PublicManagement
Governance
Social Cohesion
# 14 ‐Melbourne‐Australia

IESE Business School - IESE Cities in Motion Index (ST-442-E)58
020406080
100Economy
Human Capital
InternationalOutreach
Mobility andTransportation
Environment
Technology
Urban Planning
PublicManagement
Governance
Social Cohesion
# 15 ‐ Vienna‐Austria
020406080
100Economy
Human Capital
InternationalOutreach
Mobility andTransportation
Environment
Technology
Urban Planning
PublicManagement
Governance
Social Cohesion
# 16 ‐ Sydney‐Australia
020406080
100Economy
Human Capital
InternationalOutreach
Mobility andTransportation
Environment
Technology
Urban Planning
PublicManagement
Governance
Social Cohesion
# 17 ‐ Geneva‐Switzerland
020406080
100Economy
Human Capital
InternationalOutreach
Mobility andTransportation
Environment
Technology
Urban Planning
PublicManagement
Governance
Social Cohesion
# 18 ‐ Los Angeles‐USA
020406080
100Economy
Human Capital
InternationalOutreach
Mobility andTransportation
Environment
Technology
Urban Planning
PublicManagement
Governance
Social Cohesion
# 19 ‐Munich‐Germany
020406080
100Economy
Human Capital
InternationalOutreach
Mobility andTransportation
Environment
Technology
Urban Planning
PublicManagement
Governance
Social Cohesion
# 20 ‐ Baltimore, MD‐USA
020406080
100Economy
Human Capital
InternationalOutreach
Mobility andTransportation
Environment
Technology
Urban Planning
PublicManagement
Governance
Social Cohesion
# 21 ‐ Vancouver‐Canada
020406080
100Economy
Human Capital
InternationalOutreach
Mobility andTransportation
Environment
Technology
Urban Planning
PublicManagement
Governance
Social Cohesion
# 22 ‐ Singapore‐Asia Pacific

IESE Business School - IESE Cities in Motion Index (ST-442-E)59
020406080
100Economy
Human Capital
InternationalOutreach
Mobility andTransportation
Environment
Technology
Urban Planning
PublicManagement
Governance
Social Cohesion
# 23 ‐ Dallas, TX‐USA
020406080
100Economy
Human Capital
InternationalOutreach
Mobility andTransportation
Environment
Technology
Urban Planning
PublicManagement
Governance
Social Cohesion
# 24 ‐ Ottawa ‐Canada
020406080
100Economy
Human Capital
InternationalOutreach
Mobility andTransportation
Environment
Technology
Urban Planning
PublicManagement
Governance
Social Cohesion
# 25 ‐ Stockholm‐Sweden
020406080
100Economy
Human Capital
InternationalOutreach
Mobility andTransportation
Environment
Technology
Urban Planning
PublicManagement
Governance
Social Cohesion
# 26 ‐ Oslo‐Norway
020406080
100Economy
Human Capital
InternationalOutreach
Mobility andTransportation
Environment
Technology
Urban Planning
PublicManagement
Governance
Social Cohesion
# 27 ‐ Copenhagen‐Denmark
020406080
100Economy
Human Capital
InternationalOutreach
Mobility andTransportation
Environment
Technology
Urban Planning
PublicManagement
Governance
Social Cohesion
# 28 ‐Madrid‐Spain
020406080
100Economy
Human Capital
InternationalOutreach
Mobility andTransportation
Environment
Technology
Urban Planning
PublicManagement
Governance
Social Cohesion
# 29 ‐ Helsinki‐Finland
020406080
100Economy
Human Capital
InternationalOutreach
Mobility andTransportation
Environment
Technology
Urban Planning
PublicManagement
Governance
Social Cohesion
# 30 ‐ Philadelphia‐USA

IESE Business School - IESE Cities in Motion Index (ST-442-E)60
020406080
100Economy
Human Capital
InternationalOutreach
Mobility andTransportation
Environment
Technology
Urban Planning
PublicManagement
Governance
Social Cohesion
# 31 ‐Montreal‐Canada
020406080
100Economy
Human Capital
InternationalOutreach
Mobility andTransportation
Environment
Technology
Urban Planning
PublicManagement
Governance
Social Cohesion
# 32 ‐ Houston‐USA
020406080
100Economy
Human Capital
InternationalOutreach
Mobility andTransportation
Environment
Technology
Urban Planning
PublicManagement
Governance
Social Cohesion
# 33 ‐ Dublin‐Ireland
020406080
100Economy
Human Capital
InternationalOutreach
Mobility andTransportation
Environment
Technology
Urban Planning
PublicManagement
Governance
Social Cohesion
# 34 ‐ Hamburg‐Germany
020406080
100Economy
Human Capital
InternationalOutreach
Mobility andTransportation
Environment
Technology
Urban Planning
PublicManagement
Governance
Social Cohesion
# 35 ‐ Barcelona‐Spain
020406080
100Economy
Human Capital
InternationalOutreach
Mobility andTransportation
Environment
Technology
Urban Planning
PublicManagement
Governance
Social Cohesion
# 36 ‐ Frankfurt‐Germany
020406080
100Economy
Human Capital
InternationalOutreach
Mobility andTransportation
Environment
Technology
Urban Planning
PublicManagement
Governance
Social Cohesion
# 37 ‐ Phoenix‐USA
020406080
100Economy
Human Capital
InternationalOutreach
Mobility andTransportation
Environment
Technology
Urban Planning
PublicManagement
Governance
Social Cohesion
# 38 ‐Milan‐Italy

IESE Business School - IESE Cities in Motion Index (ST-442-E)61
020406080
100Economy
Human Capital
InternationalOutreach
Mobility andTransportation
Environment
Technology
Urban Planning
PublicManagement
Governance
Social Cohesion
# 39 ‐ Glasgow‐United Kingdom
020406080
100Economy
Human Capital
InternationalOutreach
Mobility andTransportation
Environment
Technology
Urban Planning
PublicManagement
Governance
Social Cohesion
# 40 ‐ Brussels‐Belgium
020406080
100Economy
Human Capital
InternationalOutreach
Mobility andTransportation
Environment
Technology
Urban Planning
PublicManagement
Governance
Social Cohesion
# 41 ‐ Prague‐Czech Republic
020406080
100Economy
Human Capital
InternationalOutreach
Mobility andTransportation
Environment
Technology
Urban Planning
PublicManagement
Governance
Social Cohesion
# 42 ‐ Hong Kong, China
020406080
100Economy
Human Capital
InternationalOutreach
Mobility andTransportation
Environment
Technology
Urban Planning
PublicManagement
Governance
Social Cohesion
# 43 ‐ Rome‐Italy
020406080
100Economy
Human Capital
InternationalOutreach
Mobility andTransportation
Environment
Technology
Urban Planning
PublicManagement
Governance
Social Cohesion
# 44 ‐ Auckland‐New Zealand
020406080
100Economy
Human Capital
InternationalOutreach
Mobility andTransportation
Environment
Technology
Urban Planning
PublicManagement
Governance
Social Cohesion
# 45 ‐ Stuttgart‐Germany
020406080
100Economy
Human Capital
InternationalOutreach
Mobility andTransportation
Environment
Technology
Urban Planning
PublicManagement
Governance
Social Cohesion
# 46 ‐ Linz‐Austria
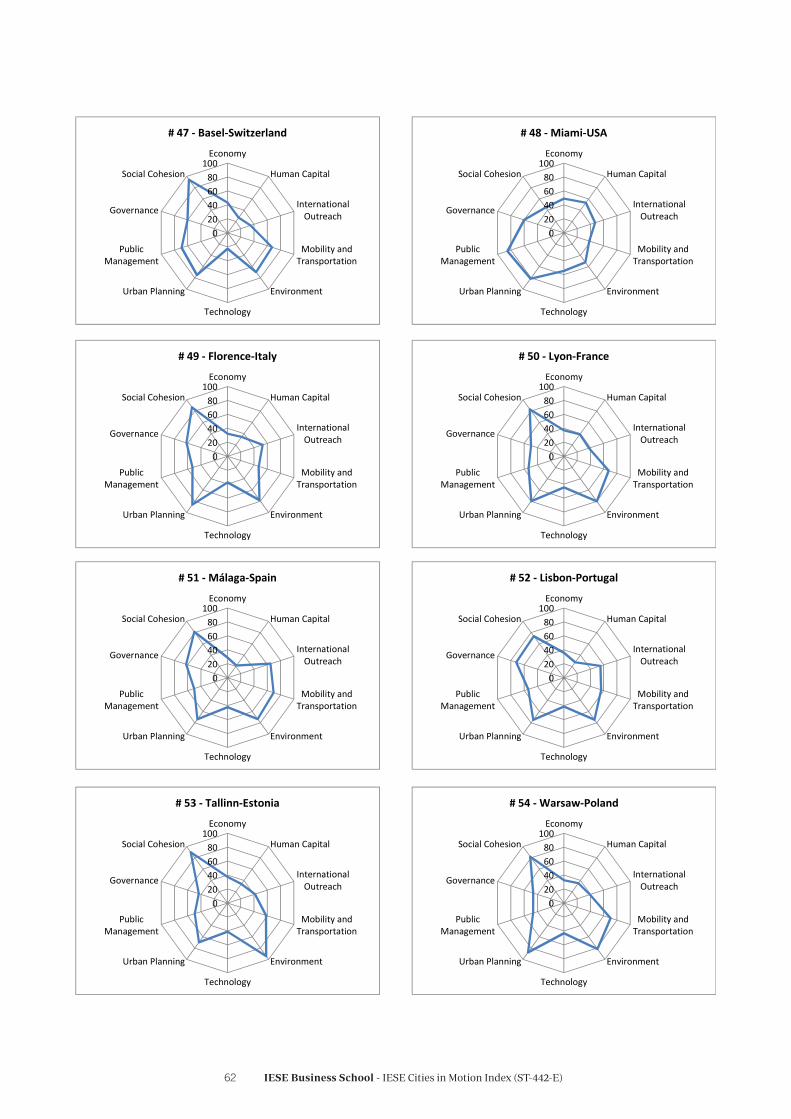
IESE Business School - IESE Cities in Motion Index (ST-442-E)62
020406080
100Economy
Human Capital
InternationalOutreach
Mobility andTransportation
Environment
Technology
Urban Planning
PublicManagement
Governance
Social Cohesion
# 47 ‐ Basel‐Switzerland
020406080
100Economy
Human Capital
InternationalOutreach
Mobility andTransportation
Environment
Technology
Urban Planning
PublicManagement
Governance
Social Cohesion
# 48 ‐Miami‐USA
020406080
100Economy
Human Capital
InternationalOutreach
Mobility andTransportation
Environment
Technology
Urban Planning
PublicManagement
Governance
Social Cohesion
# 49 ‐ Florence‐Italy
020406080
100Economy
Human Capital
InternationalOutreach
Mobility andTransportation
Environment
Technology
Urban Planning
PublicManagement
Governance
Social Cohesion
# 50 ‐ Lyon‐France
020406080
100Economy
Human Capital
InternationalOutreach
Mobility andTransportation
Environment
Technology
Urban Planning
PublicManagement
Governance
Social Cohesion
# 51 ‐Málaga‐Spain
020406080
100Economy
Human Capital
InternationalOutreach
Mobility andTransportation
Environment
Technology
Urban Planning
PublicManagement
Governance
Social Cohesion
# 52 ‐ Lisbon‐Portugal
020406080
100Economy
Human Capital
InternationalOutreach
Mobility andTransportation
Environment
Technology
Urban Planning
PublicManagement
Governance
Social Cohesion
# 53 ‐ Tallinn‐Estonia
020406080
100Economy
Human Capital
InternationalOutreach
Mobility andTransportation
Environment
Technology
Urban Planning
PublicManagement
Governance
Social Cohesion
# 54 ‐Warsaw‐Poland
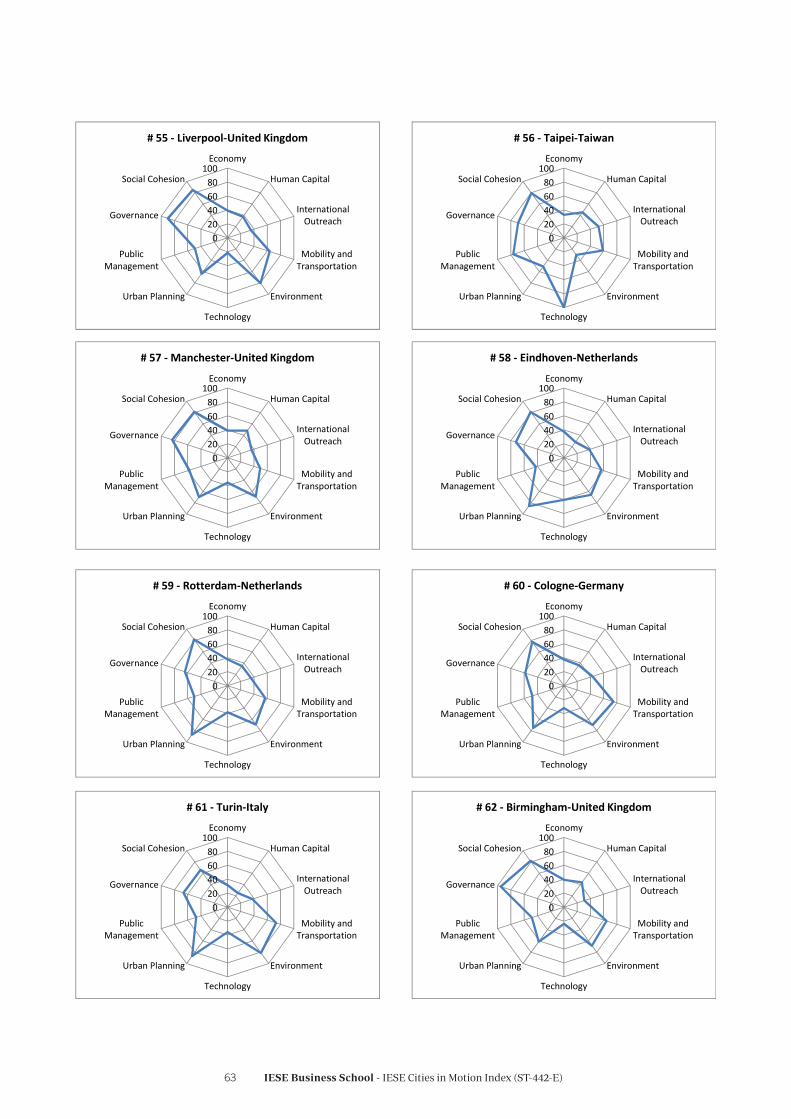
IESE Business School - IESE Cities in Motion Index (ST-442-E)63
020406080
100Economy
Human Capital
InternationalOutreach
Mobility andTransportation
Environment
Technology
Urban Planning
PublicManagement
Governance
Social Cohesion
# 55 ‐ Liverpool‐United Kingdom
020406080
100Economy
Human Capital
InternationalOutreach
Mobility andTransportation
Environment
Technology
Urban Planning
PublicManagement
Governance
Social Cohesion
# 56 ‐ Taipei‐Taiwan
020406080
100Economy
Human Capital
InternationalOutreach
Mobility andTransportation
Environment
Technology
Urban Planning
PublicManagement
Governance
Social Cohesion
# 57 ‐Manchester‐United Kingdom
020406080
100Economy
Human Capital
InternationalOutreach
Mobility andTransportation
Environment
Technology
Urban Planning
PublicManagement
Governance
Social Cohesion
# 58 ‐ Eindhoven‐Netherlands
020406080
100Economy
Human Capital
InternationalOutreach
Mobility andTransportation
Environment
Technology
Urban Planning
PublicManagement
Governance
Social Cohesion
# 59 ‐ Rotterdam‐Netherlands
020406080
100Economy
Human Capital
InternationalOutreach
Mobility andTransportation
Environment
Technology
Urban Planning
PublicManagement
Governance
Social Cohesion
# 60 ‐ Cologne‐Germany
020406080
100Economy
Human Capital
InternationalOutreach
Mobility andTransportation
Environment
Technology
Urban Planning
PublicManagement
Governance
Social Cohesion
# 61 ‐ Turin‐Italy
020406080
100Economy
Human Capital
InternationalOutreach
Mobility andTransportation
Environment
Technology
Urban Planning
PublicManagement
Governance
Social Cohesion
# 62 ‐ Birmingham‐United Kingdom

IESE Business School - IESE Cities in Motion Index (ST-442-E)64
020406080
100Economy
Human Capital
InternationalOutreach
Mobility andTransportation
Environment
Technology
Urban Planning
PublicManagement
Governance
Social Cohesion
# 63 ‐ Valencia‐Spain
020406080
100Economy
Human Capital
InternationalOutreach
Mobility andTransportation
Environment
Technology
Urban Planning
PublicManagement
Governance
Social Cohesion
# 64 ‐ Abu Dhabi‐United Arab Emirates
020406080
100Economy
Human Capital
InternationalOutreach
Mobility andTransportation
Environment
Technology
Urban Planning
PublicManagement
Governance
Social Cohesion
# 65 ‐ Antwerp‐Belgium
020406080
100Economy
Human Capital
InternationalOutreach
Mobility andTransportation
Environment
Technology
Urban Planning
PublicManagement
Governance
Social Cohesion
# 66 ‐ Dubai‐United Arab Emirates
020406080
100Economy
Human Capital
InternationalOutreach
Mobility andTransportation
Environment
Technology
Urban Planning
PublicManagement
Governance
Social Cohesion
# 67 ‐ Budapest‐Hungary
020406080
100Economy
Human Capital
InternationalOutreach
Mobility andTransportation
Environment
Technology
Urban Planning
PublicManagement
Governance
Social Cohesion
# 68 ‐ Seville‐Spain
020406080
100Economy
Human Capital
InternationalOutreach
Mobility andTransportation
Environment
Technology
Urban Planning
PublicManagement
Governance
Social Cohesion
# 69 ‐ Nottingham‐United Kingdom
020406080
100Economy
Human Capital
InternationalOutreach
Mobility andTransportation
Environment
Technology
Urban Planning
PublicManagement
Governance
Social Cohesion
# 70 ‐ Ljubljana‐Slovenia

IESE Business School - IESE Cities in Motion Index (ST-442-E)65
020406080
100Economy
Human Capital
InternationalOutreach
Mobility andTransportation
Environment
Technology
Urban Planning
PublicManagement
Governance
Social Cohesion
# 71 ‐ Vilnius‐Lithuania
020406080
100Economy
Human Capital
InternationalOutreach
Mobility andTransportation
Environment
Technology
Urban Planning
PublicManagement
Governance
Social Cohesion
# 72 ‐ Osaka‐Japan
020406080
100Economy
Human Capital
InternationalOutreach
Mobility andTransportation
Environment
Technology
Urban Planning
PublicManagement
Governance
Social Cohesion
# 73 ‐Marseille‐France
020406080
100Economy
Human Capital
InternationalOutreach
Mobility andTransportation
Environment
Technology
Urban Planning
PublicManagement
Governance
Social Cohesion
# 74 ‐ Nice‐France
020406080
100Economy
Human Capital
InternationalOutreach
Mobility andTransportation
Environment
Technology
Urban Planning
PublicManagement
Governance
Social Cohesion
# 75 ‐ Bilbao‐Spain
020406080
100Economy
Human Capital
InternationalOutreach
Mobility andTransportation
Environment
Technology
Urban Planning
PublicManagement
Governance
Social Cohesion
# 76 ‐ Leeds‐United Kingdom
020406080
100Economy
Human Capital
InternationalOutreach
Mobility andTransportation
Environment
Technology
Urban Planning
PublicManagement
Governance
Social Cohesion
# 77 ‐ Bratislava‐Slovakia
020406080
100Economy
Human Capital
InternationalOutreach
Mobility andTransportation
Environment
Technology
Urban Planning
PublicManagement
Governance
Social Cohesion
# 78 ‐ A Coruña‐Spain

IESE Business School - IESE Cities in Motion Index (ST-442-E)66
020406080
100Economy
Human Capital
InternationalOutreach
Mobility andTransportation
Environment
Technology
Urban Planning
PublicManagement
Governance
Social Cohesion
# 79 ‐ Lille‐France
020406080
100Economy
Human Capital
InternationalOutreach
Mobility andTransportation
Environment
Technology
Urban Planning
PublicManagement
Governance
Social Cohesion
# 80 ‐ Shanghai‐China
020406080
100Economy
Human Capital
InternationalOutreach
Mobility andTransportation
Environment
Technology
Urban Planning
PublicManagement
Governance
Social Cohesion
# 81 ‐ Nagoya‐Japan
020406080
100Economy
Human Capital
InternationalOutreach
Mobility andTransportation
Environment
Technology
Urban Planning
PublicManagement
Governance
Social Cohesion
# 82 ‐ Riga‐Latvia
020406080
100Economy
Human Capital
InternationalOutreach
Mobility andTransportation
Environment
Technology
Urban Planning
PublicManagement
Governance
Social Cohesion
# 83 ‐ Buenos Aires‐Argentina
020406080
100Economy
Human Capital
InternationalOutreach
Mobility andTransportation
Environment
Technology
Urban Planning
PublicManagement
Governance
Social Cohesion
# 84 ‐ Zagreb‐Croatia
020406080
100Economy
Human Capital
InternationalOutreach
Mobility andTransportation
Environment
Technology
Urban Planning
PublicManagement
Governance
Social Cohesion
# 85 ‐ Santiago‐Chile
020406080
100Economy
Human Capital
InternationalOutreach
Mobility andTransportation
Environment
Technology
Urban Planning
PublicManagement
Governance
Social Cohesion
# 86 ‐ Bangkok‐Thailand

IESE Business School - IESE Cities in Motion Index (ST-442-E)67
020406080
100Economy
Human Capital
InternationalOutreach
Mobility andTransportation
Environment
Technology
Urban Planning
PublicManagement
Governance
Social Cohesion
# 87 ‐Mexico City‐Mexico
020406080
100Economy
Human Capital
InternationalOutreach
Mobility andTransportation
Environment
Technology
Urban Planning
PublicManagement
Governance
Social Cohesion
# 88 ‐ Gothenburg‐Sweden
020406080
100Economy
Human Capital
InternationalOutreach
Mobility andTransportation
Environment
Technology
Urban Planning
PublicManagement
Governance
Social Cohesion
# 89 ‐Moscow‐Russia
020406080
100Economy
Human Capital
InternationalOutreach
Mobility andTransportation
Environment
Technology
Urban Planning
PublicManagement
Governance
Social Cohesion
# 90 ‐ Beijing‐China
020406080
100Economy
Human Capital
InternationalOutreach
Mobility andTransportation
Environment
Technology
Urban Planning
PublicManagement
Governance
Social Cohesion
# 91 ‐ Sofia‐Bulgaria
020406080
100Economy
Human Capital
InternationalOutreach
Mobility andTransportation
Environment
Technology
Urban Planning
PublicManagement
Governance
Social Cohesion
# 92 ‐ Kuala Lumpur‐Malaysia
020406080
100Economy
Human Capital
InternationalOutreach
Mobility andTransportation
Environment
Technology
Urban Planning
PublicManagement
Governance
Social Cohesion
# 93 ‐ Naples‐Italy
020406080
100Economy
Human Capital
InternationalOutreach
Mobility andTransportation
Environment
Technology
Urban Planning
PublicManagement
Governance
Social Cohesion
# 94 ‐ Athens‐Greece

IESE Business School - IESE Cities in Motion Index (ST-442-E)68
020406080
100Economy
Human Capital
InternationalOutreach
Mobility andTransportation
Environment
Technology
Urban Planning
PublicManagement
Governance
Social Cohesion
# 95 ‐Wrocław‐Poland
020406080
100Economy
Human Capital
InternationalOutreach
Mobility andTransportation
Environment
Technology
Urban Planning
PublicManagement
Governance
Social Cohesion
# 96 ‐Medellín‐Colombia
020406080
100Economy
Human Capital
InternationalOutreach
Mobility andTransportation
Environment
Technology
Urban Planning
PublicManagement
Governance
Social Cohesion
# 97 ‐ Duisburg‐Germany
020406080
100Economy
Human Capital
InternationalOutreach
Mobility andTransportation
Environment
Technology
Urban Planning
PublicManagement
Governance
Social Cohesion
# 98 ‐ Porto‐Portugal
020406080
100Economy
Human Capital
InternationalOutreach
Mobility andTransportation
Environment
Technology
Urban Planning
PublicManagement
Governance
Social Cohesion
# 99 ‐Montevideo‐Uruguay
020406080
100Economy
Human Capital
InternationalOutreach
Mobility andTransportation
Environment
Technology
Urban Planning
PublicManagement
Governance
Social Cohesion
# 100 ‐ Busan‐South Korea
020406080
100Economy
Human Capital
InternationalOutreach
Mobility andTransportation
Environment
Technology
Urban Planning
PublicManagement
Governance
Social Cohesion
# 101 ‐ São Paulo‐Brazil
020406080
100Economy
Human Capital
InternationalOutreach
Mobility andTransportation
Environment
Technology
Urban Planning
PublicManagement
Governance
Social Cohesion
# 102 ‐ Guangzhou‐China
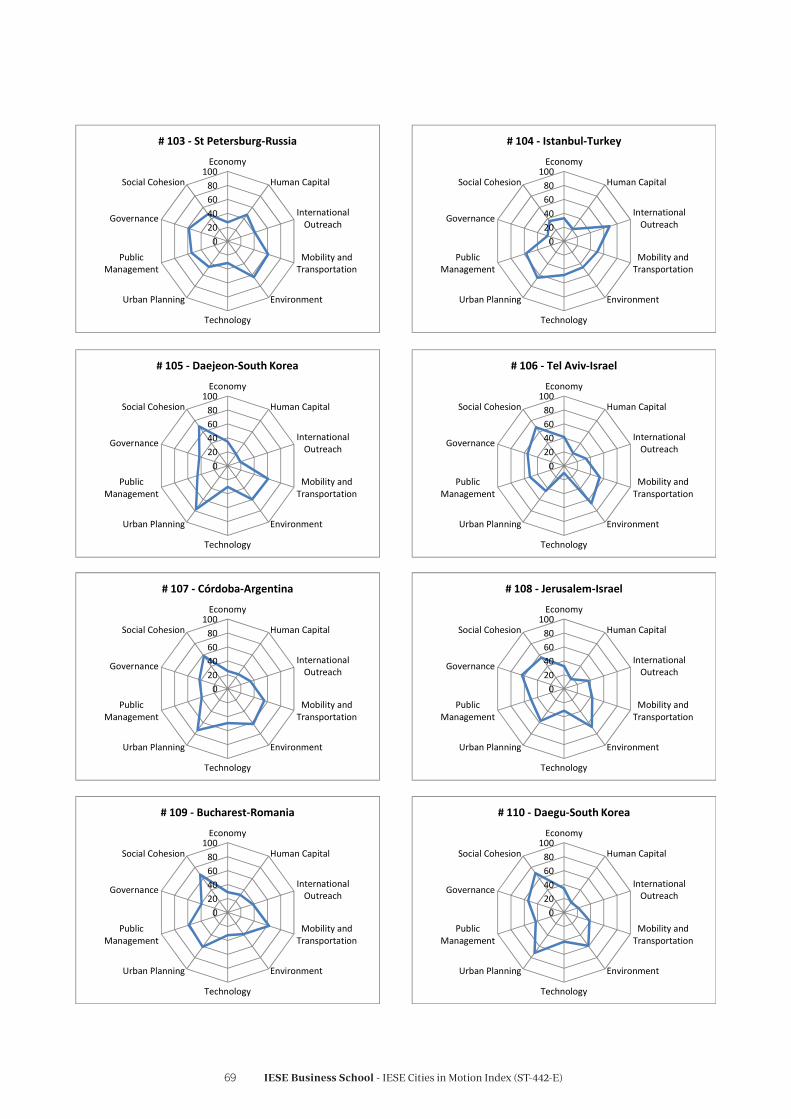
IESE Business School - IESE Cities in Motion Index (ST-442-E)69
020406080
100Economy
Human Capital
InternationalOutreach
Mobility andTransportation
Environment
Technology
Urban Planning
PublicManagement
Governance
Social Cohesion
# 103 ‐ St Petersburg‐Russia
020406080
100Economy
Human Capital
InternationalOutreach
Mobility andTransportation
Environment
Technology
Urban Planning
PublicManagement
Governance
Social Cohesion
# 104 ‐ Istanbul‐Turkey
020406080
100Economy
Human Capital
InternationalOutreach
Mobility andTransportation
Environment
Technology
Urban Planning
PublicManagement
Governance
Social Cohesion
# 105 ‐ Daejeon‐South Korea
020406080
100Economy
Human Capital
InternationalOutreach
Mobility andTransportation
Environment
Technology
Urban Planning
PublicManagement
Governance
Social Cohesion
# 106 ‐ Tel Aviv‐Israel
020406080
100Economy
Human Capital
InternationalOutreach
Mobility andTransportation
Environment
Technology
Urban Planning
PublicManagement
Governance
Social Cohesion
# 107 ‐ Córdoba‐Argentina
020406080
100Economy
Human Capital
InternationalOutreach
Mobility andTransportation
Environment
Technology
Urban Planning
PublicManagement
Governance
Social Cohesion
# 108 ‐ Jerusalem‐Israel
020406080
100Economy
Human Capital
InternationalOutreach
Mobility andTransportation
Environment
Technology
Urban Planning
PublicManagement
Governance
Social Cohesion
# 109 ‐ Bucharest‐Romania
020406080
100Economy
Human Capital
InternationalOutreach
Mobility andTransportation
Environment
Technology
Urban Planning
PublicManagement
Governance
Social Cohesion
# 110 ‐ Daegu‐South Korea
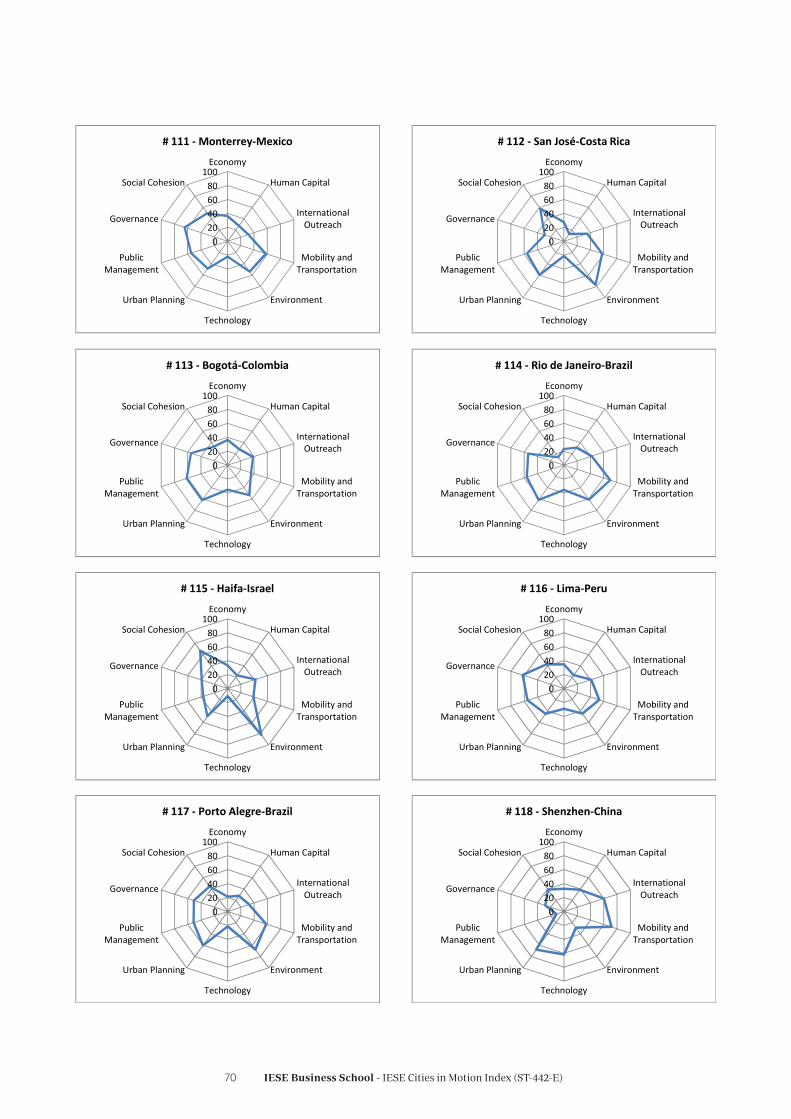
IESE Business School - IESE Cities in Motion Index (ST-442-E)70
020406080
100Economy
Human Capital
InternationalOutreach
Mobility andTransportation
Environment
Technology
Urban Planning
PublicManagement
Governance
Social Cohesion
# 111 ‐Monterrey‐Mexico
020406080
100Economy
Human Capital
InternationalOutreach
Mobility andTransportation
Environment
Technology
Urban Planning
PublicManagement
Governance
Social Cohesion
# 112 ‐ San José‐Costa Rica
020406080
100Economy
Human Capital
InternationalOutreach
Mobility andTransportation
Environment
Technology
Urban Planning
PublicManagement
Governance
Social Cohesion
# 113 ‐ Bogotá‐Colombia
020406080
100Economy
Human Capital
InternationalOutreach
Mobility andTransportation
Environment
Technology
Urban Planning
PublicManagement
Governance
Social Cohesion
# 114 ‐ Rio de Janeiro‐Brazil
020406080
100Economy
Human Capital
InternationalOutreach
Mobility andTransportation
Environment
Technology
Urban Planning
PublicManagement
Governance
Social Cohesion
# 115 ‐ Haifa‐Israel
020406080
100Economy
Human Capital
InternationalOutreach
Mobility andTransportation
Environment
Technology
Urban Planning
PublicManagement
Governance
Social Cohesion
# 116 ‐ Lima‐Peru
020406080
100Economy
Human Capital
InternationalOutreach
Mobility andTransportation
Environment
Technology
Urban Planning
PublicManagement
Governance
Social Cohesion
# 117 ‐ Porto Alegre‐Brazil
020406080
100Economy
Human Capital
InternationalOutreach
Mobility andTransportation
Environment
Technology
Urban Planning
PublicManagement
Governance
Social Cohesion
# 118 ‐ Shenzhen‐China

IESE Business School - IESE Cities in Motion Index (ST-442-E)71
020406080
100Economy
Human Capital
InternationalOutreach
Mobility andTransportation
Environment
Technology
Urban Planning
PublicManagement
Governance
Social Cohesion
# 119 ‐ Kiev‐Ukraine
020406080
100Economy
Human Capital
InternationalOutreach
Mobility andTransportation
Environment
Technology
Urban Planning
PublicManagement
Governance
Social Cohesion
# 120 ‐ Jeddah‐Saudi Arabia
020406080
100Economy
Human Capital
InternationalOutreach
Mobility andTransportation
Environment
Technology
Urban Planning
PublicManagement
Governance
Social Cohesion
# 121 ‐ Guadalajara‐Mexico
020406080
100Economy
Human Capital
InternationalOutreach
Mobility andTransportation
Environment
Technology
Urban Planning
PublicManagement
Governance
Social Cohesion
# 122 ‐ Cali‐Colombia
020406080
100Economy
Human Capital
InternationalOutreach
Mobility andTransportation
Environment
Technology
Urban Planning
PublicManagement
Governance
Social Cohesion
# 123 ‐ Almaty‐Kazakhstan
020406080
100Economy
Human Capital
InternationalOutreach
Mobility andTransportation
Environment
Technology
Urban Planning
PublicManagement
Governance
Social Cohesion
# 124 ‐ Belgrade‐Serbia
020406080
100Economy
Human Capital
InternationalOutreach
Mobility andTransportation
Environment
Technology
Urban Planning
PublicManagement
Governance
Social Cohesion
# 125 ‐ Tbilisi‐Georgia
020406080
100Economy
Human Capital
InternationalOutreach
Mobility andTransportation
Environment
Technology
Urban Planning
PublicManagement
Governance
Social Cohesion
# 126 ‐Wuhan‐China

IESE Business School - IESE Cities in Motion Index (ST-442-E)72
020406080
100Economy
Human Capital
InternationalOutreach
Mobility andTransportation
Environment
Technology
Urban Planning
PublicManagement
Governance
Social Cohesion
# 127 ‐Minsk‐Belarus
020406080
100Economy
Human Capital
InternationalOutreach
Mobility andTransportation
Environment
Technology
Urban Planning
PublicManagement
Governance
Social Cohesion
# 128 ‐ Kuwait City‐Kuwait
020406080
100Economy
Human Capital
InternationalOutreach
Mobility andTransportation
Environment
Technology
Urban Planning
PublicManagement
Governance
Social Cohesion
# 129 ‐ Suzhou‐China
020406080
100Economy
Human Capital
InternationalOutreach
Mobility andTransportation
Environment
Technology
Urban Planning
PublicManagement
Governance
Social Cohesion
# 130 ‐ Quito‐Ecuador
020406080
100Economy
Human Capital
InternationalOutreach
Mobility andTransportation
Environment
Technology
Urban Planning
PublicManagement
Governance
Social Cohesion
# 131 ‐ Curitiba‐Brazil
020406080
100Economy
Human Capital
InternationalOutreach
Mobility andTransportation
Environment
Technology
Urban Planning
PublicManagement
Governance
Social Cohesion
# 132 ‐ Doha‐Qatar
020406080
100Economy
Human Capital
InternationalOutreach
Mobility andTransportation
Environment
Technology
Urban Planning
PublicManagement
Governance
Social Cohesion
# 133 ‐ Cape Town‐South Africa
020406080
100Economy
Human Capital
InternationalOutreach
Mobility andTransportation
Environment
Technology
Urban Planning
PublicManagement
Governance
Social Cohesion
# 134 ‐ Sarajevo‐Bosnia‐Herzegovina
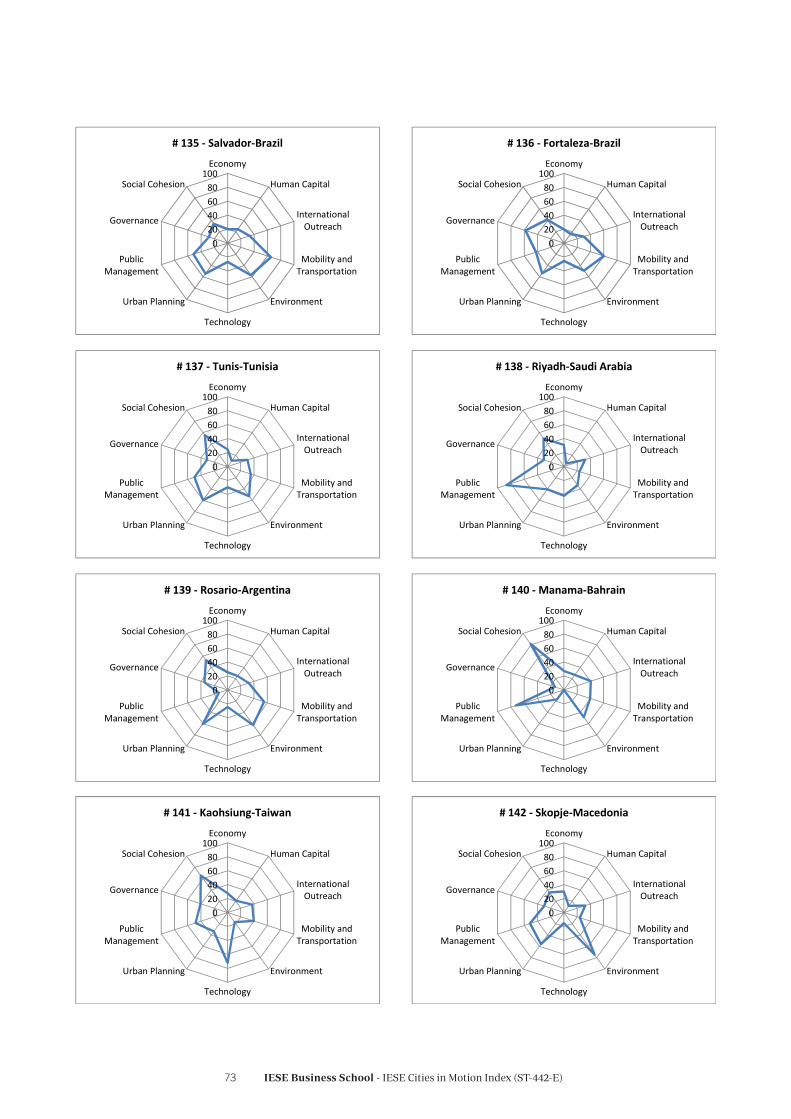
IESE Business School - IESE Cities in Motion Index (ST-442-E)73
020406080
100Economy
Human Capital
InternationalOutreach
Mobility andTransportation
Environment
Technology
Urban Planning
PublicManagement
Governance
Social Cohesion
# 135 ‐ Salvador‐Brazil
020406080
100Economy
Human Capital
InternationalOutreach
Mobility andTransportation
Environment
Technology
Urban Planning
PublicManagement
Governance
Social Cohesion
# 136 ‐ Fortaleza‐Brazil
020406080
100Economy
Human Capital
InternationalOutreach
Mobility andTransportation
Environment
Technology
Urban Planning
PublicManagement
Governance
Social Cohesion
# 137 ‐ Tunis‐Tunisia
020406080
100Economy
Human Capital
InternationalOutreach
Mobility andTransportation
Environment
Technology
Urban Planning
PublicManagement
Governance
Social Cohesion
# 138 ‐ Riyadh‐Saudi Arabia
020406080
100Economy
Human Capital
InternationalOutreach
Mobility andTransportation
Environment
Technology
Urban Planning
PublicManagement
Governance
Social Cohesion
# 139 ‐ Rosario‐Argentina
020406080
100Economy
Human Capital
InternationalOutreach
Mobility andTransportation
Environment
Technology
Urban Planning
PublicManagement
Governance
Social Cohesion
# 140 ‐Manama‐Bahrain
020406080
100Economy
Human Capital
InternationalOutreach
Mobility andTransportation
Environment
Technology
Urban Planning
PublicManagement
Governance
Social Cohesion
# 141 ‐ Kaohsiung‐Taiwan
020406080
100Economy
Human Capital
InternationalOutreach
Mobility andTransportation
Environment
Technology
Urban Planning
PublicManagement
Governance
Social Cohesion
# 142 ‐ Skopje‐Macedonia
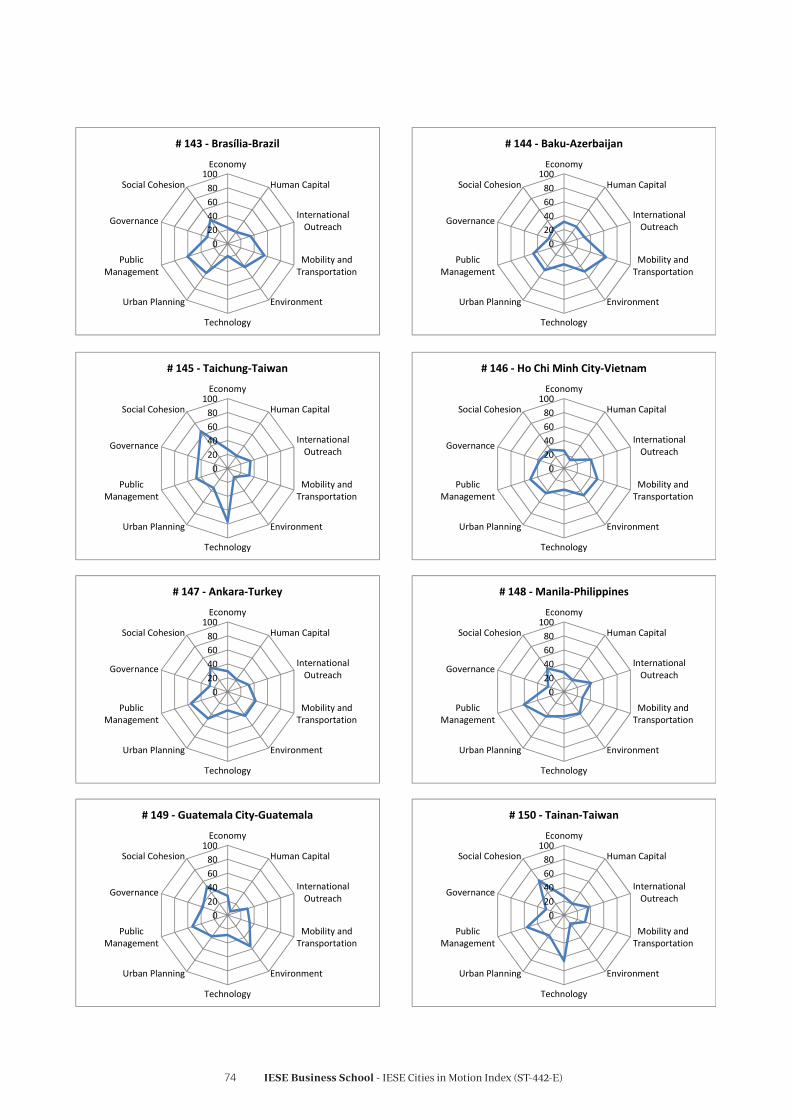
IESE Business School - IESE Cities in Motion Index (ST-442-E)74
020406080
100Economy
Human Capital
InternationalOutreach
Mobility andTransportation
Environment
Technology
Urban Planning
PublicManagement
Governance
Social Cohesion
# 143 ‐ Brasília‐Brazil
020406080
100Economy
Human Capital
InternationalOutreach
Mobility andTransportation
Environment
Technology
Urban Planning
PublicManagement
Governance
Social Cohesion
# 144 ‐ Baku‐Azerbaijan
020406080
100Economy
Human Capital
InternationalOutreach
Mobility andTransportation
Environment
Technology
Urban Planning
PublicManagement
Governance
Social Cohesion
# 145 ‐ Taichung‐Taiwan
020406080
100Economy
Human Capital
InternationalOutreach
Mobility andTransportation
Environment
Technology
Urban Planning
PublicManagement
Governance
Social Cohesion
# 146 ‐ Ho Chi Minh City‐Vietnam
020406080
100Economy
Human Capital
InternationalOutreach
Mobility andTransportation
Environment
Technology
Urban Planning
PublicManagement
Governance
Social Cohesion
# 147 ‐ Ankara‐Turkey
020406080
100Economy
Human Capital
InternationalOutreach
Mobility andTransportation
Environment
Technology
Urban Planning
PublicManagement
Governance
Social Cohesion
# 148 ‐Manila‐Philippines
020406080
100Economy
Human Capital
InternationalOutreach
Mobility andTransportation
Environment
Technology
Urban Planning
PublicManagement
Governance
Social Cohesion
# 149 ‐ Guatemala City‐Guatemala
020406080
100Economy
Human Capital
InternationalOutreach
Mobility andTransportation
Environment
Technology
Urban Planning
PublicManagement
Governance
Social Cohesion
# 150 ‐ Tainan‐Taiwan

IESE Business School - IESE Cities in Motion Index (ST-442-E)75
020406080
100Economy
Human Capital
InternationalOutreach
Mobility andTransportation
Environment
Technology
Urban Planning
PublicManagement
Governance
Social Cohesion
# 151 ‐ Recife‐Brazil
020406080
100Economy
Human Capital
InternationalOutreach
Mobility andTransportation
Environment
Technology
Urban Planning
PublicManagement
Governance
Social Cohesion
# 152 ‐ Novosibirsk‐Russia
020406080
100Economy
Human Capital
InternationalOutreach
Mobility andTransportation
Environment
Technology
Urban Planning
PublicManagement
Governance
Social Cohesion
# 153 ‐ Belo Horizonte‐Brazil
020406080
100Economy
Human Capital
InternationalOutreach
Mobility andTransportation
Environment
Technology
Urban Planning
PublicManagement
Governance
Social Cohesion
# 154 ‐ Bursa‐Turkey
020406080
100Economy
Human Capital
InternationalOutreach
Mobility andTransportation
Environment
Technology
Urban Planning
PublicManagement
Governance
Social Cohesion
# 155 ‐ Johannesburg‐South Africa
020406080
100Economy
Human Capital
InternationalOutreach
Mobility andTransportation
Environment
Technology
Urban Planning
PublicManagement
Governance
Social Cohesion
# 156 ‐ Jakarta‐Indonesia
020406080
100Economy
Human Capital
InternationalOutreach
Mobility andTransportation
Environment
Technology
Urban Planning
PublicManagement
Governance
Social Cohesion
# 157 ‐ Chongqing‐China
020406080
100Economy
Human Capital
InternationalOutreach
Mobility andTransportation
Environment
Technology
Urban Planning
PublicManagement
Governance
Social Cohesion
# 158 ‐ Durban‐South Africa
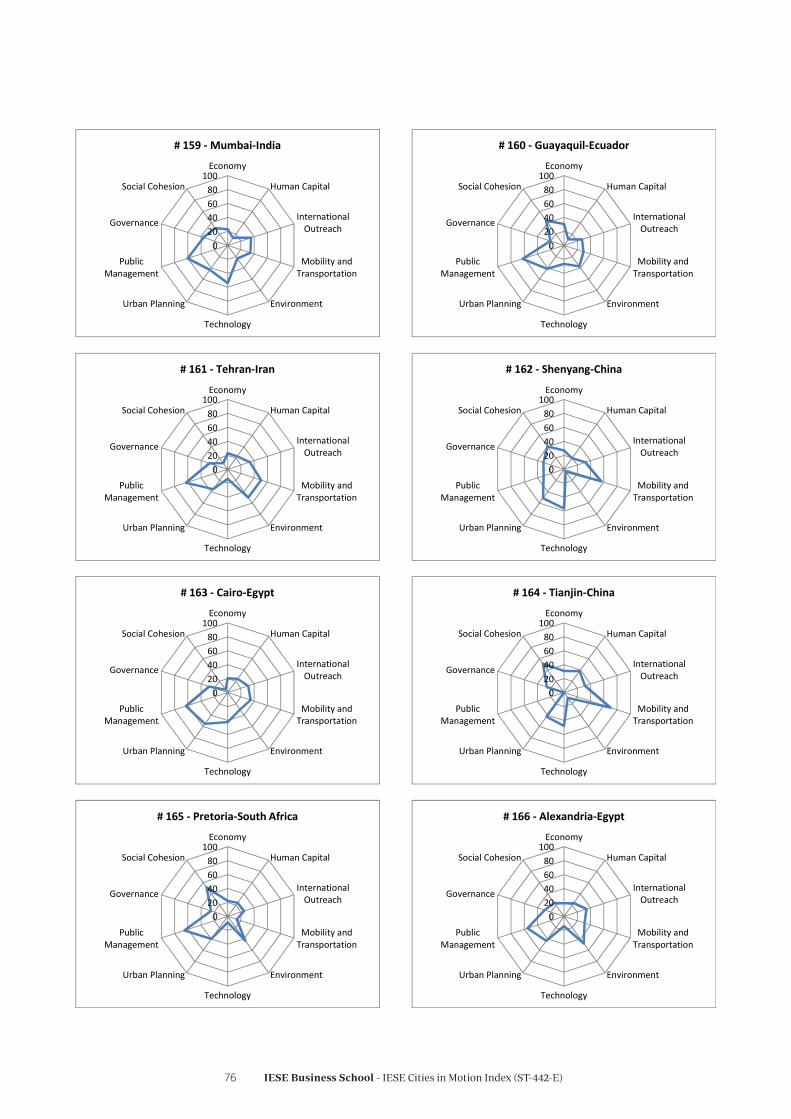
IESE Business School - IESE Cities in Motion Index (ST-442-E)76
020406080
100Economy
Human Capital
InternationalOutreach
Mobility andTransportation
Environment
Technology
Urban Planning
PublicManagement
Governance
Social Cohesion
# 159 ‐Mumbai‐India
020406080
100Economy
Human Capital
InternationalOutreach
Mobility andTransportation
Environment
Technology
Urban Planning
PublicManagement
Governance
Social Cohesion
# 160 ‐ Guayaquil‐Ecuador
020406080
100Economy
Human Capital
InternationalOutreach
Mobility andTransportation
Environment
Technology
Urban Planning
PublicManagement
Governance
Social Cohesion
# 161 ‐ Tehran‐Iran
020406080
100Economy
Human Capital
InternationalOutreach
Mobility andTransportation
Environment
Technology
Urban Planning
PublicManagement
Governance
Social Cohesion
# 162 ‐ Shenyang‐China
020406080
100Economy
Human Capital
InternationalOutreach
Mobility andTransportation
Environment
Technology
Urban Planning
PublicManagement
Governance
Social Cohesion
# 163 ‐ Cairo‐Egypt
020406080
100Economy
Human Capital
InternationalOutreach
Mobility andTransportation
Environment
Technology
Urban Planning
PublicManagement
Governance
Social Cohesion
# 164 ‐ Tianjin‐China
020406080
100Economy
Human Capital
InternationalOutreach
Mobility andTransportation
Environment
Technology
Urban Planning
PublicManagement
Governance
Social Cohesion
# 165 ‐ Pretoria‐South Africa
020406080
100Economy
Human Capital
InternationalOutreach
Mobility andTransportation
Environment
Technology
Urban Planning
PublicManagement
Governance
Social Cohesion
# 166 ‐ Alexandria‐Egypt

IESE Business School - IESE Cities in Motion Index (ST-442-E)77
020406080
100Economy
Human Capital
InternationalOutreach
Mobility andTransportation
Environment
Technology
Urban Planning
PublicManagement
Governance
Social Cohesion
# 167 ‐ Harbin‐China
020406080
100Economy
Human Capital
InternationalOutreach
Mobility andTransportation
Environment
Technology
Urban Planning
PublicManagement
Governance
Social Cohesion
# 168 ‐ Delhi‐India
0
50
100Economy
Human Capital
InternationalOutreach
Mobility andTransportation
Environment
Technology
Urban Planning
PublicManagement
Governance
Social Cohesion
# 169 ‐ Santo Domingo‐Dominican Republic
020406080
100Economy
Human Capital
InternationalOutreach
Mobility andTransportation
Environment
Technology
Urban Planning
PublicManagement
Governance
Social Cohesion
# 170 ‐ La Paz‐Bolivia
020406080
100Economy
Human Capital
InternationalOutreach
Mobility andTransportation
Environment
Technology
Urban Planning
PublicManagement
Governance
Social Cohesion
# 171 ‐ Casablanca‐Morocco
020406080
100Economy
Human Capital
InternationalOutreach
Mobility andTransportation
Environment
Technology
Urban Planning
PublicManagement
Governance
Social Cohesion
# 172 ‐ Santa Cruz‐Bolivia
020406080
100Economy
Human Capital
InternationalOutreach
Mobility andTransportation
Environment
Technology
Urban Planning
PublicManagement
Governance
Social Cohesion
# 173 ‐ Caracas‐Venezuela
020406080
100Economy
Human Capital
InternationalOutreach
Mobility andTransportation
Environment
Technology
Urban Planning
PublicManagement
Governance
Social Cohesion
# 174 ‐ Bangalore‐India

IESE Business School - IESE Cities in Motion Index (ST-442-E)78
020406080
100Economy
Human Capital
InternationalOutreach
Mobility andTransportation
Environment
Technology
Urban Planning
PublicManagement
Governance
Social Cohesion
# 175 ‐ Amman‐Jordan
020406080
100Economy
Human Capital
InternationalOutreach
Mobility andTransportation
Environment
Technology
Urban Planning
PublicManagement
Governance
Social Cohesion
# 176 ‐ Douala‐Cameroon
020406080
100Economy
Human Capital
InternationalOutreach
Mobility andTransportation
Environment
Technology
Urban Planning
PublicManagement
Governance
Social Cohesion
# 177 ‐ Nairobi‐Kenya
020406080
100Economy
Human Capital
InternationalOutreach
Mobility andTransportation
Environment
Technology
Urban Planning
PublicManagement
Governance
Social Cohesion
# 178 ‐ Kolkata‐India
020406080
100Economy
Human Capital
InternationalOutreach
Mobility andTransportation
Environment
Technology
Urban Planning
PublicManagement
Governance
Social Cohesion
# 179 ‐ Lagos‐Nigeria
020406080
100Economy
Human Capital
InternationalOutreach
Mobility andTransportation
Environment
Technology
Urban Planning
PublicManagement
Governance
Social Cohesion
# 180 ‐ Karachi‐Pakistan


BarcelonaAv. Pearson, 21 08034 Barcelona, Spain (+ 34) 93 253 42 00
MadridCamino del Cerro del Águila, 3 28023 Madrid, Spain(+34) 91 211 30 00
New York165 W. 57th Street New York, NY 10019-2201 USA(+1) 646 346 8850
MunichMaria-Theresia-Straße 1581675 Munich, Germany(+49) 89 24 20 97 90
Sao PauloRua Martiniano de Carvalho, 573 Bela Vista 01321001 Sao Paulo, Brazil(+55) 11 3177 8221
Follow us
IESE Business School
IESE Business School
iesebs
iese