IES VE for Virtual Audits of a Portfolio of Bank Buildings ...
Upload
paul-mcevoyCategory
view
465download
6
Coursework Exercise 3: Modelling More Complex Buildings (IES-‐VE)
Course Leader: Dr. David Jenkins
Student Name: Paul McEvoy
Student Number: H00167659
Submission Date: 13th December 2013
Architectural Engineering
Design Software Applications
School of the Built Environment
Heriot Watt University

Design Software Applications Modelling More Complex Buildings (IES-‐VE)
!
Table of Contents Introduction ...................................................................................................................... 2
The Post Graduate Centre .................................................................................................. 3
Modelling of the Post Graduate Centre .............................................................................. 3
Summary of Results ........................................................................................................... 8 Annual Energy Result: ................................................................................................................ 8
Results Analysis ................................................................................................................. 9 Energy Consumption .................................................................................................................. 9
Electricity ....................................................................................................................................... 9 Natural Gas .................................................................................................................................. 11
Carbon Emissions ...................................................................................................................... 12
Conclusion ....................................................................................................................... 15

Design Software Applications Modelling More Complex Buildings (IES-‐VE)
!
Introduction The following report is an investigation into the performance of Heriot Watt Universities Post Graduate Centre from an energy consumption and carbon emissions point of view. An IES-‐VE model of the building has being completed and a dynamic simulation has been carried out. The results from this simulation will be used to compare the Post Graduate Centre with similar buildings of its kind within the UK using available benchmark values to establish if the building is performing to its recommended state. The simulation results will also be compared with the buildings actual recorded energy data to find out if it is performing better or worse than the modelled building. An analysis into each individual part of the building will be completed to see which uses the most energy and also to detect any heating or cooling problems in those areas. Finally, a conclusion will be made for the differences between modelled and measured energy results.

Design Software Applications Modelling More Complex Buildings (IES-‐VE)
!
The Post Graduate Centre Heriot Watts Post Graduate Centre is a state of the art academic building located on the university’s campus. Construction of the Post Graduate Centre, designed by Hypostyle Architects, began in 2007 and was officially opened in 2009. This three-‐storey building comprises of a large lecture auditorium, a 150 capacity rated lecture theatre along with two additional lecture rooms. Seminar rooms, study areas and social spaces are all equipped with video conferencing facilities and Wi-‐Fi communications. The centre likes to encourage social networking and therefore has provided open communal spaces on the top floor (Crush Area) and with the large areas of glazing on this part of the building; beautiful views of the surrounding outside areas are provided. Self-‐catering facilities are available to students as is a café and study spaces for small groups or individuals. The Centre has the capacity to cater for an average of 1,500 postgraduate students ranging from 100 different countries.
Modelling of the Post Graduate Centre A basic model of the Post Graduate Centre was available. However the relevant glazing and solar shading was not in this model and the appropriate templates had not been assigned to the specific room types.
After visiting the Post Graduate Centre and taking the relevant notes and photographs, the half-‐finished modelled building was completed on IES-‐VE. With the aid of photographs and notes, glazing, solar shading and thermal templates were added were they were considered necessary. The glazing was added to approximately the same locations and dimensions as the actual building, 100% in some cases and an assumed window dimension for the rest of the glazing. Since the building consists of mostly large glazed areas, quite a lot of solar shading had to be included in the model.
The solar shading was included not only to replicate the look of the actual building but also to have an impact on the simulation results. The construction materials were set to a default construction template as this complies with the 2002 building regulations, the regulations in which the building would possibly have been constructed under. Most of the thermal templates were already created for the model apart from one for the lecture rooms and another for crush areas.

Design Software Applications Modelling More Complex Buildings (IES-‐VE)
!
These new templates are highlighted in yellow in the tables below.
Room Conditions:
Template Heating Set Point (°C) H. Profile
Cooling Set Point (°C) C. Profile
Café 21 7am-‐9pm Weekday 24 Off Continuously
Circulation 19 7am-‐9pm Weekday 23 Off Continuously
Crush Area 21 9am-‐5pm Weekday Working 23
9am-‐5pm Weekday Working
Lecture Auditorium 21 7am-‐9pm Weekday 23 7am-‐9pm Weekday Lecture Rooms 19
9am-‐5pm Weekday Working 23
9am-‐5pm Weekday Working
Offices 21 9am-‐5pm Weekday Working 23
9am-‐5pm Weekday Working
Toilets 18 7am-‐9pm Weekday 23 Off Continuously
Voids 19 Off Continuously 23 Off Continuously
System:
Template System Aux. Ventilation DHW Out. Air Min. Flow rate Out. Air Var. Profile
Café Radiator/Natural Vent.
Radiator/Natural Vent.
Radiator/Natural Vent. 0.8 l/s/m² Off Continuously
Circulation Radiator/Natural Vent.
Radiator/Natural Vent.
Radiator/Natural Vent. 0.8 l/s/m² Off Continuously
Crush Area Fan Coil System Fan Coil System Fan Coil System 10 l/s 7am-‐9pm Weekday
Lecture Auditorium Fan Coil System Fan Coil System Fan Coil System 10 l/s
7am-‐9pm Weekday
Lecture Rooms Fan Coil System Fan Coil System Fan Coil System 10 l/s
9am-‐5pm Weekday Working
Offices Fan Coil System Fan Coil System Fan Coil System 10 l/s 7am-‐9pm Weekday
Toilets Radiator/Natural Vent.
Radiator/Natural Vent.
Radiator/Natural Vent. 0.8 l/s/m² Off Continuously
Voids None None None 0.8 l/s/m² Off Continuously

Design Software Applications Modelling More Complex Buildings (IES-‐VE)
!
Internal Gains:
Template Gain Max Sens. Max Lat. Occupancy Max Power Variation Profile
Café Lighting 14 w/m² 14 w/m² 7am-‐9pm weekday
People 80 w/person
60 w/person 4 m²/person
9am-‐5pm weekday working
Cooking 50 w/m² 20 w/m² 70 w/m² Kitchen Equipment
Circulation Lighting 10 w/m² 10 w/m² 7am-‐9pm weekday
Crush Area Lighting 10 w/m² 10 w/m²
9am-‐5pm weekday working
People 90 w/person
60 w/person 10 m²/person
9am-‐5pm weekday working
Computers 5 w/m² 5 w/m² 9am-‐5pm weekday working
Lecture Auditorium Lighting 15 w/m²
15 w/m²
9am-‐5pm weekday working
People 80 w/person
60 w/person 4 m²/person
9am-‐5pm weekday working
Equipment 10 w/m² 10 w/m²
9am-‐5pm weekday working
Lecture Rooms Lighting 15 w/m² 15 w/m²
9am-‐5pm weekday working
People 80 w/person
60 w/person 4 m²/person
9am-‐5pm weekday working
Equipment 10 w/m² 10 w/m²
9am-‐5pm weekday working
Offices Lighting 10 w/m² 10 w/m²
9am-‐5pm weekday working
People 90 w/person
60 w/person 10 m²/person
9am-‐5pm weekday working
Computers 25 w/m² 25 w/m²
9am-‐5pm weekday working
Toilets Lighting 6 w/m² 6 w/m² 7am-‐9pm weekday Voids
Design Software Applications Modelling More Complex Buildings (IES-‐VE)
!
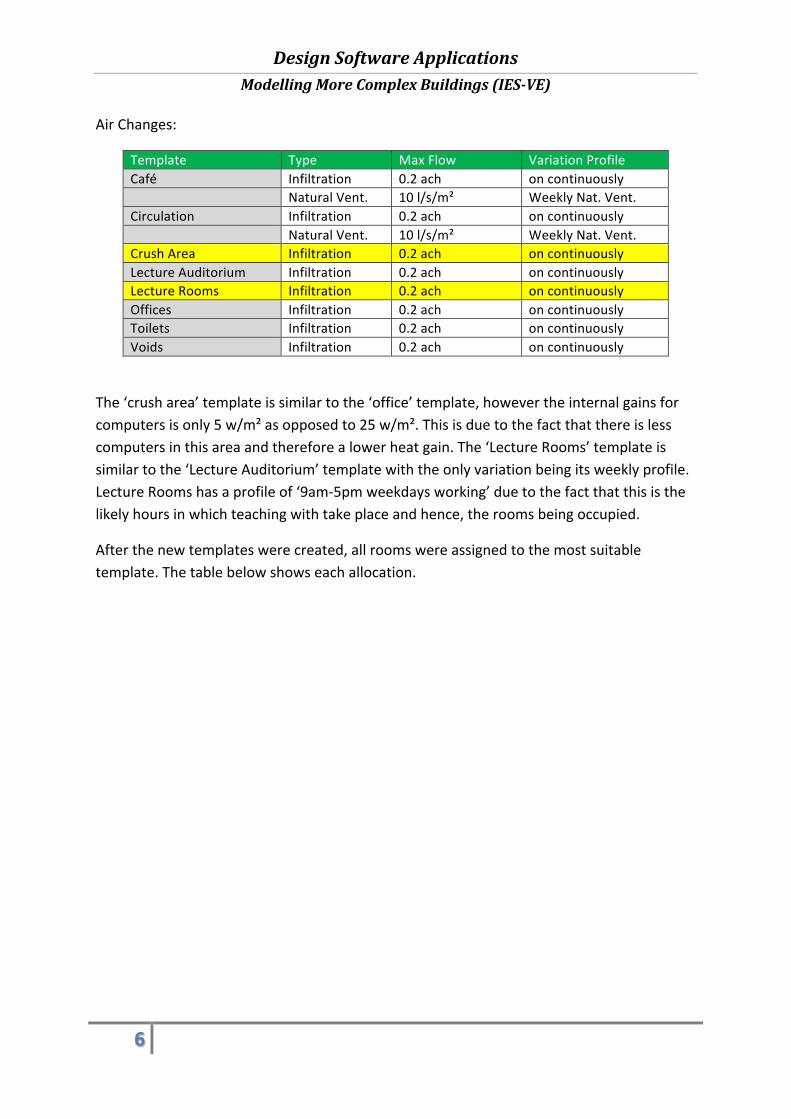
Air Changes:
Template Type Max Flow Variation Profile Café Infiltration 0.2 ach on continuously Natural Vent. 10 l/s/m² Weekly Nat. Vent. Circulation Infiltration 0.2 ach on continuously Natural Vent. 10 l/s/m² Weekly Nat. Vent. Crush Area Infiltration 0.2 ach on continuously Lecture Auditorium Infiltration 0.2 ach on continuously Lecture Rooms Infiltration 0.2 ach on continuously Offices Infiltration 0.2 ach on continuously Toilets Infiltration 0.2 ach on continuously Voids Infiltration 0.2 ach on continuously
The ‘crush area’ template is similar to the ‘office’ template, however the internal gains for computers is only 5 w/m² as opposed to 25 w/m². This is due to the fact that there is less computers in this area and therefore a lower heat gain. The ‘Lecture Rooms’ template is similar to the ‘Lecture Auditorium’ template with the only variation being its weekly profile. Lecture Rooms has a profile of ‘9am-‐5pm weekdays working’ due to the fact that this is the likely hours in which teaching with take place and hence, the rooms being occupied.
After the new templates were created, all rooms were assigned to the most suitable template. The table below shows each allocation.

Design Software Applications Modelling More Complex Buildings (IES-‐VE)
!
Floor Room Name Assigned Template
Ground Floor café Café
Lecture Auditorium Lecture Auditorium
Managers Office Office
Entrance Circulation
Toilets Toilets
Lifts/Stores/stairs/Plant R. Voids
First Floor Office Office
Lifts/Stores/stairs/Plant R. Voids
Lobby/Misc./Space Circulation
Toilets Toilets
Second Floor Lecture Rooms Lecture Rooms
Stairs/Store/Serv./Lift Voids
Toilets Toilets
Misc./Space Circulation
Third Floor Crush Area Crush Area
Stairs/Store/Serv./Lift Voids
Unheated Space Voids
Crush Area (Roof) Voids
Toilets Toilets
Misc./Space Circulation

Design Software Applications Modelling More Complex Buildings (IES-‐VE)
!
Summary of Results On completion of the model, a dynamic simulation was carried out to identify the Post Graduate Centres annual energy consumption and the resulting carbon emissions.
Annual Energy Result:
Date Total natural Gas (MWh) Total Electricity (MWh) Total energy (MWh)
Jan 01-‐31 16.9382 12.1661 29.1043 Feb 01-‐28 13.5751 10.5841 24.1593 Mar 01-‐31 8.8143 11.1262 19.9405 Apr 01-‐30 4.6376 11.7086 16.3463 May 01-‐31 1.5777 12.4533 14.031 Jun 01-‐30 0.5455 11.1251 11.6706 Jul 01-‐31 0.3988 13.6942 14.093 Aug 01-‐31 0.3143 13.3967 13.711 Sep 01-‐30 0.9536 11.9003 12.8539 Oct 01-‐31 6.6778 12.2411 18.9188 Nov 01-‐30 12.1069 11.1078 23.2147 Dec 01-‐31 16.0427 11.6365 27.6792 Summed total 82.5826 143.1402 225.7226
Annual Carbon Results:
Date Natural Gas CE (kgCO2) Electricity CE (kgCO2)
Total system CE (kgCO2)
Jan 01-‐31 3354 1970 5324 Feb 01-‐28 2688 1716 4403 Mar 01-‐31 1745 1808 3553 Apr 01-‐30 918 1921 2840 May 01-‐31 312 2119 2431 Jun 01-‐30 108 1995 2103 Jul 01-‐31 79 2760 2839 Aug 01-‐31 62 2794 2856 Sep 01-‐30 189 2208 2397 Oct 01-‐31 1322 2009 3331 Nov 01-‐30 2397 1798 4196 Dec 01-‐31 3176 1884 5060 Summed total 16351 24983 41334

Design Software Applications Modelling More Complex Buildings (IES-‐VE)
!
Results Analysis After the dynamic simulation on IES-‐VE, the results taken from Vista will be compared with the Post Graduate Centres actual monitored results as will they be compared with similar non-‐domestic buildings in the UK through available energy consumption benchmark guides.
Energy Consumption
CIBSE TM46 Energy Benchmarks
Benchmark figures have been taken from CIBSE TM46 based on the fact that CIBSE (Chartered Institute of Building Service Engineers) is a well-‐established and reliable organisation and has been for many years. This guide gives energy benchmark values for buildings across the UK under energy performance of buildings and under the building regulations 2007. The guide describes the benchmarks and explains the approach to their development and use.
Energy Consumption Guide 54 – Energy Efficiency in Further and Higher Education
The energy consumption guide 54 is more directed towards buildings similar to the Post Graduate Centre as it primarily focuses on University buildings across the UK. This is the reason why this guide was used. It gives energy consumption benchmarks for individual areas (i.e. Lecture Rooms) of a higher educational building along with a total benchmark figure for the building.
Electricity
Source Electricity kWh/m²/year Monitored Results 128 IES Modelled Results 62 CIBSE TM46 Benchmarks 40 ECG 54 Benchmarks 75

Design Software Applications Modelling More Complex Buildings (IES-‐VE)
!"
Fig 1.0 Compared Annual Electrical Consumption kWh/m²/year
The electrical consumption of the modelled Post Graduate Centre has been compared with actual monitored results, benchmark figures from CIBSE TM46 guide and also benchmark figures from Energy Consumption Guide 54. As you can see from the table above, the actual monitored electrical consumption for the building is much higher than the IES results and industry benchmarks.
So what are the reasons for this?
The variation profiles on IES are set to 9am – 5pm Monday to Friday and 7am to 9pm Monday to Friday and off completely on Saturday and Sunday. This means that IES is calculating loads for these times only. The actual Post Graduate Centre will have a constant flow of students coming into the centre and using the centres services in and outside of these variation profiles especially during the weekends. Therefore the actual electrical consumption is much higher than the modelled results due to electricity from lights, computers etc. being consumed at times outside of these variation profiles, for example students coming in to use the computers during the weekends to complete project work.
The values given in CIBSE TM46 and ECG 54 are relatively close to the IES results but are still a little short of the monitored results. Although the values from CIBSE and ECG are accurate, they are still only a general guide for this type of building and therefore the values will be different.
0
20
40
60
80
100
120
140
Monitored Results
IES Modelled Results
CIBSE TM46
ECG 54
Electricity kWh/m²/year

Design Software Applications Modelling More Complex Buildings (IES-‐VE)
!!
Natural Gas
Source Natural Gas kWh/m²/year Monitored Results 18 IES Modelled Results 36 CIBSE TM46 Benchmarks 150 ECG 54 Benchmarks 185
Fig 2.0 Compared Annual Natural Gas Consumption kWh/m²/year
Like the electrical consumption, the Natural Gas consumption of the modelled Post Graduate Centre has been compared with actual monitored results, benchmark figures from CIBSE TM46 guide and also benchmark figures from Energy Consumption Guide 54. As you can see from the table above, the modelled and monitored results are quite similar with the monitored being the lesser of the two. However there is quite a significant difference in the monitored and modelled results with the benchmark figures.
Since the Post Graduate Centre is quite a new building, it would have been designed to preform efficiently. Certain design measures have been incorporated in the building to achieve this energy efficiency. The heating system operates only when the room temperature drops below 21oC. This is done using room thermostats that basically detect when the temperature in a zone has dropped below the design temperature and if so, a signal is sent to the heating system telling it to turn on and then of once the optimum temperature is reached. This design is much more efficient (using less fuel) than old heating systems which in some cases were designed to run constantly for a set period of time resulting in higher fuel consumption. CIBSE TM46 has based their benchmark values on buildings that were built during the nineties which may not have the same efficient design
0
20
40
60
80
100
120
140
160
180
200
Monitered Results
IES Modelled Results
CIBSE TM46
ECG 54
GAS kWh/m²/year

Design Software Applications Modelling More Complex Buildings (IES-‐VE)
!"
as the Post Graduate Centre. Likewise with ECG 54, they have based their benchmarks on university buildings that were possibly constructed many years ago and therefore the building and its associated heating system would be dated. Since these guides have based their benchmarks on dated buildings, this would be the reason for the difference in the modelled and monitored results with the energy benchmarks.
Carbon Emissions The Carbon Emissions from the modelled results has been compared with the actual monitored data (calculated) and benchmarks from CIBSE TM46 and BSRIA Rules of Thumb.
BSRIA Rules of Thumb
BSRIA has been used to compare the carbon emissions based on the fact that it is a reliable source as it has been around since 1955. This edition of BSRIA (5th edition) was produced in 2011 so therefore it is relatively new.
CIBSE TM46 Energy Benchmarks
CIBSE TM46 has also being used once again based on the fact that it is a well-‐established and reliable organisation. This time however, it will be used to compare the Carbon Emissions benchmarks with the modelled buildings emissions and also with the monitored emissions (calculated).
Actual Post Graduate Centres Carbon Emissions
Carbon Emissions for the Post Graduate Centre have been calculated simply by multiplying the total Electrical and Natural Gas consumption loads (monitored results) by their carbon emissions factor which was taken from BSRIA Table 27 -‐ CO2 emissions factors for different fuel types.
Natural Gas Carbon Emissions:
18 kWh/m2/year X 0.198 kgCO2/kWh
= 3.49 kgCO2/m2/year
Electricity Carbon Emissions:
128 kWh/m2/year X 0.517 kgCO2/kWh
= 66 kgCO2/m2/year
Total Carbon Emissions:
3.49 kgCO2/m2/year + 66 kgCO2/m2/year
= 69.58 kgCO2/m2/year

Design Software Applications Modelling More Complex Buildings (IES-‐VE)
!"
Fig 3.0 BSRIA Table 27: CO2 Emissions factors for different fuel types.
Source Nat. Gas CE (kgCO2/m²) Electricity CE (kgCO2/m²) Total CE (kgCO2/m²/yr) IES-‐VE Modelled Results 7.109 10.86 17.97 Monitored Results 3.49 66 69.58 BSRIA 29.7 20.7 50.4 CIBSE TM46 Benchmarks 28.5 22 50.5
Fig 4.0 Compared Total Carbon Emissions kgCO2/m²/year
ENER
GY
RULES OF THUMB 5TH EDITION 69
© BSRIA BG 9/2011
Energy and carbon Table 27: CO2 emissions factors for different fuel types
Fuel type Carbon emissions factor (kgCO2/kWh)
Comments Ref
Mains gas 0.198 77
LPG 0.245
Heating oil 0.274
Wood pellets 0.028
Wood chips 0.009
Grid supplied electricity 0.517
Grid displaced electricity 0.529
Waste heat 0.058
Dual fuel (mineral + wood) 0.206
Your notes:
0
10
20
30
40
50
60
70
80
IES Modelled Results
Monitored Results
CIBSE TM46
BSRIA Rules of Thumb
Total Carbon Emissions kgCO2/m²/year

Design Software Applications Modelling More Complex Buildings (IES-‐VE)
!"
As you can see from the table above, the monitored carbon emissions seem to be in line with carbon emissions of similar type buildings. The values are quite similar to the benchmarks. This is telling us that the Post Graduate Centre is preforming to a recommended standard as set out in the guides.
Fig 5.0 Compared Natural Gas, Electrical and Total Carbon Emissions kgCO2/m²/year
This chart shows a breakdown of the different fuel types carbon emissions. As you can see, the IES-‐VE carbon emissions are quite low compared to the other three sources. The reason for this is that the variations profiles set up in the model only account for the building being in use from Monday to Friday and within the specific time frame. IES assumes that everything is turned of during the weekend. However this would not be the real case since some students tend to use the building at the weekends for study or some other academic purposes.
Although the total carbon emissions for the Post Graduate Centre are quite similar to the benchmarks it is interesting to see that there is a significant difference in the Natural Gas and Electrical emissions. As said previously the difference in the Natural gas would be due to the fact that these guides have based their benchmarks on possibly dated buildings with inefficient heating systems, and hence a higher Natural Gas consumption. The Electrical could be different due to the specific building in the guides does not completely replicate the actual Postgraduate centre, and therefore the emissions will not be exactly the same.
0
10
20
30
40
50
60
70
80
IES-‐VE Modelled Results
Monitored BSRIA CIBSE TM46
System nat. gas CE (kgCO2/m²)
System nat. elec. CE (kgCO2/m²)
Total system CE (kgCO2/m²)

Design Software Applications Modelling More Complex Buildings (IES-‐VE)
!"
Conclusion This exercise has showed us that although the building model is similar in some ways, it is difficult to identically replicate the exact building and this can be seen in the comparison of the results. The building looks to be preforming better than the modelled building and also better than industry benchmarks from a Natural Gas consumption point of view. The electrical consumption is higher than the model but again as said before; it is hard to completely replicate the actions of the building and its users.