IEP goals and services
56
KU ScholarWorks | http://kuscholarworks.ku.edu Individual Education Plan Goals and Services for Adolescents With Autism: Impact of Age and Educational Setting 2010 by Jennifer A. Kurth Ann M. Mastergeorge This work has been made available by the University of Kansas Libraries’ Office of Scholarly Communication and Copyright. Please share your stories about how Open Access to this article benefits you. This is the author’s accepted manuscript, post peer-review. The original published version can be found at the link below. Kurth, J.A. & Mastergeorge, M. (2010). Individual education plan goals and services for adolescents with autism: Impact of grade and educational setting. Journal of Special Education, 44(3), 146-160. Published version: http://dx.doi.org/10.1177/0022466908329825 Terms of Use: http://www2.ku.edu/~scholar/docs/license.shtml
Transcript of IEP goals and services
KU ScholarWorks | http://kuscholarworks.ku.edu
Individual Education Plan Goals and
Services for Adolescents With Autism:
Impact of Age and Educational Setting
2010
by Jennifer A. Kurth
Ann M. Mastergeorge
This work has been made available by the University of Kansas Libraries’ Office of Scholarly Communication and Copyright.
Please share your stories about how Open Access to this article benefits you.
This is the author’s accepted manuscript, post peer-review. The original published version can be found at the link below.
Kurth, J.A. & Mastergeorge, M. (2010). Individual education plan goals and services for adolescents with autism: Impact of grade and educational setting. Journal of Special Education, 44(3), 146-160.
Published version: http://dx.doi.org/10.1177/0022466908329825
Terms of Use: http://www2.ku.edu/~scholar/docs/license.shtml

IEP Goals and Services 1
Running Head: IEP Goals and Services
Individual Education Plan Goals and Services for Adolescents with Autism:
Impact of Age and Educational Setting
Jennifer A. Kurth and Ann M. Mastergeorge
University of California, Davis
Correspondence regarding this manuscript should be addressed to: Jennifer Kurth, at Northern
Arizona University, College of Education, PO Box 5774, Flagstaff, AZ 86011. Email:
IEP Goals and Services 2
Abstract
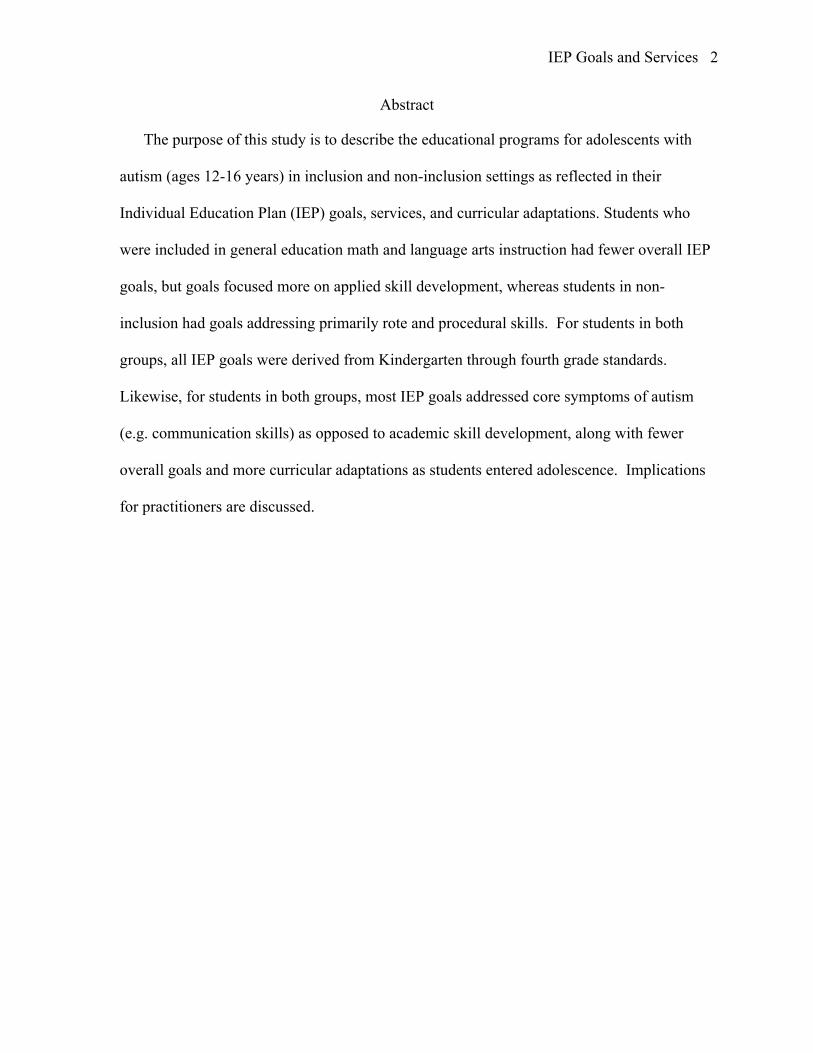
The purpose of this study is to describe the educational programs for adolescents with
autism (ages 12-16 years) in inclusion and non-inclusion settings as reflected in their
Individual Education Plan (IEP) goals, services, and curricular adaptations. Students who
were included in general education math and language arts instruction had fewer overall IEP
goals, but goals focused more on applied skill development, whereas students in non-
inclusion had goals addressing primarily rote and procedural skills. For students in both
groups, all IEP goals were derived from Kindergarten through fourth grade standards.
Likewise, for students in both groups, most IEP goals addressed core symptoms of autism
(e.g. communication skills) as opposed to academic skill development, along with fewer
overall goals and more curricular adaptations as students entered adolescence. Implications
for practitioners are discussed.
IEP Goals and Services 3
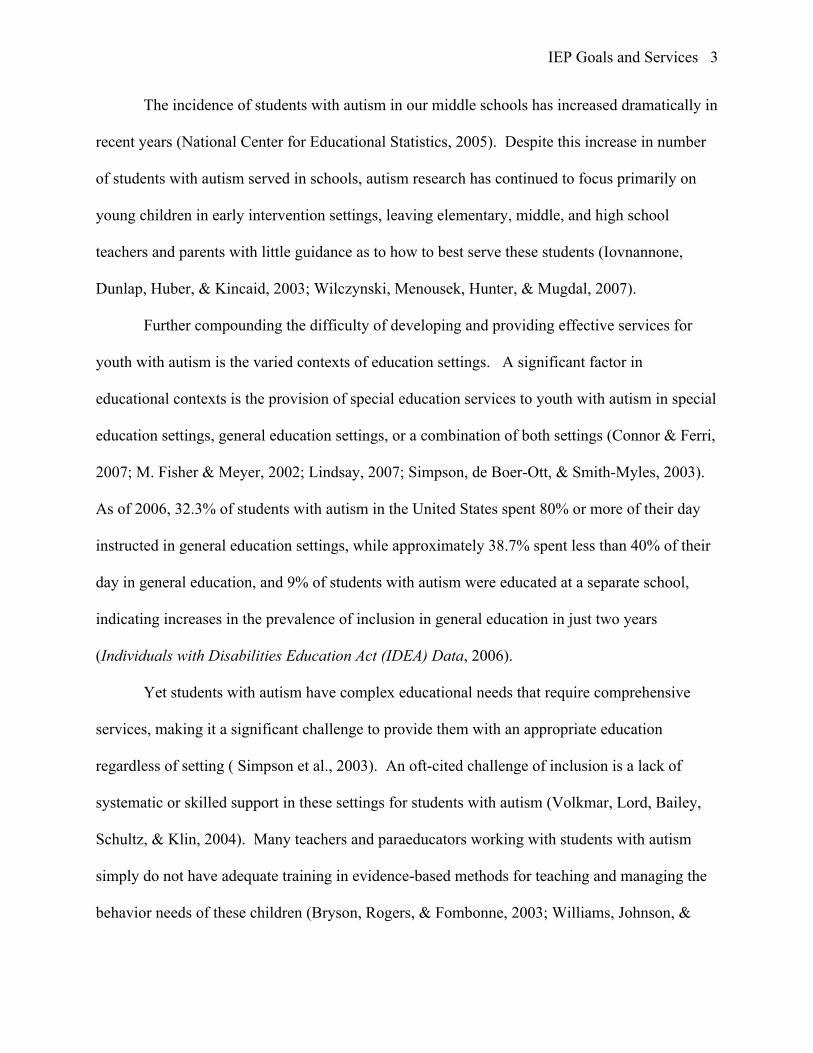
The incidence of students with autism in our middle schools has increased dramatically in
recent years (National Center for Educational Statistics, 2005). Despite this increase in number
of students with autism served in schools, autism research has continued to focus primarily on
young children in early intervention settings, leaving elementary, middle, and high school
teachers and parents with little guidance as to how to best serve these students (Iovnannone,
Dunlap, Huber, & Kincaid, 2003; Wilczynski, Menousek, Hunter, & Mugdal, 2007).
Further compounding the difficulty of developing and providing effective services for
youth with autism is the varied contexts of education settings. A significant factor in
educational contexts is the provision of special education services to youth with autism in special
education settings, general education settings, or a combination of both settings (Connor & Ferri,
2007; M. Fisher & Meyer, 2002; Lindsay, 2007; Simpson, de Boer-Ott, & Smith-Myles, 2003).
As of 2006, 32.3% of students with autism in the United States spent 80% or more of their day
instructed in general education settings, while approximately 38.7% spent less than 40% of their
day in general education, and 9% of students with autism were educated at a separate school,
indicating increases in the prevalence of inclusion in general education in just two years
(Individuals with Disabilities Education Act (IDEA) Data, 2006).
Yet students with autism have complex educational needs that require comprehensive
services, making it a significant challenge to provide them with an appropriate education
regardless of setting ( Simpson et al., 2003). An oft-cited challenge of inclusion is a lack of
systematic or skilled support in these settings for students with autism (Volkmar, Lord, Bailey,
Schultz, & Klin, 2004). Many teachers and paraeducators working with students with autism
simply do not have adequate training in evidence-based methods for teaching and managing the
behavior needs of these children (Bryson, Rogers, & Fombonne, 2003; Williams, Johnson, &

IEP Goals and Services 4
Sukhodolsky, 2005). Additionally, the idea of maintaining a continuum of service delivery
options is considered standard in the educational landscape. While benefits of inclusion have
been noted for students with significant disabilities (e.g. Causton-Theoharis & Malmgren, 2004;
Cawley, Hayden, Cade, & Baker-Kroczynski, 2002; Dore, Dion, Wagner, & Brunet, 2002; M.
Fisher & Meyer, 2002; Hedeen & Ayres, 2002; McCleskey, Henry, & Hodges, 1998; Meyer,
2001), many families and professionals prefer specialized placements for students with autism.
For all students receiving special education services, whether included in general
education or instructed in special education settings, special education teams are required to
develop student Individual Education Programs (IEPs) for all students receiving special
education services. The IEP must contain several key components, including: (1) a description
of what kind of special education program a student will receive, (2) what related services a
school district will provide to the student with disabilities, and (3) measurable annual goals and
objectives (Drasgow, Yell, & Robinson, 2001). A description of the educational program
includes the setting in which education will be delivered, including the amount of time students
will spend in general education and a rationale for that decision. Educational services, such as
speech therapy or paraeducator support, are also described in terms of their frequency, duration,
and educational purpose. Educational goals and objectives, as outlined by the Individuals with
Disabilities Education Act (2004), have two purposes: (1) to enable the child to be involved in
and progress in the general curriculum, and (2) to meet the child’s other educational needs that
result from his or her disability (Individuals with Disabilities Education Improvement Act,
2004). Lastly, IEP goals and objectives are intended to be written so students make reasonable
progress on goals within the time frame allowed (Drasgow et al., 2001) while providing an
educational benefit to the student with disabilities (Shinn, 2007).
IEP Goals and Services 5
Despite these legal mandates, teachers struggle with how to provide access to the general
education curriculum for students with significant disabilities such as autism (Clayton, Burdge,
Denham, Klienert, & Kearns, 2006). Many teachers believe that establishing connections to the
general education curriculum is less important for students with significant disabilities, such as
autism, than for students with more mild disabilities, such as Attention Deficit Disorder,
resulting in instruction based on content outside of general education standards for students with
significant disabilities (Lee, Amos, Gragoudas, Lee, Shogren, Theoharis, & Wehmeyer, 2006).
As for all students, the purpose of the IEP for students with autism is to obtain access to
and participation in an appropriate educational program in the least restrictive environment.
Students with autism have complex educational needs due to the nature of autism: students with
autism have needs in communication, social skills, behavior and sensory regulation; students
with autism also often have co-morbid conditions such as mental retardation; and finally students
with autism have wide ranging skill development needs along with skill generalization
requirements (Simpson, 2003). As such, the development of academic skills for students with
autism is often overlooked, with IEP goals and services focused instead on the core symptoms of
autism (Wilczynski et al., 2007).
An absence of academic goals can result in more restrictive placements with less access
to the general education curriculum and diminished contact with typical peers and experiences
(Boutot & Bryant, 2005; D. Fisher & Frey, 2001; Taylor, 2004). This limited access to the core
general education curriculum may serve to further limit skill development and may be based on
assumptions that students with autism cannot learn academic skills in a useful manner
(Greenspan & Wieder, 2006). Despite the limited focus on academic skill development for
students with autism, the growing increase in the number of students with autism in public
IEP Goals and Services 6
schools necessitates an increased understanding of the skills and needs of these students. Yet
there is little recent information described in the literature related to IEP development and
resulting skill development for students with autism, subjecting IEP teams to rely on judgment
and experience rather than empirical evidence when developing goals, services, and programs for
students with autism (Wilczynski et al., 2007).
While all IEP goals and services are by definition individualized and unique to the
individual needs of students, variables including setting (inclusion and non-inclusion) and grade
may influence IEP team decisions when developing IEP programs and goals for adolescents with
autism. Thus, three questions are addressed in this study with the aim of providing additional
information for the IEP teams of students with autism. First, what appear to be areas of focus in
IEP goals for students with autism? Second, what seem to be trends in goals and objectives as
students with autism enter adolescence? Finally, do IEP goals and objectives appear to vary by
student placement in inclusion and non-inclusion settings?
IEP Goals and Services 7
Method
Participants
Five special education teachers and fifteen adolescents with autism participated in the
study. Students and teachers were recruited for participation in the study via a letter sent to
school administrators. Due to the difficulty of establishing contact with school administrators,
three school districts were ultimately enrolled in the study, although six districts were contacted.
The districts contacted represented diverse student populations and methods of educating
students with autism in Northern California. Participants did not receive incentives for
participation in the study, although of the three school districts in which contact was made with
school administrators, a 100% response and participation rate was obtained for both students and
teachers. Upon gaining permission from school administrators, the principals identified and
invited teacher participants, who in turn identified possible student participants. Teachers
contacted and invited parents and students to consent to participation in the study. Signed assent
and consent forms were obtained from students, parents, and teachers.
Adolescents with Autism. Fifteen students with autism (12 males and 3 females)
participated in this study. These students had independent diagnoses of autism; none of the
students had a diagnosis of Asperger Syndrome. To determine the long-term impact of inclusion
or non-inclusion in general education, the student participants were in middle school at the time
of the study, or between sixth and ninth grade, when students typically enter adolescence and
exit elementary and enter secondary school. Student participants met the following criteria: (1)
The students in this study have diagnoses of autism, rather than Asperger Syndrome or other
related conditions such as Pervasive Developmental Disorder (PDD). Youth with Asperger and
PDD are over-represented in the literature on autism, and as such are excluded from this study;
IEP Goals and Services 8
(2) Students in the study do not have any co-morbid conditions, ensuring that any differences are
due to autism and not other conditions such as Down syndrome; (3) The students are native
English speakers so that there is no confounding effect between English language learning status
and academic abilities; (4) The students have IEPs for the current school year, as well as IEPs
dating to at least Kindergarten to ensure that they are presently and continuously have been
enrolled in special education; and (5) The students have been continuously enrolled in either
inclusion or non-inclusion educational settings since Kindergarten.
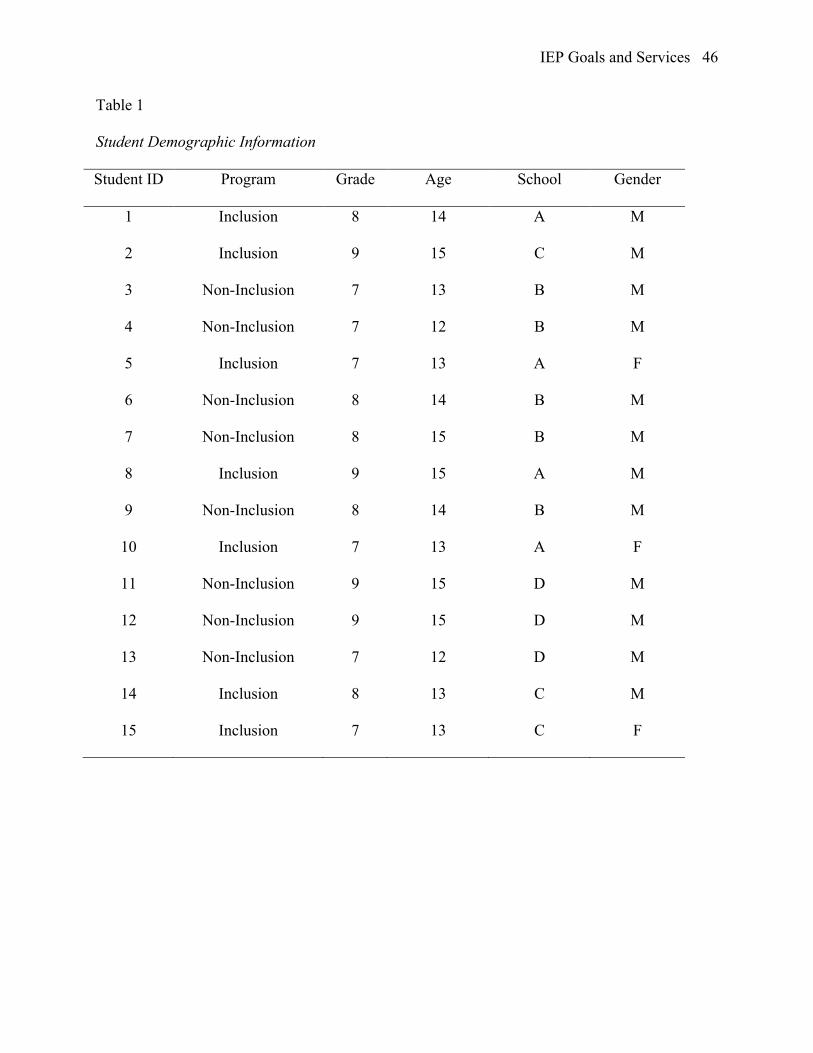
As shown in Table 1, seven students were enrolled in inclusion programs, spending 80%
or more of their instructional day in general education. These students received math and
language arts instruction in general education settings. Eight students were non-included,
spending less than 50% of their instructional day in general education and received their math
and language arts instruction in special education settings. The students were enrolled in four
schools in three school districts in Northern California.
<Table 1 here>
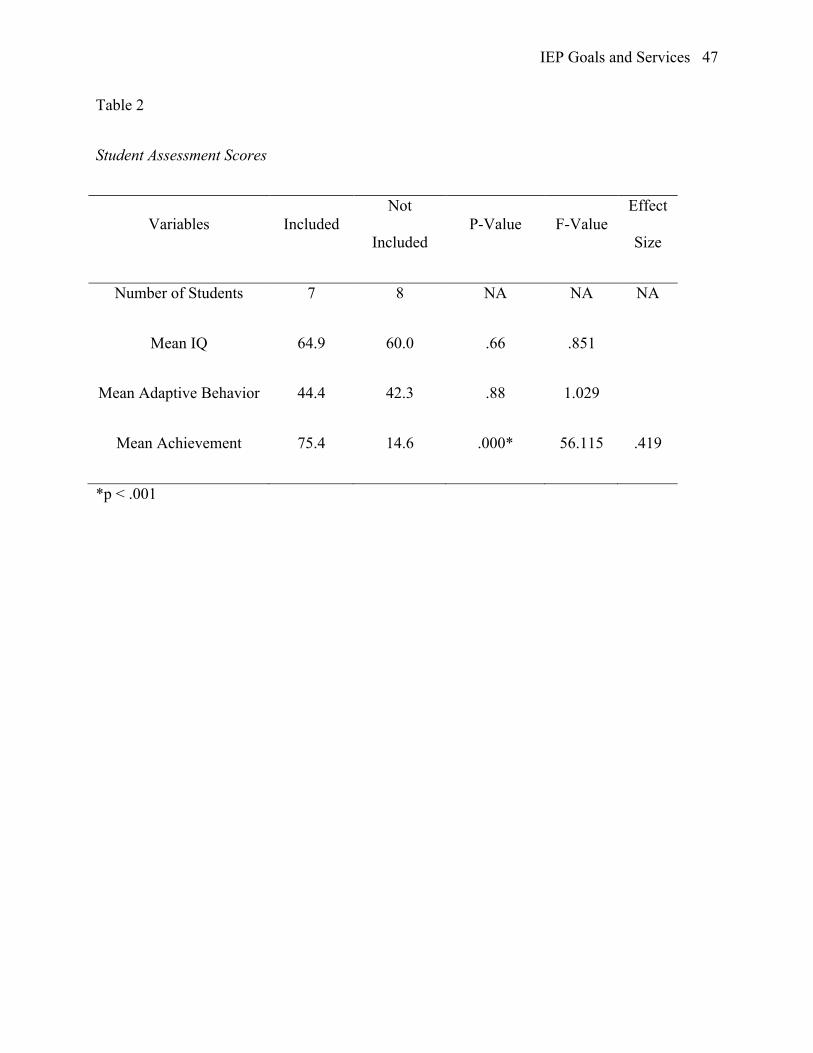
Efforts were made to determine the relative equivalence of students in both groups, using
cognitive, adaptive, and academic assessments (Ozonoff, Goodlin-Jones, & Solomon, 2005). As
depicted in Table 2, the mean IQ of student participants, as measured by Wechsler Intelligence
Scale for Children (WISC), were not significantly different as calculated using ANOVA
techniques, indicating that intelligence scores do not differ by placement. In other words,
IEP Goals and Services 9
students with more significant autism were not more likely to be placed in non-inclusion settings.
Likewise, the mean adaptive behavior score for these students, as measured by the Vineland
Adaptive Behavior Scales, was not significantly different by placement in inclusion and non-
inclusion settings, again indicating that skill level did not necessarily impact placement. The
mean academic achievement of students placed in inclusion and non-inclusion settings was
significantly different, however, demonstrating that those students in inclusion settings
performed significantly better on the Woodcock-Johnson Tests of Academic Achievement than
students who were not included. It is possible that placement in inclusion settings positively
impacted academic skill development, or that those students with higher academic aptitude were
more likely to be placed in inclusion settings.
<Table 2 here>
Special Education Teachers. The special education teachers included in this study are the
primary special education teachers for the focal students with autism in the study. The primary
teachers (also referred to as case managers) of the focal students with autism were selected for
participation in this study because they best know the needs and development of the students and
could assist in the records review. The teachers have case managed and taught the student
participants during middle school, or for the past one to three years, depending on the student’s
grade level. Furthermore, these teachers provide daily instruction to the adolescents with autism
in this study. The teachers are all fully credentialed by the state of California, and have a
minimum of two years of experience teaching special education, the necessary amount for a full
IEP Goals and Services 10
(Clear) credential in the state of California. All special education teachers had a clear credential
to teach students with severe disabilities (SH credential). Full credentialing was a criterion for
this study so that teacher preparation and experience do not confound student instruction or IEP
development.
Design
A quasi-experimental design was employed in this study, as random assignment of
students to inclusion and non-inclusion settings was not possible. Instead, students in existing
placements were evaluated. During the review of IEP records, placement decision discussions
were sought to determine why teams decided to place students in inclusion and non-inclusion
settings. Unfortunately, these decisions were rarely specified in student cumulative IEP records,
making it impossible to know why some students were included in general education and others
were not. However, teachers and principals described that two of the schools were not inclusive:
one was a school only for students with autism (school D), and another school had segregated
classes for students with disabilities on a general education campus (school B). The other two
schools, which were in the same school district, had “full inclusion” philosophies (schools A and
C), whereby all students with disabilities attended general education classes at their
neighborhood school. It appears, then, that residence greatly impacted placement decisions, so
that students who resided in non-inclusion districts were not included, while students residing in
inclusion districts were included.
Procedure
The cumulative Individual Education Plan (IEP) records for the student participants were
reviewed to determine the types and numbers of IEP goals, objectives, services, and curricular
adaptations from kindergarten through middle school for each student participant. These records
IEP Goals and Services 11
were obtained with permission from the parents of the student participants, their teachers, and
administrators overseeing the educational programs of the students. Each IEP record from
kindergarten through middle school for an individual student was analyzed. There was at least
one IEP record generated each school year as part of the student’s annual IEP meeting. Often,
however, IEP teams convened more than once a year to discuss changes in services, the needs or
concerns of IEP team members, or to discuss assessment results. In such cases, this IEP
addendum was also reviewed as part of this study.
The records were reviewed and coded on-site by the first author, at district or county
offices, where such records were stored. A coding sheet was developed to allow for on-site data
collection (see Appendix A). Basic student demographic for each record was collected,
including student grade, setting (inclusion or non-inclusion and percent of time in general
education), the date of the meeting, and any plans included in the IEP (namely behavior support
plans or health care plans). Next, information on academic goals was collected. Academic goals
were divided between reading, writing, and math skill areas, as determined by the teachers who
wrote the goal. Any baseline information provided by teachers pertaining to these academic
goals was recorded. For example, in a reading goal area, a teacher could record the baseline
information that a student decodes all letter names and reads five high-frequency sight words.
Next, the method of determining this baseline information was recorded. That is, did
teachers report assessment results or anecdotal information? The IEP objectives in each content
area (math, reading, and writing) were recorded verbatim next. The progress monitoring strategy
incorporated into each objective was also recorded, including the persons responsible for
measuring the student’s goal progress. Next, the California content standard the goal was based
on was also described. In such cases when no standard was cited, the appropriate standard was

IEP Goals and Services 12
found by examining the California Content Standards to determine and cite the appropriate
standard (Ong, 1998, 1999). In cases when goals were not based on California standards, a non-
standard (functional or compensatory) category was created and cited (Browder et al., 2003).
Goals were deemed non-standard when both authors agreed that the goal was not tied to any
derivation of a California state standard. Finally, a notation was made if the teacher reported the
goal was met or unmet.
Number and Types of Goals. To determine the role of non-academic goals and objectives
in student IEPs, the number of communication, social, motor/sensory, self-help, and behavior
goals were also recorded. Goals were coded by the first author and subsequently checked for
errors. The goals coded were included in one of these groups based the following criteria:
Communication goals are those goals addressing all communication areas, including developing
non-verbal communication through means such as the Picture Exchange Communication System
(PECS), improving articulation, and improving pragmatics. Motor and sensory goals address
fine and gross motor skill development as well as sensory regulation, such as the use of tactile
brushes to soothe students. Self-help goals address independence and self-care skills. Finally,
behavior goals targeting improving on-task, appropriate behaviors as well as goals to reduce
inappropriate behaviors were also noted.
Curricular Standards for Goals. Upon completion of IEP goal data collection, it became
apparent that another layer of analysis was needed. A second data collection form, found in
Appendix B, was used to note the content standard of the goal, its associated grade level, an
example of a goal, and then the students who had the goal and in which grade they had the goal.
This allowed an analysis of goal repetition, out-of-grade level goal documentation, and an
understanding of which goals were common to students in terms of type of goals, standard area,
IEP Goals and Services 13
and grade level of the standard. For example, it was found that a 7th grade student had a goal
based on a first grade reading comprehension standard in his 3rd, 4th, 5th, 6th, and 7th grades.
Adaptations and Services. In addition to describing goals and objectives, the curricular
adaptations and services developed to support student learning as part of the IEP were also
recorded. Again, while curricular adaptations and services are unique to individual student
needs, the types and amounts of accommodations and services provided in IEPs were reported to
determine if student age and placement impacted IEP team decision making regarding types and
amounts of adaptations and services. Curricular adaptations in the IEP serve to provide students
the supports and resources needed to access curriculum, such as providing students with
calculators to complete math problems or word-processors to participate in written expression.
Services were reported in terms of the type of service and the frequency and duration of that
service. Services included speech therapy, occupational therapy, paraeducator support, and
behavioral support services.
Data Analysis. Data analysis of the records review began by describing the number and
types of goals and services for each student. Descriptive statistics and frequency counts were
used to describe basic information about goals and services, including goals met, how progress
was monitored, and what standards goals were based on. To describe mean differences in goals
between adolescents who were and were not included in general education, a multivariate
analysis was computed to describe the impact of setting (inclusion versus non-inclusion) on the
dependent variables (types of goals). Statistical significance and effect sizes were calculated and
reported for each set of dependent variables. To control for power in this small sample size, the
alpha level was adjusted to a 0.15 level (Stevens, 1996).
IEP Goals and Services 14
Results
IEP Goals
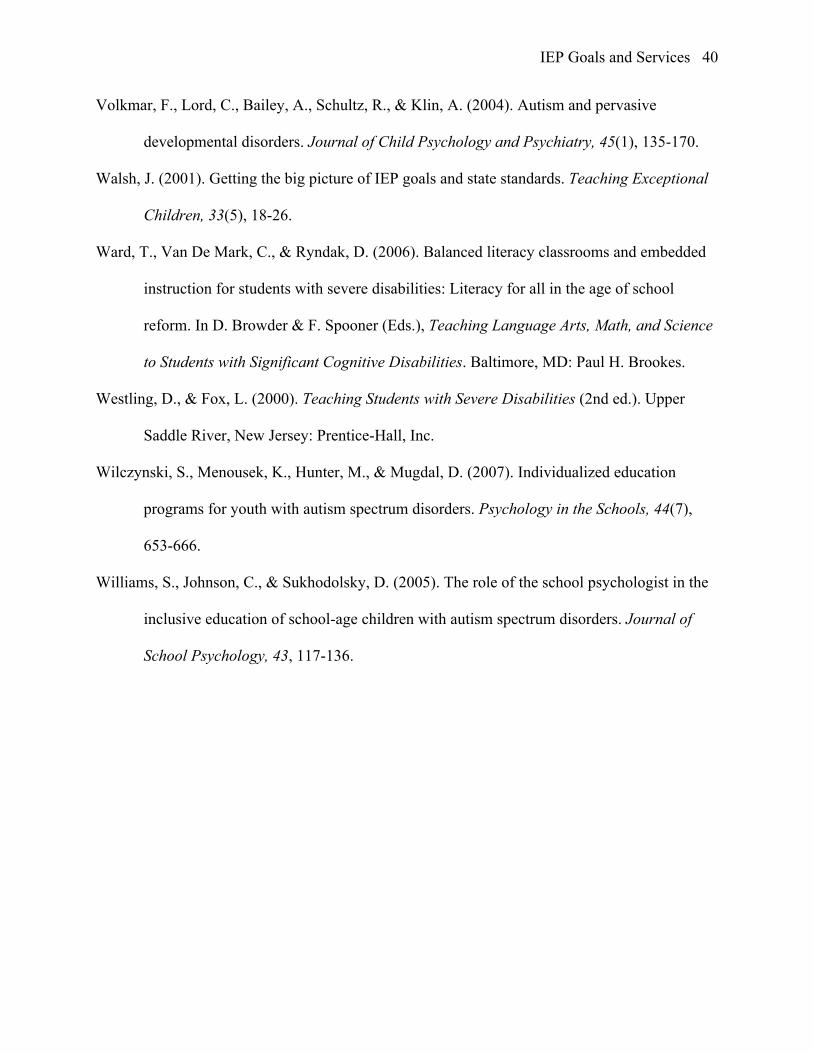
A review of the cumulative IEP files reveals that students have on average 19 IEP goals
each year. As shown in Figure 1, the average number of goals varies by age, with students
having more goals in elementary school (grades Kindergarten through 5) and fewer average
goals in middle school (grades 6 through 9). The number of goals rises between second and
sixth grades, and then begins to decline, so that at the transition from elementary to middle
school (grades 6-9), the number of IEP goals decreases for the students in this sample.
Instructional setting is also associated with number of IEP goals for students with autism:
students who are included have fewer average goals (average 12.4 goals each year between
Kindergarten and 9th grade) than students who are not included (average 18.5 goals each year
between Kindergarten and 9th grade).
<Figure 1 here>
Domains of IEP Goals. An analysis of student IEP goals reveals that goals fall within six
primary domains: communication, self-help, motor/sensory, social, academic, and behavior. For
all students with autism in this sample, communication goals constituted the largest percentage
of IEP goals, at approximately 40.7% of all goals for those students who are included and 37.3%
for students who are not included, as seen in Table 3. Self-help goals were the second most
frequent goals for both groups, followed by social goals for students who were included and
motor/sensory goals for students who were not included. For all students, academic goals
constituted a small percent of the total goals; 11.1% of all goals for students who are included
IEP Goals and Services 15
and 8.3% of all goals for students who are non-included. There were no significant between
group differences in terms of mean number of IEP goals in each domain. These results indicate
that most goals target core deficits in autism (communication) as opposed to academic
development (academic goals) for both groups of students.
<Table 3 here>
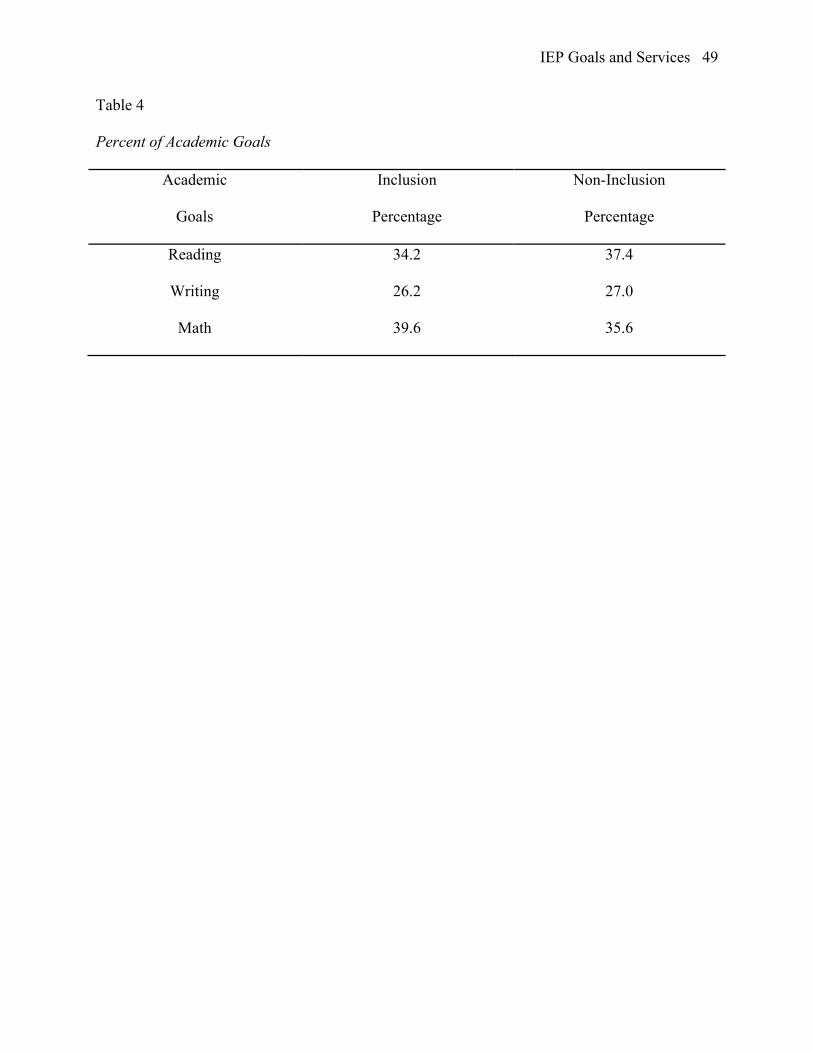
Within academic goals, students in both inclusion and non-inclusion groups have
approximately an equal proportion of reading, writing and math goals, with each goal area
constituting about 1/3 of the total academic goals.
<Table 4 here>
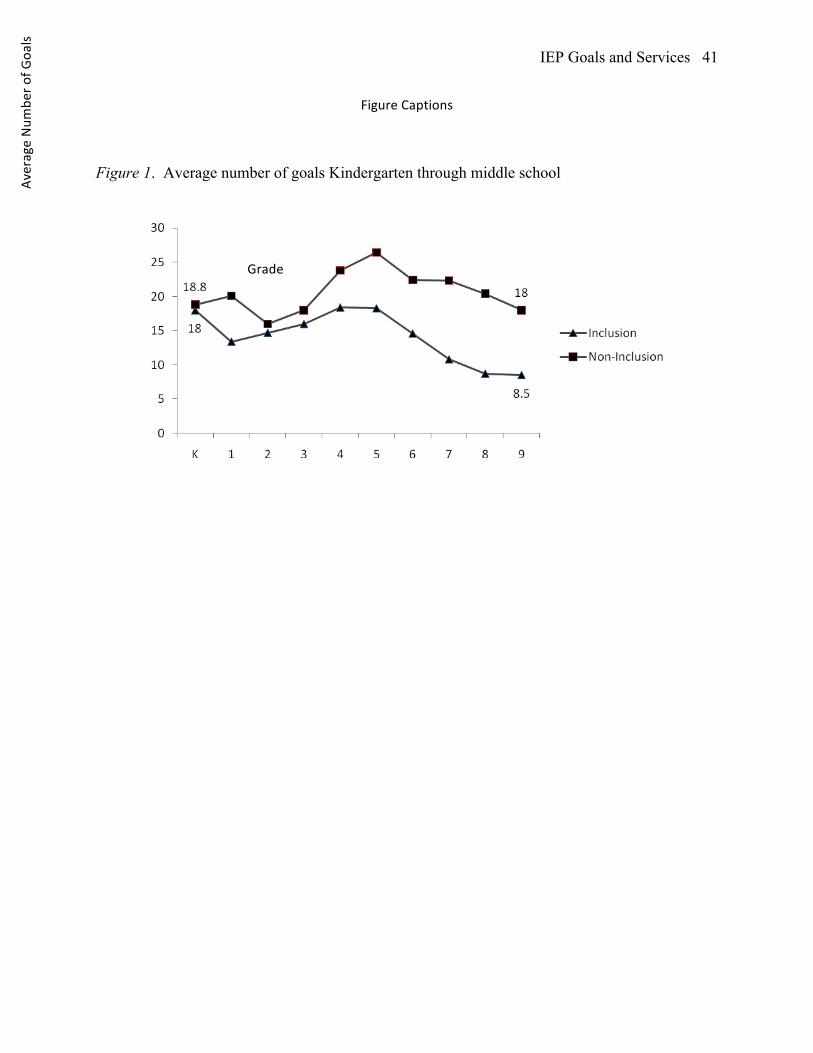
All academic goals in the sample were derived from Kindergarten through fourth grade
California content standards. For example, although a student is in 7th grade, he has goals
derived from a second grade content standard. Some goals were not based on California content
standards, and are referred to as non-standard goals. Although these goals are not California
state standards verbatim, the mode of the standard has been changed to address a learning need
for the student in the sample. For example, a non-standard reading goal in this sample was to
read a picture schedule. Reading picture schedules is not explicitly part of the core curriculum
in California, but addresses a learning need for a particular student and addresses reading for
IEP Goals and Services 16
meaning in an alternate mode. As shown in Figure 2, most of the goals for both students who are
included and non-included came from Kindergarten through second grade standards (65% and
70% respectively). The remaining goals came from third and fourth grade standards for the
students who are included and non-included (27% and 11% respectively). Approximately 9% of
the goals were non-standards based for the students who are included in general education,
whereas 19% of goals were non-standards based for students who were not included.
<Figure 2 here>
Although all students had an approximately equal number of total academic goals,
differences were found in the types of goals within each academic domain when IEP goals were
analyzed by English-Language Arts Content Standards for California (ELA Standards) (Ong,
1998). The ELA Standards identify three areas for reading in the Kindergarten through fourth
grade standards: (1) Word Analysis, Fluency and Vocabulary which addresses decoding words
fluently and accurately using phonics and sight reading strategies; (2) Reading Comprehension,
addressing reading for meaning; and (3) Literary Response and Analysis, which addresses
character analysis, figurative language, and other elements of text analysis. A fourth goal area,
non-standards based goals, was added during this analysis as some goals did not correspond
exactly with California standards.
IEP Goals by Setting. Between group differences were found in this analysis as depicted
in Table 5. Students in inclusion settings have more reading goals addressing reading
IEP Goals and Services 17
comprehension than any other area (48.8%), suggesting that priority needs for this group of
students involves reading for meaning and understanding. For students with autism who were
not included, the primary goal area was non-standards based reading skills (37.1%). A
multivariate analysis of variance was conducted to explore the impact of setting (inclusion versus
non-inclusion) on the four dependent variables (type of reading goal). To control for power in
this small sample size, the alpha level was adjusted to a .15 level (Stevens, 1996). Statistically
significant between group differences were detected in that students who are included have more
Reading Comprehension goals: F (1, 13) = 2.789, p = .119 with a large effect size, calculated
using eta squared, at .177. Statistically significant differences were also found in Literary
Response and Analysis goals: F (1, 13) = 5.648, p = .034; however, the students who are not
included had no Literary Response and Analysis goals in this sample. Finally, a significant
difference was found in non-standards based goals, with the students who are not included
having more non-standards based goals: F (1, 13) = 3.528, p = 0.83 and a large effect size of
.213.
<Table 5 here>
Similar between-group differences were found in writing goals. The California ELA
standards identify four writing areas in Kindergarten through fourth grade standards: Writing
Strategies, Writing Conventions, Listening and Speaking Strategies, and Speaking Applications.
Writing strategies goals include expressive writing via sentences and paragraphs, while Writing
Conventions addresses writing neatly with proper punctuation and capitalization. Listening and
IEP Goals and Services 18
Speaking Applications and Strategies address speaking in complete sentences and understanding
oral directions.
As shown in Table 5, students with autism who were included in general education had
writing goals addressing writing passages (Writing Strategies) in approximately 50% of their
writing IEP goals, while the students who were not included had goals largely addressing writing
conventions such as writing neatly and using proper punctuation (approximately 50% of their
writing goals). The students with autism who were included had statistically significantly more
goals addressing writing strategies than their non-included peers: F (1, 13) = 3.128, p = .100 with
a large effect size of .194 calculated using eta squared. While not statistically significant at p <
.15, the students who were not included had more non-standards based writing goals than
students who were included as shown with an effect size of .148, indicating that again, the
students who were not included were more likely to have writing goals not based on state
standards. Examples of non-standards based writing goals in this sample included stamping
one’s first name on a paper and composing a sentence using pictures.
Math goals were also analyzed using the Mathematics Content Standards for California
Public Schools Kindergarten Through Grade Twelve (Ong, 1999). The California Math
Standards fall into five domains in the Kindergarten through fourth grade standards: Algebra &
Functions, Number Sense, Mathematical Reasoning, Measurement & Geometry, and Statistics,
Data Analysis, & Probability. Algebra and Functions address sorting and classifying objects by
attribute. Number Sense includes counting and calculation. Mathematical Reasoning primarily
is concerned with determining the approach and materials needed to solve mathematics
problems, such as word problems. Measurement and Geometry addresses using tools, such as
clocks and rulers, to measure as well as understanding shapes and spatial relationships. Statistics

IEP Goals and Services 19
and Probability is concerned with patterns at the Kindergarten through fourth grade level.
Finally, a sixth goal area, non-standards based goals, was included for those goals that were not
related to the above mentioned California Math Standards.
As in reading and writing goal areas, significant between-group differences were found in
the math content standards for those students with autism who are included in general education
and those who are not. As depicted in Table 5, both students who were included and non-
included had math goals primarily drawn from the Number Sense goal area. That is,
approximately 70% of all math goals for both groups address counting and calculation. Closer
inspection reveals some group differences, however. Namely, while most goals for the students
who are included address the domain Number Sense, approximately 21% of their IEP goals
address mathematical reasoning, or the ability to set up and solve applied problems, while only
about 8% of the students who were not included had goals in this area. This finding is
statistically significant at F (1, 13) = 4.356, p = .057 and a large effect size of .251. The students
who were included had significantly more non-standards based math goals, although these goals
only account for 2.4% of all goals; none of the students who were not included had non-
standards based math goals. Finally, the students who were not included had statistically
significantly more Algebra and Functions goals. Again, however, this goal area only accounted
for 2.7% of their entire math goals; the students who were included had no Algebra and
Functions goals in this sample.
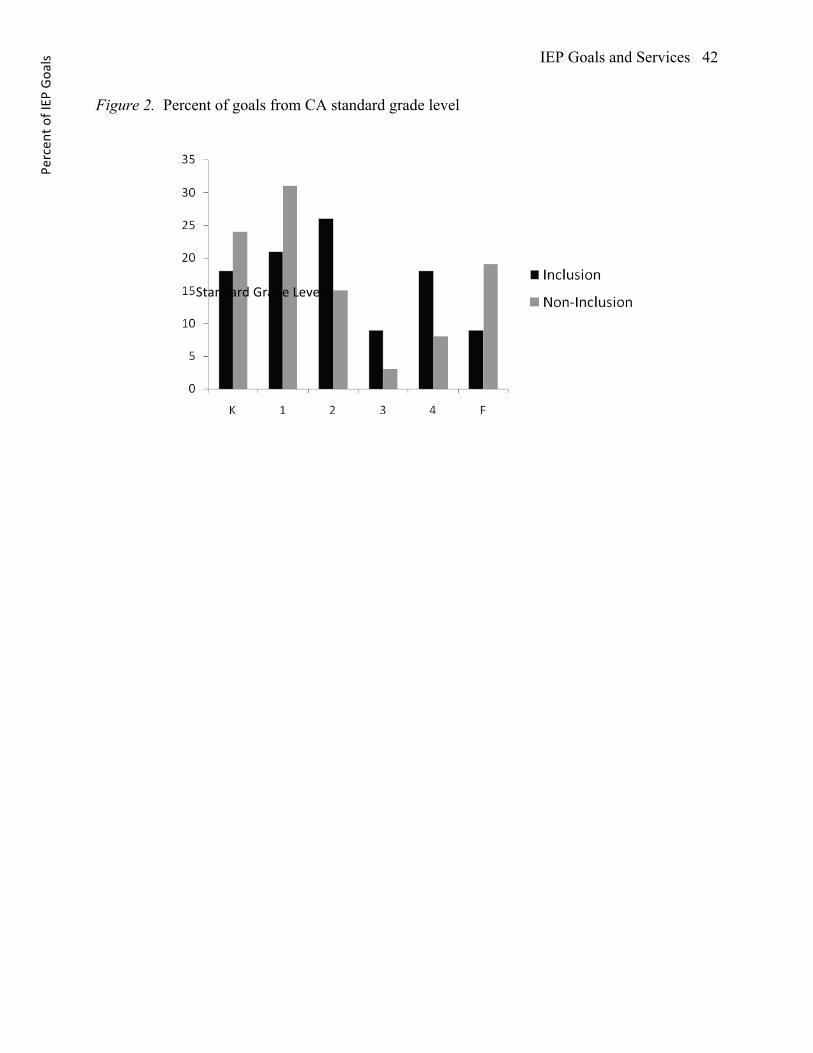
Progress in Meeting IEP Goals
The students with autism in this sample had goals derived from Kindergarten through
fourth grade content standards in addition to non-standards based goal areas. Despite having
goals based on early academic content areas, students were largely unsuccessful in attaining their
IEP Goals and Services 20
IEP goals in reading, writing, and math. As shown in Figure 3, students met on average fewer
than 70% of their IEP goals each year. Between-group differences in goal attainment are
evident. Those students who are included in general education met on average 55.3% of the IEP
goals between Kindergarten and eighth grade; those students who were not included met on
average 34.3% of their IEP goals between Kindergarten and eighth grade. Ninth grade progress
reports are not available for either group as students were currently in ninth grade at the time of
the study, and therefore their final goal progress for ninth grade was not yet available.
<Figure 3 here>
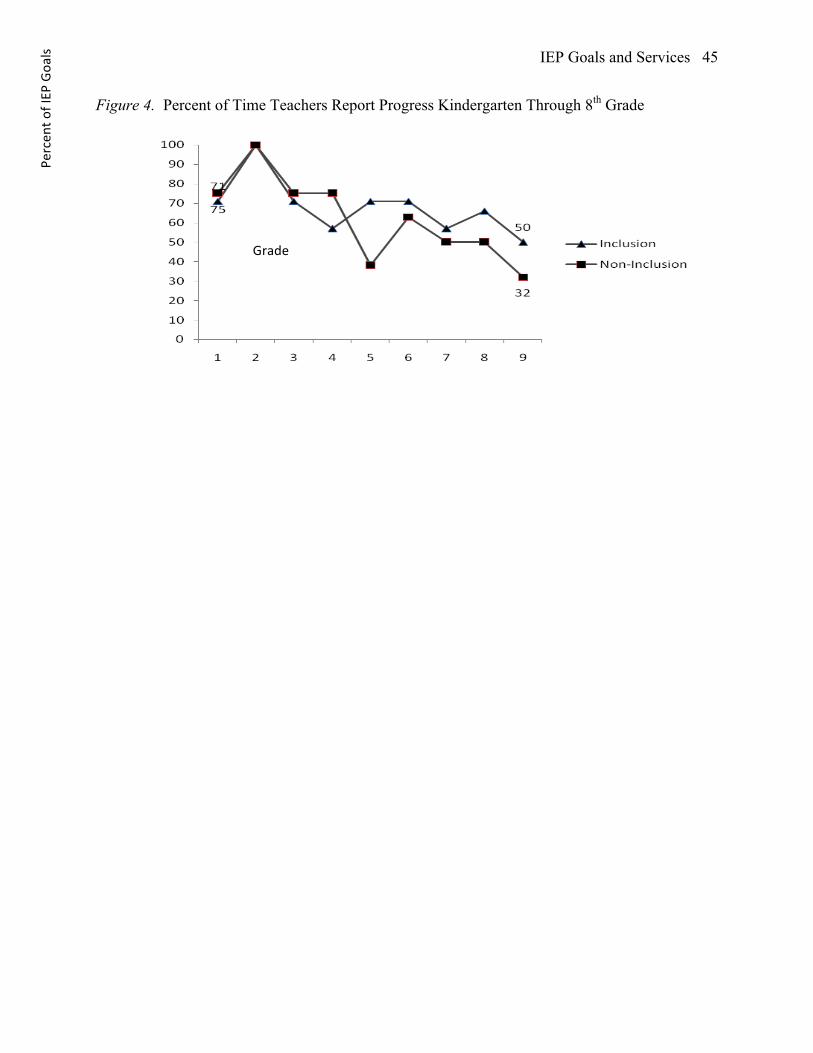
While students did not meet many of their goals, the teachers of these students did not
report goal progress a significant percentage of the time, with a substantial downward trend over
time as illustrated in Figure 4. In Kindergarten, special education teachers reported progress in
the cumulative file on average 75% of the time for the students who were included and 71% of
the time for the students who were not included. By eighth grade, progress was reported on
average only 50% of the time in the cumulative records for students who were included and 32%
of the time for students who were not included. Inspection of Figure 4 reveals that the teachers
of students in inclusion programs reported goal progress more frequently than teachers in non-
inclusion programs in five of the nine reporting periods. Overall, however, teachers in both
inclusion and non-inclusion programs did not report progress on IEP goals a substantial
percentage of the time. While it is possible that progress on IEP goals was reported to families
IEP Goals and Services 21
in some other form, no permanent record of this reporting could be found in the cumulative IEP
records. These findings are consistent with others who note that while monitoring student
progress on IEP goals is required under IDEA, there is less compliance with this component than
any other (Etscheidt, 2006).
<Figure 4 here>
As there was insufficient data to determine which academic goals were more or less
likely to be met by students with autism, the number of times a specific goal was repeated at
each IEP cycle was determined. It is assumed that when a goal is repeated, the student did not
adequately attain that goal and it was therefore repeated in the next IEP in hopes the student
would meet the goal with additional practice and instruction in the upcoming IEP year. For
example, a student had a math goal to state the name and value of four coins. This goal first
appeared in second grade, but was repeated without any change in third and fourth grade. In
such a case, the same goal appeared three times in the student records, suggesting to the
researchers that a plausible explantion is that the student was likely not successful in identifying
the coins in previous IEPs. However, it is important to note that IEP goals may have been
continued or discontinued for a variety of reasons, including the applicabilty and meaningfulness
of the IEP goal over time which is an area that requires further investigation in future studies.
In analyzing the IEP goals, it was determined that IEP goals appeared only one time
about 50% of the time. That is, in half of all goals the goal was discontinued after one year; it is
therefore assumed that half of the goals were met during the first year a student had the goal.

IEP Goals and Services 22
However, this indicates that half of the goals were not met during the initial year of instruction,
and were therefore repeated. As depicted in Table 6, the average number of times a reading goal
was repeated was 2.67 times for students who were included and 2.52 times for students who
were not included, indicating that the same reading goal appeared in a student’s IEP records for
on average 2 and a half years. Reading goals were the most likely goals to be repeated in both
groups, with the number of times a goal is repeated ranging from one to nine, indicating that
some students had the same reading goal for all 9 years of their education. Math goals were the
least likely to be repeated for both groups, with the number of times math goals being repeated
ranging from one to eight and 2.09 mean repeats for students who were included and 1.67 mean
repeats for students who were not included. Writing goals were repeated on average 2.32 times
for students who were included and 1.67 times on average for students who were not included
with a range of one to eight repeated goals.
<Table 6 here>
While there are no significant differences in the type of goals repeated for students who
are included and not-included in the three broad curricular areas, an inspection of the types of
goals reveals some statistically significant differences, as depicted in Table 7. For example,
students who were included were more likely to have repeated reading comprehension goals (on
average the same goal for 3.92 IEPs) while the students who were not included had more Word
Analysis goals repeated (on average the same IEP goal for 2.61 IEPs). Within the broad area of
IEP Goals and Services 23
reading, non-standards based goals were the least likely to be repeated (and presumably the most
likely goals to be met) while Reading Comprehension was overall the most likely to be repeated
(and presumably the least likely goal type to be met).
Among writing goals, writing strategies (writing sentences or paragraphs) was the most
likely goal to be repeated for both students in inclusion and non-inclusion programs. These goals
were repeated on average for 2.39 years for both groups, indicating students in both groups had
more success in meeting non-compositional writing goals, such as spelling, using correct
punctuation, and non-standards based writing skills. Students in both groups were overall most
successful in attaining their math goals in that these goals have the lowest mean number of
repeated goals, ranging from .25 to 1.99 mean repeated goals. Although only repeated
approximately twice, number sense, mathematical reasoning, and measurement and geometry
content areas were the most likely math goals to be repeated. Mathematical reasoning had the
highest mean number of repeated goals (2.5 for students who were included), indicating that
students were least successful in attaining their goals in this content area.
<Table 7 here>
Service and Adaptations
The number and types of IEP services and adaptations were collected from the student’s
cumulative IEP records to determine if age and setting influence services and adaptations written
into IEP documents. Adaptations are changes in the environment, instruction, or materials that

IEP Goals and Services 24
assist students in participating in an instructional activity (Westling & Fox, 2000). As illustrated
in Figure 5, the students in this study were provided with a number of adaptations within their
IEPs. Adaptations included adjustments to how students would be taught (“input”), such as
access to modified or alternative curriculum as well as adjustments to how students would
demonstrate their knowledge (“output”), such as allowing students to take alternative tests. Other
adaptations present included personnel adaptations such as consultation between professionals
serving the student, along with adaptations to support student learning style such as extended
time and the use of positive behavioral supports.
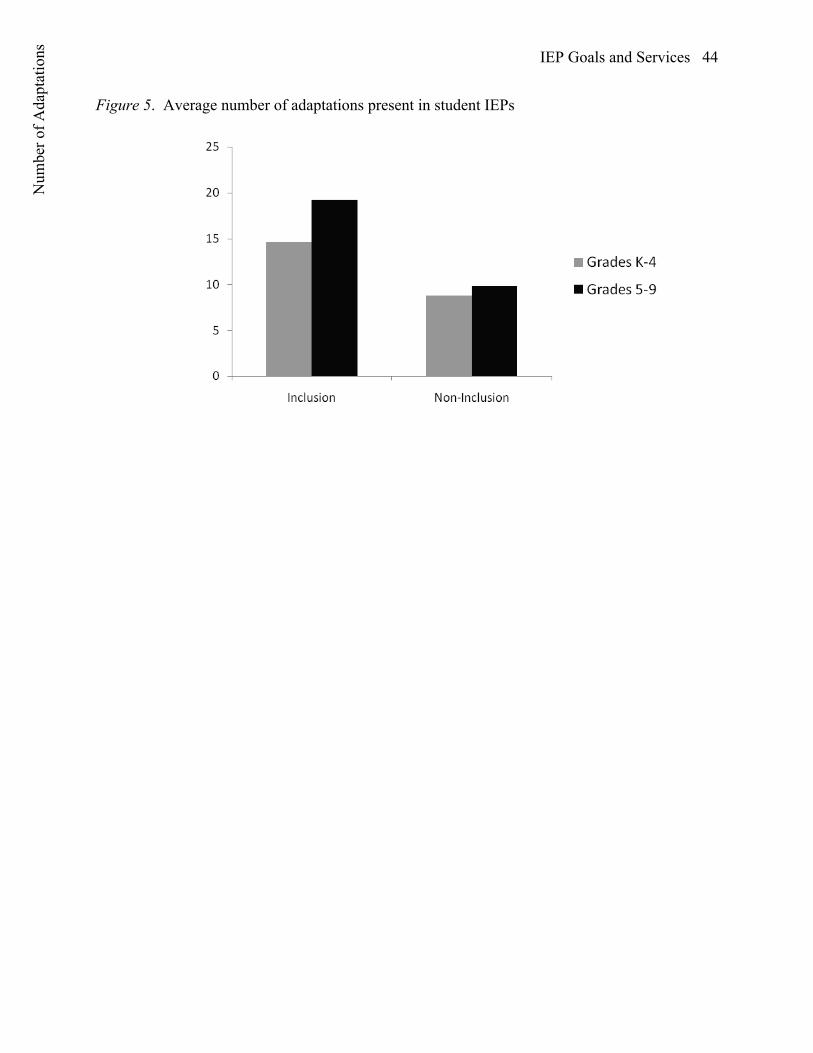
As seen in Figure 5, the number of adaptations present in student IEP varies by
placement and grade, although individual student needs must drive the development of
adaptations and services. Students in early elementary grades (Kindergarten through grade four)
have fewer adaptations than students in middle grades (grades five through nine). Likewise,
students in inclusion programs have more adaptations present in their IEPs than students who are
not included. Early elementary students in inclusion settings have on average 14.6 adaptations,
whereas students who were included in middle grades have on average 19.2 adaptations. This
suggests that as students enter higher grades with increasingly abstract curriculum (Mastropieri
& Scruggs, 2001), more adaptations are provided to students to enable access to and participation
in the curriculum. Furthermore, students who were not included have far fewer adaptations
within their IEPs across grade levels, suggesting that curricular changes that occur in general
education settings have a lesser impact on these students in that a personalized curriculum is
already being provided without the need for extensive adaptations, or that students who are not
included simply have less access to the core curriculum and thus less need for adapted materials.
IEP Goals and Services 25
<Figure 5 here>
The number of support services provided in student IEPs also varied by age and
educational setting. As shown in Table 8, four services appeared in student IEPs: speech and
language therapy (speech), occupational therapy (OT), paraeducator support, and behavioral
support. The grade of the students was significantly correlated with setting (inclusion versus
non-inclusion) and services (OT, Paraeducator, and Behavioral). Younger students with autism
(grades Kindergarten through four) were more likely to have OT services in their IEPs, while
older students (Grades 5 through 9) were more likely to have behaviorist and paraeducator
supports in their IEPs. Setting was also significantly correlated with paraeducator support, in
that students who were included in general education were more likely to have Paraeducator
supports written into their IEPs than students who were not included.
<Table 8 here>
Discussion
The students with autism in this study had a significant number of IEP goals and services
throughout their education. However, we found a shift in the number of goals, services, and
accommodations as students enter adolescence for both students who were included and students
who were not included. Students in elementary school had more goals than students in middle

IEP Goals and Services 26
school, along with more curricular adaptations in middle school. Students in elementary school
were more likely to have remedial services (e.g. occupational therapy) whereas students in
middle school were more likely to have support services (e.g. behaviorist and paraeducator
supports). While the type and amount of services and adaptations were correlated with student
placement in inclusion and non-inclusion settings, it is possible that factors such as student
maturation and development exerted a powerful influence on IEP team decision making as well.
Altogether, however, these results suggest that educational priorities shift as students enter
adolescence and that age appears to influence IEP development and content. During elementary
school, IEP teams developed more total goals, likely in an effort to remediate skill deficits while
participating in elementary grade curriculum. However, by middle school, curriculum becomes
more abstract and inferential, is delivered at a faster pace, and students are expected to work
independently and demonstrate adult-like work habits in terms of organization and thoroughness
(Mastropieri & Scruggs, 2001). When this curricular shift occurs, we found that students have
fewer goals, more curricular adaptations, and more support services.
As such, it appears that IEP teams have lesser expectations of student ability to
participate in the core general education curriculum over time. This is evident in the finding that
students did not have goals tied to middle school standards; middle school students were being
instructed in Kindergarten through fourth grade standards presumably because students lacked
the skills to access this more abstract curriculum. Furthermore, students were provided more
curricular adaptations likely because the students were being provided instruction that differed
from their same aged peers, thus necessitating curriculum adaptations. Finally, student IEPs
contained support services so student individualization needs, via paraeducator supports, could

IEP Goals and Services 27
be provided, along with behavioral supports so students would be provided positive supports to
maintain their ability to participate in school activities.
Students in inclusion and non-inclusion programs both had a high number of IEP goals
and services, along with limited success in attaining each of their goals. This suggests that
number of goals and skill development may have an inverse relationship. In other words, with
more goals, students become less likely to make sufficient educational progress to meet their
goals. Wilczynski and colleagues (2007) have suggested that providing a large number of goals
within IEPs can be detrimental in that sufficient time to teach the skills and monitor progress on
each goal is not feasible. This claim appears to be substantiated in the results of this study:
students had a high number of goals and were unlikely to meet their goals as evidenced by
teacher reports of goal progress and the frequency with which IEP goals were repeated. It is
likely that students did not receive the amount of instruction needed to make reasonable progress
on each goal. Other factors certainly contribute to student IEP progress, including the quality of
instruction and relevance of goals to the daily lives of students. However, the sheer volume of
goals present in this sample indicate that even high quality teachers delivering instruction
focused on high quality goals would have insufficient time and attention to adequately provide
instruction for each goal.
Likewise, teacher ability to monitor progress on each goal was clearly lacking in this
sample. Teachers were unsuccessful in reporting goal progress a large percentage of time,
indicating that perhaps there were simply too many goals, services, and accommodations to
balance within each IEP. It is likely that teachers were unable to devote adequate time and
resources to provide instruction in and measure progress on each goal. This balancing act is
further complicated when No Child Left Behind and IDEA’s requirements for participation in
IEP Goals and Services 28
and access to the core general education curriculum are accounted for. Teachers have the task of
not only providing instruction in IEP goals and objectives that target individual learning needs,
but also of providing instruction in the core curriculum. With a large number of IEP goals,
teachers likely did not have enough instructional time to provide adequate instruction in each
area. It is possible that teachers would be more successful in allocating appropriate instructional
time on each goal if there was more similarity between IEP goals and the core curriculum.
The results of this study further indicate significant differences in educational programs
for students with autism who are placed in inclusion and non-inclusion settings. Although the
students in the sample had statistically equivalent intelligence and adaptive behavior skills, the
types of educational goals in student IEPs varied by setting. Students who are included in
general education have more IEP goals targeting higher-order academic skills such as reading
comprehension, writing passages for expressive communication, and solving word problems.
Students in non-inclusion programs had goals primarily addressing functional rote and
procedural learning tasks such as writing neatly, calculating sums and differences, and reading
word lists. Altogether, these results suggest that educational setting influences IEP development
and contents.
While students who were included also had goals derived from Kindergarten through
fourth grade standards, their goals were more likely to reflect applied skills, suggesting students
received instruction in these skill areas and participated in higher order thinking skills such how,
when, and why to apply these procedures. These problem solving skills have both academic and
quality of life applications. Academically, the ability to solve increasingly complex problems
allows one to progress in a curriculum and achieve greater skill development. This is evidenced
in the introductory statements in both the California Mathematics and English Language Arts
IEP Goals and Services 29
content standards. Both acknowledge the foundational nature of procedural and rote tasks but
insist these foundational skills should lead to participation in and understanding of the applied
uses of these skills. For example, the ELA standards note that “It is assumed that earlier skills
are foundational and requisite for later, more complex higher-order skills and knowledge” (Ong,
p. 10, 1998).
In this study, we found that regardless of age, students in non-inclusion settings were
more likely to have goals addressing procedural skills rather than applied skills, suggesting they
were likewise not receiving instruction in the applied uses of these skills. In terms of quality of
life outcomes, the ability to solve problems and apply knowledge has broad implications.
Applied instruction and learning advances competence and independence in that students learn to
identify, solve, and self-monitor the problems and potential solutions within their own lives
(Agran, Blanchard, Wehmeyer, & Hughes, 2002). While the IEP is a highly individualized
document, it appears that IEP teams consider student placement in developing goals. It further
appears that placement in non-inclusion settings limits student skill development via access to
higher order skill instruction.
Limitations and Implications
In all, the results of the present study suggest that placement and age may influence IEP
team decisions and IEP development for adolescents with autism. That is, IEP teams appear to
be influenced both by individual student characteristics and student age and placement when
developing IEP goals, services, and adaptations. This is striking given that IEP contents (i.e.
goals, adaptations, and services) are intended to be driven solely by individual student need.
Based on the findings of this study, it appears that teachers may consider classroom settings and
IEP Goals and Services 30
the age of students as important factors in student IEP development. More research is needed to
understand the basis for these IEP team decisions and to determine why and how the variables of
placement, age, and disability diagnosis influence the content of student IEPs.
Emerging research indicates positive student outcomes when instruction and IEP goals
are tied to state standards (Browder, Spooner, Wakeman, Trela, & Baker, 2006; Clayton et al.,
2006; Cushing, Clark, Carter, & Kennedy, 2005; D. Fisher & Frey, 2001). For example,
Browder and colleagues (2006) note that by linking goals to grade level standards, students are
provided with a sequential and increasingly challenging curriculum. Despite the good intentions
of linking IEP goals to state standards, in practice teachers struggle with how to effectively
accomplish this (Agran, Alper, & Wehmeyer, 2002; Browder, Spooner et al., 2006; Flowers,
Ahlgrim-Delzell, Browder, & Spooner, 2005; Lynch & Adams, 2008; Walsh, 2001). Continued
research is needed to describe how to effectively incorporate IEP goals and individualized
instruction within the context of the general education curriculum, particularly in secondary
schools.
Furthermore, the importance of a challenging and sequential curriculum cannot be
underestimated for students with autism. The curriculum provided in general education is
generally tied to state content standards and assessments, ensuring that teaching practice targets
the skills students need to meet standards and pass mandated assessments (Browder, Wakeman,
& Flowers, 2006; Ward, Van De Mark, & Ryndak, 2006). Often, however, it has been our
experience that special education curriculum is rather piecemeal, largely because special
educators use a catalog approach to selecting and implementing curriculum (Spooner &
Browder, 2006). For example, a special education teacher wishing to address a goal related to
telling time may purchase and use a workbook, or pages from a workbook, addressing telling
IEP Goals and Services 31
time. While the IEP goal is being targeted for instruction, a scope and sequence for this
instruction is missing, and as a result the student may not receive increasingly challenging
instruction or instruction in generalized contexts.
This suggests the importance of providing instruction based on general education
curriculum to students with autism. A strong research base further supports the success of
embedding IEP goals into general education curriculum (e.g. Jameson, McDonnell, Johnson,
Riesen, & Polychronis, 2007; Johnson, McDonnell, Holzwarth, & Hunter, 2004). By providing
instruction in IEP goals alongside with instruction in core curriculum, students with autism are
provided instruction that targets individualized, functional needs, while also accessing and
participating in a challenging curriculum. Thus, aligning IEP goals to content standards is not
inconsistent with providing a unique, special education to students with autism, neither it is an
expectation that students with autism should perform at grade level. Rather, alignment ensures
that instruction is based on a challenging core curriculum that will enable students to make
academic progress at his or her individual level. As previously discussed, academic progress has
life enhancing implications in terms of developing work and independence skills. In short,
aligning IEP goals to content standards provides instruction that is based on, not necessarily
equivalent to, the core curriculum. Further research is needed to describe methods for adapting
the core general education curriculum to be meaningful and enriching for adolescents with
autism.
In addition aligning IEP goals with state standards in general education, teachers must
also develop and implement effective data collection strategies for monitoring student progress
on IEP goals. Data help teachers evaluate the success of their teaching, to document skill
acquisition, and to determine when more instruction or supports are needed (Raver, 2004;

IEP Goals and Services 32
Stecker, Lembke, & Foegen, 2008). Additionally, data provides authentic measures of student
ability in day-to-day situations in naturalistic contexts (Gettinger & Stoiber, 1998). Clearly, on-
going data collection is an important tool for special education teachers to utilize during their
regular instruction and assessment routines. As demonstrated in these results, however, teachers
were not successful in documenting student progress on IEP goals, suggesting teachers were
likewise unsuccessful in documenting student progress with routine data collection. This
illustrates the need to provide teachers with efficient, effective and objective data collection
procedures that can be used with relative ease across settings. More research is needed to
describe effective and efficient methods to collect and report progress data.
The results of this study indicate positive outcomes for students with autism who are
included in general education settings. Several limitations apply to the generality of these
findings, however. First, the small sample size and geographically limited nature of these
participants prohibits broad generalizations of these findings. Future research is needed to
recruit a larger number of student participants from geographically diverse areas, including urban
and rural areas. Second, the participants were not placed in inclusion or non-inclusion settings
by the authors, and we therefore were unable to carefully document why individual students
were placed in inclusion or non-inclusion settings. In the comments sections of some IEP
records, a discussion regarding placement was noted. In several instances students appeared to
be placed in “autism classes” simply by nature of having an autism diagnosis. However, one
school district in the study had a full-inclusion philosophy and no segregated classes existed, and
therefore all students were included by default. Efforts were made to match students by IQ and
adaptive behavior regardless of setting, but future studies are needed to control for placement
IEP Goals and Services 33
decisions and to further describe why students may or may not be placed in more restrictive
settings.
Third, our efforts to determine what kinds of IEP goals were more or less likely to be met
were thwarted by the lack of data recorded in cumulative IEP records for these participants.
Additionally, due to a lack of available data documenting student success in meeting IEP goals,
one plausible explanation appeared to be that repeated goals were those that had not yet been
mastered and discontinued goals were hypothesized to have been met. It is clear, however, that
a number of factors may contribute to a goal being retained or dropped from subsequent IEPs,
including the meaningfulness, age-appropriateness, and the value of the goals for the student.
Thus, future research is warranted to explore what kinds of goals students are more or less likely
to attain in various settings, controlling for these and other factors. Fourth, evaluating the quality
of goals and accommodations, including their meaningfulness to individual students and the
myriad of student variables that contribute to student goal progress, was beyond the scope of the
present study. The implementation of goals and accommodations from the written IEP document
to actual classroom practice was likewise not included in this study. Future research is needed to
determine the correlation between the quality of goals and accommodations in terms of student
meaningfulness and student progress in the curriculum, as well as the actual implementation of
written goals and accommodations in daily classroom life.
Additionally, this study is limited in that California standards were explicitly and
verbatim used to link IEP goals to state standards. As the field struggles to determine how goals
and standards are linked, this simplified strategy was used. As a result, it is possible that goals
were deemed “non-standard” when in fact they are associated with a different mode of a standard
(for example, reading a picture schedule addresses reading for meaning). Furthermore, only one
IEP Goals and Services 34
researcher coded IEP goals as relating or not relating to California standards. Thus, inter-rater
reliability was not undertaken due to the clear specifications of the alignment of IEP goals to a
standard. Future research is needed, however, to further our understanding of the linkages of
IEP goals to state standards in light of the potential bias inherent in this data analysis scheme.
Finally, the possibility of staff turnover impacting student IEP development and progress
monitoring was not accounted for in this study. Special education teachers experience a high
rate of turnover (Hunter Quartz, 2003), and as such students in special education may have a
different special education teacher each year. All students in our sample had numerous special
education teachers during the course of their education. It is possible that staff turnover plays a
role in what kinds of goals are developed and how progress is monitored. For example, a teacher
who has known a student for three years will have different information and presumably write
different goals for the student than a teacher who has known the student for only a few months.
Future research is warranted to determine the impact staff turnover has on student IEP
development and subsequent implementation and accountability.
IEP Goals and Services 35
References
Agran, M., Alper, S., & Wehmeyer, M. (2002). Access to the general curriculum for students
with significant disabilities: What it means to teachers. Education & Training in Mental
Retardation & Developmental Disabilities, 37(2), 123-133.
Agran, M., Blanchard, C., Wehmeyer, M., & Hughes, C. (2002). Increasing the problem-solving
skills of students with developmental disabilities participating in general education.
Remedial and Special Education, 23(5), 279-288.
Boutot, E. A., & Bryant, D. P. (2005). Social Integration of Students with Autism in Inclusive
Settings. Education & Training in Developmental Disabilities, 40(1), 14-23.
Browder, D., Spooner, F., Wakeman, S., Trela, K., & Baker, J. (2006). Aligning instruction with
academic content standards: Finding the link. Research and Practice for Persons with
Severe Disabilities, 31(4), 309-321.
Browder, D., Wakeman, S., & Flowers, C. (2006). Assessment of progress in the general
curriculum for students with disabilities. Theory into Practice, 45(3), 249-259.
Bryson, S., Rogers, S., & Fombonne, E. (2003). Autism spectrum disorders: Early detection,
intervention, education, and psychopharmacological management. Canadian Journal of
Psychiatry, 48(8), 506-516.
Causton-Theoharis, J., & Malmgren, K. (2005). Increasing peer interactions for students with
severe disabilities and their peers via paraprofessional training. Exceptional Children,
71(4), 431-444.
Cawley, J., Hayden, S., Cade, E., & Baker-Kroczynski, S. (2002). Including students with
disabilities into the general education science classroom. Exceptional Children, 68(4),
423-435.
IEP Goals and Services 36
Clayton, J., Burdge, M., Denham, A., Klienert, H., & Kearns, J. (2006). A four-step process for
accessing the general curriculum for students with significant cognitive disabilities.
Teaching Exceptional Children, 38(5), 20-27.
Connor, D., & Ferri, B. (2007). The conflict within: Resistance to inclusion and other paradoxes
in special education. Disability & Society, 22(1), 63-77.
Cushing, L. S., Clark, N. M., Carter, E. W., & Kennedy, C. H. (2005). Access to the general
education curriculum for students with severe disabilities: What it means and how to
accomplish it. Teaching Exceptional Children.
Dore, R., Dion, A., Wagner, S., & Brunet, J.-P. (2002). High school inclusion of adolescents
with mental retardation: A multiple case study. Education & Training in Mental
Retardation & Developmental Disabilities, 37(3), 253-261.
Drasgow, E., Yell, M., & Robinson, T. R. (2001). Developing legally correct and educationally
appropriate IEPs. Remedial and Special Education, 22(6), 359-373.
Etscheidt, S. (2006). Progress monitoring: Legal issues and recommendations for IEP teams.
Teaching Exceptional Children, 38(3), 56-60.
Fisher, D., & Frey, N. (2001). Access to the core curriculum: Critical ingredients for student
success. Remedial & Special Education, 22(3), 148-157.
Fisher, M., & Meyer, L. H. (2002). Development and social competence after two years for
students enrolled in inclusive and self-contained educational programs. Research &
Practice for Persons with Severe Disabilities, 27(3), 165-174.
Flowers, C., Ahlgrim-Delzell, L., Browder, D., & Spooner, F. (2005). Teachers' perceptions of
alternate assessments. Research and Practice for Persons with Severe Disabilities, 30(2),
81-92.
IEP Goals and Services 37
Gettinger, M., & Stoiber, K. (1998). Critical incident reporting: A procedure for monitoring
children's performance and maximizing progress in inclusive settings. Early Childhood
Education Journal, 26(1), 39-46.
Greenspan, S., & Wieder, S. (2006). Engaging autism: Using the Floortime approach to help
children relate, communicate, and think. Cambridge, MA: De Capo Press.
Hedeen, D. L., & Ayres, B. J. (2002). "You Want Me to Teach Him to Read?" Fulfilling the
Intent of IDEA. Journal of Disability Policy Studies, 13(3), 180-189.
Hunter Quartz, K. (2003). Too angry to leave: Supporting new teachers' commitment to
transform urban schools. Journal of Teacher Education, 54(2), 99-111.
Individuals with Disabilities Education Act (IDEA) Data. (2006). 2008, from www.ideadata.org
Individuals with Disabilities Education Improvement Act, H.R. 1350 (2004).
Iovnannone, R., Dunlap, G., Huber, H., & Kincaid, D. (2003). Effective educational practices for
students with autism spectrum disorders. Focus on Autism and Other Developmental
Disabilities, 18(3), 150-165.
Jameson, M., McDonnell, J., Johnson, J. W., Riesen, T., & Polychronis, S. C. (2007). A
comparison of one-to-one embedded instruction in the general education classroom and
one-to-one massed practice instruction in the special education classroom. Education and
Treatment of Children, 30(1), 23-44.
Johnson, J. W., McDonnell, J., Holzwarth, V. N., & Hunter, K. (2004). The efficacy of
embedded instruction for students with developmental disabilities enrolled in general
education classes. Journal of Positive Behavior Interventions, 6(4), 214-227.
Lee, S., Amos, A., Gragoudas, S., Lee, Y., Shogren, K., Theoharis, R., Wehmeyer, M. (2006).
Curriculum augmentation and adaptation strategies to promote access to the general
IEP Goals and Services 38
curriculum for students with intellectual and developmental disabilities. Education and
Training in Developmental Disabilities, 41(3), 199-212.
Lindsay, G. (2007). Educational psychology and the effectiveness of inclusive
education/mainstreaming. British Journal of Educational Psychology, 77(1), 1-24.
Lynch, S., & Adams, P. (2008). Developing standards-based individualized education program
objectives for students with significant needs. Teaching Exceptional Children, 40(4), 36-
39.
Mastropieri, M. A., & Scruggs, T. E. (2001). Promoting inclusion in secondary classrooms.
Learning Disability Quarterly, 24(4), 265-274.
McCleskey, J., Henry, D., & Hodges, D. (1998). Inclusion: Where is it happening? Teaching
Exceptional Children, 30, 4-10.
Meyer, L. H. (2001). The impact on inclusion on children's lives: Multiple outcomes, and
friendship in particular. International Journal of Disability, Development & Education,
48, 9-31.
National Center for Educational Statistics. (2005). Digest of Education Statistics Tables and
Figures, Table 52. Retrieved September 2006, from
http://nces.ed.gov/programs/digest/d05/tables/dt05_052.asp
Ong, F. (Ed.). (1998). English-Language Arts Content Standards for California Public Schools,
Kindergarten Through Grade Twelve. Sacramento, CA: Department of Education.
Ong, F. (Ed.). (1999). Mathematics Content Standards for California Public Schools,
Kindergarten through Grade Twelve. Sacramento, CA: Department of Education.
IEP Goals and Services 39
Ozonoff, S., Goodlin-Jones, B., & Solomon, M. (2005). Evidence-based assessment of autism
spectrum disorders in children and adolescents. Journal of Clinical Child and Adolescent
Psychology, 34(3), 523-540.
Raver, S. (2004). Monitoring child progress in early childhood special education settings.
Teaching Exceptional Children, 36(6), 52-57.
Shinn, M. (2007). Identifying students at risk, monitoring performance, and determining
eligibility within response to intervention: Research on educational need and benefit from
academic intervention. School Psychology Review, 36(4), 601-617.
Simpson, R. (2003). Policy-related research issues and perspectives. Focus on Autism and Other
Developmental Disabilities, 18(3), 192-196.
Simpson, R., de Boer-Ott, S. R., & Smith-Myles, B. (2003). Inclusion of Learners with Autism
Spectrum Disorders in General Education Settings. Topics in Language Disorders, 23(2),
116-133.
Spooner, F., & Browder, D. (2006). Why teach the general curriculum? In D. Browder & F.
Spooner (Eds.), Teaching Language Arts, Math, and Science to Students with Significant
Cognitive Disabilities. Baltimore, MD: Paul H. Brooks.
Stecker, P., Lembke, E., & Foegen, A. (2008). Using progress-monitoring data to improve
instructional decision making. Preventing School Failure, 52(2), 48-58.
Stevens, J. (1996). Applied multivariate statistics for the social sciences. Mahwah, NJ: Lawrence
Erlbaum.
Taylor, S. (2004). Caught in the continuum: A critical analysis of the principle of the Least
Restrictive Environment. Research & Practice for Persons with Severe Disabilities,
29(4), 218-230.
IEP Goals and Services 40
Volkmar, F., Lord, C., Bailey, A., Schultz, R., & Klin, A. (2004). Autism and pervasive
developmental disorders. Journal of Child Psychology and Psychiatry, 45(1), 135-170.
Walsh, J. (2001). Getting the big picture of IEP goals and state standards. Teaching Exceptional
Children, 33(5), 18-26.
Ward, T., Van De Mark, C., & Ryndak, D. (2006). Balanced literacy classrooms and embedded
instruction for students with severe disabilities: Literacy for all in the age of school
reform. In D. Browder & F. Spooner (Eds.), Teaching Language Arts, Math, and Science
to Students with Significant Cognitive Disabilities. Baltimore, MD: Paul H. Brookes.
Westling, D., & Fox, L. (2000). Teaching Students with Severe Disabilities (2nd ed.). Upper
Saddle River, New Jersey: Prentice-Hall, Inc.
Wilczynski, S., Menousek, K., Hunter, M., & Mugdal, D. (2007). Individualized education
programs for youth with autism spectrum disorders. Psychology in the Schools, 44(7),
653-666.
Williams, S., Johnson, C., & Sukhodolsky, D. (2005). The role of the school psychologist in the
inclusive education of school-age children with autism spectrum disorders. Journal of
School Psychology, 43, 117-136.
IEP Goals and Services 41
Figure Captions
Figure 1. Average number of goals Kindergarten through middle school
Average Num
ber o
f Goa
ls
Grade
IEP Goals and Services 42
Figure 2. Percent of goals from CA standard grade level
Standard Grade Level
Percen
t of IEP
Goa
ls
IEP Goals and Services 43
Figure 3. Progress in meeting IEP goals Kindergarten through middle school
Grade
Percen
t of IEP
Goa
ls Met
IEP Goals and Services 44
Figure 5. Average number of adaptations present in student IEPs
Num
ber o
f Ada
ptat
ions
IEP Goals and Services 45
Figure 4. Percent of Time Teachers Report Progress Kindergarten Through 8th Grade
Grade
Percen
t of IEP
Goa
ls
IEP Goals and Services 46
Table 1
Student Demographic Information
Student ID Program Grade Age School Gender
1 Inclusion 8 14 A M
2 Inclusion 9 15 C M
3 Non-Inclusion 7 13 B M
4 Non-Inclusion 7 12 B M
5 Inclusion 7 13 A F
6 Non-Inclusion 8 14 B M
7 Non-Inclusion 8 15 B M
8 Inclusion 9 15 A M
9 Non-Inclusion 8 14 B M
10 Inclusion 7 13 A F
11 Non-Inclusion 9 15 D M
12 Non-Inclusion 9 15 D M
13 Non-Inclusion 7 12 D M
14 Inclusion 8 13 C M
15 Inclusion 7 13 C F
IEP Goals and Services 47
Table 2
Student Assessment Scores
Variables Included Not
Included P-Value F-Value
Effect
Size
Number of Students 7 8 NA NA NA
Mean IQ 64.9 60.0 .66 .851
Mean Adaptive Behavior 44.4 42.3 .88 1.029
Mean Achievement 75.4 14.6 .000* 56.115 .419
*p < .001

IEP Goals and Services 48
Table 3
Percent of IEP Goals by Domain
IEP
Goal Domain
Inclusion
Goals by Domain
Non-Inclusion
Goals by Domain
Communication 40.7 37.3
Self-Help 17.7 20.8
Motor/Sensory 13.0 19.9
Social 15.4 9.8
Academic 11.1 8.3
Behavior 2.1 3.9
IEP Goals and Services 49
Table 4
Percent of Academic Goals
Academic
Goals
Inclusion
Percentage
Non-Inclusion
Percentage
Reading 34.2 37.4
Writing 26.2 27.0
Math 39.6 35.6
IEP Goals and Services 50
Table 5
Percent of Reading Goals by California Standard Area
Standard
Domain
Inclusion
Percentage
Non-Inclusion
Percentage
P-
Value
F-
Value
Effect
Size
Rea
ding
Sta
ndar
d D
omai
n
Word Analysis 28.9 30.7 .916 .011
Reading Comprehension 48.8 32.2 .119* 2.789 .177
Literary Response & Analysis 4.7 0 .034*** 5.648
Non-Standard / Functional 17.6 37.1 .083** 3.528 .213
Writ
ing
Stan
dard
D
omai
n
Writing Strategies 50.1 26.7 .100** 3.128 .194
Writing Conventions 41.2 49.7 .805 .063
Listening & Speaking 1.5 2.5 .651 .215
Speaking Applications 0 0 NA NA
Non-Standard / Functional 7.2 21.1 .156 2.269 .148
Mat
h St
anda
rd D
omai
n
Algebra & Functions 0 2.7 .059** 4.267
Number Sense 65.6 71.3 .502 .478
Mathematical Reasoning 20.7 7.5 .057** 4.356 0.251
Measurement & Geometry 8.1 17.5 .535 .406
Statistics, Data Analysis… 3.2 1.0 .223 1.636
Non-Standard / Functional 2.4 0 .044*** 4.964
*Significant at p < .15; **Significant at p<.10; ***Significant at p<.05
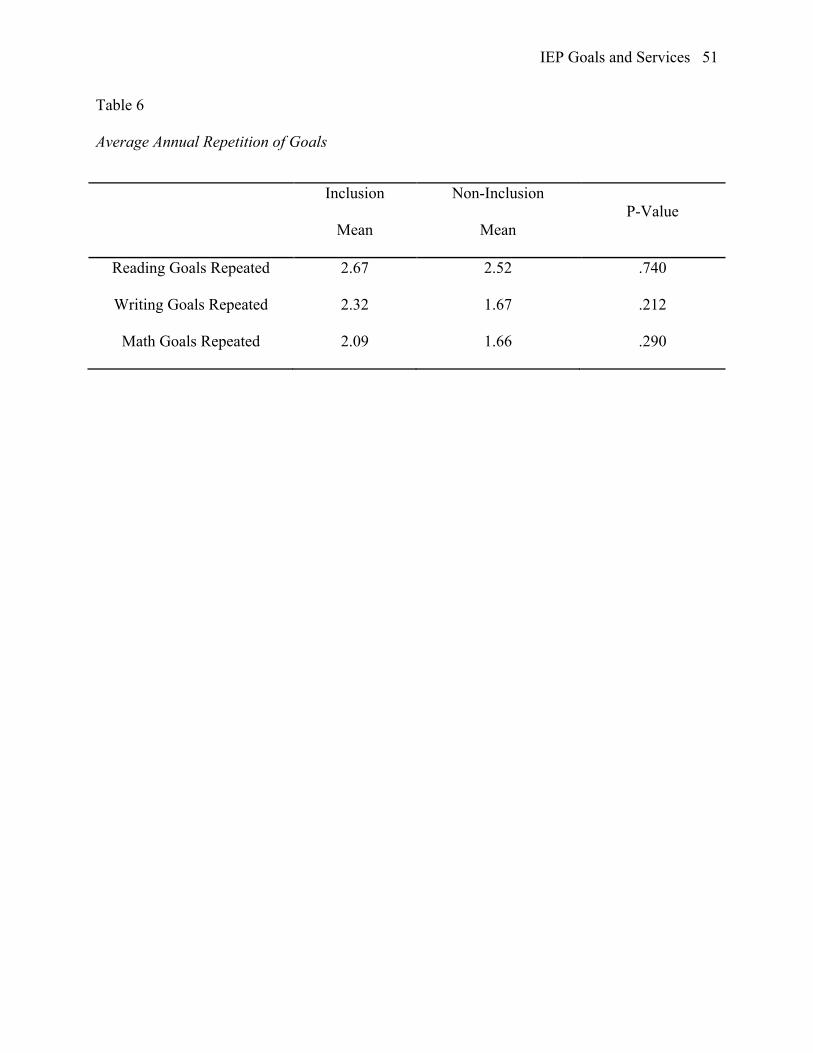
IEP Goals and Services 51
Table 6
Average Annual Repetition of Goals
Inclusion
Mean
Non-Inclusion
Mean P-Value
Reading Goals Repeated 2.67 2.52 .740
Writing Goals Repeated 2.32 1.67 .212
Math Goals Repeated 2.09 1.66 .290
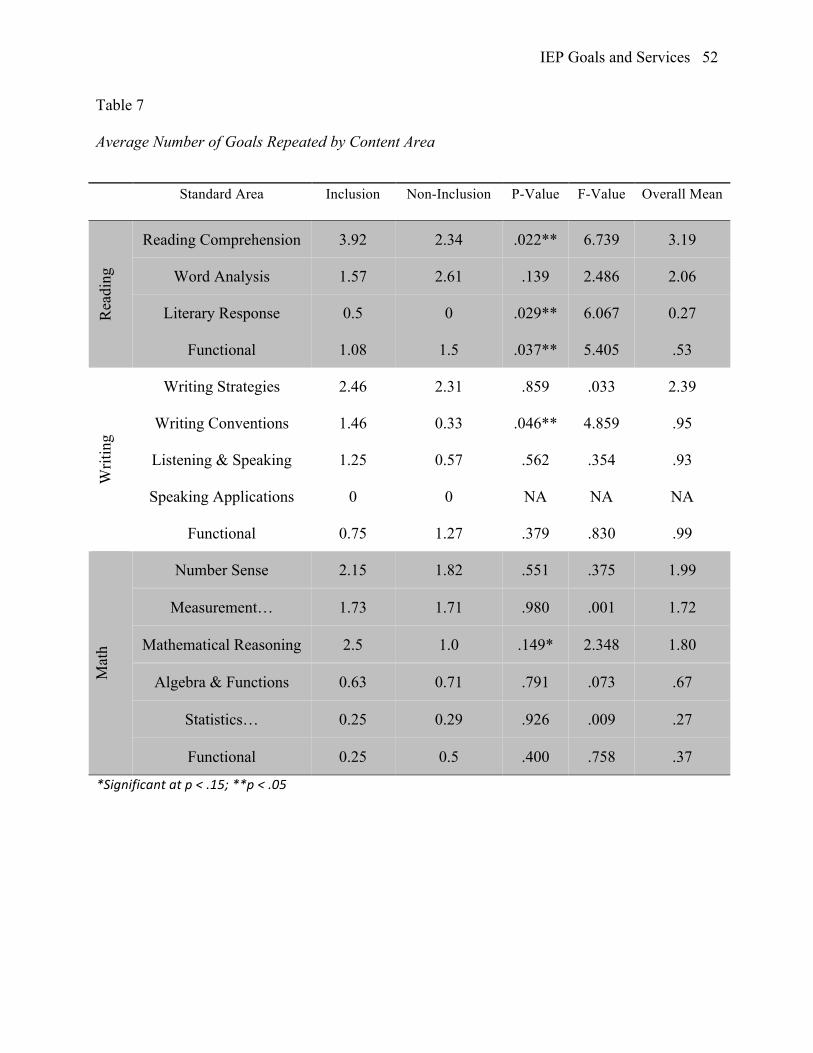
IEP Goals and Services 52
Table 7
Average Number of Goals Repeated by Content Area
Standard Area Inclusion Non-Inclusion P-Value F-Value Overall Mean
Rea
ding
Reading Comprehension 3.92 2.34 .022** 6.739 3.19
Word Analysis 1.57 2.61 .139 2.486 2.06
Literary Response 0.5 0 .029** 6.067 0.27
Functional 1.08 1.5 .037** 5.405 .53
Writ
ing
Writing Strategies 2.46 2.31 .859 .033 2.39
Writing Conventions 1.46 0.33 .046** 4.859 .95
Listening & Speaking 1.25 0.57 .562 .354 .93
Speaking Applications 0 0 NA NA NA
Functional 0.75 1.27 .379 .830 .99
Mat
h
Number Sense 2.15 1.82 .551 .375 1.99
Measurement… 1.73 1.71 .980 .001 1.72
Mathematical Reasoning 2.5 1.0 .149* 2.348 1.80
Algebra & Functions 0.63 0.71 .791 .073 .67
Statistics… 0.25 0.29 .926 .009 .27
Functional 0.25 0.5 .400 .758 .37
*Significant at p < .15; **p < .05
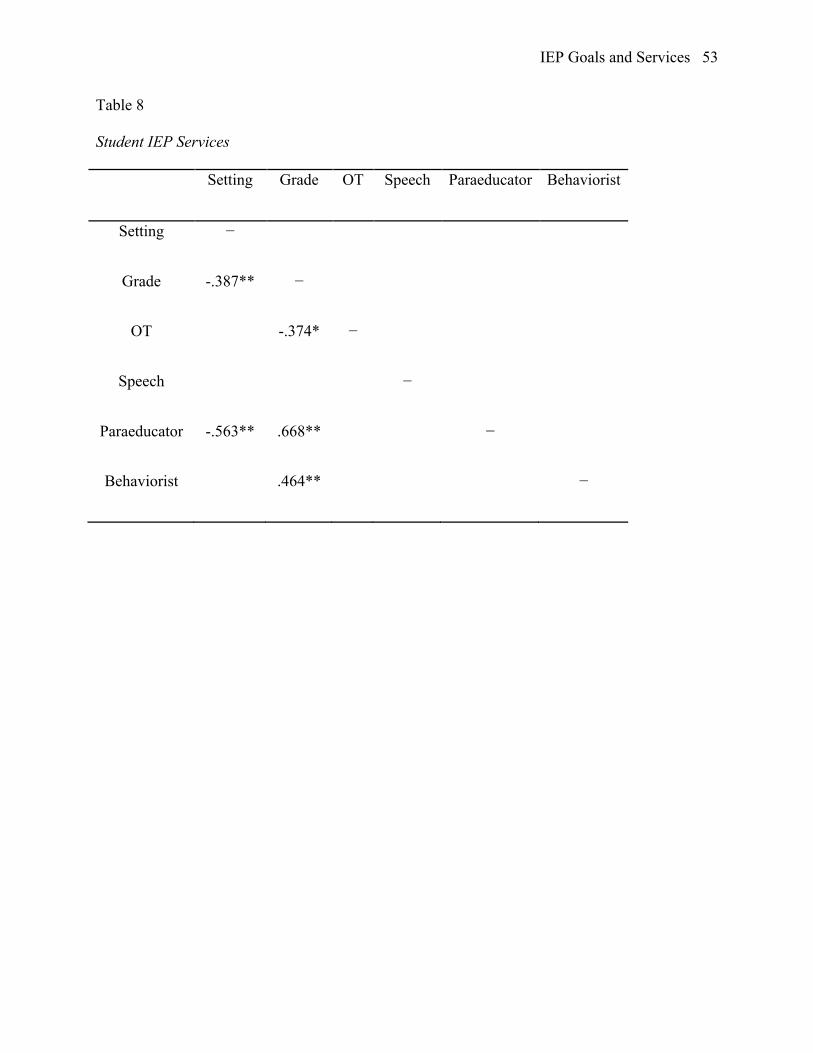
IEP Goals and Services 53
Table 8
Student IEP Services
Setting Grade OT Speech Paraeducator Behaviorist
Setting −
Grade -.387** −
OT -.374* −
Speech −
Paraeducator -.563** .668** −
Behaviorist .464** −
IEP Goals and Services 54
Appendix A: IEP Goals
Student ID #
Date:
Grade:
Setting:
Plans:
IEP Goals:
Area Baseline Info. Determined
By
Summarize
Objectives
Progress
Measured
By:
Standard Was
Goal
met?
Reading
Math
Writing
Total Academic Speech Social Motor Self-Help Behavior
# Goals
% of Total 100
Adaptations: (verbatim)
Services: (frequency and duration)
Speech/Language: Paraeducator: Other: Occupational Therapy: Behaviorist:
IEP Goals and Services 55
Appendix B: IEP Goals Analysis Form
Stan
dard
Fram
ewor
k
Goa
l Are
a
Stan
dard
Gra
de
Leve
l
Exam
ple
Stud
ent I
D
Gra
de o
f ID