IEG Working Paper 2010/7 - Independent Evaluation...
91
Transcript of IEG Working Paper 2010/7 - Independent Evaluation...


i
IEG Working Paper 2010/7
2010 The World Bank
Washington, D.C.
Poverty Reduction Support Credits: Mozambique Country Study Brendan Horton
ii
© 2010 Independent Evaluation Group, The World Bank Group 1818 H St., NW Washington, DC 20433
IEG: Improving Development Results Through Excellence in Evaluation
The Independent Evaluation Group is an independent unit within the World Bank Group; it reports directly to the Bank’s Board of Executive Directors. IEG assesses what works, and what does not; how a borrower plans to run and maintain a project; and the lasting contribution of the Bank to a country’s overall development. The goals of evaluation are to learn from experience, to provide an objective basis for assessing the results of the Bank’s work, and to provide accountability in the achievement of its objectives. It also improves Bank work by identifying and disseminating the les-sons learned from experience and by framing recommendations drawn from evaluation findings. IEG Working Papers are an informal series to disseminate the findings of work in progress to en-courage the exchange of ideas about development effectiveness through evaluation. The findings, interpretations, and conclusions expressed here are those of the author(s) and do not necessarily reflect the views of the Board of Executive Directors of the World Bank or the govern-ments they represent, or IEG management. The World Bank cannot guarantee the accuracy of the data included in this work. The boundaries, colors, denominations, and other information shown on any map in this work do not imply on the part of the World Bank any judgment of the legal status of any territory or the endorsement or accep-tance of such boundaries. ISBN-10: 1-60244-150-2 ISBN-13: 978-1-60244-150-7 Contact: IEG Communication, Learning and Strategies (IEGCS) e-mail: [email protected] Telephone: 202-458-4497 Facsimile: 202-522-3125 http:/www.worldbank.org/ieg
iii
Contents
ACRONYMS .......................................................................................................................................................... V
ACKNOWLEDGEMENTS .................................................................................................................................... VII
EXECUTIVE SUMMARY ...................................................................................................................................... IX
1. BACKGROUND ...................................................................................................................................... 1
Country Context ...................................................................................................................................................... 1
Situating the PRSC in the Country Assistance Program .................................................................................... 3
2. PRSC DESIGN ........................................................................................................................................ 5
To what extent is there a discernible difference between the PRSC series and earlier Adjustment Lending/Development Policy Lending? ................................................................................................................ 5
3. PROCESS ............................................................................................................................................... 7
How effective have PRSCs been as a vehicle to help Mozambique operationalize a country-driven poverty reduction strategy? ................................................................................................................................................. 7
How well have the PRSCs been aligned with country policy formulation, budgeting, and planning processes, and how effectively have they contributed to predictable resource flows? ................................ 16
4. PRSC RESULTS ................................................................................................................................... 19
How effectively have PRSCs helped Mozambique strengthen its public financial management system? .. 19 Outcomes ............................................................................................................................................................................ 21
How relevant and effective a vehicle have PRSCs been in helping Mozambique set conditions for poverty reducing growth? .................................................................................................................................................. 26
How effectively has the PRSC helped advance the dialogue and achieve results in sectors that deliver services to the poor? ............................................................................................................................................ 31
Assessment of Overall Outcome ......................................................................................................................................... 37 Monitoring and Evaluation : Poverty Outcomes and Poverty Impact .................................................................................. 38
5. BANK PERFORMANCE ....................................................................................................................... 40
6. CONCLUSIONS AND LESSONS LEARNED ....................................................................................... 42
REFERENCES .................................................................................................................................................... 45

iv
TABLES Table 1. Adjustment Operations (1992-2002) Amounts, Dates of Approval, and Tranche Releases .................... 2 Table 2. Poverty Reduction Support Credits 2004-2007 – Critical Dates............................................................... 4 Table 3. Relative Importance of IDA PRSC Disbursements ................................................................................ 12 Table 4. The Bank’s Internal Processing Is Poorly Aligned with the General Budget Support Schedule ............. 14 Table 5. Calendar of Events in the Preparation of the Annual Budget and Economic and Social Plan ............... 17 Table 6. Comparative Frequency of PEFA Grades (2004 and 2006)................................................................... 24 Table 7. Resources spent on PRSCs 1-4, FY04-08 (end February) .................................................................... 41 Table 8. PRSCs 1-4 Expenditures (FY04-08) ...................................................................................................... 41 FIGURES Figure 1. Overview of PEFA Scores in 2004 and 2006 ........................................................................................ 24 Figure 2. Share of Public Expenditures Allocated to PARPA Priority Sectors ...................................................... 36 Figure 3. Health, Education, and Water and Sanitation Expenditures During the PRSC Period.......................... 36 APPENDIX Appendix Table 1. Prior Actions and Tranche Release Triggers (PRSCs 1-5) .................................................... 48 Appendix Table 2. Pillars and Main Objectives of PARPAs I and II ..................................................................... 51 Appendix Table 3.PARPA Objectives/Outcomes, PRSC Prior Actions, Tranche Release Conditions (PRSCs 1-2) 52 Appendix Table 4. PARPA Objectives/Outcomes, PRSC Prior Actions, Tranche Release Conditions (PRSCs 3-5) 53 Appendix Table 5. Summary of Board and Tranche Release Conditions for PRSC Tranches 1-5, by Sector ..... 54 Appendix Table 6 Evolution of Social Indicators during the PRSC Period ........................................................... 55 Appendix Table 7 Disbursements of Bank Operations (FY00-07) (billion MTCALs) ............................................ 56 Appendix Table 8. Relative Importance of PRSC Disbursements (billion MTCALs) ............................................ 59 Appendix Table 9. Consolidated Government Operations and Financing............................................................ 61 Appendix Table 10. Inventory of General Budget Support, by Donor .................................................................. 63 Appendix Table 11. Predictability of PRSC and General Budget Support Flows (2004-2007) (millions USD) ..... 65 Appendix Table 12. Budget Data 2000-2006 ....................................................................................................... 67 Appendix Table 13. Alignment of PRSC with Domestic Planning/Budgeting Processes and GBS Process ........ 68 Appendix Table 14. Mozambique: Financial Activities of the State (2000-2007) (trillions of Meticais) ................. 69 Appendix Table 15. Expenditure in Priority and Nonpriority Sectors (trillions of Meticais) ................................... 71 Appendix Table 16. Expenditure in Priority and Nonpriority Sectors (percentages of nominal GDP) .................. 72 Appendix Table 17. PEFA Summary Indicators 2006 .......................................................................................... 73 Appendix Table 18. Economic Indicators for Mozambique .................................................................................. 74
v
Acronyms AAA Analytical and advisory activities AAP Africa Action Plan AfDB African Development Bank APR Annual Progress Report BdPES Balanco do PES BER Budget Execution Report CAF Registry of state officials and civil
servants in Mozambique CAS Country Assistance Strategy CEM Country Economic Memorandum CFAA Country Financial Accountability
Assessment CPAR Country Procurement Assessment
Report CPIA Country Performance and
Institutional Assessment CPS Country Partnership Strategy CRA Central Revenue Authority DAC Development Assistance Committee DPFP Decentralized Planning and
Financing Project EMPSO Economic Management and Private
Sector Operation EMRO Economic management reform
operation EMRS Expenditure Management Reform
Strategy EP1 Grades 1-5 ERC Economic recovery credit ERP Economic Rehabilitation Program EU European Union FRELIMO Frente de Libertação de Moçambique FSAP Financial Sector Assessment
Program FSSI Financial sector soundness indicator FY Fiscal year FYP Five Year Program G19 Group of 19 development partners GBS General budget support GDP Gross domestic product GFRP Global Food Crisis Response
Program HCS Household Consumption Survey HD Human development HIAL High Impact Adjustment Lending
approach
HIPC Highly Indebted Poor Country
(initiative) IAS International auditing standards ICA Investment Climate Assessment ICR Implementation Completion &
Results Report IDA International Development
Association IEG Independent Evaluation Group IFMIS Integrated financial management
information system IFRS International financial reporting
standards IPC Investment Promotion Center IPSAS International public sector
accounting standards JR Joint review M&E Monitoring and evaluation MDG Millennium Development Goal MDRI Multilateral Debt Relief Initiative MDTF Multi-Donor Trust Fund MOU Memorandum of understanding MTEF Medium-Term Expenditure
Framework NPL Non-performing loan ODA Official development assistance OP Operational policy PAF Performance assessment matrix PAP Program Aid Partner PARPA Poverty Reduction Strategy Plan
(Portuguese acronym) PCR Project Completion Report PD Program Document PEFA Public Expenditure and Financial
Accountability PER Public Expenditure Review PES Plano Economico e Social PET Public Expenditure Tracking Survey PFM Public financial management PFMP Public financial management and
procurement PGSA Poverty, Gender, and Social
Assessment PO Poverty Observatory PPAR Project Performance Assessment
Report

vi
PREM Poverty reduction and economic management
PRGF Poverty Reduction and Growth Facility (IMF initiative)
PRS Poverty reduction strategy PRSP Poverty Reduction Strategy Paper PSD Private sector development PSI Policy Support Instrument PSR Public sector reform PSRP Public Sector Reform Project RC Rehabilitation credit REEL Real effective exchange rate RENAMO Resistançia Nacional do Moçambique RF Results framework SAC Structural adjustment credit SAL Structural adjustment loan SISTAFE Integrated financial management
information system in Mozambique SM Strategic matrix SWAp Sector-wide approach SWG Sector working group TA Technical assistance TA Tribunal Administrativo TF Trust fund TSA Treasury single account UMEOA West African Monetary and
Economic Union USD US Dollars

vii
Acknowledgments
This paper is one of a series of seven background country case studies, prepared for the IEG evaluation of the World Bank’s support for Poverty Reduction Support Credits (PRSCs), coor-dinated by Anjali Kumar. The paper was prepared by Brendan Horton on the basis of a mission undertaken jointly with Monika Huppi, Lead Evaluation Officer. Its preparation was supported by the World Bank’s country office for Benin, which helped to organize the field visit. Support was provided in Washington by Andrew Waxman, Research Analyst. Valuable comments are acknowledged from Mozambique Country Team members, in particular, Senior Country Econ-omist, Antonio Nucifora. The paper has been edited by Jesse Torrence and Anjali Kumar.
.

viii

ix
Executive Summary Following 17 years of internal conflict in Mozambique, a peace accord was signed in 1992 and economic recovery began, though sometimes in fits and starts. The Gross Domestic Product (GDP) growth rate has averaged 7.8 percent since the early 1990s and 7.3 percent from 2004-2007. On the fiscal front, the overall fiscal deficit improved initially, but the trend reversed, with the deficit increasing from 8.9 percent in 2005 to 13.5 percent in 2007. This was financed entirely by external assistance. On the external front, the share of exports grew from 10.2 percent of GDP in 1991 to 38 percent in 2006. Over the period, a flexible exchange rate policy has been followed. Mozambique was included in the first Highly Indebted Poor Country (HIPC) initiative and reached the completion point in June 1999. Since 1987, it has received support from the Interna-tional Monetary Fund (IMF) under six programs, including two Poverty Reduction and Growth Facilities.
Mozambique obtained considerable fast-disbursing assistance from the World Bank in the pe-riod 1984-2002: Rehabilitation Credits 1-3 (1984-1990); Economic Recovery Credits 1-3, (1992, 1994, 1996); Economic Management Reform Operation (2000); and the Economic Management and Private Sector Operation in 2002. The first set of operations began immediately after Mo-zambique joined the Bank and supported the government’s Economic Rehabilitation Program. The three economic recovery credits provided further support. These operations were rated as satisfactory or highly satisfactory in their Implementation Completion Reports (ICRs) and mod-erately satisfactory in their ICR Reviews conducted by the World Bank’s Independent Evalua-tion Group (IEG). They included notable achievements and important reforms to help Mozam-bique transition from a government-directed command economy to a mostly private sector-driven, market economy. The Economic Management and Private Sector Operation was the first operation based on the Mozambique’s Poverty Reduction Strategy Paper, or national develop-ment strategy (PARPA, in Portuguese), and was adopted in 2001. This was a precursor to the first Poverty Reduction Strategy Paper (PRSC), prepared in FY04 after preparatory work had been completed in public finance management.
The first PRSC series contained two operations (PRSCs 1 and 2); and the second series contained three operations (PRSCs 3-5). To date, five have been approved and disbursed; the fifth was ap-proved by the Bank in November 2008 and disbursed in December 2008. PRSCs 1 and 2, which supported PARPA I (the first national development plan), aimed to support policies and re-forms to improve living conditions by promoting growth and employment and strengthening governance and public sector management. The second series, PRSCs 3-5, supported PARPA II (the second national development plan). Within this series, PRSC 3 focused on helping the gov-ernment make progress toward a strategic subset of objectives within specific areas of the per-formance assessment matrix, a subset of PARPA II’s strategic matrix. Under PRSC 3, the gov-ernment intended to complete computerization of its public financial management system, strengthen audit controls, and support decentralization to improve service delivery. PRSCs 4 and 5 sought to consolidate reforms in macroeconomic management, governance, public sector, and economic development.
The PRSC has served well as an instrument to coordinate the Bank’s budget support with that of other general budget support financiers. General budget support is well aligned with the

x
PARPA, and the PRSC is fully integrated into the general budget support system. The reforms monitored under PRSC series I and II were in line with the government’s broader reform pro-gram and were appropriate, comprehensive, and reasonably sequenced. Much progress on pro-curement has been made, starting with adoption of a new procurement code in 2005 and publi-cation of revised regulations based on competition and transparency. Reforms have also sought to strengthen the external audit institution, the Tribunal Administrativo. On this front, there was substantial progress: the number of audits rose from 3 in 2003 to 360 in 2007( in excess of targets), roughly the same number in 2008 and a projected 400 in 2009. The capacity of the Bank of Mozambique to regulate and supervise banks and financial institutions has been streng-thened, although the bank privatization program was not completed.
Overall macroeconomic management has been broadly satisfactory during the PRSC period to date. PRSCs have made some contribution to growth via the financing of the budget—which has lowered government recourse to domestic financing by an equivalent amount—and have supported structural reforms that have created the conditions needed for economic growth. Nonetheless, because of the multitude of other programs and donor support, it is not possible to attribute Mozambique’s economic performance directly or wholly to the PRSCs.
One of the objectives of the first series was to enhance service delivery in health, education, and water and sanitation. Overall, the main benefits of the PRSC for these sectors are the result of reforms in public financial management and higher sector spending rather than sector-specific measures, which were largely absent in the PRSC program. Thus, the efficiency and effective-ness of PRSC policy measures as a tool to improve access by the poor to quality services is ques-tionable. Overall, the budgetary process is not used to ensure alignment of funding with stra-tegic priorities. In the education sector progress was made in expanding enrollment at the primary school, but recent assessments show that the focus on expanded access has come at the cost of learning outcomes. In the health sector, increased budgetary funding supported through the PRSC has permitted an increase in public health care personnel and infrastructure, but the extent to which this has resulted in improved health outcomes and service access for low in-come groups is not clear; primary care service quality remains a major concern. Although PAF targets have been met or exceeded in 2004-2008, statistics on access to safe water show that progress has been slow and has often fallen short of targets, despite an apparent increase in re-sources to the sector.
Bank staff have made a great effort to ensure harmonization with other donors and alignment with government wishes on budget preparation and disbursements. The Bank did well in terms of consolidation and harmonization of conditionalities, and, from the second tranche of PRSC2 onwards, timely deposit of PRSC funds into the Treasury early in the fiscal year.
Under the PRSC approach, the Bank has been able to deliver financial support to the budget in an increasingly predictable manner. This is a major strength, given the importance of resource predictability for budget execution. The PRSC in Mozambique is an instrument to support the budget and the overall government program, as long as it is broadly on track. However, it is not a strategic instrument to support policy issues as dialogue develops or new issues emerge. It is important to note that PRSCs cannot do everything, nor should they try; there is a place for tra-ditional investment projects. PRSCs in the case of Mozambique have, thus far, been cross-sectoral, but there is no reason why they cannot be sectoral in nature, provided they do not en-tail unjustified earmarking of funds. In Mozambique, the PRSC approach has proven to be at least as effective a way of providing fast-disbursing assistance as the adjustment approach and

xi
has, on the whole, been very effective in supporting an ambitious reform program, especially with regards to improving public financial management, road infrastructure, and agricultural extension services. Remaining shortcomings can be addressed.

xii
1
1. Background
Country Context 1.1 Political situation. Mozambique acquired independence from Portugal in 1975. The new government adopted a policy of radical social change, with a command and control approach to economic management and a vast nationalization program. By the mid-1980s, the country was bankrupt, and the government turned to the IMF and the World Bank to help transform it into a market economy.
1.2 Economic performance. Since the early 1990s, Mozambique’s Gross Domestic Product (GDP) growth rate has been above 7 percent in all but two years and has averaged 7.8 percent. Over the same period, inflation has trended broadly downwards from 63 percent in 1994 to 8 percent in 2007. On the savings and investment front, gross investment has averaged 26.4 per-cent, while domestic savings has been 8.2 percent, the difference being made up for with foreign savings. Fiscal policy has generally been well managed, with deficits financed by external assis-tance.. The government managed to protect the 65 percent of primary expenditures going to priority sectors. Public investment declined as a percentage of GDP, as did private investment. Revenue collection improved. Exports grew from 10.2 percent of GDP in 1991 to 38 percent in 2006. Over this period, a flexible exchange rate policy has been followed. The national poverty rate was 69.4 percent in 1996-1997 and 54.1 percent in 2003.1 Some social indicators improved, but the prevalence of HIV/AIDS increased from 11percent to 16.2 percent between 2000 and 2004.
1.3 Structural reform track record. Mozambique was included in the first Highly Indebted Poor Country (HIPC) initiative and first reached the completion point in June 1999. After ad-mission to the enhanced initiative in June 2000 it reached the HIPC completion point in 2001, with an overall common reduction factor of about 73 percent. In December 2005, all outstanding debt to the IMF, World Bank, and African Development Bank (AfDB) was cancelled under the Multilateral Debt Relief Initiative (MDRI) initiative. Since 1987, Mozambique has received sup-port from the Fund under six programs, including two Poverty Reduction and Growth Facilities (PRGFs). Performance has been broadly satisfactory, although waivers were required for a number of quantitative performance and structural performance criteria. It has now graduated from the Facility, and country performance has been monitored under the Policy Support In-strument (PSI) since June 2007. The first two reviews (December 2007, June 2008) were satisfac-torily concluded, emphasized a new set of issues, and reiterated the need for accelerating com-prehensive public sector reform (PSR).
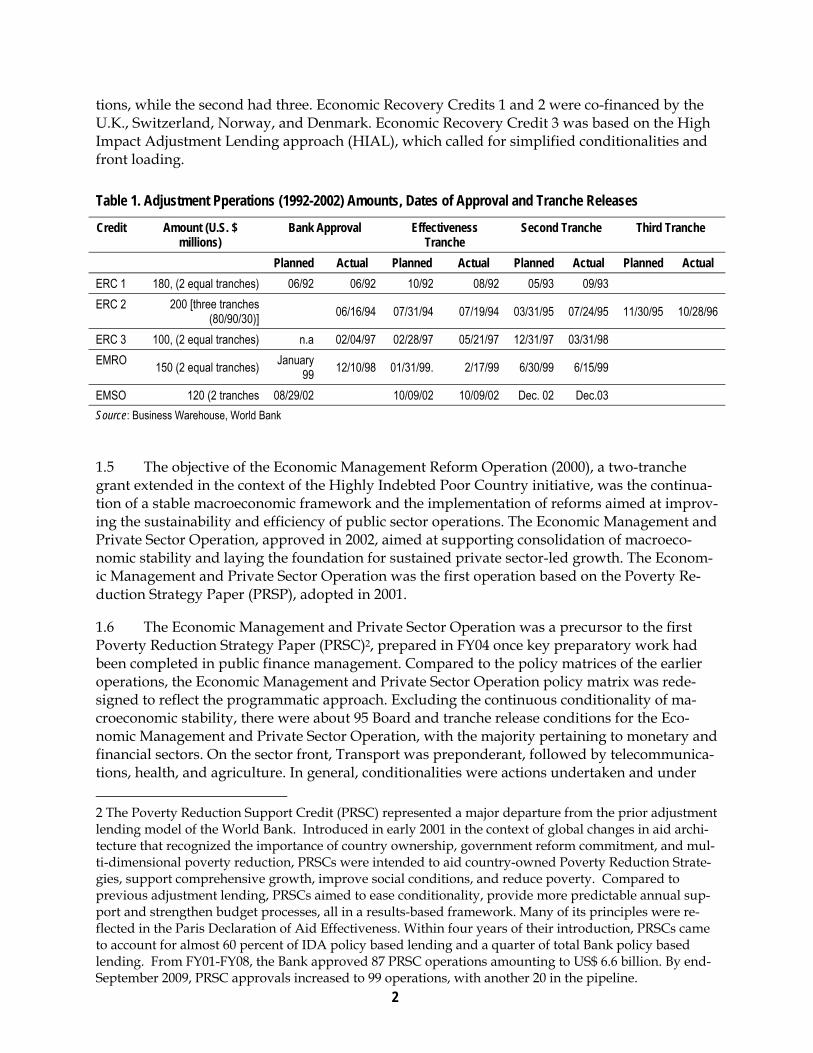
1.4 Bank support through adjustment lending. Mozambique obtained considerable fast-disbursing assistance from the World Bank in the period 1984-2002: Rehabilitation Credits 1-3 (1984-1990); Economic Recovery Credits 1-3, (1992, 1994, 1996); Economic Management Reform Operation (2000); and the Economic Management and Private Sector Operation (EMPSO) in 2002 (Table 1) The first set of operations began immediately after Mozambique joined the Bank and supported the government’s Economic Rehabilitation Program (ERP). Three economic re-covery credits (ERCs) provided further support to the reforms initiated under the Economic Re-habilitation Program. The first and third economic recovery credits were two-tranche opera-
1 Computed using a cost of basic needs approach.
2
tions, while the second had three. Economic Recovery Credits 1 and 2 were co-financed by the U.K., Switzerland, Norway, and Denmark. Economic Recovery Credit 3 was based on the High Impact Adjustment Lending approach (HIAL), which called for simplified conditionalities and front loading.
Table 1. Adjustment Pperations (1992-2002) Amounts, Dates of Approval and Tranche Releases
Credit Amount (U.S. $ millions)
Bank Approval Effectiveness Tranche
Second Tranche Third Tranche
Planned Actual Planned Actual Planned Actual Planned Actual
ERC 1 180, (2 equal tranches) 06/92 06/92 10/92 08/92 05/93 09/93
ERC 2 200 [three tranches (80/90/30)]
06/16/94 07/31/94 07/19/94 03/31/95 07/24/95 11/30/95 10/28/96
ERC 3 100, (2 equal tranches) n.a 02/04/97 02/28/97 05/21/97 12/31/97 03/31/98
EMRO 150 (2 equal tranches)
January 99
12/10/98 01/31/99. 2/17/99 6/30/99 6/15/99
EMSO 120 (2 tranches 08/29/02 10/09/02 10/09/02 Dec. 02 Dec.03
Source: Business Warehouse, World Bank
1.5 The objective of the Economic Management Reform Operation (2000), a two-tranche grant extended in the context of the Highly Indebted Poor Country initiative, was the continua-tion of a stable macroeconomic framework and the implementation of reforms aimed at improv-ing the sustainability and efficiency of public sector operations. The Economic Management and Private Sector Operation, approved in 2002, aimed at supporting consolidation of macroeco-nomic stability and laying the foundation for sustained private sector-led growth. The Econom-ic Management and Private Sector Operation was the first operation based on the Poverty Re-duction Strategy Paper (PRSP), adopted in 2001.
1.6 The Economic Management and Private Sector Operation was a precursor to the first Poverty Reduction Strategy Paper (PRSC)2, prepared in FY04 once key preparatory work had been completed in public finance management. Compared to the policy matrices of the earlier operations, the Economic Management and Private Sector Operation policy matrix was rede-signed to reflect the programmatic approach. Excluding the continuous conditionality of ma-croeconomic stability, there were about 95 Board and tranche release conditions for the Eco-nomic Management and Private Sector Operation, with the majority pertaining to monetary and financial sectors. On the sector front, Transport was preponderant, followed by telecommunica-tions, health, and agriculture. In general, conditionalities were actions undertaken and under
2 The Poverty Reduction Support Credit (PRSC) represented a major departure from the prior adjustment lending model of the World Bank. Introduced in early 2001 in the context of global changes in aid archi-tecture that recognized the importance of country ownership, government reform commitment, and mul-ti-dimensional poverty reduction, PRSCs were intended to aid country-owned Poverty Reduction Strate-gies, support comprehensive growth, improve social conditions, and reduce poverty. Compared to previous adjustment lending, PRSCs aimed to ease conditionality, provide more predictable annual sup-port and strengthen budget processes, all in a results-based framework. Many of its principles were re-flected in the Paris Declaration of Aid Effectiveness. Within four years of their introduction, PRSCs came to account for almost 60 percent of IDA policy based lending and a quarter of total Bank policy based lending. From FY01-FY08, the Bank approved 87 PRSC operations amounting to US$ 6.6 billion. By end-September 2009, PRSC approvals increased to 99 operations, with another 20 in the pipeline.

3
the control of government. All were satisfied, save one in the area of economic management, where non-adoption of international accounting standards by commercial banks gave rise to the need for a partial waiver, which was approved by the Board on a non-objection basis.
1.7 These operations were rated as satisfactory or highly satisfactory in their Implementa-tion Completion Reports3. Initial individual ratings by the World Bank’s Independent Evalua-tion Group (IEG) concurred, except for in the case of the Economic Management and Private Sector Operation, which was judged to be moderately satisfactory. During this period, there were notable achievements. The credits supported policy and institutional changes to help Mo-zambique transition from a government-directed, command economy to a private-sector led, market-based economy, including exchange rate deregulation, monetary management, banking sector reform, private sector reform, trade regime liberalization, tax reform, and public expendi-ture management.
1.8 Yet, there were also a number of shortcomings: slow progress toward macro stabiliza-tion under the Economic Recovery Credit 1, the failure to produce a comprehensive budget, and the failure of commercial banks to adopt international auditing standards (IAS) under the Eco-nomic Management and Private Sector Operation, or second adjustment credit. The 2002 IEG Project Performance Assessment Report (PPAR) for the Economic Recovery Credits and the Economic Management Reform Operation gave an overall rating of moderately satisfactory and recommended that future programs pay more attention to political economy and participatory preparation.
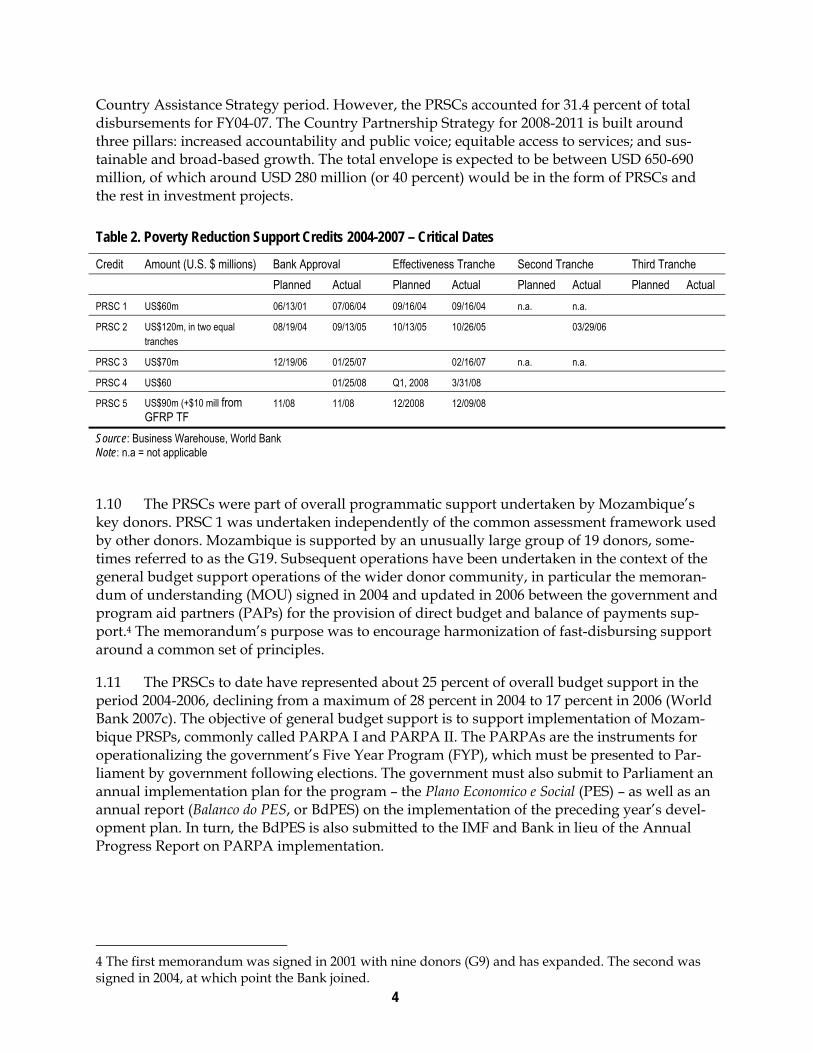
Situating the PRSC in the Country Assistance Program 1.9 To date, five PRSCs have been approved in Mozambique. These were disbursed in two series (PRSCs 1-2 and PRSCs 3-5), as summarized in Table 2. All were intended to be single-tranche operations, although PRSC 2 consisted of two tranches. Table 2 shows that these opera-tions provided fast-disbursing support in each of the budget years 2004-2008. PRSC 1 was pre-sented as a balance of payments support operation, but PRSCs 2-4 were presented as budget support operations. PRSC 5 was approved in November 2008 and disbursed in December 2008. Implementation Completion Reports have been prepared for PRSC 1 and PRSCs 1-2, and con-clude that the operations were satisfactory as regards outcome and performance. Their institu-tional development impact was rated substantial and their sustainability as likely, with risks to development outcome rated as moderate. IEG concurred with these ratings. Reports have not yet been produced for PRSCs 3 and 4. PRSCs 1-3 were undertaken in the context of the 2004-2007 Country Assistance Strategy (CAS), while the latter were part of the 2008-2011 Country Partner-ship Strategy (CPS). The PRSCs accounted for 46 percent of proposed commitments over the
3 Bank operational staff prepare a self-evaluation (known as an Implementation Completion Report or ICR) for every completed project. IEG staff then review every ICR, validate the self-rating, and identify projects that offer good potential for further learning (because of particularly good or bad performance) as candidates for a project performance assessment (PPAs). One in four completed projects (or about 70 a year) is subject to a Project Performance Assessment Report, which takes about six staff weeks to produce and normally includes a field mission. Project Performance Assessment Reports (PPARs), rate projects in terms of their outcome (taking into account relevance, efficacy, and efficiency), sustainability of results, and institutional development impact. PPAs carried out after Bank funds have been fully disbursed to a project, are similar to the completion evaluations carried out by many development agencies, and are the main project-level evaluations conducted by IEG. http://www.worldbank.org/oed.
4
Country Assistance Strategy period. However, the PRSCs accounted for 31.4 percent of total disbursements for FY04-07. The Country Partnership Strategy for 2008-2011 is built around three pillars: increased accountability and public voice; equitable access to services; and sus-tainable and broad-based growth. The total envelope is expected to be between USD 650-690 million, of which around USD 280 million (or 40 percent) would be in the form of PRSCs and the rest in investment projects.
Table 2. Poverty Reduction Support Credits 2004-2007 – Critical Dates
Credit Amount (U.S. $ millions) Bank Approval Effectiveness Tranche Second Tranche Third Tranche
Planned Actual Planned Actual Planned Actual Planned Actual
PRSC 1 US$60m 06/13/01 07/06/04 09/16/04 09/16/04 n.a. n.a.
PRSC 2 US$120m, in two equal tranches
08/19/04 09/13/05 10/13/05 10/26/05 03/29/06
PRSC 3 US$70m 12/19/06 01/25/07 02/16/07 n.a. n.a.
PRSC 4 US$60 01/25/08 Q1, 2008 3/31/08
PRSC 5 US$90m (+$10 mill from GFRP TF
11/08 11/08 12/2008 12/09/08
Source: Business Warehouse, World Bank Note: n.a = not applicable
1.10 The PRSCs were part of overall programmatic support undertaken by Mozambique’s key donors. PRSC 1 was undertaken independently of the common assessment framework used by other donors. Mozambique is supported by an unusually large group of 19 donors, some-times referred to as the G19. Subsequent operations have been undertaken in the context of the general budget support operations of the wider donor community, in particular the memoran-dum of understanding (MOU) signed in 2004 and updated in 2006 between the government and program aid partners (PAPs) for the provision of direct budget and balance of payments sup-port.4 The memorandum’s purpose was to encourage harmonization of fast-disbursing support around a common set of principles.
1.11 The PRSCs to date have represented about 25 percent of overall budget support in the period 2004-2006, declining from a maximum of 28 percent in 2004 to 17 percent in 2006 (World Bank 2007c). The objective of general budget support is to support implementation of Mozam-bique PRSPs, commonly called PARPA I and PARPA II. The PARPAs are the instruments for operationalizing the government’s Five Year Program (FYP), which must be presented to Par-liament by government following elections. The government must also submit to Parliament an annual implementation plan for the program – the Plano Economico e Social (PES) – as well as an annual report (Balanco do PES, or BdPES) on the implementation of the preceding year’s devel-opment plan. In turn, the BdPES is also submitted to the IMF and Bank in lieu of the Annual Progress Report on PARPA implementation.
4 The first memorandum was signed in 2001 with nine donors (G9) and has expanded. The second was signed in 2004, at which point the Bank joined.
5
2. PRSC Design
To what extent is there a discernible difference between the PRSC series and earlier Adjustment Lending/Development Policy Lending? 2.1 Design and content. The two PRSC series contained two and three operations respectively (PRSCs 1 and 2 in the first series and PRSCs 3-5 in the second series). Five have already been approved and disbursed; the fifth was approved by the Bank in November 2008 and disbursed the following month. PRSCs 1 and 2 supported the implementation of PARPA 1. Both were in-itially designed as single-tranche operations, but PRSC 2 was redesigned as a two-tranche oper-ation at the request of the authorities to support donor harmonization in line with donor agreements and national budget procedures. The objectives of both PRSCs 1 and 2 were to sup-port policies and reforms to improve the living conditions of the population by promoting growth and employment and strengthening governance and public sector management. PRSC 2 states that it supports the primary objective of reducing absolute poverty and achieving Millen-nium Development Goals (MDGs) through implementation of the government’s action plan for the reduction of absolute poverty. PRSCs 1 and 2 were based on three themes, in line with PARPA I priorities: building public sector capacity and accountability, improving the invest-ment climate, and enhancing service delivery.
2.2 The second series, PRSCs 3-5, supported PARPA II. PRSC 3 focused on helping the gov-ernment make progress toward a strategic subset of objectives within specific areas of the Per-formance Assessment Matrix (PAF), a subset of the strategic matrix of PARPA II. Under PRSC 3, the government intended to complete computerization of its public financial management sys-tem, including procurement, and strengthen audit controls. Decentralization would empower district communities to decide their investment programs and improve the quality of service delivery. PRSC 3 was also intended to monitor performance of the maintenance and expansion of the national road network as well as programs to enhance agricultural productivity. Thus, PRSC 3 was to contribute to enhancing growth and alleviating constraints in cross-cutting areas such as public financial management (PFM) and the business environment. PRSCs 4 and 5 seek to help consolidate and deepen institutional reforms in macroeconomic management, gover-nance, public sector, and economic development.
2.3 The sector focus of the PRSC triggers is different from that of the adjustment period. Under the PRSCs, the main focus has been consistently on public financial management. Under the adjustment approach, the main focus was on the financial sector, followed by public finan-cial management and then trade. Although there has been consistency of focus over time in both the adjustment and the PRSC approach, the focus has been more concentrated under the PRSCs. A major difference between PRSCs and earlier adjustment lending is that, from PRSC 3 onward, the PRSCs have increasingly made use of good practice principles on conditionality and substantially reduced their number.5 PRSC operations consist of one tranche, in which re-sources are released once certain prior actions have been satisfied.6 These prior actions, general-
5 The good practice principles are: reinforcing ownership; creation of a common accountability frame-work; customizing the framework and Bank support modalities to country needs; selecting conditionality actions to achieve results; and conducting transparent reviews for predictable, performance based finan-cial support. 6 However, PRSC 1 was prepared without reference to the matrix, and PRSC 2 had two tranches, not one.
6
ly few in number, are taken from the joint performance assessment framework and, in principle, match the targets in the previous year. If the review for that previous year shows that the target was not been met, the prior action will be redefined so as to correspond to the actual perfor-mance realized in that year, and future indicators will be reset if needed.
2.4 Approach to conditionalities. PRSC and adjustment lending differ in approach to conditio-nalities as well as in overall design. A summary of prior actions for PRSCs 1-4 and triggers for PRSC 5 is found in Appendix Table 1. For PRSCs 1 and 2, these pertained mainly to the follow-ing: one-off measures to increase revenues; a systematic focus on implementation of the new management information system for public financial management (SISTAFE); and measures to improve the investment climate and financial sector. There were no specific measures to en-hance service delivery. The prior actions and triggers for PRSC 1 were not part of the perfor-mance assessment matrix, whereas for PRSC 2 onwards they were. PRSC 3 triggers concen-trated on public financial management. PRSC 4 and 5 followed in the same areas and added new triggers in agricultural service provision, judicial reform, transport, and civil service reform. At the sector level, it should be noted, there were no prior actions for health and educa-tion.
2.5 PRSC flexibility compared to earlier lending instruments. With regard to flexibility, structur-al adjustment credit conditionalities for second and third tranches could not be changed once negotiated. There were three choices if conditionalities could not be met in their original time-frame: 1) waiting until the condition was satisfied, which entailed a disbursement delay; 2) re-questing a waiver; or 3) canceling the tranche. In Mozambique, there were frequently delays to tranche release for the economic recovery credits—more than a year on two occasions. Under the PRSC approach, it is possible to adjust triggers in line with actual performance. This made it possible to eliminate disbursement delays resulting from meeting Board presentation/tranche release conditionalities. In Mozambique, PRSCs have proved to be more predictable in terms of disbursement regularity, especially after PRSC 3. It can also be decided to defer a trigger to the following operation. Triggers can also be dropped.
2.6 This approach is quite different from that under structural adjustment. In a single-tranche operation, Board presentation conditions are negotiated and then presented to the Board and included in the credit agreement. When it comes time for tranche release, the staff report to the Board on whether the program is on track and tranche-release conditions have been satisfied. If there is full compliance, management can release the tranche and send the tranche release memo to the Board on an ex-post basis.7 Under Economic Recovery Credit 2, the Bank decided to wait until the conditionalities had been fully satisfied, whereas under the Eco-nomic Management and Private Sector Operation it solicited a waiver for one of the second tranche-release conditions. In both cases, it was at the cost of depriving the country of needed assistance for about a year.
2.7 Government opinions on PRSC differences in relation to prior adjustment operations. Govern-ment counterparts indicated unequivocally that they prefer the PRSCs to structural adjustment credits for three reasons. First, the conditionalities are derived from the performance assessment framework matrix, which is “their” document, derived as it is from the national development strategy. Second, the conditionalities are generally more process-oriented and manageable than
7 If conditions are not fully met, management may solicit a waiver from the Board on a non-objection ba-sis; it has eight days to request a full discussion, and, if this does not occur, may release the funds.

7
those in adjustment operations. The manageability results from the design feature in which prior actions for a PRSC processed in a given year are initially specified as triggers two years prior to that point, with implementation targets being defined for the previous year. The third reason is that disbursements have proven to be more regular and predictable, as they are now expected to occur in the first quarter of the budget year. This is preferable to disbursements un-der adjustment operations, which had not been planned in line with budget needs. Moreover, on several occasions, there were serious delays in obtaining tranche-release authorizations as planned due to difficulties in complying with conditionalities to the Bank’s satisfaction. In com-parison, the PRSC system has facilitated budgetary and monetary management.
2.8 Under the PRSC approach, the Board initially “approves” or “validates” triggers for the PRSC of year n for the PRSC approved in year n-2 or n-1. This forward-looking characteristic provides the borrower, Board, and other stakeholders with medium-term visibility on Board presentation conditions (prior actions—i.). Moreover, the fact that a trigger, as agreed at negoti-ation, can be either adjusted to the reality of the subsequent two-year period, or deferred to a subsequent operation, introduces a degree of flexibility into the conditionality. This flexibility has been much appreciated by the Mozambican authorities and has facilitated dialogue between them and the Bank. It also permits a sensible process of constantly adjusting program targets in the light of evolving circumstances and understanding of technical and policy issues. However, some Bank staff believe the PRSC system can permit unjustified slippages due to lack of com-mitment on the part of the borrower and forecloses the possibility of addressing important is-sues that are outside the assessment matrix. In their judgment, this permits government to avoid those tough issues where stronger, binding conditionality of the adjustment kind could be appropriate.
2.9 Regularity of disbursements. Disbursements under PRSCs have proven to be much more regular and predictable than those under prior credits. Table 2 shows that, while PRSC 1 and the first tranche of PRSC 2 were disbursed in the fourth quarter of budget years 2004 and 2005, the second tranche of PRSC 2 was disbursed in the first quarter of budget year 2006, and PRSCs 3 and 4 have been disbursed in the first quarter of 2007 and 2008, respectively. PRSC 5 was dis-bursed on time in December of 2008, slightly ahead of schedule, in order to respond to the glob-al food and fuel crisis and to keep an earlier promise to ensure that USD 10 million (originally agreed to under PRSC4 but not disbursed at the time of effectiveness) was in fact released dur-ing calendar year 2008. It is now expected that all future PRSCs will follow the same principle, that is, disbursement in the first quarter of Mozambique’s budget year.
3. Process
How effective have PRSCs been as a vehicle to help Mozambique operationalize a country-driven poverty reduction strategy? Alignment with national development and sector strategies. A summary of the contents of PARPAs I and II is provided in

8
Appendix Table 3.PARPA Objectives/Outcomes, PRSC Prior Actions, Tranche Release Conditions (PRSCs 1-2)
3.1 . The central objective of PARPA I was to achieve a substantial reduction in the levels of absolute poverty in Mozambique through the adoption of measures to improve opportunities for all Mozambicans, especially the poor. Compared to the preceding PARPA (2000-2004), PARPA II broadened the strategic vision by recognizing the crucial importance of medium- and long-term measures to fight poverty through policies to sustain rapid, broad based growth. Thus, PARPA II contains policies to create a favorable enabling environment for investment and productivity to achieve an 7 percent growth rate. The strategy was inclusive and pro-poor. In concrete terms, the strategy contains six fundamental priorities: education; health; agricultural and rural development; basic infrastructure; good governance; and macroeconomic and finan-cial management. PARPA II also emphasized the need for reform of public administration and decentralization.
The first two PRSCs supported PARPA I through programs that focused on three themes: themes: building public sector capacity and accountability; improving the investment climate; and enhancing service delivery in health, education, and rural water and sanitation. It is clear that PRSCs 1-2 were aligned with PARPA I objectives, particularly the promotion of growth (
9
Appendix Table 3.PARPA Objectives/Outcomes, PRSC Prior Actions, Tranche Release Conditions (PRSCs 1-2)
3.2 ). This alignment was reinforced through effective prior actions and triggers directly re-lated to the PARPA matrix. PRSCs 1-2 aided operationalization of PARPA I through the intro-duction of specific reform measures, whereas none had been spelled out in the PARPA matrix or in the PES.
3.3 PARPA II also invested in the provision of public goods and services, but gives more at-tention to local development without losing sight of the need to effectively integrate into re-gional and world markets. It also set as objectives: improving the monitoring of economic de-velopment; playing a more active role in the promotion and regulation of private sector activity; and developing public private partnerships. At the government’s request, the second PRSC se-ries was to support specific components of the government’s reform program. These compo-nents are an integral part of the wider PARPA, PES, and Performance Assessment Matrix (PAM) matrices, in particular macroeconomic management (for example, public financial man-agement reform), governance (for example, decentralization) and economic development (for example, accelerating shared growth).
3.4 The focus of PRSC series II was as follows: i) continue the reform of public financial management, including procurement and auditing; ii) empower communities to decide about investment in their districts; iii) support the elaboration of a decentralization strategy; iv) acce-lerate the quality of service delivery; and v) support reforms to improve the business environ-ment and remove constraints to growth, as well as facilitate two key measures to spur shared growth—maintenance and expansion of the national road network and increase in agricultural productivity
3.5 Prior actions and triggers for series II were taken directly from the Performance Assess-ment Matrix and included specific references to the corresponding paragraphs of PARPA II. Thus, PRSC series II was fully aligned with PARPA II, and contributed to its implementation (Appendix Table 4).
3.6 Ownership. The PRSC is part of the joint donor financing provided through the G19 to support the PARPA, as implemented through the PES and the three year performance assess-ment matrix, which is in turn derived from the PARPA strategic matrix. The PES is a govern-ment-prepared document – although the content of the Performance Assessment Matrix is ne-gotiated with partners as regards measures and indicators inserted from the PARPA strategic matrix. The PRSC is thus country-driven; and, ever since PRSC 2, all conditionalities, prior ac-tions, and triggers have been drawn from the matrix (a point emphasized by the government representatives and other stakeholders interviewed). Triggers and prior actions may be pre-sumed to be consistent with country constraints, as they are extracted from the matrix and agreed to by government with donors.
3.7 Participation. Participation results from the fact that the PRSC preparation takes place in the context of the G19 donor consultation process, and is complemented by specific consulta-tions, as needed, with stakeholders affected by the PRSC in question. But there is no consulta-tion process specific to the PRSCs that is independent of the G19 review process, as governed by the memorandum of understanding. Indeed, the memorandum proscribes the Bank from un-dertaking a separate dialogue outside the memorandum. For the Bank, the path to consultation

10
with stakeholders is through the G19 and its working groups to ensure that relevant govern-ment sector counterparts are part of the PRSC preparation process. According to Bank staff in Maputo, the G19 process, and embedding the PRSC therein, has helped bring government counterparts together across sectors in ways which would not have occurred in the absence of the PRSCs. At the same time, much remains to be done to improve the dialogue and collabora-tion between sector ministries and the Ministries of Finance and Planning, which, in the words of one former senior government official, still speak different languages.
3.8 The Bank’s role. Under the new PRSCs, the Bank has realized that donor harmonization and alignment with national budget processes leads to better budget preparation and execution. This has led the Bank to reduce the number of exceptions it had requested under the memoran-dum of understanding to align the Bank’s support with the Mozambican budget cycle. It has al-so led to significantly increased integration of investment projects into the budget, both at the preparation and execution stages – a point made by the 2007 Public Expenditure and Financial Accountability report. In turn, within the Bank, the PRSC process appears to be strengthening cooperation within the country team. Initially PRSCs were essentially viewed as poverty reduc-tion and economic management/private sector development instruments, focused on macro fi-nancial, public financial management and investment climate issues. Sector specialists have felt marginalized, but progressively are coming to appreciate that the PRSCs and the global policy dialogue have been able to generate more effective sector policy dialogue, both with the gov-ernment and among donors. This point was made to the IEG team, in particular by the agricul-ture and transport teams.
3.9 Effects on governmental policy dialogue. Government ownership of the process has grown as a result of the PRSC. Line ministry staff indicate the PRSCs had helped foster and improve the quality of dialogue with the Ministry of Planning and Development as well as with the Min-istry of Finance. Of particular importance, the PRSCs draw prior actions and triggers from the performance assessment matrices (derived from the PARPA strategic matrix), and monitoring of a single set of indicators by all donors has been achieved. The Performance Assessment Ma-trix contains only 50 indicators, jointly monitored by donors on the basis of performance indica-tors, of which a small subset are monitored by the PRSCs. Performance-based monitoring has also grown in importance and is increasingly used by general budget support donors.8 The in-tegration of general budget and sector issues has produced better results through a melding of sector and macro views. This has taken place chiefly due to the annual joint review (JR), a comprehensive stock-taking exercise based on prior sector reviews by 24 sector working groups. Indeed, a satisfactory outcome of the joint review is considered a key prior action for the PRSC.9
3.10 To summarize, both series of PRSCs have been well aligned with PARPAs I and II. By avoiding a separate policy dialogue and working through G19 processes and its sector working groups, the PRSC process has effectively helped the government focus its efforts on operationa-lizing the implementation of the PARPA with reduced number of key actions.
3.11 Results Focus/Monitoring and Evaluation. Under PRSC 1, there was no explicit results framework (RF), but rather a conventional policy matrix, which specified prior actions and po- 8 Performance based monitoring has grown in importance because all budget support depends on it, as a satisfactory joint review is required by memorandum signees as a prior action for their budget support. 9 An advantage of this approach is that it compels individual signatories to the memorandum not wish-ing to proceed on the grounds of non-performance to make their case to the community as a whole.

11
tential triggers for PRSC 1, 2, and 3 as well as 97 benchmarks (that is, non-core measures) for each PRSC component. The triggers for PRSC 2 were extracted from the reduced Performance Assessment Matrix of prior actions and indicators (as of April 2004). A specific results frame-work was introduced under PRSC 2, with its indicators taken from the related performance as-sessment matrices for 2004 and 2005-2007.10 Yet in the Program Document, the framework was applied only to education, health, HIV/AIDs, infrastructure, and agriculture. There were no in-dicators for improving public sector accountability, public financial management, and the in-vestment climate, which are key components of the operation. The indicators were specific and monitorable over time, and have in fact been monitored. They were also related to the corres-ponding PARPA objectives/outcomes.
3.12 PRSC 4 uses the same results framework as PRSC 3, but either: a) modifies the values contained in the PRSC 3 results framework to take account of developments after PRSC 3; b) re-vises indicative targets for future years in light of more recent information/estimates; or c) in-troduces new indicators in line with the evolution of the 2007-2009 performance assessment ma-trix.
3.13 As with PRSCs 1 and 2, the indicators for PRSCs 3 and 4 were specific, monitorable, and monitored. At the same time, the indicator pertaining to roads – percentage of roads whose re-habilitation and maintenance was deemed to be in reasonable condition– seems vague and dif-ficult to assess; more detail to permit an informed judgment would be helpful. In general, though, the selected indicators for monitoring progress with respect to PRSC objectives were appropriate. Furthermore, the three year forward looking nature of the results framework and its link to the three year Performance Assessment Matrix and the PARPA and related review mechanisms provides reasonable assurance that stakeholders have an incentive to collect the data needed for monitoring and evaluation. Furthermore, defining monitoring indicators and a results framework on a three year rolling basis and with a significant lead time generates stabili-ty of indicators, rather than ad hoc changes. This, in turn, facilitates steady progression of im-plementation performance from year to year.
3.14 The results, monitoring and evaluation framework for the PRSCs can be considered to be moderately satisfactory, especially since PRSC 3. The system is aligned with national systems and the performance assessment matrix, which are at the core of the PARPA monitoring and evaluation system, although this is weak. The indicators are usually specific and link, albeit weakly, policy actions to milestones and outcomes. It would have been appropriate for the PRSCs to introduce a series of triggers pertaining to their improvement. Not doing so can be considered a significant How effectively have the PRSCs contributed to donor harmonization around a country-owned, medium-term poverty reduction strategy?
3.15 Relationship to other general budget support programs. The Bank is one of 19 development partners providing general budget support to Mozambique. While the Bank was the largest budget support financier at the time of PRSC 1, accounting for 28 percent of general budget support financing in 2004, its relative importance in financial terms began to gradually decrease after that point to about 17 percent in 2007. However, this stagnation has reversed since the global food and fuel prices crisis in 2008 and has increased to between 22-25 percent. This is the
10 PRSC 2, processed in 2005, contained a performance assessment matrix for 2004 including “outturns,” enabling appreciation of the degree to which prior actions for PRSC 2, specified in PRSC 1, had been met.
12
result of additional resources being made available by the Bank to buttress countries from the economic downturn at the same time that other donors have reduced their budget support.
3.16 Performance assessment framework and policy matrix. The Bank’s PRSC is well aligned with the overall framework of general budget support in Mozambique. The Bank is an integral party to the Group of 19 development partners (G19) that provide general budget support to Mozam-bique. A memorandum of understanding (MOU) signed between all general budget support partners and the government sets out the framework, obligations and mechanisms for budget support. The memorandum of understanding is based on a number of key principles, including: a single performance assessment framework (PAF) subscribed to by all general budget support financiers and the government; joint monitoring of progress against the agreed upon Perfor-mance Assessment Matrix and unified reporting to all donors; alignment with domestic processes; predictability of financing; and a performance assessment framework for general budget support partners whose performance against the partner Performance Assessment Ma-trix is also regularly reviewed.
3.17 Effect of single Performance Assessment Framework (PAF) on policy dialogue. The general budget support partners and government have established a formal structure for regular gov-ernment-partner dialogue. The National Director of the Ministry of Planning and Development and the chair of the General Budget Support group co-chair a Joint Steering Committee, which meets monthly. The Joint Steering Committee includes the Troika Plus group, consisting of the Bank and the European Commission as permanent members and the previous, present, and fu-ture chairs of the General Budget Support group on a rotational basis. A total of 29 other groups also meet, including sector working groups, a budget working group, and so forth. Working groups prepare progress reports, propose targets for each year, and serve as the locus for sector-specific policy dialogue at a technical level. While the PRSC is limited to a key number of focal areas, the Bank has been engaged in broader general budget support dialogue through its par-ticipation in most working groups.
13
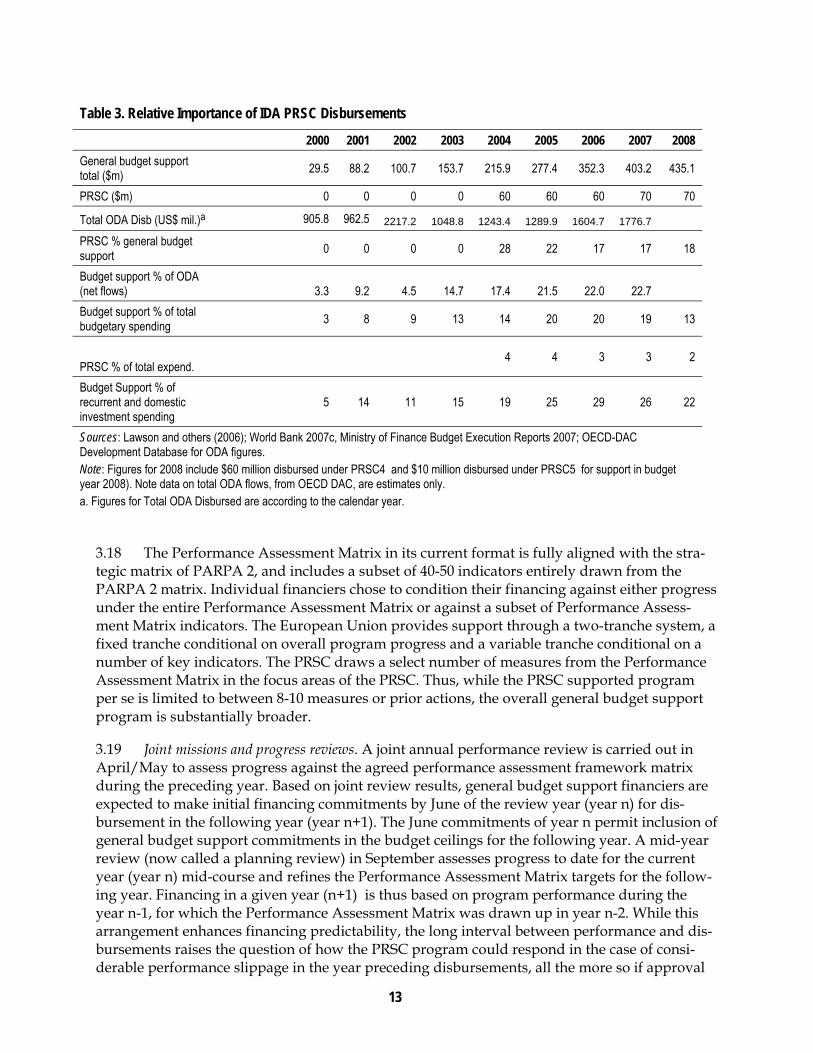
Table 3. Relative Importance of IDA PRSC Disbursementselative
2000 2001 2002 2003 2004 2005 2006 2007 2008
General budget support total ($m)
29.5 88.2 100.7 153.7 215.9 277.4 352.3 403.2 435.1
PRSC ($m) 0 0 0 0 60 60 60 70 70
Total ODA Disb (US$ mil.)a 905.8 962.5 2217.2 1048.8 1243.4 1289.9 1604.7 1776.7
PRSC % general budget support
0 0 0 0 28 22 17 17 18
Budget support % of ODA (net flows) 3.3 9.2 4.5 14.7 17.4 21.5 22.0 22.7
Budget support % of total budgetary spending
3 8 9 13 14 20 20 19 13
PRSC % of total expend. 4 4 3 3 2
Budget Support % of recurrent and domestic investment spending
5 14 11 15 19 25 29 26 22
Sources: Lawson and others (2006); World Bank 2007c, Ministry of Finance Budget Execution Reports 2007; OECD-DAC Development Database for ODA figures. Note: Figures for 2008 include $60 million disbursed under PRSC4 and $10 million disbursed under PRSC5 for support in budget year 2008). Note data on total ODA flows, from OECD DAC, are estimates only. a. Figures for Total ODA Disbursed are according to the calendar year.
3.18 The Performance Assessment Matrix in its current format is fully aligned with the stra-tegic matrix of PARPA 2, and includes a subset of 40-50 indicators entirely drawn from the PARPA 2 matrix. Individual financiers chose to condition their financing against either progress under the entire Performance Assessment Matrix or against a subset of Performance Assess-ment Matrix indicators. The European Union provides support through a two-tranche system, a fixed tranche conditional on overall program progress and a variable tranche conditional on a number of key indicators. The PRSC draws a select number of measures from the Performance Assessment Matrix in the focus areas of the PRSC. Thus, while the PRSC supported program per se is limited to between 8-10 measures or prior actions, the overall general budget support program is substantially broader.
3.19 Joint missions and progress reviews. A joint annual performance review is carried out in April/May to assess progress against the agreed performance assessment framework matrix during the preceding year. Based on joint review results, general budget support financiers are expected to make initial financing commitments by June of the review year (year n) for dis-bursement in the following year (year n+1). The June commitments of year n permit inclusion of general budget support commitments in the budget ceilings for the following year. A mid-year review (now called a planning review) in September assesses progress to date for the current year (year n) mid-course and refines the Performance Assessment Matrix targets for the follow-ing year. Financing in a given year (n+1) is thus based on program performance during the year n-1, for which the Performance Assessment Matrix was drawn up in year n-2. While this arrangement enhances financing predictability, the long interval between performance and dis-bursements raises the question of how the PRSC program could respond in the case of consi-derable performance slippage in the year preceding disbursements, all the more so if approval
14
is expected no later than August. It also implies, strictly speaking, that the Bank is required to make lending commitments prior to the Bank’s own internal review and approval of the pros-pective operation. Other donors face the same kind of issues.
3.20 Government views on PRSC alignment with other general budget support. The established general budget support framework has allowed for strong general budget support coordination and alignment of donors with the government’s program as outlined in the PARPA strategic indicators matrix (see PARPA II, Annex 3). Government representatives who were interviewed unanimously supported the alignment of the Bank’s PRSC with the G19 general budget support system, pointing out that the Bank’s convening power lends credibility to the program and the harmonized general budget support framework facilitates government dialogue with develop-ment partners. They also pointed to the Bank’s technical expertise as an asset in helping shape policy formulation. However, several government counterparts indicated there is room for the Bank to show stronger leadership in those areas in which it has technical expertise. Likewise, several general budget support partners indicated that the general budget support supported program would benefit from stronger Bank leadership on analytical work as a foundation for the program.
3.21 It is not clear whether the harmonized framework has reduced overall transaction costs for government. Government officials repeatedly pointed out that the working group set up and semi-annual reviews require substantial time commitments, even if the overall processes are relatively well aligned with the government’s internal reporting and budget preparation processes. Similarly, the set up requires substantial time commitments on behalf of general budget support donors, including Bank staff. Bank staff feel that these efforts are not well rec-ognized within the Bank and that the Bank provides little incentives to ensure close coordina-tion with general budget support donors.
3.22 Donor collaboration and alignment around the PRSC. The Bank’s efforts to harmonize PRSC support with that of other general budget support donors has clearly contributed to a closer working relationship between the Bank and other donors and may have facilitated such coordi-nation beyond general budget support. It has also helped raise awareness within the Bank team about the effects of the Bank’s approach and actions on other donors. The harmonization and close collaboration with other general budget support financiers has been facilitated by the presence of PRSC Task Team Leaders in the country office since 2004. The harmonized ap-proach has aligned all general budget support donors behind a common framework and pro-vided impetus to reforms in key areas, such as public financial management program, but it has also manifested shortcomings. The need to reach agreement among 19 partners and fully align the Performance Assessment Matrix with the PAPRA II matrix may have resulted in a coales-cence of donors around the lowest common denominator in terms of matrix content and caused a loss of flexibility in terms of obtaining inclusion of conditionalities/actions considered as im-portant by the Bank. Once the three-year Performance Assessment Matrix for a general budget support/PRSC series is agreed upon, it is largely cast in stone for the duration of the general budget support/PRSC series, although there can be “marginal” annual adjustments in the con-text of the mid-term planning reviews which finalize triggers for the following year.
3.23 Integration of the PRSC into the general budget support structure has thus meant that the PRSC has lost any ability to flexibly embrace and support core policy issues that emerge as dialogue develops. As a result, much of the Bank’s policy dialogue and support occurs outside the PRSC through sector-specific operations. At times, the Bank even relies on the IMF to inte-
15
grate arising core policy concerns into its program.11 Flexibility under the PRSC is reduced to marginal adjustment of specific matrix targets over time within the context of annual midterm reviews, rather than the establishment of yearly policy inputs/reforms to achieve strategic goals for the PRSC-supported multi-year series and the government’s underlying program.
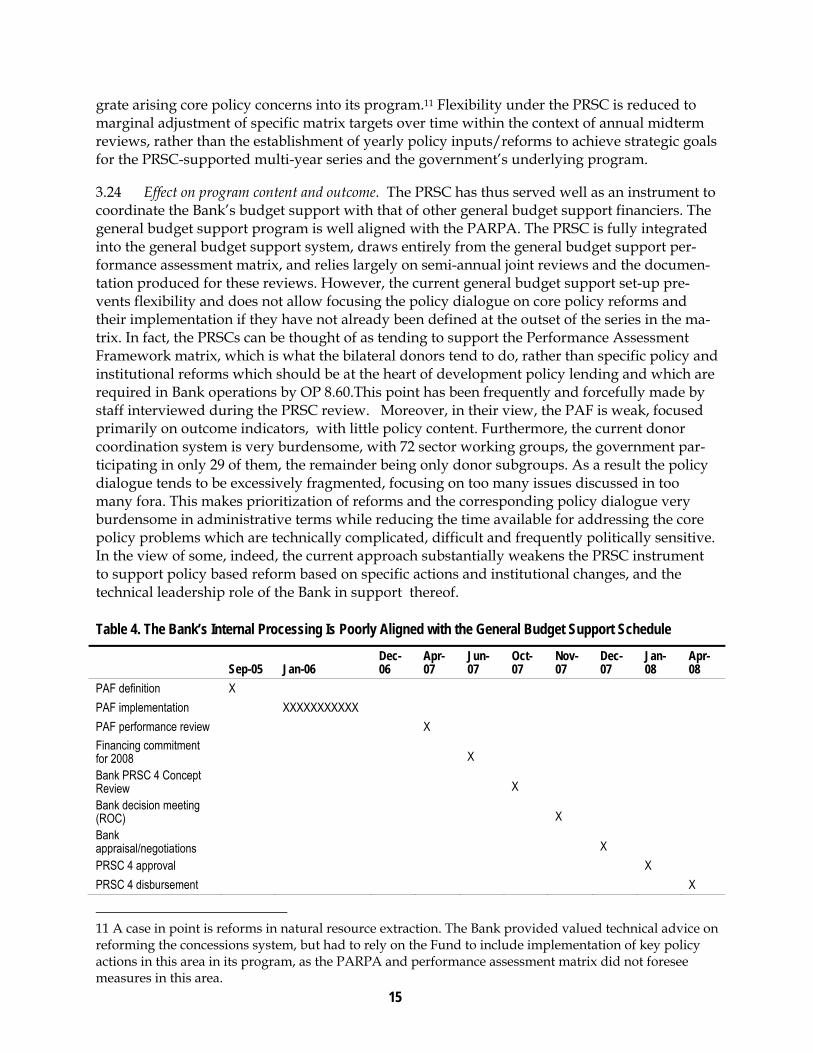
3.24 Effect on program content and outcome. The PRSC has thus served well as an instrument to coordinate the Bank’s budget support with that of other general budget support financiers. The general budget support program is well aligned with the PARPA. The PRSC is fully integrated into the general budget support system, draws entirely from the general budget support per-formance assessment matrix, and relies largely on semi-annual joint reviews and the documen-tation produced for these reviews. However, the current general budget support set-up pre-vents flexibility and does not allow focusing the policy dialogue on core policy reforms and their implementation if they have not already been defined at the outset of the series in the ma-trix. In fact, the PRSCs can be thought of as tending to support the Performance Assessment Framework matrix, which is what the bilateral donors tend to do, rather than specific policy and institutional reforms which should be at the heart of development policy lending and which are required in Bank operations by OP 8.60.This point has been frequently and forcefully made by staff interviewed during the PRSC review. Moreover, in their view, the PAF is weak, focused primarily on outcome indicators, with little policy content. Furthermore, the current donor coordination system is very burdensome, with 72 sector working groups, the government par-ticipating in only 29 of them, the remainder being only donor subgroups. As a result the policy dialogue tends to be excessively fragmented, focusing on too many issues discussed in too many fora. This makes prioritization of reforms and the corresponding policy dialogue very burdensome in administrative terms while reducing the time available for addressing the core policy problems which are technically complicated, difficult and frequently politically sensitive. In the view of some, indeed, the current approach substantially weakens the PRSC instrument to support policy based reform based on specific actions and institutional changes, and the technical leadership role of the Bank in support thereof.
Table 4. The Bank’s Internal Processing Is Poorly Aligned with the General Budget Support Schedule
Sep-05 Jan-06 Dec-06
Apr-07
Jun-07
Oct-07
Nov-07
Dec-07
Jan-08
Apr-08
PAF definition X
PAF implementation XXXXXXXXXXX
PAF performance review X
Financing commitment for 2008 X
Bank PRSC 4 Concept Review X
Bank decision meeting (ROC) X
Bank appraisal/negotiations X
PRSC 4 approval X
PRSC 4 disbursement X
11 A case in point is reforms in natural resource extraction. The Bank provided valued technical advice on reforming the concessions system, but had to rely on the Fund to include implementation of key policy actions in this area in its program, as the PARPA and performance assessment matrix did not foresee measures in this area.
16
Sources: Government of Mozambique, World Bank 3.25 The current general budget support set up is such that the program, including specific measures and indicators for a given general budget support/PRSC multi-year series is largely defined at the time of Performance Assessment Matrix formulation for the series (for example, the 2006-2009 series was defined in 2005-2006). Annual mid-year reviews refine Performance Assessment Matrix program targets for the coming year based on the Performance Assessment Matrix formulated for the entire series. However, as seen in Table 4, the Bank’s processing schedule thus far has been such that PRSC concept reviews and decision meetings have typical-ly taken place long after the general budget support annual review took stock of program per-formance and after the Bank was called upon within the general budget support framework to make a financing commitment for the following year.
3.26 If Bank internal reviews are to add any value at the strategic and technical level, they need to occur before the joint Performance Assessment Matrix for a particular general budget support/PRSC series is finalized. Similarly, if the role of the Bank’s decision meeting is to pro-vide inputs to decisions on financial commitments based on joint review results, the decision meeting would need to occur prior to, or immediately following, the annual joint review. Any decision by the Bank to reduce financing after a commitment is made by the country’s Bank staff following the annual review would negatively affect the predictability of Bank financing and be in contravention of the Bank’s commitment under the memorandum of understanding.
3.27 Relationship with the International Monetary Fund. The Fund, although not a signatory of the G19 memorandum of understanding, collaborates very closely with the G19. It organizes two missions a year – the first in late March before the Joint Review, and the second in August before the Mid-Term Review, which has a greater focus on the Budget for the following year. In the context of its missions, it meets with the G19 at the beginning and the end. In this way, ma-croeconomic discussions precede the G19 reviews and donors are fully apprised of Fund views as to macroeconomic performance. Satisfactory performance is a core condition for access to general budget support financing. The Fund participates in the G19 working groups on a regu-lar basis throughout the year, but collaboration with the Bank is intense throughout the year. This includes substantive discussion of the macroeconomic framework, but detailed macro-financial programming is left to the Fund.
3.28 Conclusion. The PRSC has served very well as an instrument to coordinate the Bank’s budget support with that of other GBS financiers. The program is well aligned with the PARPA and now draws its conditionalities exclusively from the common PAF. However, the way the PAF is currently set up severely constrains the introduction of non-PAF triggers to address is-sues that have emerged since the PAF’s original conception. From the standpoint of the Bank staff this is a considerable shortcoming. Another shortcoming of the PRSCs, as presently con-ceived, is that the Bank’s internal processing time table and procedures remain somewhat ill aligned with the general budget support framework, thus preventing internal reviews from making substantive contributions (see Table 4). This is a tractable problem to the extent that PRSC preparation within the Bank takes account of the fact that the principal opportunity for influencing the matrices during a PRSC series resides in the annual discussions in the two years preceding and the first year of a new series. The PRSC processing schedule could be brought in-to line with memorandum undertakings by ensuring that a Bank decision meeting occurs im-mediately following the Joint Review to enable Bank staff to make a more empowered indica-tive commitment as to Bank financing availability for the following year’s budget. On balance,
17
however, performance with regard to donor harmonization has improved substantially be-tween PRSC 1 and PRSC 4, and fully so since PRSC3. Thus the objectives can be said to have been attained with moderate shortcomings for PRSC operations to date. Performance is thus moderately satisfactory over that period. The process worked well, because the Bank has in-creasingly met its commitments to adhere to the memorandum. The remaining shortcoming is the lack of full alignment of Bank internal procedures and processing schedules with those mandated by the memorandum of understanding which would imply Board approval by end August. If this were to be done, it would technically be necessary to wait up to five months to declare effectiveness if the intent is to disburse funds early in the first quarter of the following Mozambican fiscal year. Many people interviewed said this would be unnecessarily compli-cated and that the present system does not pose unmanageable problems or risks.
How well have the PRSCs been aligned with country policy formulation, budgeting, and planning processes, and how effectively have they contributed to predictable resource flows? 3.29 Alignment with domestic processes. Although the PRSC has been an integral part of the general budget support framework since PRSC 1, the extent of alignment has evolved since the first operation. PRSC 4, approved in January 2008 on a non-objection basis, marks the first year that the PRSC is fully aligned with the Performance Assessment Matrix assessed in April/May 2007.12 In an effort to ensure disbursement early in Mozambique’s fiscal year, PRSC 2 was de-signed as a two-tranche operation. This allowed a shift of disbursements from the last quarter of Mozambique’s fiscal year (PRSC 1 and first tranche of PRSC 2) to the first quarter (PRSC 2 second tranche, 2006), a schedule maintained since then. The Bank has aligned the PRSC with that of the General Budget Support group, even though its internal processing timetable and procedures cannot easily be aligned with the general budget support timetable, as seen in Table 4.
3.30 The government has a number of reporting requirements to the National Assembly which are of importance with regard to economic and financial planning over the electoral cycle (see Appendix Table 13). Elections are normally held every five years in December. Within 45 days of being elected, the new government has to present its Five-Year Program to Parliament. Following that, every year the government has to present an implementation plan for the fol-lowing year (the so-called Plan Economica e Social, PES) to the Parliament at the same time as the annual budget. Under the terms of the memorandum, the PES includes as an annex the corres-ponding annual tranche of the strategic matrix of the PARPA. It also has to prepare an annual implementation report (so-called Balanço do PES, BdPES) no later than 45 days following the end of the year and present it to Parliament.
12 All measures under PRSC are now drawn from the performance assessment matrix. However, due to the Bank’s processing schedule, the PRSC has at times drawn from the matrix of more than one year or included measures that the government completed after the April/May joint review of that year.

18
Table 5. Calendar of Events in the Preparation of the Annual Budget and Economic and Social Plan
Date Event
February BdPES for yr n-1 is prepared
April Cabinet discussion of the Medium Term Fiscal Framework
May Budget Ceilings are presented to sector ministries for the preparation of Budget for year n+1.
July Departments submit draft budget proposals to MPD/MF before July 31
August Draft Budget is finalized, together with draft PES for year n+1, as well as BdPES for first Semester
September Submission of Draft Finance Law (and PES) to Cabinet and to National Assembly before end of the month
October-December Parliamentary discussion and adoption of PES and Budget Law for yr n+1
January of yr. n+1 Budget put into place
Source: Government of Mozambique
3.31 Ideally, the government would like to have indicative commitments for funding of the budget of year n+1 year no later than end May of year n, to permit the establishment of credible ceilings to be used by sector ministries during budget preparation. By end July, it would be ideal if the indicative financing commitments could have been turned into confirmed commit-ments on the part of donors. In this way the budget law for year n+1 can be finalized with per-fect information about resource availability. The memorandum of understanding specifies that donors should make indicative commitments as to funding for year n+1 no later than four weeks after the conclusion of the Joint Review, held in April, and confirm commitments by end-August.
3.32 The Bank became a signatory to the G19 memorandum of understanding in 2004 and, in that context, its commitments are described in Annex 10 of the memorandum.13 This annex re-fers to the Provision of Balance of Payments support by the World Bank Group, and it is appar-ent that the proposed timetable for preparation, approval, and disbursement are not compatible with the government’s wishes. The annex clearly talks of provision of balance of payment sup-port for year n that is prepared approved and disbursed in year n, whereas the government wants the PRSC operation prepared in year n to support the budget for year n+1, and to be dis-bursed in year n+1.
3.33 Table 2 in Chapter 1 of this case study presented key dates for preparation and approval of PRSCs 1-4 and other instruments. PRSCs 1-2 were broadly in line with the memorandum ap-proach for balance of payments support, though with delays. Disbursements occurred in the third and fourth quarters of the calendar year the operation was approved. However, the gov-ernment requested that PRSC 2 be split into two tranches, with the second tranche disbursed in
13 The Bank’s commitments, as described in Annex 10: “The World Bank will make a multi-year indica-tive commitment of Balance of Payments support under its CAS. The actual amount of support for any given year will be more specifically determined during the appraisal and negotiations of an operation under a series of PRSC credits and definitively determined after the operation is presented to IDA Board of Directors for their approval. At present appraisal and negotiations are expected to occur in April-May and Board presentation in June of the year n. IDA will use the joint GoM and PAP assessment of perfor-mance in year n-1, particularly against prior actions selected from the Performance Assessment Matrix and agreed with the GOM for inclusion in the relevant PRSC, to appraise the credit for year n. The credit for year n will also identify triggers, also selected from the Performance Assessment Matrix and agreed with the GoM, which will become prior actions for the proposed credit for year n+1. IDA will normally disburse within one to eight weeks from the date of Board approval.”

19
the first quarter of 2006, to bring disbursements in line with 2006 budget requirements. This was done. From PRSC 3 onwards the Bank has aligned itself with government wishes in terms of provision of budget support to be disbursed in year n+1. This goal has been achieved and the preparation timetable in year n has been synchronized with government wishes in terms of budget preparation (that is, indicative commitment by end May).
3.34 This difficulty could have been avoided if processing had started early in the year to permit the decision meeting of the Regional Operations Committee before end May, and the Board before end July. Such a schedule would imply holding the concept meeting earlier in the calendar year (or even in year n-1 or year n-2) to allow the Task Team to prepare and pre-appraise the project in time for a May decision meeting of the Regional Operations Committee. There would still be the issue that a Board meeting before end July would, in principle, entail a disbursement lag of five months, long for fast-disbursing operations. However, as indicated ear-lier, the existing system is not considered to be a major problem.
3.35 Predictability of disbursements. From the preceding discussion it is clear that from PRSC 2 onwards, the Bank has provided government with a clear commitment that resources commit-ted under the PRSC prepared in year n will be disbursed no later than the first quarter of year n+1.
3.36 Exit strategy. In principle, the Country Assistance Strategy provides an indicative lend-ing amount to be disbursed under the PRSC window for each of its three years, and it is clear that the government considers that this Board approved “undertaking” will be met. However, the memorandum of understanding states clearly that: IDA “will use the joint government and Program Aid Partner (PAP) assessment of performance in year n-1, particularly against prior actions selected from the Performance Assessment Matrix and agreed with the government for inclusion in the relevant PRSC, to appraise the credit for year n.” According to the memoran-dum, the indicative annual commitment made following conclusion of the Joint Review can on-ly be changed between then and confirmation of the commitment if an underlying principle of the memorandum is violated. In principle, therefore, exit from a PRSC could only occur in cases of severe underperformance. The government is aware of this, as a signatory to the memoran-dum.
3.37 However, in the case of PRSC 4, the amount of the credit was reduced from USD 70 mil-lion (the amount specified in the Country Assistance Strategy) to USD 60 million, because Mo-zambique’s Country Performance and Institutional Assessment (CPIA) rating had been reduced for 2008 and there had been a lot of front loading of the program, which entailed a reduction in its access to IDA resources. This reduction in performance notwithstanding, the program doc-ument for PRSC 4 announced that IDA would accelerate the preparation of PRSC 5 to ensure that a total of USD 70 million would be made available to Mozambique during 2008, in line with commitments made under the Country Assistance Strategy. In actuality, under PRSC 5, Mo-zambique received USD 90 million by the end of 2008, plus USD 10 million from trust fund money made available under the Bank’s Global Food Crisis Response Program (GFRP). Thus, altogether, during the entire calendar year of 2008, Mozambique received approximately USD 160 million (USD 60 million disbursed in early 2008 plus USD 90 million disbursed in late 2008, plus USD 10 million in trust funds. Thus, the reduction in funding under PRSC4 did not affect budget support for 2008.
20
3.38 The April 2008 Joint Review concluded that “overall progress with the reform program in 2007 was satisfactory and that there exists a satisfactory basis for the donors to continue to give budget support even though the G19 continued to be concerned regarding the limited progress in the areas of governance.” There was also continued weakness with regard to pover-ty monitoring, budget formulation for the allocation of resources to strategic objectives, the ac-celeration of the HIV/AIDs program, the management of natural resources, and slow imple-mentation of the Anti-Corruption Strategy (PRSC 5, Program Document, para. 41). Two bilateral donors expressed their intention to reduce their budget support (Switzerland, Swe-den), in particular the amount disbursed under the variable tranches of their GBS operations. This was due to less-than-complete satisfaction with Mozambique’s performance.
3.39 Conclusion. The second tranche of PRSC 2 as well as PRSCs 3, 4 and 5 have been fully aligned with the government’s desire to receive disbursements in the first quarter of the Mo-zambican budget year. In this regard, PRSC objectives have been met with no shortcomings for PRSCs 3, 4, and 5. Against this, one has to recognize that there were shortcomings for PRSC 1 and for the first tranche of PRSC 2, but this was before IDA had really switched into budget support mode.
3.40 On balance, the moderate shortcomings of PRSCs 1-2 have been more than offset by the absence of shortcomings in terms of the timing of disbursements in PRSCs 3, 4 and 5, leading to the conclusion that, on balance, PRSC objectives with regard to disbursements have been at-tained with only minor shortcomings.. Yet, it can be argued that there has been less success in aligning PRSC preparation with the Mozambican budget preparation cycle, but this has not posed insurmountable problems . In conclusion, overall objectives were attained with minor shortcomings.
4. PRSC Results
How effectively have PRSCs helped Mozambique strengthen its public financial management system? 4.1 Diagnostic work. Public financial management reform in Mozambique began in 1997, when the government, with support from the World Bank and other donors, embarked on a comprehensive Expenditure Management Reform Strategy (EMRS). Its central objectives were to: increase the coverage and transparency of the process of public expenditure management; ensure the efficiency and effectiveness of public expenditure programs to support policy objec-tives; and guarantee the long term fiscal sustainability of fiscal programs.14 The Country Finan-cial Accountability Assessment and 2001 Public Expenditure Review found that the risk of waste, diversion, and misuse of funds in Mozambique was high. Public accounting and Budget 14 Public financial management and procurement (PFMP) reforms are based on the Country Financial Accountability Assessment (FY01), two Public Expenditure Reviews (FY01 and FY03), and the Country Procurement Assessment Report (FY04). The public financial management program has also been the subject of two World Bank-International Monetary Fund HIPC Africa Action Plan exercises, and two Public Expenditure and Financial Accountability reports (2004, 2006).

21
Execution Reports (BERs) did not adequately report ministerial ‘own receipts’ and donor-funded expenditures – a problem highlighted during the structural adjustment loan period. Cash management was inefficient and lacking in transparency due to the many unmonitored accounts. Internal auditing was ineffectual due to a lack of capacity and funding. External au-diting and parliamentary oversight was weak.
4.2 The 2003 Public Expenditure Review focused not only on public financial management, but also on traditional public expenditure issues in key sectors and concluded that expenditure levels and expenditure growth were not sustainable. The top two priorities were to increase revenues and improve control over the level and quality of expenditures. Increasing expendi-tures in priority sectors would require cuts in non-priority sectors. Furthermore, the allocative efficiency, cost effectiveness, equity, and poverty orientation of spending required improve-ment. The key problem as regards the policy process was that public expenditure was not stra-tegically determined by government on the basis of well defined sector strategies supported by donors. This had led to a mosaic of programs, which were frequently not properly recorded in the budget and budget execution reports. There were weak links between expenditures, targets, and outcomes and a lack of information to facilitate assessment of expenditures. Low execution rates in priority sectors resulted mainly from delays in releasing funds. Comprehensive civil service reform was badly needed, as was decentralization of administrative and fiscal responsi-bilities.
4.3 The FY03 Country Procurement Assessment Report reviewed the public procurement system against generally accepted principles of sound procurement management-- that is, transparency, economy, and efficiency necessary for optimal use of public funds. Recommenda-tions were coordinated with other donors engaged in procurement reform. Reforms also per-tained to: i) a new procurement law to bring legislation up to international standards; ii) prepa-ration of standard documents and procedure manuals; iii) creation of appropriate supervisory and oversight institutions; and iv) appropriate capacity building.
4.4 To address all of these issues, the government undertook a public sector reform program beginning in 2001. The program sought to: i) establish a new public financial management sys-tem; ii) improve the legal, judicial, and court system; iii) reform the government pay scale; iv) reduce the number of ghost workers; v) gradually decentralize civil servants; and vi) implement a training program. It also included a financial management law in 2001, a budget classification system to track poverty-related expenditures, and SISTAFE, a new integrated financial man-agement information system (IFMIS). In 2005, the program was updated to extend to 2011 and widened to include governance, anti-corruption, and justice system measures. The program is supported by the Bank’s Public Sector Reform project15 and the Decentralized Planning and Fi-nancing Project. In addition to work under the PRSCs, Mozambique has received substantial support from the IMF and other donors. There is a donor working group with five subgroups working on taxes, budgeting, expenditure management, auditing, and procurement.
4.5 Public financial management content and design. PRSC 1’s public financial management component was to support cross-sector actions to improve public sector performance. Specific objectives under series I were to: i) realize higher revenues and enable fiscal adjustment; ii) ra-tionalize the tax system; iii) maintain a 65 percent share of poverty-related expenditures in total 15 The Bank’s Public Sector Reform Project had five components: rationalize/decentralize processes for service delivery; improve policy formulation and monitoring; professionalize human resources in public service; improve public financial management and accountability; and fight corruption.

22
expenditures; iv) improve expenditure management; v) improve procurement practices; vi) build local capacity to manage decentralized service delivery; and vii) improve capacity to ad-dress corruption issues. These were supported by prior actions and triggers, initially under the PRSC 1 policy matrix and, thereafter, drawn from the performance assessment matrix. The at-tainment of results was to be monitored through benchmarks and prior actions pertaining in particular to the following: revenue raising; execution of the budget in line with the 65 percent criterion; and implementation of the integrated financial management information system, SISTAFE, initially within the Ministry of Planning and Finance and extended to other key min-istries. It also included approval of a new procurement decree, regulations, and bidding docu-ments. PRSC 1 was also supposed to benchmark efforts to restructure ministries, reduce corrup-tion, institute pay reform, and support decentralization through a new decentralization law.
4.6 PRSC objectives were not substantially revised for series II, although the triggers and prior actions were adjusted to be better aligned with matrix indicators. In addition, under PRSC 5, the proposed trigger pertaining to priority sectors requires that expenditures for priority sec-tors in budget planning and execution should be in line with the Medium-Term Expenditure Framework for 2007. Similarly, Series II introduced specific triggers for PRSC 4 and 5 pertaining to increasing coverage and efficiency of internal and external audits. Series II introduced new triggers on public sector human resource management and local budgetary capacity, along with a national decentralization strategy-related trigger.
4.7 The reforms monitored under the PRSC series I and II were broadly in line with the di-agnostic work and the government’s broader public sector reform program. Reforms were ap-propriate, comprehensive, and reasonably sequenced. On the revenue side the revenue/GDP ratio before grants was 12-14 percent of GDP, less than the expenditure levels needed to attain poverty reduction targets. Recourse to external grants, then 5-10 percent of GDP, as a perma-nent source of financing, was not credible. Hence it was right for the PRSCs to focus on increas-ing revenues via the creation of and support to a Central Revenue Authority (CRA). On the ex-penditure side, it was appropriate to focus reform efforts on improving budget execution, procurement, and reporting. It was also important to ensure the incorporation of all ministerial revenues and include donor-executed projects in the budget.16 Another undertaking was to allo-cate at least 65 percent of the budget to expenditures in priority sectors.17 In budget execution, modernization of budget procedures via elimination of the cash advance (so called “duo-decimal”) system and introduction of a new financial management information system, SISTAFE, were also justified. Improved internal auditing was needed, hence the importance of the action plan for improving internal audits. Procurement reform was also essential. Thus, the focus on improving budget formulation via the introduction of a Medium-Term Economic Framework and program budgeting was welcome, as was work to improve personnel and pay-roll management.
OUTCOMES
4.8 Outcomes have been assessed on the basis of IEG discussions with government officials and Bank staff, PRSC documents, G19 aide-memoires reviews, IMF Staff Reports and, in partic-ular, the 2007 Public Expenditure and Financial Accountability assessment. The overall conclu-sion is that there have been substantial positive developments in public financial management during the PRSCs, particularly series II, though significant weaknesses remain to be rectified.
16 The economic recovery credits had signaled this as a major problem. 17 The target was to be revised in the light of PARPA II.

23
The importance of improved revenue collection is widely recognized in the PRSCs. During the series, the revenue/GDP ratio increased from 12.9 percent of GDP in 2003 to 16.4 percent in 2007. The 2006 Public Expenditure and Financial Accountability evaluation estimates that only 1-5 percent of revenues have not been integrated into the government budget. Efforts correctly focus on the need to further improve revenue mobilization, while avoiding tax distortions and penalizing competitiveness.
4.9 Throughout the series, budget and actual expenditures on priority sectors were roughly in line with matrix targets and PRSC triggers, namely, 65 percent of total expenditures, with at least 50 percent devoted to health and education. The budget was put in place more quickly than in preceding years, thanks to SISTAFE, and there has been better collaboration between the Ministry of Finance and line ministries. Donor contributions were roughly in line with com-mitments. Good progress was made in integrating donor-financed projects into the 2007 budget ceilings, including through the issuance of accounting guidelines, although challenges remain in bringing projects onto the treasury single account (TSA). The 2007 Public Expenditure and Financial Accountability report estimates that rate of integration to be about 95 percent.
4.10 There are a number of weaknesses. First, the link between the budget and the PARPA should have improved hand-in-hand with the Medium-Term Economic Framework. Program budgets were not yet used on the basis of desired PARPA results. Second, it was not possible to assess the impact on expenditure on poverty reduction, as the budget nomenclatures were not sufficiently detailed to permit it. The government was working to improve the classifiers to provide sufficient detail to permit the analysis of the poverty impact of government spending. Some progress has been made on this front, though there is a need for the line ministries to start using the system more, independently from the central ministry.
4.11 Evidence from the Program Documents for PRSCs 1-5 and the Implementation Comple-tion Report for PRSCs 1-2 showed that the rollout of SISTAFE to ministries and local govern-ments was on track, and had been accompanied by an extensive and operationally relevant training program. By end March 2008, the system had also been introduced for 31 districts, 4 more than originally planned. This should have enabled the completion of the transition to di-rect budget execution by all ministries, under which all payments are paid directly from the treasury single account into the supplier’s account. This system permitted the government to put an end to the duo-decimal system of advancing funds into ministerial bank accounts. It has helped to standardize budget execution procedures and reduce the number of ministerial bank accounts, permitting better cash management. Direct budget execution of goods and service transactions reached 90 percent in 2008, against a target of 50 percent.18 In addition, the gov-ernment developed a multicurrency module for the treasury single account, operational since September 2007, which facilitated execution of donor financed projects through the treasury single account.
4.12 Much progress on procurement was made during the PRSCs, starting with the adoption of a new procurement code in 2005 and publication of revised regulations based on competition and transparency. The code is largely aligned with international and Bank norms, although some exceptions prevent the Bank from entering into pooled fund projects that use national procedures. A central procurement oversight institution became operational (UFSA) in 2006 to 18 Across all categories, however, only about 25 percent of the budget is directly executed, and there are signs that some people are still bypassing the system and have had trouble making the transition from the old way to the new (electronic) way.

24
supervise the activities of 776 procurement agencies (UGEAs) at the central and local level. A total of 472 units were created by the end of 2007.
4.13 A capacity-building program of 1,800 technicians began at the national and sub national levels. For internal auditing, the objective adopted was to increase efficiency and accountability by improving internal auditing by line ministries. In 2006, the government almost doubled the number of audits compared to 2005, with an implementation rate of 70 percent of recommenda-tions. Increasing the audit capacity of line ministries allowed for the concentration on more complex audits and the development of an inspection function. In addition, the government es-tablished internal audit units in 25 percent of all central and provincial bodies by end 2007. Re-forms also sought to strengthen the external audit institution – the Tribunal Administrativo (TA). There has been substantial progress on this front. The number of audits has risen from 3 in 2003 to 360 in 2007, in excess of PRSC targets. State accounts have been submitted to Parlia-ment in a timely manner since 2005, and account quality has improved, though weaknesses re-main in audit quality and in follow-up to audits.
4.14 Although human resource management in the public sector is included under the go-vernance pillar of the assessment matrix, there is a clear overlap with public financial manage-ment as regards payroll management, as wages represent 50 percent of current expenditure. The objective of reforms is to improve payroll management by the creation of an integrated per-sonnel and payroll management system, based on a single registry of state officials and civil servants (CAF), based on a civil service census completed in 2007 (trigger for PRSC 5). At the same time, a payroll module was developed in SISTAFE, which the government has used to pay civil service wages since early 2008.
4.15 Reforms were undertaken to support the decentralization process. The process began under PRSC 3 with definition of criteria for allocation of the 2007 investment budgets for dis-tricts – a prior action that was completed. PRSC 4 was to develop both a decentralization strate-gy and a strategy for capacity building in planning and finance at the local level, with prior ac-tions pertaining to both. But major delays were encountered in both regards. As previously noted, two Public Expenditure and Financial Accountability (PEFA) assessments were carried out in 2005 and 2007, pertaining to budget years 2004 and 2006. The assessments are based on an evaluation of 31 indicators using a standardized methodology incorporating a letter rating system (A, B, C, D), with well-defined rules for grading and aggregation. The results, summa-rized in Table 6, show the overall improvement in performance. The number of indicators with As and Bs rose between 2004 and 2006, and there was a corresponding decline of indicators with ratings of C or D. Averaging scores for the 31 indicators reveals a 15 percent improvement over the two-year period: 14 indicators showed an improvement in 2006 over 2004, 13 were un-changed, and 4 worsened. The most significant improvements came in revenue collection and management; cash management; payroll, procurement, and internal controls; and donor prac-tices. Figure 1 provides a comparison of the scores in specific areas.
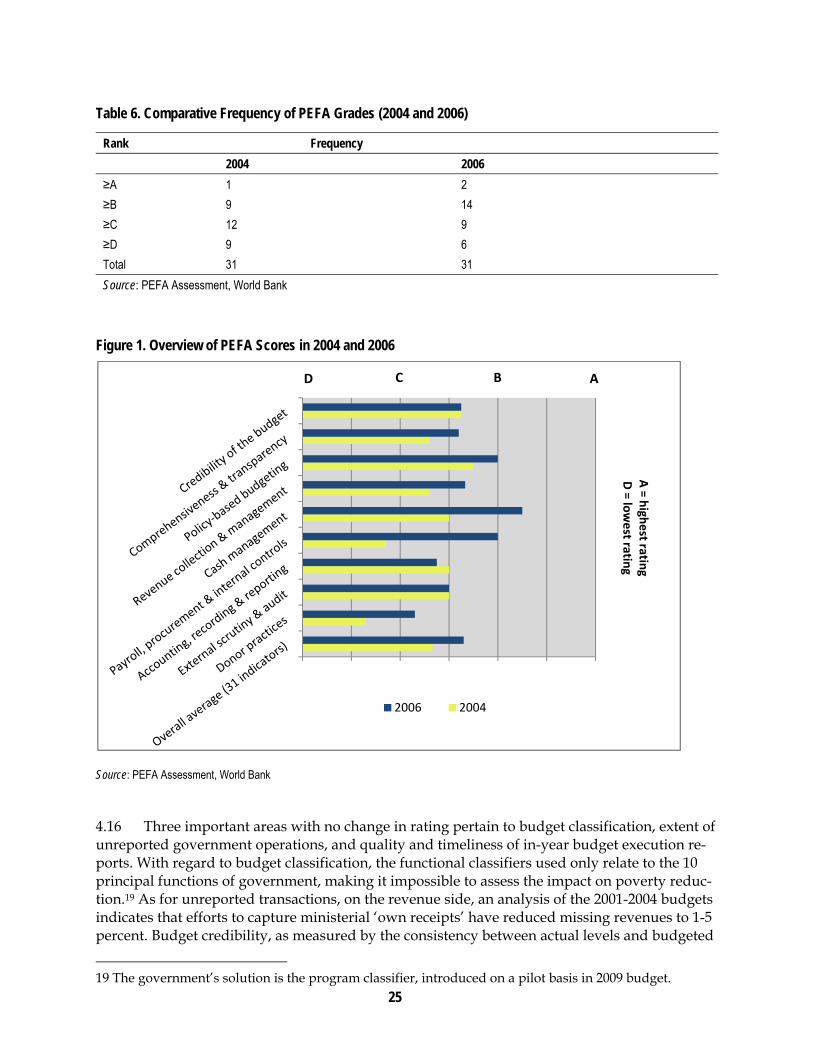
25
Table 6. Comparative Frequency of PEFA Grades (2004 and 2006)
Rank Frequency
2004 2006
≥A 1 2
≥B 9 14
≥C 12 9
≥D 9 6
Total 31 31
Source: PEFA Assessment, World Bank
Figure 1. Overview of PEFA Scores in 2004 and 2006
Source: PEFA Assessment, World Bank
4.16 Three important areas with no change in rating pertain to budget classification, extent of unreported government operations, and quality and timeliness of in-year budget execution re-ports. With regard to budget classification, the functional classifiers used only relate to the 10 principal functions of government, making it impossible to assess the impact on poverty reduc-tion.19 As for unreported transactions, on the revenue side, an analysis of the 2001-2004 budgets indicates that efforts to capture ministerial ‘own receipts’ have reduced missing revenues to 1-5 percent. Budget credibility, as measured by the consistency between actual levels and budgeted
19 The government’s solution is the program classifier, introduced on a pilot basis in 2009 budget.
0 1 2 3 4 5 6
A = h
ighest ratin
gD = lo
west ratin
g
2006 2004
D C B A
26
amounts, both on the expenditure and revenue side has shown no improvements. Collection of information on resource flows to service providers has not been ameliorated through public ex-penditure tracking surveys.20 The lack of information on resources received by front line service delivery units is due to the fact that these units are neither state budget holders nor cost centers for accounting purposes. Information is available at the provincial and district levels, but not through SISTAFE. This situation needs to be rectified to assess how service delivery units func-tion. One way to do this is through public expenditure tracking survey; one was undertaken for the health sector in 2002, but has not been repeated. This process was continued in 2008 with a public expenditure tracking survey in the education, as highlighted in the 2007 Poverty As-sessment.
4.17 The overall conclusion of the Public Expenditure and Financial Accountability is that there has been good progress with respect to budget execution, thanks to the far reaching pro-gram of reforms and the introduction of SISTAFE. Yet looking forward, much remains to be done. Mechanisms for strategic allocation of resources lag. The quality of the Medium Term Fis-cal Framework (MTTF) leaves much to be desired in terms of medium-term projections, and there is still no program classifier or detailed functional classifier to cost out government poli-cies and programs. The upcoming introduction of program budgeting should help, but this ma-jor task will require careful planning and capacity building.
4.18 Alignment of public expenditures with policy priorities. An important objective of the PRSCs is to contribute to overall financing of the budget and support the implementation of the PRSP and its poverty-reducing expenditures. In this regard, all the PRSCs included the requirement, in the form of prior actions, that 65 percent of the budget excluding interest be allocated to ex-penditures in priority sectors and that 65 percent of actual expenditures be spent on these sec-tors. In general, this pledge has been more or less respected, according to the quarterly Budget Execution Reports produced by the government. However, a focus on broad priority areas does not mean that expenditure is pro-poor. None of the PRSC documents or quarterly reports pro-duced for the donors’ Budget Analysis Group21 attempt a detailed analysis of expenditure to see the extent to which it is pro-poor. This would require a clear link between PARPA priorities and the budget, both at the allocation and expenditure stages, which Mozambique is not yet able to do, with the possible exception of the education sector.22.The information needed to undertake a functional analysis of the budget to identify pro-poor functions and programs is not available because a sufficiently detailed functional classification does not exist.23
4.19 Expenditure predictability. Expenditure predictability has improved to the extent that the difference between aggregate expenditure outturns and originally approved budgets has, argu-ably, been declining over the last few years. But variance at the individual ministerial level has risen.
4.20 Conclusions. According to donors interviewed, the Bank did not play a leading role in the provision of technical assistance or capacity building efforts over the last few years. Rather, it was the IMF that has taken the lead through its systematic use of structural benchmarks leading
20 PI-1 measures the deviation between the actual primary expenditure to the original approved budget. 21 The Budget Analysis Group is a technical working group of donors that examines budget perfor-mance. 22 A point made in Chapter 5 of the 2007 Poverty Assessment (World Bank 2008b) 23 A classification system is applied in both the formulation and execution of the budget relating to the 10 principal functions of government.
27
to effective implementation of SISTAFE. But this should not detract from the role that Bank has played through the PRSCs and the G19 to buttress these reforms. The Bank has been the clear leader with respect to procurement reform, both in terms of conception and implementation. Areas where the Bank might have pushed harder for further progress pertain to the introduc-tion of a more detailed functional budget classification, the undertaking of more public expend-iture tracking survey studies, the incorporation of ‘receitas próprias’ (or revenue receipts on budget) and the recording of donor-financed expenditures.
How relevant and effective a vehicle have PRSCs been in helping Mozambique set conditions for poverty reducing growth? 4.21 Extent of growth focus. PRSCs 1-2 focused primarily on macroeconomic stability, public financial management, and financial sector issues that affected macroeconomic stability. They also addressed private sector development issues and improving the enabling environment for business. PRSCs 3-4 continue this emphasis, but placed more stress on the improvement of transport infrastructure and agricultural sector development. PRSC 1 expected to help maintain growth rates of more than 7 percent per year, bring inflation to 6-8 percent per year, and reduce the poverty headcount to less than 50 percent by 2007. PRSCs 2, 3, and 4 contain no references to development outcomes in terms of target rates of growth or poverty reduction.
4.22 The first PRSC series adopted the objective of providing continuing support to reforms undertaken by the recently completed Economic Management and Private Sector Operation, which aimed to improve public financial management and create a better environment for pri-vate sector led growth.24 Thus PRSC 1 contended, in line with the recommendations of the 2001 Country Economic Memorandum, that sustained growth required a second generation of re-forms to improve agricultural productivity, increase labor intensive manufacturing and servic-es, and increase the efficiency of poverty related public expenditures.25 Reforms would focus on four issues: consolidating gains in the financial sector; improving the business/regulatory envi-ronment; improving infrastructure in electricity, telecommunications, and transport; and aug-menting agricultural productivity. The growth strategy supported by the first PRSC series was based mainly on the analytical work undertaken in the 2001 Country Economic Memorandum, the Investment Climate Assessment (2003) and a Legal and Judicial Assessment (2004), as well as the Financial Sector Assessment Program (2003). The growth strategy underpinning the second series (PRSCs 3-5) was further informed by the 2005 Country Economic Memorandum.
4.23 The focus on financial sector issues was justified on the grounds that a lack of affordable finance was a fundamental business problem, with the 2003 Investment Climate Assessment pointing to the high cost of finance and excessive collateral requirements resulting from the high level of non-performing loans. The first PRSC series focused on improving banking sector soundness and increasing access to credit.26 Key PRSC 1 measures were: i) assisting in the adop-tion of international audit standards by all banks; ii) supporting privatization of the govern-
24 The Economic Management and Private Sector Operation supported actions identified by PARPA I in the area of public financial management and financial sector supervision to reduce the risk of financial crisis; improve macroeconomic stability to sustain growth over the medium term; improve the invest-ment climate; and lay the foundation for legal and judicial reform. 25 These points were also reiterated by the 2007 Poverty Assessment (World Bank 2008b). 26 This involved continued implementation of a comprehensive financial sector reform program, which had incurred setbacks over the preceding few years.

28
ment’s remaining stake in two banks; iii) revising the Financial Institutions Law; iv) submitting a new bankruptcy law for banks to the Assembly; v) and preparing an action plan to bring the insurance industry into compliance with international accounting standards.27 Issues included streamlining business registration, making the labor market more flexible, lowering customs clearance times, revising the commercial code, speeding VAT refunds, reducing unjustified government inspections, and improving the security and transferability of land use rights.28 In addition, PRSC 1 monitored development benchmarks in the electricity, telecommunications, and agricultural sectors. Under PRSC 2, the emphasis was on macroeconomic performance, par-ticularly price stability; revenue mobilization; maintenance of a competitive exchange rate; es-tablishment of fiscal discipline; avoidance of inflationary monetary policy; and improved reve-nue collection. PRSC 2 stressed improved public expenditure composition, efficiency, and management, with the introduction of SISTAFE needed for growth and poverty reduction. PRSC 2 also focused on the cost of bank finance and labor code revision.
4.24 Growth issues are addressed under the economic development pillar of PARPA II, and focus on improving the investment climate, removing constraints to growth, and promoting agriculture growth. Under PRSC 3, the sole prior action in this area pertains to the simplifica-tion of procedures to start a business. Triggers related to economic growth for PRSC 4, as de-fined in PRSC 3, were rehabilitation and maintenance of roads and irrigated areas, adoption by farmers of new technologies, and increased provision of public extension services. All refer-ences to financial and judicial reforms were dropped, notwithstanding their importance for economic growth and their maintenance in the performance assessment matrices for 2006-2008 and 2007-2009. PRSC 5 dropped the triggers pertaining to transport and agriculture (except for provision of agricultural services) because they were output/outcome related, and because they were judged as not in compliance with the Bank’s Operational Policy 8.60, which requires that conditionality consist of policy or institutional actions.
4.25 Macroeconomic management. Bank staff has consistently emphasized the importance of macroeconomic stability for sustainable growth and poverty reduction. Particular emphasis was placed on the need to reduce inflation and keep it low through appropriate monetary policy and minimization of recourse to monetary financing of the budget deficits or financial sector crises. The Bank also stressed increased domestic revenues to reduce aid dependency and pre-pare for reduced aid; improved public financial management to ensure priority sectors obtain enough resources; and maintenance of a competitive real exchange rate. Most of the detailed macroeconomic policy dialogue was left to the IMF, although there has been close collaboration between the institutions. As PARPA I was produced well before work on PRSC series 1 began, the question is whether the policy discussions for PRSC series II helped the government imple-ment/improve a pro-poor growth strategy in PARPA II. Stakeholders interviewed by IEG be-lieved it had contributed positively.
4.26 Relevance of growth-enhancing reforms in light of poverty reduction and capacity constraints. The areas of emphasis of the PRSCs and its triggers and prior actions are relevant to the formu-lation of a pro-poor growth strategy. The emphasis was on improving macroeconomic stability, in particular, the control of inflation (a significant tax on the poor). Other relevant reforms in
27 It was not expected that banking sector reforms would guarantee reduction of interest rates and spreads, but when added to legal and judicial reforms would address the underlying causes and facilitate access to credit. 28 See also the 2007 Poverty Assessment (World Bank 2008b).

29
this regard include: financial sector reform; lowering of interest rates and increased access to finance; improvement of the business environment by reducing the barriers to entry for new en-terprises and reducing business-related transactions costs; and improved potential for agricul-tural sector growth via improved transport infrastructure, based on the recognition that most of the poor live in the rural sector. As there are major capacity constraints, PRSC operations have been accompanied by technical assistance to address such gaps. An example is the Financial Sector Technical Assistance Project, whose objectives to support reforms in the financial sector were PRSC-monitored. Support to other policies is provided through sector operations in agri-culture and transport.
4.27 The advantage of the PRSC approach has been to simultaneously address the key ma-croeconomic and sector issues that are central to enhanced growth. It is not possible, for exam-ple, to solve banking sector problems without simultaneously tackling underlying issues per-taining to public finance and the legal and judicial sector, which may contribute to the financial sector crises. This is also the case for private sector development.
4.28 Outcomes. As noted earlier, the annual GDP growth rate averaged around eight percent over the past 15 years and 7.3 percent during the period 2004-2007. This was in line with an ob-jective of 7-8 percent per year, but still less than rates observed in the preceding few years. The IMF projects a possible slow-down to 4.5 percent for 2009 as a result of the financial crisis . Infla-tion, which had showed a downward trend from 16.8 percent in 2002 to 6.4 percent in 2005, spiked up from 6.5 to 13.6 percent in 2006, but began to lower the following year. However, the domestic rate of inflation remained higher than in competing countries, so there was an apprec-iation of the real effective exchange rate in 2004, though this was quickly offset in 2005 by a no-minal devaluation. The exchange rate has been managed in order to maintain stable terms of trade. On the external front, a striking feature is the continued increase in the share of GDP from exports, which rose from 10 percent in 1991 to over 30 percent in 2006. The consequence has been a decline in the trade balance and the external current account, financed through grants and credits. Also, during the PRSC period under review, foreign exchange reserves rose, both in gross and net terms, the former to a comfortable 4.7 months of imports in 2007 and 4.4 months in 2008.
4.29 On the fiscal front, the overall fiscal deficit improved initially, but the trend reversed, with the deficit increasing from 8.9 percent in 2005 to 13.5 percent in 2007. This was financed en-tirely by external assistance, without recourse of domestic financing in net terms and largely fi-nanced by grants. Primary expenditure was managed in order to protect the share (65 percent) going to priority sectors. But public investment declined slightly as a percentage of GDP, and private investment did so even more, although volume rose in dollar terms. Revenue collection improved, in line with the objective of preparing for an eventual reduction in grant assistance. The overall conclusion is that macroeconomic management has been broadly satisfactory dur-ing the PRSC period to date. More attention could have been paid to avoiding a decline in the rate of public investment to GDP. It is not possible to draw a direct link between this perfor-mance and the PRSCs, though the latter surely made some contribution to growth via the fi-nancing of the budget by lowering government recourse to domestic financing by an equivalent amount. It can also be said that PRSC-supported structural reforms have contributed to creating the conditions needed for economic growth.
4.30 The PRSC’s purpose was to ensure that the financial sector would be more efficient and make credit easier to obtain. The Program Documents and Implementation Completion Report,
30
for PRSCs 1-2 report that reforms were satisfactorily implemented and key objectives were at-tained, including increased capacity of the Bank of Mozambique to regulate and supervise banks and non-bank financial institutions. Donor joint reviews and mid-term review reports point to concerns regarding the pace of financial sector reform during 2005-2006, when reforms had run into opposition from politically powerful stakeholders; but donors expressed satisfac-tion at the increased pace of implementation of Performance Assessment Matrix measures in 2007.
4.31 IMF reports during the PRSC period point to systematic improvements and conclude in a July 2007/January 2008 staff report that the “financial sector is now sound, and that risk based supervision and the adoption of international financial reporting standards (IFRS) should foster bank stability.” This assessment, in turn, reflects a substantial strengthening of the balance sheet of the Bank of Mozambique and the positive evolution of financial sector soundness indicators (FSSI) since 2001. These indicators show significant increases in regulatory capital to risk-weighted assets and in net worth to assets. Ratios of non-performing loans to gross loans were less than 6 percent as of 2004, and dropped to 3.3 percent in 2006. Returns on equity of 27.4 per-cent in 2005 and 55.4 percent in 2006 were comfortable, and spreads between deposit and lend-ing rates declined.
4.32 The Fund prepared an evaluation of Mozambique’s Financial Sector Reform Strategy in the context of the July 2007 Article IV consultation. The evaluation confirmed substantial progress over the last four years concerning withdrawal of the government from the banking sector and improved banking supervision and reporting standards. It pointed to the fact that independent audits of commercial banks using international financial reporting standards were effectively undertaken in 2005, and the audits endorsed the overall soundness of the system. In addition, the Financial Institutions Law has increased the capacity of the Bank of Mozambique in supervision and enforcement. On the institutional front, the Fund evaluation emphasized the importance of the adoption of the new Commercial Code and establishment of commercial sec-tions of tribunals in Maputo, Beira, and Nampula, which should help to accelerate loan recov-ery from delinquent borrowers. Notwithstanding the progress made, the report concluded that much remained to be done, particularly with regard to credit cost and access issues. On balance, the evidence indicates that PRSC objectives in the financial sector are being realized.
4.33 Another key objective was improvement of the investment climate. Program Documents and Implementation Completion Reports state that all prior actions and triggers in this area were met. But no assessment was made of the impact of these measures, nor was there any as-sessment of progress with respect to electricity, telecommunications, and agriculture, although these were benchmarked in PRSC 1.29 PRSC 3 had as a prior action simplification of the proce-dures for starting a business. In fact, according to the 2008 Investment Climate Survey, the measures taken have made it possible to open a business in 30 days, compared to 113 days in the past (World Bank 2006b) PRSC 4 triggers on road maintenance, rehabilitation of irrigation infrastructure, and agricultural inputs originally specified in PRSC 3 could not be met and were revised downwards. Under PRSC5, the triggers pertaining to roads and irrigation were dropped.
29 The Implementation Completion Report states that lowering the top rate of import duties has reduced effective protection. But this hinges on the structure of import duties on inputs and whether there are off-setting subsidies.
31
4.34 Joint Reviews undertaken by the G19 provide an assessment of progress in improving the investment climate/business environment. The 2005 mid-term review indicated that progress to date had been modest at best, with significant progress needed with respect to: the submission of a revised Labor Code to Parliament; elimination of fine sharing among staff with-in ministries levying them; reduction in VAT refund delays; and enactment and implementation of the commercial code. The 2007 Joint Review reported some progress in the improvement of the business sector, in particular with regard to the setting up and registering businesses as a result of commercial registry computerization, elimination of the need for a Public Deed, and electronic publication of registration in the Official Gazette. As a result, the period to start a business is now substantially shorter than the target of 90 days in the Performance Assessment Matrix.
4.35 Still, private sector representatives considered that the PRSC-supported reforms to date have only scratched the tip of the iceberg and that much deeper reforms are needed. Particular mention was made of the inadequacy of labor market reforms, in particular the new labor code, passed in August 2007, which does not incorporate adequate reforms to reduce retrenchment costs and liberalize restrictions on overtime, piece work, shift work, and use of foreign em-ployees. Interest rates and bank commissions are still too high and spreads too large. A credit bureau is badly needed to facilitate increased access to bank credit, and there is a need to modi-fy the land law to permit small-holders to increase their holdings to increase productivity. It is essential to develop non-traditional exports, including those to regional markets where Mo-zambique has a natural comparative advantage, yet trade procedures remain cumbersome, and there continues to be some anti-export bias.
4.36 Looking ahead, no triggers are currently foreseen for PRSC 5 nor can any be easily in-troduced outside of the memorandum of understanding. On the other hand, the IMF, partly at the request of the Bank, was to introduce a number of conditionalities in 2008 and 2009 aimed at the following: reducing the cost of inspections and fines while improving compliance; reducing the licensing burden via decentralization to provincial One Stop Shops; simplifying procedures for closing businesses through a new insolvency law; facilitating trade across borders; improv-ing the system for VAT refunds; simplifying tax filing; and further simplifying and speeding up property registration. At the same time, with Bank assistance, the government developed and approved (in early 2008) a strategy to improve the business environment that could be sup-ported by a new investment project.
4.37 Conclusions. Macroeconomic achievements have been considerable, with the continua-tion of high growth and controlled inflation, correction of real exchange rate appreciation, and management of expenditure to protect the share of expenditures for priority sectors. The PRSCs exhibit few shortcomings in this regard. There has been good progress in the financial sector, particularly with regard to the restoration of confidence and soundness, reduction of interest rate spreads, though less success as regards the reduction of interest rates and access to credit. As regards improvements in the business environment and investment climate, there has been progress and attainment of critical triggers and prior actions, but this important subject has not received as much continued attention as it should have throughout the PRSC series and has seen moderate to significant shortcomings. HIV/AIDs, whose spread can reduce factor produc-tivity and therefore slow economic growth, has been ignored by the PRSCs. At the same time, the PRSCs cannot do everything, so the decision to have these measures monitored by the Fund is appropriate, as is the decision to prepare a new private sector development project. In sum-

32
mary, PRSC objectives with respect to setting the conditions for poverty reducing growth have been attained with moderate shortcomings.
How effectively has the PRSC helped advance the dialogue and achieve results in sectors that deliver services to the poor? 4.38 Objectives and policy content. One of the objectives of the first PRSC series was to enhance service delivery in health, education, and water and sanitation, in alignment with the PARPA and the general budget support performance assessment matrix. In education, it sought to in-crease access and retention at the primary level and raise education quality and reduce gender disparities. In the health sector it sought to reduce maternal and infant mortality, expand access to basic health services, reduce HIV prevalence and mortality, and improve the strategic use of health sector funding. It also sought to increase access to safe water. Yet there were no prior ac-tions in these areas. The second PRSC series does not focus on health, education, or water and sanitation, although the broader GBS Performance Assessment Matrix embraces the same ob-jectives in education, health, and water and sanitation as in the first series. Prior actions and triggers were introduced for justice, transportation (roads) and agriculture (access to infrastruc-ture and extension services).
4.39 Relevance and design. As originally conceived, the first PRSC series was to address cross-sector issues under the first operation, with the only policy measure relevant to pro-poor service delivery consisting of a government commitment to allocate at least 65 percent of budgetary re-sources to PARPA priority sectors, which include health, education and water and sanitation. The health sector was expected to be brought more prominently under the PRSC as of PRSC 2, while education and rural water supply were expected to be brought in from PRSC 3 onwards. After PRSC 1, a decision was made to focus the remainder of the first PRSC series on public fi-nancial management, investment climate and governance. PRSC 2 made some exception to this by supporting one policy measure in the health sector—the completion of a study of off-budget financing and initiation of its recommendations. The second PRSC series does not include any policy measures in the social sectors or in water and sanitation.
4.40 While the PRSC was originally expected to become the Bank’s only vehicle of support to the health sector (in addition to a multi-sector HIV/AIDs project), the Bank decided to renew its support to the health sector through a sector investment project and to no longer use the PRSC to pursue specific-sector goals. The development and pilot testing of a new basic health service delivery model in disadvantaged provinces was judged to require more sector support than could be obtained through the general budget support/PRSC structure. Similarly, the Bank con-tinues to provide support in the education (secondary and higher education) and water sectors through sector specific investment projects.
4.41 Although these sectors no longer directly figure in the PRSCs, their performance is mo-nitored by the Bank and other partners providing support through the GBS Performance As-sessment Matrix, which defines output and/or outcome performance targets for all three sec-tors. Stakeholders in line agencies, representative of the Ministry of Finance and Ministry of Planning and Development, and relevant Bank sector staff indicated that inclusion of health and education in the matrix and GBS discussions is valuable, despite more in-depth sector specific reviews carried out as part of sector-wide approaches that precede the annual Performance As-sessment Matrix reviews. Including sectors in the matrix and annual reviews allows the General Budget Support/PRSC framework to bring key sector issues to the attention of government,

33
particularly in areas where performance targets have not been met. Sector stakeholders ac-knowledge that targets defined under the sector programs and taken up by the GBS matrix have helped bring a results focus into discussions reaching beyond the dialogue with relevant line agencies.30 Bank staff also point to the benefits of cross-sector discussions, though this ad-vantage was not noted by government sector representatives.
4.42 General Budget Support/PRSC discussions alone have not sufficed to ensure adequate progress in these sectors in Mozambique. The need to limit the PRSC to a small number of key policy actions or indicators does not provide sufficient in-depth follow up on sector-specific is-sues. General budget support/PRSC assessments focus largely on achievements vis-à-vis the Performance Assessment Matrix. They set targets, but they are not the locus of in-depth formu-lation and assessment of sector-specific policies, nor do they allow a sufficient focus on technical aspects of policy implementation. The PRSC in Mozambique has not proven to be an adequate vehicle for in-depth sector dialogue on its own, nor has it helped steer it in that direction by helping to make the budget process a tool for effective sector policy formulation, implementa-tion and evaluation. This conclusion holds not only for health, education, and water, but also for the agriculture, transport, and justice sectors. There has been little discussion of budget for-mulation and execution in PRSC documents.
4.43 In the health sector, for example, the first PRSC series originally envisaged that the gov-ernment would carry out analytical work to identify the most cost-effective approach to ex-panding access to health services, leading to formulation of a new health sector strategy and improved sector financing plans and budgets to link inputs to outputs and outcomes. Due to capacity constraints, the analytical work that the Ministry of Health was expected to carry out under PRSC 2 was eventually carried out as Bank-led Analytical and Advisory Activities. The Ministry finalized its revised strategy in 2007, and approval by the Council of Ministers was still pending at the time of the IEG mission. Under PRSC 2, the government committed to complet-ing an inventory of off-budget financing in the health sector as part of efforts to bring facility generated revenues and donor funding to the sector on budget. But a review of 2007 donor commitments for the health sector suggested that more than 20 percent of donor funding still remained off budget.31 The most important sources of external financing were three dedicated pooled donor funds, of which two were on-budget but used fund-specific public financial man-agement procedures rather than regular government procedures. A review of expected donor disbursements for the education sector for 2007 suggested that about 10 percent of donor fund-ing to the sector was still off budget.
4.44 Implementation and results. Overall, the main benefits of the PRSC-supported reforms for the service delivery sectors result from reforms in public financial management and higher sec-tor spending rather than sector-specific measures, which were largely absent in the PRSC pro-gram. The GBS/PRSC program has had an impact on the financing of health, education, and water supply at two levels. First, there are indications that the systemic reforms in public finan-cial management have begun to result in more timely and regular release of budgetary re- 30 Much of the results focus introduced in health and education goes back to sector-specific approaches, the general budget support process has helped extend this to the discussions between line agencies and Finance. 31 Analysis of ODAM0Z data base as of January 2008 (www.ODAMZ.org.mz) suggests that about 10 percent of planned donor disbursements for the education sector in 2007 were off budget and about 38 percent of planned donor disbursements for health and HIV/AIDS in 2007 were off budget. Other sources suggest that about 20 percent of donor disbursements for health were off budget in 2006.

34
sources for the service delivery sectors. Health and education sector stakeholders interviewed indicated that 2007 was characterized by more timely, regular release of sector funding down to at least the provincial level. Similarly, the General Budget Support water sector working group indicated that public financial management reforms have facilitated timely disbursement of funds and helped improve sector budget execution rates (Government of Mozambique and Programme Aid Partners 2007). Line agency and Ministry of Finance staff also indicated that reforms have facilitated discussions and interactions between line agencies and the Ministry of Finance. Finance staff noted that the ability to ensure timely and additional financing to the sec-tors, facilitated by general budget support funding, has helped generate the support of line agencies for implementing public financial management reforms within their agencies, as they saw that reforms actually produce results of benefit to the sector.
4.45 Second, GBS has allowed for an overall increase in budgetary spending, including in re-current cost financing for the sectors. One core PRSC-supported policy measure expected to help improve access to service delivery in the social sectors is a commitment to maintain priori-ty expenditures at 65 percent of non-interest spending. This measure has consistently figured in all PRSCs in Mozambique and the wider General Budget Support programs) and been met within a reasonable discrepancy margin over the years. It ensured that the reallocation of budg-et resources towards PARPA priority sectors initiated under the Highly Indebted Poor Country initiative was maintained, but it has not led to a significant further shift in expenditure compo-sition.
4.46 Nonetheless, the efficiency and effectiveness of general budget support/PRSC policy measures targeting broad based PARPA spending as a means to improve access to quality ser-vice delivery by the poor remains questionable. The measure’s sole focus is the global allocation of budgetary resources to PARPA priority areas, but PARPA priority expenditures cover a wide range of sectors. While the budget working group discusses budget allocation and execution on a regular basis, there is no evidence this has led to a more strategic inter-sector allocation of re-sources, nor is there evidence that the PRSC has resulted in improved budgetary allocations within priority sectors or in improved territorial distribution of resources. Annual sector re-views and joint general budget support annual performance reviews underscore the need to al-locate expenditures more strategically and address regional inequities in health and education spending. The 2007 joint review also pointed to the need to establish a closer link between PARPA II desired results and resource allocations Government of Mozambique and Pro-gramme Aid Partners 2007)
4.47 The lack of well developed sector strategies and operational plans with associated budg-ets have so far largely prevented the linking of budgetary inputs to outputs and outcomes, with the partial exception of the education sector. In the health sector, where PRSC 2 aimed to im-prove the strategic relevance and results focus of the health sector budget, progress in this di-rection has remained limited. A comprehensive sector strategy has only recently been com-pleted, and work on developing a medium term expenditure framework in accordance with the strategy only recently began and is still ongoing.
4.48 Overall, the budgetary process is not used to affect sector policy and ensure alignment of funding with strategic priorities. There is no ex-post monitoring of use of funds in line with strategic priorities across or within sectors and no evidence that the Bank’s support through the PRSC has facilitated a development in this direction. The budget formulation process does not allow the effective linkage of budgetary inputs to sector outputs and outcomes. As long as this
35
is the case, setting overall expenditure targets, outputs, and outcome measures (as the broader general budget support framework currently does for the service delivery sectors) is unlikely to be the most effective means of fostering necessary sector reforms that will ensure improved access to quality services by the poor in a fiscally sustainable manner.
4.49 To the extent that the PRSC, as part of general budget support, has allowed for in-creased public spending, it has contributed to increases in spending in PARPA priority sectors, as seen in Figure 2. On-budget spending on health and education has grown at an average an-nual rate of 13 percent and 8 percent respectively in real terms between 2003 and 2006. General budget support indirectly helped finance close to 20 percent of these expenditures, with the PRSC contributing around 3.5 percent.32 However, the lack of budget comprehensiveness, par-ticularly at the outset of the PRSC period, prevents a firm conclusion on the extent to which state spending in health, education, and water has increased, although expenditures in these sectors nominally rose during the PRSC period, as shown in Figure 2. The sectors remain heavi-ly dependent on funding from sources other than the state budget for everything but salaries. Most of this funding continues to be channeled through projects or sector funds.33
4.50 Budget financed expenditure increases in health and education have helped expand access to these services, although a considerable share of this expansion is due to donor funded direct support to the sectors, either through dedicated pooled sector funds (three in health, one in education) or via stand-alone projects.
4.51 In the education sector 1,459 primary schools were added between 2003 and 200634 and impressive progress was made on expanding enrollment at the primary school level (see Ap-pendix Table 6). In primary education (grades 1–7), the number of children more than tripled from approximately 1.3 million in 1992 to 4.2 million in 2008. Net enrollment rate at primary education doubled from 45 percent in 1998 to over 96 percent in 2008. Net enrollment of girls rose from 40 to 93 percent in the same period. Primary school teachers increased from 30,000 in 1992 to 73,900 in 2008. However, actual completion and drop-out rates have not improved as much. Completion in primary remains below 70 percent and drop out-out over 13 percent, be-ing worse among girls and poor households. The gross enrolment rate in lower secondary edu-cation (ES1) increased from 4.8 percent in 1998 to 28 percent in 2008. Net enrollment rate grew from 1 percent to 9 percent during the same period.
4.52 But infrastructure expansion and the hiring of additional teachers did not keep pace with increases in demand, particularly at the first level of basic education (EP1 = grades 1-5). As a result, the student teacher ratio at EP1 rose to 74 (up from 66 in 2003) and the share of unquali-fied teachers rose to 40 percent for grades 1-5 and to 25 percent for grades 6 and 7. But recent assessments show that the focus on expansion to access has come at the cost of learning out-comes. Almost 75 percent of children who finish fifth grade have difficulty reading and writing
32 Calculations assume that the full general budget support has gone toward budgetary spending. 33 In 2006, for example, external financing outside general budget support accounted for 22 percent of to-tal and 86 percent of investment on-budget spending for general education. Also in 2006, external financ-ing outside general budget support accounted for 49 percent of total and 89 percent of investment on-budget spending in the health sector. Similarly, 69 percent of spending in the water sector was non-general budget support externally financed through projects. (Government of Mozambique 2006) That year general budget support contributed 20 percent to sector budget spending. 34 All education sector statistics from Ministry of Education database as reported on www.ine.gov.mz, Government of Mozambique Balanco do PES 2006 and Ministry of Education Annual School Survey 2007.
36
simple sentences and solving simple arithmetic problems, according to a Ministry of Education assessment (Government of Mozambique and Programme Aid Partners 2007). The gender gap has narrowed, particularly at the primary level, and completion rates have improved, but reten-tion beyond EP1 remains a significant challenge. In summary, while substantial progress has been made on expanding enrollment, it has come at the cost of quality of learning. General budget support/PRSC have helped increase education sector spending, but the exclusive focus on expanding access has seriously neglected quality issues. It should also be noted that much of the expansion in the education sector was financed by sources other than general budget sup-port.
4.53 In the health sector, performance has been mixed. Statistics show a steady increase in service provision with the rehabilitation of facilities after the war, which has continued through the PRSC period. Increased budgetary funding, partly supported through the General Budget Support/PRSC structure, has permitted an increase in public health care personnel and infra-structure. Maternal and child mortality rates dropped but remain high and there are huge vari-ations geographically and by income group. Infant mortality decreased from 145 per 1,000 live births in 1996, to 122 in 2003, and further down to 93 in 2008. Under-5 mortality rates decreased from 212 per 1,000 live births in 1996, to 178 in 2003, and reached 138 in 2008. Maternal mortali-ty was reduced from an estimated 1,000 per 100,000 live births in the early 1990s to 408 per 100,000 live births in 2003, and to 340 in 2007. Service expansion has led to improvements in vaccination coverage, but targets for institutional births and improved access of HIV/AIDs pa-tients to anti-retroviral treatment have repeatedly been missed. The extent to which service ex-pansion has resulted in improved health outcomes and access by low income groups to services is not clear. Service quality remains a real concern, particularly at the primary care level (Gov-ernment of Mozambique and Programme Aid Partners 2007). Substantial regional inequalities persist, driven by a skewed inter-regional distribution of health care personnel and infrastruc-ture.35 The average national inequality access index that tracks inequality in the ratio of service provision has improved, though it is not clear how this indicator can be reliably updated on a yearly basis if household income and expenditure and surveys are only carried out only every five years (see Appendix Table 6). Also, performance with respect to PAF targets was mediocre.
35 For example, in 2006 there was on average one health care provider staff per 1,112 people, but in the least well-served provinces there were nearly 2,600 people per health care provider (Ministry of Health, 2006).

37
Figure 2. Share of Public Expenditures Allocated to PARPA Priority Sectors
Sources: Government of Mozambique, PARPA1 and PARPA2, Ministry of Finance, Budget Execution Reports
Figure 3. Health, Education, and Water and Sanitation Expenditures During the PRSC Period
Source: Government of Mozambique, Budget execution reports. Note: Actual expenditure increases may be overstated due to bringing a growing share of donor financing on-budget by 2006, particularly in
water/sanitation.
0
10
20
30
40
50
60
70
80
% of Total Pub
lic Expen
ditures Education
General Education
Health
HIV/AIDS
Water, Sanitation, Public Works
Total PARPA Priority Sectors
0
1000
2000
3000
4000
5000
6000
7000
2003 2004 2005 2006
Mil Meticais of 200
3
Education
General Education
Health
HIV/AIDS
Water, Sanitation, Public Works
38
4.54 Statistics on access to safe water, monitored under the general budget support perfor-mance assessment matrix show that PAF targets have generally been met or exceeded over the period 2004-2008. The share of the population with access to an improved water source in-creased from 39 percent in 1995 to 48 percent in 2008. However, most financing comes from donor financed projects (almost 70 percent in 2006). Budget execution rates have been low, though they have improved in recent years. Access statistics vary considerably, but all data show a large gap in access between urban and rural areas. The sector suffered from considera-ble fragmentation and lack of coordination among the many donor-financed projects, though a more coordinated approach under a sector-wide arrangement has been put in place recently. Considerable progress was made over the past decade on institutional, regulatory, and tariff re-forms, with the delegation of management to private operators in larger urban cities. However, there is no evidence that General Budget Support and the PRSC paid a decisive role in this area. The Bank has been consistently engaged in sector policy dialogue, and it has supported imple-mentation of policy reforms and investments in urban water supply systems, but this engage-ment has occurred outside the PRSC framework.
4.55 Conclusions. One of the objectives of the first PRSC series was to enhance service delivery in health, education, and water and sanitation, but this was not carried over into the second se-ries. Even though significant progress has been achieved in service delivery over the period, by virtue of its design, the PRSC has played a negligible role in advancing the sector dialogue and contributing to the good results in education, health, and water and sanitation. Although Bank staff has participated in relevant general budget support working groups, these have not been a key vehicle for the Bank to advance the sector dialogue and provide implementation assistance. The only tangible benefit to sectors from the PRSC process has been an increase in budgetary financing and, more recently, more reliable and timely release of budgetary funds as a result of public financial management program reforms.
ASSESSMENT OF OVERALL OUTCOME
4.56 The PRSCs’ overall objective was implementation of PARPA I and PARPA II, with com-ponents that sought to: improve public sector accountability through better public financial management and governance; promote economic growth through an improved investment cli-mate; and improve social service delivery in health, education, and water and sanitation.
4.57 The PRSCs appear to be attaining their objectives with respect to public financial man-agement, particularly on the expenditure side. It is less clear that objectives with respect to im-proving governance will be attained. The PRSC is likely to achieve its objective of improving the prospects for economic growth through improvements in the investment climate and business environment, particularly with regard to the restructuring of the financial sector. The assess-ment points to substantial progress with regard to the creation of enterprises though somewhat less progress on other critical issues. As regards service delivery in the health, education, and water and sanitation sectors, this was not a primary focus of the PRSCs in the final analysis.
4.58 The present assessment concurs with the Implementation Completion Report assess-ments of PRSCs 1-2 in a number of regards. The PRSC process has entailed significant institu-tional development, particularly as regards public financial management and procurement, where developments are highly likely to be sustained. The same is true with respect to financial sector development and the reforms in the business environment. Not much has changed at the sector level, at least not as a result of the PRSC process.

39
4.59 The Mozambican authorities have performed satisfactorily throughout: the maintenance of a satisfactory macroeconomic framework; completion of the second three year Poverty Re-duction and Growth Facility and graduation to a Policy Support Instrument (PSI); conclusion of annual donor reviews on a continuous basis since 2004, although there is substantial variation in performance across the main components of the PAF; implementation of PRSC-specific re-forms; and, above all, a commitment to effective implementation of the PARPAs and related re-forms. For these reasons, the risks to program implementation and the sustainability of desired outcomes appear to be low, provided there continue to be predictable aid flows and budget support and that domestic resource mobilization continues.
4.60 There are two areas where Mozambican performance should focus on improving: in go-vernance, particularly as regards the capacity to implement reforms and implement decentrali-zation; and in public sector reform. Neither figured particularly strongly in the PRSCs, but im-provements in both areas are essential for sustainable improvements in service delivery. In a nutshell, service delivery requires more than just transferring financial resources to service deli-very units. Financial resources must be properly used by competent, well-trained professional staff, and these seem to be in short supply. PRSCs could pay more importance to these areas. Another issue is the need to quantify financial consequences of improvements as they occur. The provision of this kind of information could do much to reassure the Bank and other donors that fiduciary risks have been reduced and would make it easier to transfer more resources through budget support operations and to use national procedures for projects financed through sector-wide approaches or pooled funds.
MONITORING AND EVALUATION: POVERTY OUTCOMES AND POVERTY IMPACT
4.61 Monitoring and evaluation in the context of the PRSP is weak. Available evidence indi-cates that an effective monitoring and evaluation system focused on poverty issues has yet to be created. The only PARPA Annual Progress Report was produced in 2003. Since then, the Bank and Fund have used the annual Balanco do PES, known as BdPES, as the Annual Progress Re-port. The BdPES accompanies the budget with targets for specific activities and is prepared for the Parliament. Despite some weaknesses, it serves as the annual progress report and is quite comprehensive document relative to comparable Bank and Fund documents (Government of Mozambique and Programme Aid Partners 2007).
4.62 All of the PRSCs have insisted on the importance of improving the PARPA monitoring and evaluation framework (World Bank and IMF 2003, 2005, 2006;World Bank 2005a, 2005b, 2006b, and 2007b) PRSC 1 stated that the Bank would help the government improve, prioritize, and undertake more effective monitoring and evaluation. In its view, monitoring and evalua-tion tends to be ad hoc and unsystematic, and focused on sector rather than poverty issues. PRSC 2 emphasized the need to develop a monitoring and evaluation system for PARPA.36 Af-ter the last PRSP (PARPA II), the Bank provided three years of technical assistance for M&E, es-pecially for the strategy matrix and, in 2009, approved an IDF grant to work with the govern-ment on preparing the matrix for the next PARPA in 2010.
4.63 PARPA II incorporates a strategic matrix representing the results framework for PARPA II, developed by a joint government and donor team led by the Ministry of Planning and Devel-opment with the participation of all line ministries. The performance assessment matrix, jointly
36 The fundamental problem is that the BdPES is an annual evaluation of the PES, which is the annual implementation plan of the government’s Five Year Program, not the PARPA.

40
monitored by donors in the Annual Joint Reviews, is now derived from the strategic matrix and constitutes the basis for evaluation of the PARPA. Evaluation of the poverty reduction strategy is thus limited to the performance assessment matrix, which has traditionally had little partici-pation from civil society. To resolve this problem the government set up a Poverty Observatory, which has significantly more participation. While it has made an important contribution to in-creasing understanding of the multidimensional nature of poverty, it has played a limited role in the review of the Performance Assessment Matrix by the joint review process, which is dom-inated by donors – frustratingly so, in the view of civil society representatives – and tends to undermine domestic accountability. Moreover, the contribution of the Poverty Observatory to poverty reduction is limited by the fact that it has no legal standing and can comment only on the PARPA, not on the budget itself. The PRSCs have pointed to the importance of improving the monitoring and evaluation framework for poverty, and promised Bank support for this purpose. But this has not been forthcoming in a significant manner. Neither have there been triggers pertaining to institutional strengthening needed for effective participatory monitoring, a significant shortcoming in PRSC design.
4.64 The government produces a limited number of poverty-related assessments on a regular basis (World Bank 2008b). Household surveys needed to produce measures of income poverty are produced every five years. A systematic, regular effort to collect the data necessary to esti-mate non-monetary poverty has not been made, apart from two Living Standards and Mea-surement Surveys done in 1997 and 2003. In July 2007, the Bank’s Poverty, Gender, and Social Assessment (PGSA) used a tailor-made poverty and vulnerability survey to estimate the status of monetary poverty and its evolution between 1997 and 2003. It also included indicators for non-monetary poverty and poverty perceptions and projections, including a few findings post-2004. There was a sharp decrease in monetary poverty between 1997 and 2003. The first House-hold Consumption Survey (HCS) was undertaken in 1997, which estimated the national poverty rate at 69.4 percent. During the following six years, much progress occurred, with the national poverty rate declining to 54.1 percent in 2003.37 Some key social income indicators also im-proved. While no data is available on monetary poverty since 2003, a 2006 poverty perception survey was undertaken on perceptions about poverty over the preceding five years. In rural areas, 26.8 percent of the population considered that poverty has declined between 2001 and 2006, while 73.2 percent thought it to had stagnated or worsened. The sentiment is more pro-nounced for households headed by females, of whom only 13 percent thought that there has been improvement, compared to 32.2 percent of male-headed households. There are similar findings in the urban sector.
4.65 As for non-monetary poverty, evidence suggests some improvement with respect to access to health and education (World Bank 2008b) Primary school enrollment improved, on a net basis, from 56 percent in 2000-2003 to 77 percent in 2005-2006, while the gross enrollment ra-tio rose from 84 to 103 in the period. The gender gap was reduced in primary and secondary education. Infant mortality declined from 122 to 100 per 100,000 live births. Access to improved sanitation services rose from 27 to 32 percent of the population. Evidence from the Poverty, Gender, and Social Assessment also indicates positive changes in perceptions of education and health services.
37 It seems that poverty rates and severity rose in the south, particularly in Maputo and the surrounding province. In other areas, child mortality and nutrition appear to be getting worse, although consumption is rising.
41
4.66 Given the lack of data on monetary poverty, it is impossible to say whether the PRSC-supported program had an impact on poverty reduction. Data has not been collected on public pro-poor expenditures either. Yet, to the extent that the PRSCs as part of overall general budget support have allowed for increased public spending, they have indirectly contributed to in-creases in spending in PARPA priority sectors. On-budget expenditures rose 8 percent and 13 percent, respectively, in real terms between 2003 and 2006, though the lack of budget compre-hensiveness prevents a generalized conclusion as to the true extent of increase in expenditures in these sectors. On the question of access, there is some evidence of an impact in the education sector, as the number of primary schools has risen, the gender gap has closed, and the comple-tion rate has risen. Evidence from the health sector indicates an increase in access, resulting from a relative increase in outpatient care and increased vaccination coverage. The average na-tional inequality access index, which tracks relative movements in access between the highest and lowest quintiles, show a favorable development.
5. Bank Performance
5.1 Assessment of instrument adequacy. The suitability for moving to a programmatic ap-proach had first been considered in the late 1990s. Evidence reviewed in the course of prepara-tion of this case study indicates that recourse to the PRSC approach was justified and was ade-quately scrutinized and reviewed by various departments within the Bank. The issues addressed were highly relevant and, in general, well-designed and implemented, although there was little success in improving service delivery in key sectors. Significant shortcomings were the following:
Not enough attention was paid to ensuring that more rapid progress was made in im-proving monitoring and evaluation for PARPA implementation.
Greater attention should have been given to ensuring the establishment of a Budget Ex-ecution Reporting system that permitted an assessment of the level of pro-poor budget allocations and expenditure, in particular through the establishment of a functional and/or programmatic budget classification.
There is a need for regular preparation of public expenditure tracking surveys to ensure that resources are moving to service providers, such as schools, which are not budget holders or cost centers.
Not enough attention has been paid to ensuring a better linkage between PARPA out-comes and budget allocations.
More attention could have been given to improving the comprehensiveness of the budg-et by more thorough verification to the integration of ministerial ‘own receipts’ and do-nor expenditures.
In the area of the investment climate and business environment, the scope of the reforms envisaged could have been wider to include more themes dealing directly with the pro-motion of small-scale, labor intensive firms and micro-enterprises.
In the social sectors and in the area of public service delivery, the budget was not used to inform policy formulation, and there is no evidence that sector budgetary questions (regarding both allocations and expenditures) were a PRSC focus.

42
There is a need to speed up and deepen the pace of civil service reform. This is of critical importance to improving service delivery at the national and local levels.
5.2 Adequacy of Bank inputs. Bank staff have made great efforts to ensure harmonization with undertakings of the memorandum of understanding and alignment with government wishes in terms of the national timetable for budget preparation and disbursements. In this regard, it may be noted that the evidence from the independent evaluations demonstrates that the Bank’s per-formance improved considerably after PRSC3. The Bank did well in terms of harmonization with the memorandum of understanding, predictability, as well as with the consolidation and harmonization of conditionalities.
5.3 Resources and incentives. Figures in Table 7 and Table 8 indicate that the Bank provided substantial resources to the PRSC operations, spending close to USD 2 million from FY04 through FY08 (by end February), Of which approximately USD 1.55 million were spent on PRSC 1 and 2, while USD 0.41 million were spent on PRSC 3 and 4. Notably, the most resources were spent by the Poverty Reduction and Economic Management department (43.7 percent) and, at the sector level, Human Development (mainly health), which spent approximately 17 percent—and Sustainable Development (mainly agriculture but also roads and urban), which spent about 12 percent of the total. Given this distribution of funding, it is somewhat surprising that the human development sectors achieved relatively little in terms of concrete, measurable improvements in areas like health and education.
Table 7. Resources spent on PRSCs 1-4, FY04-08 (end February)
PRSC: 1-4 (in USD thousands)
Code FY04 FY05 FY06 FY07 FY08 Total
PRSC 1 P075805 528.4 334.7 146 1009.1
PRSC 2 P056201 340.2 205.4 545.6
PRSC 3 P083459 207.6 207.6
PRSC 4 P103277 68.6 137.0 205.6
Total 528.4 674.9 351.4 276.2 137.0 1967.9
Source: World Bank, Business Warehouse
Table 8. PRSCs 1-4 expenditures (FY04-08)
Operational Unit Receiving Funding Expenses in USD thousands percent Poverty Reduction and Economic Management 845.57 43.01
Public Financial Management and Procurement 103.99 5.29
Human Development 336.06 17.09
Private Sector Finance 142.97 7.27
Sustainable Development 237.19 12.07
Quality Control and Knowledge 54.48 2.77
Country Operations 83.39 4.24
Other 162.21 8.25
Total 1965.86 100
Source: World Bank
43
6. Conclusions and Lessons Learned
6.1 This study had three primary purposes: first, to compare and contrast the adjustment lending and PRSC approaches to the provision of fast disbursing financial assistance; second, to assess the strengths and weaknesses of the PRSC approach from a technical standpoint in light of the experience under PRSCs 1-5; and third, to assess the consequences for the PRSCs of IDA’s participation in the General Budget Support donor group.
6.2 The Adjustment approach. Under the adjustment approach, the Bank acted “solo” al-though from time to time it did have some co-financing. There was thematic consistency, as shown in the analysis, around the themes of trade, taxes, and the financial sector, but little con-cern about the predictability of disbursement. Also, in a number of cases there were substantial disbursement delays of up to about a year. By the end of the adjustment period, the Bank had tried to reduce the number of conditionalities through the HIAL approach and had begun to think in programmatic terms through the EMPSO (processed in 2002). This was expected to be the precursor of the first PRSC.
6.3 The adjustment programs were considered by IEG to have contributed to many achievements. Yet, at the end of the adjustment phase, a number of unresolved issues remained extant including, inter alia, (i) the proliferation of sources of uncoordinated budget assistance ergo the need for (a) donor coordination and (b) greater predictability of financial assistance; (ii) the need to prioritize expenditures in favor of social sectors and the poor; (iii) a less than com-prehensive budget including lack of incorporation of ministerial own receipts, and especially donor financed expenditures; (iv) the pressing need for institutional reform and capacity build-ing; (v) the need for reforms at the central level to be accompanied by similar reforms at the de-centralized level; and (vi) an unfinished agenda with respect to financial sector reform and pri-vate sector development. In addition, beyond these technical issues, IEG considered that the adjustment programs had been designed without a full appreciation of the political economy of the proposed reforms, which had led, in some cases, to standoffs between the Bank and Gov-ernment (for example, cashew, sugar and some aspects of the privatization program). This had undermined ownership and also negatively affected the Bank’s reputation.
6.4 Strengths and weaknesses of the PRSC approach. The PRSC approach has responded ef-fectively to the weaknesses of the adjustment approach as outlined above. The Bank has been able to deliver financial support to the Mozambican budget in an increasingly predictable man-ner, with transfers occurring in the first quarter of the government fiscal year. This is a major strength, given the importance of resource predictability for budget execution. There have, however, been technical shortcomings:
There is still a lack of alignment with the national budget preparation cycle, which could, in theory, create some uncertainty for the Mozambican authorities as to resource availabilities for the budget. This problem could be solved by beginning the preparation of the PRSCs earlier in the year so that the decision meeting occurs soon after the April

44
Joint Review and the Board decision before end July. Nonetheless, in practice, the exist-ing system did not undermine the budget preparation process.
More attention should have been paid earlier to improving the quality of the PARPA monitoring and evaluation system through better triggers, budget execution reports, and public expenditure tracking surveys.
More attention should be given to the establishment of a system that publishes desired PARPA outcomes and budget allocations; attention should also be given to monitoring poverty-related budget expenditures by means of reports issued on a quarterly basis. This will require introduction of a program or functional classification system.38
A related point is that delegating public expenditure work to the Budget Analysis Group has not been a good substitute for the Bank-led Public Expenditure Reviews, which had been promised as part of the PRSC process. The lack of progress in Expenditure Track-ing Surveys is also regrettable.
Not enough attention was given to ensuring budget comprehensiveness via the inclu-sion of all ministerial ‘own receipts’ and donor-financed expenditures.
At the present time, too much time is focused on enterprise creation alone, as opposed to promoting small-scale labor enterprises, especially in the agricultural sector.
Not enough attention was given to using the budget as a tool to deepen sector dialogue, both in appropriations and execution.
6.5 A number of areas introduced into the PRSC dialogue are important to improving ser-vice delivery and reducing poverty, including governance, anti-corruption, public sector reform, civil service reform, and decentralization. These areas are well suited to PRSCs, as they are inherently cross-cutting.
6.6 The consequences of integrating the PRSCs in the GBS approach. The harmonized approach has aligned donors behind a common framework and supported reforms in key areas but has also had some significant shortcomings. It has meant that the PRSC has lost the ability to flexi-bly embrace and support core policy issues that emerge as policy dialogue develops. As a re-sult, the Bank’s policy dialogue and support continues outside the PRSC through sector-specific operations; furthermore, the Bank must sometimes rely on the IMF to integrate emerging core policy concerns into its program.39 Flexibility under the PRSC is thus reduced to marginal ad-justment of specific Performance Assessment Matrix targets over time.
6.7 The PRSC in Mozambique is an instrument to support the budget and the overall gov-ernment program, as long as it is broadly on track. But it is not a strategic instrument to support policy issues as dialogue develops or as emerging results point to the need for policy initiatives in new directions. The PRSC has, thus, served well as an instrument to coordinate the Bank’s budget support with that of other general budget support financiers. The general budget sup-port program is well aligned with the PARPA. The PRSC is fully integrated into the general budget support system, draws entirely from the general budget support performance assess-ment matrix, and relies largely on semi-annual joint reviews and the documentation produced for these reviews. However, the current general budget support set-up prevents flexibility and
38 The present system of requiring that 65 percent of non-interest expenditures be allocated to priority sectors is not adequate, as not all priority sector expenditures are poverty-related. 39 A case in point are reforms linked to natural resource extraction. While the Bank provided valued technical advice on reforming the concessions system, it had to rely on the Fund program to include im-plementation of key policy actions in this area, as the general budget support matrix did not foresee measures in this area.

45
does not allow policy dialogue to focus on core policy reforms and their implementation if they have not already been defined at the outset of the series in the matrix. In fact, the PRSCs can be thought of as supporting the Performance Assessment Framework matrix, which is what the bi-lateral donors tend to do, rather than specific policy and institutional reforms which should be at the heart of development policy lending and which are required in Bank operations by OP 8.60.
6.8 This point has been frequently and forcefully made by staff interviewed during the PRSC review. Moreover, in their view, the PAF is weak, focused primarily on outcome indica-tors, with little policy content. Furthermore, the current donor coordination system is very burdensome, with 72 sector working groups, the government participating in only 29 of them. As a result the policy dialogue tends to be excessively fragmented, focusing on too many issues discussed in too many fora. This makes prioritization of reforms and the corresponding policy dialogue very burdensome in administrative terms while reducing the time available for ad-dressing the core policy problems which are technically complicated, difficult and frequently politically sensitive. Indeed, in the view of some, the current approach substantially weakens the PRSC instrument to support policy based reform based on specific actions and institutional changes, and the technical leadership role of the Bank in support thereof.
6.9 Others contend that the PRSC approach and adhesion to the general budget support memorandum of understanding could strengthen the Bank’s position, though it could leverage this in a different way. Nonetheless, this view is not universally shared. Thus, the memoran-dum includes a mechanism for escalating the dialogue to the highest government levels, if needed, when problems cannot be resolved at the technical level. This has two advantages: first, it makes the Bank justify its position within the donor community, which probably entails a broader discussion of the economics and politics of the issue at hand; second, if a sufficient number of donors find the issue important, they will raise it collectively, which is likely to carry more weight than a solo escalation on the part of the Bank. In short, such a strategy can help en-sure that sensitive questions of political economy receive the attention they deserve, in contrast to the adjustment approach. Yet, there is little evidence of this and Bank staff note that the quali-ty of the G19 dialogue with the authorities has been weak and has not tackled policy issues. Going forward, it will be important, in Mozambique and elsewhere, to avoid constraining the PRSCs (as well as progress toward development outcomes in general) with an overly rigid PAF.
6.10 This study concludes that providing budget support to Mozambique’s PARPA via the PRSC through the general budget support memorandum of understanding has been moderate-ly satisfactory from a technical standpoint. Remaining shortcomings, which were identified ear-lier, were largely on account of the Memorandum of Understanding and despite the good per-formance of all stakeholders.
6.11 PRSCs alone cannot do everything, nor should they try. There will continue to be a place for traditional investment projects, although it is hoped that they will make greater use of na-tional systems. PRSCs in the Mozambican case have, thus far, been cross-sectoral; but there is no reason why they cannot be sectoral in nature, provided they do not entail unjustified earmark-ing of funds. In Mozambique, the PRSC approach has proven to be at least as good a way of providing fast-disbursing assistance as the adjustment approach. What shortcomings there may be can be reasonably addressed if the lessons of the past are properly taken into account.

46
References Development Gateway. 2008. Official Development Assistance to Mozambique Database.
Accessible at http://mozambique.odadata.ampdev.net/ Government of Mozambique. 2006. Budget Execution Reports. Ministry of Finance, Republic of
Mozambique. Maputo. Government of Mozambique. 2007a. Annual School Survey 2007. Ministry of Education,
Republic of Mozambique. Accessible at www.ine.gov.mz Government of Mozambique. 2007b. Budget Execution Reports. Ministry of Finance, Republic of
Mozambique. Maputo. Government of Mozambique. 2007c. Ministry of Health Statistics. Maputo. Government of Mozambique. 2007d. Ministry of Information (MINSA). Maputo. Government of Mozambique and Programme Aid Partners (PAPs). 2007. Joint Review 2007
Aide-Memoire. Maputo. IEG (Independent Evaluation Group). 2006. “Simplified Poverty Reduction Support Credit to
Mozambique Implementation Completion Report Review”. World Bank. Washington, D.C.
IEG (Independent Evaluation Group). 2007. “Second Poverty Reduction Support Credit to Mozambique Implementation Completion Report Review”. World Bank. Washington, D.C.
IEG (Independent Evaluation Group). 2009. “Project Performance Assessment Report Mozambique: Economic Management and Private Sector Operation (Credit 3709), First Poverty Reduction Support Credit (Credit 3950), Second Poverty Reduction Support Credit (Credit 4111)”. Report No. 48920 World Bank. Washington, D.C.
International Monetary Fund (IMF). 2005. “Republic of Mozambique: 2005 Article IV Consultation, Second Review Under the Three-Year Arrangement Under the Poverty Reduction and Growth Facility, Request for Waiver of Performance Criteria, and Modification of Performance Criteria—Staff Report; Staff Statement; Public Information Notice and Press Release on the Executive Board Discussion; and Statement by the Executive Director for the Republic of Mozambique”. Staff Report. Washington, D.C.
Lawson, Andrew, Paolo de Renzio, and Mariam Umarji. 2006. “Assessment of Public Finance Management in Mozambique 2004/05 Based on PEFA Methodology Final Report: Current status of PFM systems & processes, overview of reforms and perspectives for 2006.” Report to the Government of Mozambique and to the Programme Partners. Accessible at http://ec.europa.eu/europeaid/what/economic-support/public-finance/documents/mozamb_final_report_en.pdf
OECD. 2008. Aid Aggregates Statistics Database. http://stats.oecd.org/qwids/

47
OED (Operations Evaluation Department). 2002. “Project Performance Assessment Report Mozambique Industrial Enterprise Restructuring (Credit 2081-MOZ), Small and Medium Enterprise Development (Credit 2082-MOZ), Economic Recovery Program (Credit 2384-MOZ), Second Economic Recovery Program (Credit 2628-MOZ), Third Economic Recovery Program (C-N- 0100-MOZ), Economic Management Reform Operation (Grant H-002), Economic and Financial Management Technical Assistance (Credit 2066-MOZ), Financial Sector Capacity Building, (Credit 2607-MOZ)”. Report No. 23630. World Bank. Washington, D.C.
World Bank. 2000. Memorandum of the President of the International Development Association and the International Finance Corporation to the Executive Directors on a Country Assistance Strategy of the World Bank Group for the Republic of Mozambique”. Report No. 20327 MOZ. Washington, D.C.
World Bank. 2001. The Republic of Mozambique Assessment of the Poverty Reduction Strategy Paper”. Report No. 22664-MOZ. Washington, D.C.
World Bank. 2003. Memorandum of the President of the International Development Association and the International Finance Corporation and the Multilateral Investment Guarantee Agency to the Executive Directors on a Country Assistance Strategy for the Republic of Mozambique”. Report No. 26747 MOZ. Washington, D.C.
World Bank. 2003b. “Mozambique Public Expenditure Review Phase 2 Sectoral Expenditures”. Report No. 25969-MZ. Washington, D.C.
World Bank. 2005a. “International Development Association Program Document for a Proposed Credit in the Amount of SDR 83.3 Million (US $120 Million Equivalent) to the Republic of Mozambique for a Second Poverty Reduction Support Credit”. Report No. 32890-MZ. Washington, D.C.
World Bank. 2005b. “Simplified Implementation Completion Report Mozambique First Poverty Reduction Support Operation IDA39500”. Report No. 34007. Washington, D.C.
World Bank. 2006a. International Development Association, International Finance Corporation, Multilateral Investment Guarantee Agency Country Assistance Strategy Progress Report for the Republic of Mozambique for the Period FY04-FY06”. Report No. 35319 MZ. Washington, D.C.
World Bank. 2006b. “International Development Association Program Document for a Proposed Third Poverty Reduction Support Credit in the Amount of SDR 46.6 Million (US $70 Million Equivalent) to the Republic of Mozambique”. Report No. 37970-MZ. Washington, D.C.
World Bank. 2007a. International Development Association, International Finance Corporation and the Multilateral Investment Guarantee Agency Country Assistance Strategy for the Republic of Mozambique”. Report No. 39395 MZ. Washington, D.C.
World Bank. 2007b. “International Development Association Program Document for a Proposed Credit in the Amount of SDR 37.8 Million (US $60 Million Equivalent) to the Republic of Mozambique for a Fourth Poverty Reduction Support Credit”. Report No. 41465-MZ. Washington, D.C.
World Bank. 2007c. Public Expenditure and Financial Accountability Assessment Mozambique,” draft report. Washington, D.C.
World Bank. 2007d. World Development Indicators & Global Development Finance. LDB Working Database. Accessible at http://databank.worldbank.org/ddp/home.do?Step=12&id=4&CNO=2

48
World Bank. 2008a. “International Development Association Program Document for a Proposed Credit in the Amount of SDR 57.3 Million (US $90 Million Equivalent) and a Proposed Grant from the Food Price Crisis Response Trust Fund in the Amount of US$10 Million Equivalent to the Republic of Mozambique for a Fifth Poverty Reduction Support Credit”. Report No. 44846-MZ. Washington, D.C.
World Bank. 2008b. “Mozambique Beating the Odds: Sustaining Inclusion in a Growing Economy. A Mozambique Poverty, Gender, and Social Assessment, Vol I and II: Main Report”. Report No. 40048-MZ. Washington, D.C.
World Bank and International Monetary Fund. 2000. “Decision Point Document for the Enhanced Heavily Indebted Poor Countries (HIPC) Initiative.” Washington, D.C.
World Bank and International Monetary Fund. 2001. “Completion Point Document for the Enhanced Heavily Indebted Poor Countries (HIPC) Initiative.” Washington, D.C.
World Bank and International Monetary Fund. 2003. The Republic of Mozambique Joint IDA-IMF Assessment of the Poverty Reduction Strategy Paper”. Report No. 26052. Washington, D.C.
World Bank and International Monetary Fund. 2005. The Republic of Mozambique Joint Staff Advisory Note of the Poverty Reduction Strategy Paper”. Report No. MZ-32620. Washington, D.C.
World Bank and International Monetary Fund. 2006. Republic of Mozambique Joint IDA-IMF Staff Advisory Note of the Poverty Reduction Strategy Paper”. Report No. 37975-MOZ. Washington, D.C.

49
Appendix Appendix Table 1. Prior Actions and Tranche Release Triggers (PRSCs 1-5)
PRSC 1
Prior action Status
Spending 64.9% of its 2003 budget (excluding interest and election spending) on prior sectors referred to in the PARPA, in accordance with paragraph 9 of the LDP
Implemented without change
Adoption of regulations for implementing SISTAFE, establish the Technical Unit for Public Financial Management Reform (UTRAFE); and substantially strengthen its data processing center, and make SISTAFE’s first phase operational with the adoption of an electronic system of control over government bank accounts, all in accordance with Paragraph 8of the LDP
Implemented without change
As of 2003, increase domestic revenue mobilization through implementing fuel tariff adjustments which includes an automatic fuel tariff adjustment mechanism for January 2004, and a withholding tax on the income of public sector employees all in accordance with paragraph 10 of the LDP.
Implemented without change
Adoption of the following public sector reform measures (i) reduce the land registration to a maximum of 90 days; (ii) adopt a new regulatory framework to simplify and expedite the process of industrial registration; and, (iii) start to issue visitor visas at the Borrower’s borders, all in accordance with paragraph 11 of the LDP.
Implemented without change
Adoption of a law decentralizing certain services to the district level (the Local State Organs Law) which provides for increased autonomy of district authorities and the legal basis for treating a district authority as a budget entity thereby strengthening the territorial dimension of public sector management, in accordance with paragraph 12 of the LDP
Implemented without change
Adoption of a law on anti-corruption, in accordance with paragraph 13 of the LDP Implemented without change
Reduction of top import duties on consumption goods from 30 to 25 percent, in accordance with paragraph 20 of the LDP
Implemented without change
PRSC 2
Prior actions for first tranche Status
MoF will implement e-SISTAFE in the Ministry and its provincial Directorates Implemented without change
The Council of Ministers will approve a new procurement decree that brings public procurement into line with international practice
Implemented without change
The government will present a new Financial Institutions Law to the National Assembly Implemented without change
Making the hiring of foreign labor more flexible through the adoption of decree 57/03 Implemented w/o change
The government will present a new Commercial Code to the National Assembly Implemented without change
The government will formulate its 2005 budget with agreed allocations to PARPA priority areas and execute its 2004 budget consistent with agreed allocations, in particular it will spend 65 percent of its 2004 budget in priority areas
Completed
Triggers for Second Tranche Status
Adoption of a new procurement code and start of its implementation as evidenced by: (a) the approval of a revised implementation action plan; (b) the carrying out of procurement audits in at least two of its ministries in accordance with the activity plan of the internal audit system; (c) the preparation of a training program for civil servants and suppliers; (d) the preparation of terms of reference for elaboration of standard bidding documents
Implemented without change
Revision of the 1888 Commercial Code through the adoption of a new Code Implemented without change
Rolled out e-SISTAFE to the Ministry of Education and Culture Implemented without change
Conclude the study on “off-budget” in the health sector and initiated the implementation of the study’s Implemented without
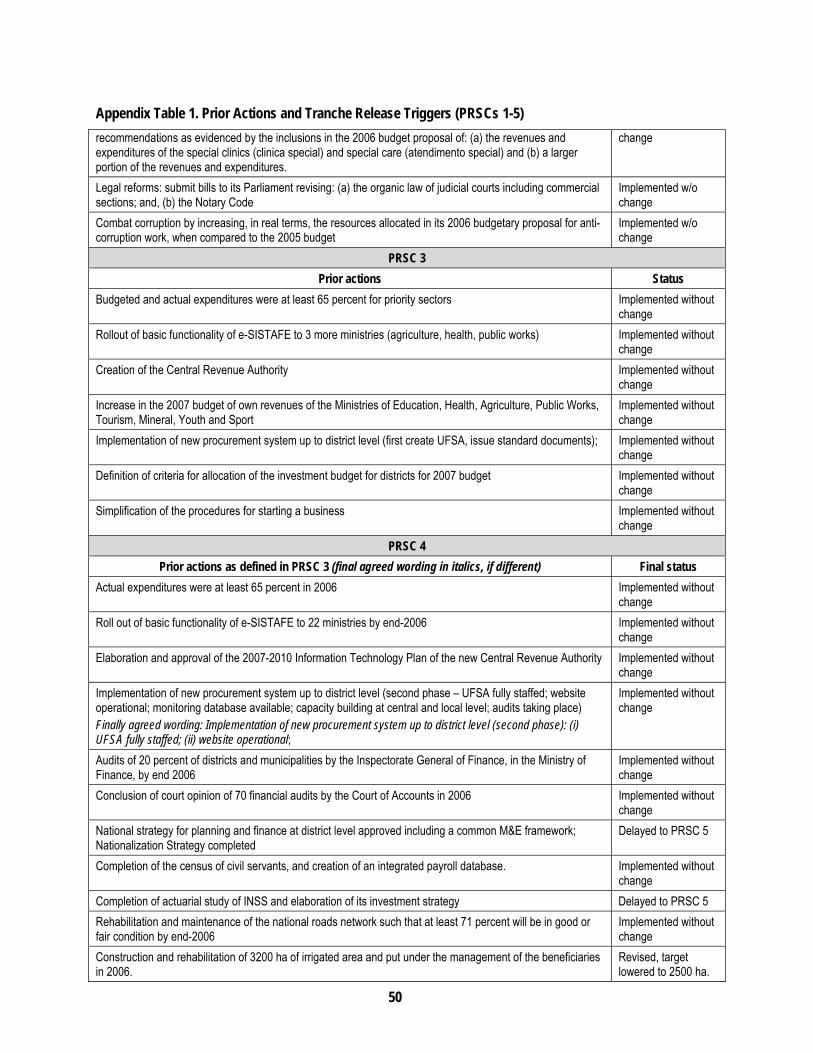
50
Appendix Table 1. Prior Actions and Tranche Release Triggers (PRSCs 1-5)
recommendations as evidenced by the inclusions in the 2006 budget proposal of: (a) the revenues and expenditures of the special clinics (clinica special) and special care (atendimento special) and (b) a larger portion of the revenues and expenditures.
change
Legal reforms: submit bills to its Parliament revising: (a) the organic law of judicial courts including commercial sections; and, (b) the Notary Code
Implemented w/o change
Combat corruption by increasing, in real terms, the resources allocated in its 2006 budgetary proposal for anti-corruption work, when compared to the 2005 budget
Implemented w/o change
PRSC 3
Prior actions Status
Budgeted and actual expenditures were at least 65 percent for priority sectors Implemented without change
Rollout of basic functionality of e-SISTAFE to 3 more ministries (agriculture, health, public works) Implemented without change
Creation of the Central Revenue Authority Implemented without change
Increase in the 2007 budget of own revenues of the Ministries of Education, Health, Agriculture, Public Works, Tourism, Mineral, Youth and Sport
Implemented without change
Implementation of new procurement system up to district level (first create UFSA, issue standard documents); Implemented without change
Definition of criteria for allocation of the investment budget for districts for 2007 budget Implemented without change
Simplification of the procedures for starting a business Implemented without change
PRSC 4
Prior actions as defined in PRSC 3 (final agreed wording in italics, if different) Final status
Actual expenditures were at least 65 percent in 2006 Implemented without change
Roll out of basic functionality of e-SISTAFE to 22 ministries by end-2006 Implemented without change
Elaboration and approval of the 2007-2010 Information Technology Plan of the new Central Revenue Authority Implemented without change
Implementation of new procurement system up to district level (second phase – UFSA fully staffed; website operational; monitoring database available; capacity building at central and local level; audits taking place) Finally agreed wording: Implementation of new procurement system up to district level (second phase): (i) UFSA fully staffed; (ii) website operational;
Implemented without change
Audits of 20 percent of districts and municipalities by the Inspectorate General of Finance, in the Ministry of Finance, by end 2006
Implemented without change
Conclusion of court opinion of 70 financial audits by the Court of Accounts in 2006 Implemented without change
National strategy for planning and finance at district level approved including a common M&E framework; Nationalization Strategy completed
Delayed to PRSC 5
Completion of the census of civil servants, and creation of an integrated payroll database. Implemented without change
Completion of actuarial study of INSS and elaboration of its investment strategy Delayed to PRSC 5
Rehabilitation and maintenance of the national roads network such that at least 71 percent will be in good or fair condition by end-2006
Implemented without change
Construction and rehabilitation of 3200 ha of irrigated area and put under the management of the beneficiaries in 2006.
Revised, target lowered to 2500 ha.
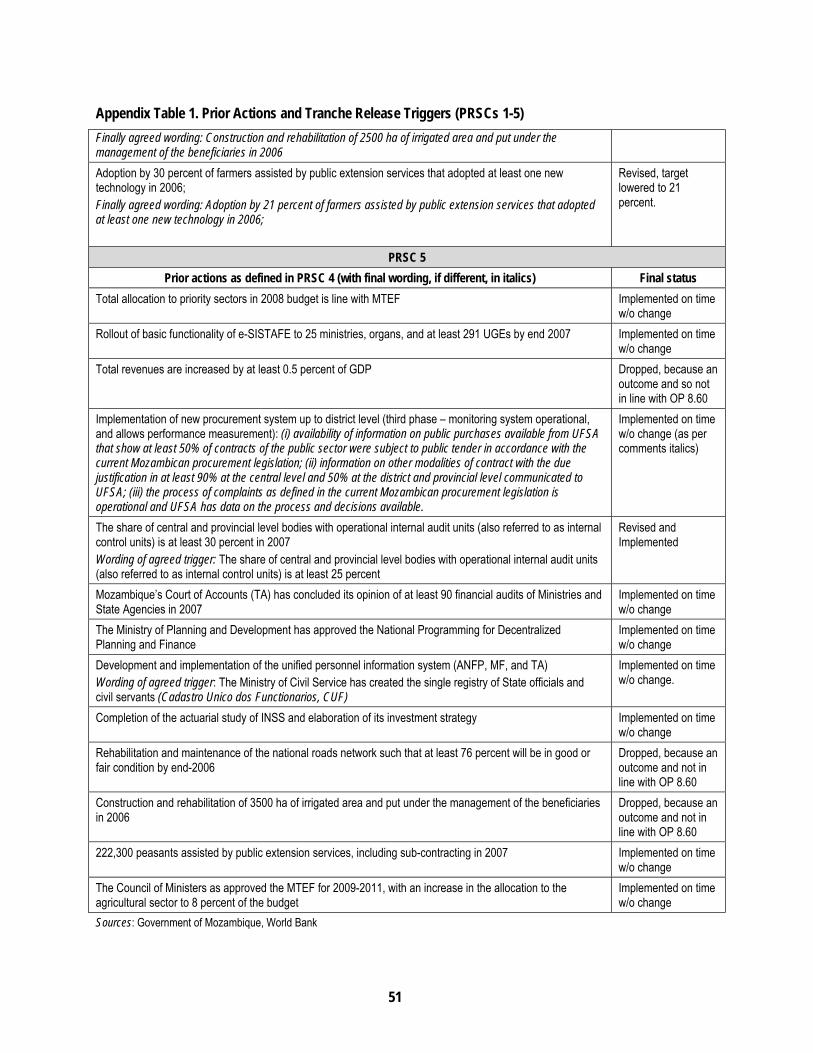
51
Appendix Table 1. Prior Actions and Tranche Release Triggers (PRSCs 1-5)
Finally agreed wording: Construction and rehabilitation of 2500 ha of irrigated area and put under the management of the beneficiaries in 2006
Adoption by 30 percent of farmers assisted by public extension services that adopted at least one new technology in 2006; Finally agreed wording: Adoption by 21 percent of farmers assisted by public extension services that adopted at least one new technology in 2006;
Revised, target lowered to 21 percent.
PRSC 5
Prior actions as defined in PRSC 4 (with final wording, if different, in italics) Final status
Total allocation to priority sectors in 2008 budget is line with MTEF Implemented on time w/o change
Rollout of basic functionality of e-SISTAFE to 25 ministries, organs, and at least 291 UGEs by end 2007 Implemented on time w/o change
Total revenues are increased by at least 0.5 percent of GDP Dropped, because an outcome and so not in line with OP 8.60
Implementation of new procurement system up to district level (third phase – monitoring system operational, and allows performance measurement): (i) availability of information on public purchases available from UFSA that show at least 50% of contracts of the public sector were subject to public tender in accordance with the current Mozambican procurement legislation; (ii) information on other modalities of contract with the due justification in at least 90% at the central level and 50% at the district and provincial level communicated to UFSA; (iii) the process of complaints as defined in the current Mozambican procurement legislation is operational and UFSA has data on the process and decisions available.
Implemented on time w/o change (as per comments italics)
The share of central and provincial level bodies with operational internal audit units (also referred to as internal control units) is at least 30 percent in 2007 Wording of agreed trigger: The share of central and provincial level bodies with operational internal audit units (also referred to as internal control units) is at least 25 percent
Revised and Implemented
Mozambique’s Court of Accounts (TA) has concluded its opinion of at least 90 financial audits of Ministries and State Agencies in 2007
Implemented on time w/o change
The Ministry of Planning and Development has approved the National Programming for Decentralized Planning and Finance
Implemented on time w/o change
Development and implementation of the unified personnel information system (ANFP, MF, and TA) Wording of agreed trigger: The Ministry of Civil Service has created the single registry of State officials and civil servants (Cadastro Unico dos Functionarios, CUF)
Implemented on time w/o change.
Completion of the actuarial study of INSS and elaboration of its investment strategy Implemented on time w/o change
Rehabilitation and maintenance of the national roads network such that at least 76 percent will be in good or fair condition by end-2006
Dropped, because an outcome and not in line with OP 8.60
Construction and rehabilitation of 3500 ha of irrigated area and put under the management of the beneficiaries in 2006
Dropped, because an outcome and not in line with OP 8.60
222,300 peasants assisted by public extension services, including sub-contracting in 2007 Implemented on time w/o change
The Council of Ministers as approved the MTEF for 2009-2011, with an increase in the allocation to the agricultural sector to 8 percent of the budget
Implemented on time w/o change
Sources: Government of Mozambique, World Bank
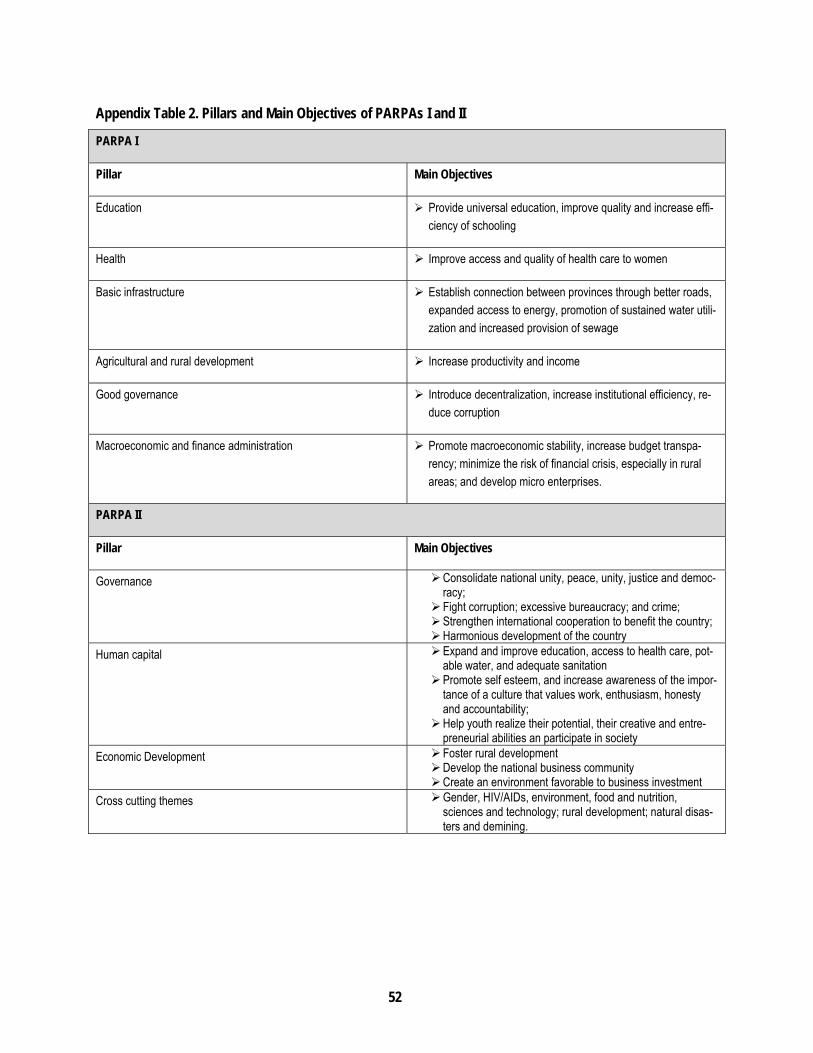
52
Appendix Table 2. Pillars and Main Objectives of PARPAs I and II
PARPA I
Pillar Main Objectives
Education Provide universal education, improve quality and increase effi-ciency of schooling
Health Improve access and quality of health care to women
Basic infrastructure Establish connection between provinces through better roads, expanded access to energy, promotion of sustained water utili-zation and increased provision of sewage
Agricultural and rural development Increase productivity and income
Good governance Introduce decentralization, increase institutional efficiency, re-duce corruption
Macroeconomic and finance administration Promote macroeconomic stability, increase budget transpa-rency; minimize the risk of financial crisis, especially in rural areas; and develop micro enterprises.
PARPA II
Pillar Main Objectives
Governance Consolidate national unity, peace, unity, justice and democ-racy;
Fight corruption; excessive bureaucracy; and crime; Strengthen international cooperation to benefit the country; Harmonious development of the country
Human capital Expand and improve education, access to health care, pot-able water, and adequate sanitation
Promote self esteem, and increase awareness of the impor-tance of a culture that values work, enthusiasm, honesty and accountability;
Help youth realize their potential, their creative and entre-preneurial abilities an participate in society
Economic Development Foster rural development Develop the national business community Create an environment favorable to business investment
Cross cutting themes Gender, HIV/AIDs, environment, food and nutrition, sciences and technology; rural development; natural disas-ters and demining.

53
Appendix Table 3.PARPA Objectives/Outcomes, PRSC Prior Actions, Tranche Release Conditions (PRSCs 1-2)
PARPA objectives and desired outcomes (as set forth in the Performance Assessment Matrix)
Related PRSC prior actions, tranche release conditions or milestones
Commment
Strengthen accountability in banking; and improve financial intermediation of micro, small and medium size enterprises and unbanked households (PRSC 1, Annex 2)
Strengthen institutional capacity of BM and other regulatory authorities by submitting Financial Institutions Law to NA and preparing regulations Implement IAS in banking and insurance sector
Prior action for PRSC 2
Conduct audits of commercial banks, including forensic audit of one bank Reform insurance
Milestone/Benchmark under PRSC 1
Upgrade efficiency and effectiveness of management of state funds
Multiple specific measures pertaining to the implementation of SISTAFE
Prior actions for PRSCs 1 and 2
Roll out to Ministry of Education and Culture
2nd Tranche condition of PRSC 2 and trigger #31 of 2005-2007 Performance Assessment Matrix
Increase coverage of budget: conclude off budget expenditures in health sector
2nd Tranche condition of PRSC 2 and trigger #31 of 2005-2007 Performance Assessment Matrix
Create transparent and efficient procurement system (PRSC 1, Annex 2)
Approve new procurement code based on internationally recognized principles regarding contracts for public works, commodities, services and concessions
Originally intended to be a prior actions for PRSC 2, but was delayed until December 2005..
Adopt and operationalize the new procurement system
2nd Tranche condition of PRSC 2 and trigger #34 of 2005-2007 Performance Assessment Matrix
Improve the regulatory framework for investors
Publish decree 57/04 in 2004 and submit revised Labor Law to the National Assembly in 2005
PRSC 2 prior actions
Presentation of new commercial code to NA
Initially a PRSC 2 prior action, was shifted to second tranche.
Submit to National Assembly: (i) organic law on judicial courts including commercial sections; (ii) revised notary codes
Measures were triggers #49 (b) and (c) of 2005-2007 Performance Assessment Matrix.
Service delivery No prior actions, only benchmarks
Sources: Government of Mozambique, World Bank
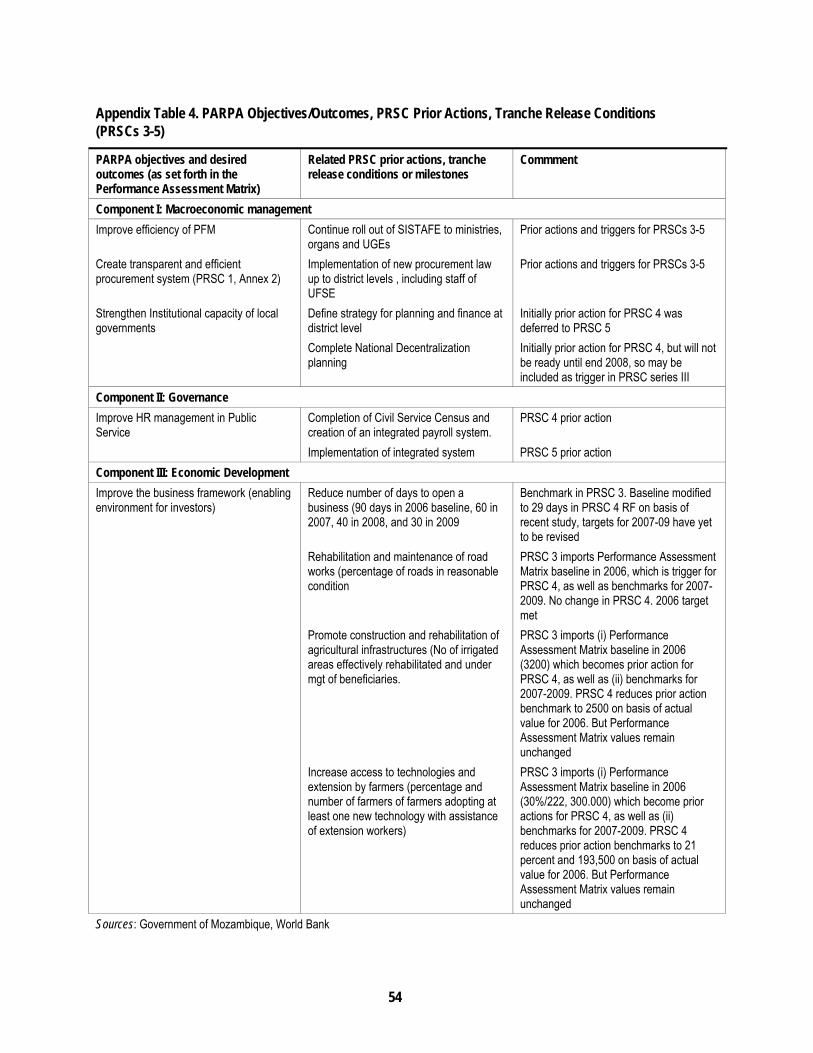
54
Appendix Table 4. PARPA Objectives/Outcomes, PRSC Prior Actions, Tranche Release Conditions (PRSCs 3-5)
PARPA objectives and desired outcomes (as set forth in the Performance Assessment Matrix)
Related PRSC prior actions, tranche release conditions or milestones
Commment
Component I: Macroeconomic management
Improve efficiency of PFM Continue roll out of SISTAFE to ministries, organs and UGEs
Prior actions and triggers for PRSCs 3-5
Create transparent and efficient procurement system (PRSC 1, Annex 2)
Implementation of new procurement law up to district levels , including staff of UFSE
Prior actions and triggers for PRSCs 3-5
Strengthen Institutional capacity of local governments
Define strategy for planning and finance at district level
Initially prior action for PRSC 4 was deferred to PRSC 5
Complete National Decentralization planning
Initially prior action for PRSC 4, but will not be ready until end 2008, so may be included as trigger in PRSC series III
Component II: Governance
Improve HR management in Public Service
Completion of Civil Service Census and creation of an integrated payroll system.
PRSC 4 prior action
Implementation of integrated system PRSC 5 prior action
Component III: Economic Development
Improve the business framework (enabling environment for investors)
Reduce number of days to open a business (90 days in 2006 baseline, 60 in 2007, 40 in 2008, and 30 in 2009
Benchmark in PRSC 3. Baseline modified to 29 days in PRSC 4 RF on basis of recent study, targets for 2007-09 have yet to be revised
Rehabilitation and maintenance of road works (percentage of roads in reasonable condition
PRSC 3 imports Performance Assessment Matrix baseline in 2006, which is trigger for PRSC 4, as well as benchmarks for 2007-2009. No change in PRSC 4. 2006 target met
Promote construction and rehabilitation of agricultural infrastructures (No of irrigated areas effectively rehabilitated and under mgt of beneficiaries.
PRSC 3 imports (i) Performance Assessment Matrix baseline in 2006 (3200) which becomes prior action for PRSC 4, as well as (ii) benchmarks for 2007-2009. PRSC 4 reduces prior action benchmark to 2500 on basis of actual value for 2006. But Performance Assessment Matrix values remain unchanged
Increase access to technologies and extension by farmers (percentage and number of farmers of farmers adopting at least one new technology with assistance of extension workers)
PRSC 3 imports (i) Performance Assessment Matrix baseline in 2006 (30%/222, 300.000) which become prior actions for PRSC 4, as well as (ii) benchmarks for 2007-2009. PRSC 4 reduces prior action benchmarks to 21 percent and 193,500 on basis of actual value for 2006. But Performance Assessment Matrix values remain unchanged
Sources: Government of Mozambique, World Bank

55
Appendix Table 5. Summary of Board and Tranche Release Conditions for PRSC Tranches 1-5, by Sector
Domain PRSC1 PRSC2 PRSC T2 PRSC3 PRSC4 PRSC5
PRIOR
ACTIONS
PRIOR
ACTIONS
BOARD
PRIOR
ACTIONS T2
PRIOR
ACTIONS
BOARD
PRIOR
ACTIONS
BOARD
PRIOR
ACTIONS
BOARD
TOTAL
PRIOR
ACTIONS
Macro 1 1 1 1 1 1 6
Money/Finance & Insurance 1 2 3
Trade & Taxes 1 1
PFM 3 3 3 5 6 6 26
Public Admin. 2 2 4
Governance/corruption 1 1 2 4
Public Enterprises 0
Business Environment/ Investment Climate 1 1 1 3
Legal and Judicial 1 1 2
Agriculture 2 1 3
Health 0
Education 0
Energy 0
Telecoms 0
Transport 1 0 1
Water 0
environment 0
INSS 1 1
M and E 0
Total 8 7 7 8 13 11 54 Sources: Program Documents PRSCs 1-5, World Bank
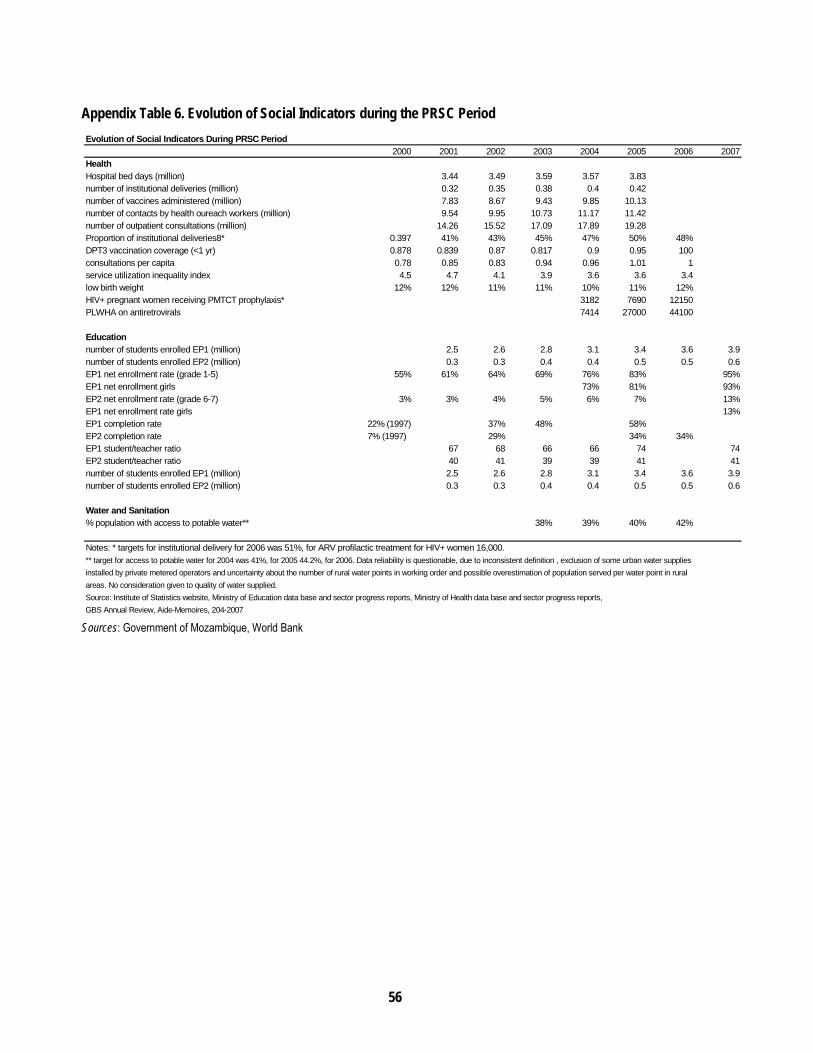
56
Appendix Table 6. Evolution of Social Indicators during the PRSC Period
Sources: Government of Mozambique, World Bank
Evolution of Social Indicators During PRSC Period2000 2001 2002 2003 2004 2005 2006 2007
HealthHospital bed days (million) 3.44 3.49 3.59 3.57 3.83number of institutional deliveries (million) 0.32 0.35 0.38 0.4 0.42number of vaccines administered (million) 7.83 8.67 9.43 9.85 10.13number of contacts by health oureach workers (million) 9.54 9.95 10.73 11.17 11.42number of outpatient consultations (million) 14.26 15.52 17.09 17.89 19.28Proportion of institutional deliveries8* 0.397 41% 43% 45% 47% 50% 48%DPT3 vaccination coverage (<1 yr) 0.878 0.839 0.87 0.817 0.9 0.95 100consultations per capita 0.78 0.85 0.83 0.94 0.96 1.01 1service utilization inequality index 4.5 4.7 4.1 3.9 3.6 3.6 3.4low birth weight 12% 12% 11% 11% 10% 11% 12%HIV+ pregnant women receiving PMTCT prophylaxis* 3182 7690 12150PLWHA on antiretrovirals 7414 27000 44100
Educationnumber of students enrolled EP1 (million) 2.5 2.6 2.8 3.1 3.4 3.6 3.9number of students enrolled EP2 (million) 0.3 0.3 0.4 0.4 0.5 0.5 0.6EP1 net enrollment rate (grade 1-5) 55% 61% 64% 69% 76% 83% 95%EP1 net enrollment girls 73% 81% 93%EP2 net enrollment rate (grade 6-7) 3% 3% 4% 5% 6% 7% 13%EP1 net enrollment rate girls 13%EP1 completion rate 22% (1997) 37% 48% 58%EP2 completion rate 7% (1997) 29% 34% 34%EP1 student/teacher ratio 67 68 66 66 74 74EP2 student/teacher ratio 40 41 39 39 41 41number of students enrolled EP1 (million) 2.5 2.6 2.8 3.1 3.4 3.6 3.9number of students enrolled EP2 (million) 0.3 0.3 0.4 0.4 0.5 0.5 0.6
Water and Sanitation% population with access to potable water** 38% 39% 40% 42%
Notes: * targets for institutional delivery for 2006 was 51%, for ARV profilactic treatment for HIV+ women 16,000. ** target for access to potable water for 2004 was 41%, for 2005 44.2%, for 2006. Data reliability is questionable, due to inconsistent definition , exclusion of some urban water supplies
installed by private metered operators and uncertainty about the number of rural water points in working order and possible overestimation of population served per water point in rural
areas. No consideration given to quality of water supplied.
Source: Institute of Statistics website, Ministry of Education data base and sector progress reports, Ministry of Health data base and sector progress reports,
GBS Annual Review, Aide-Memoires, 204-2007
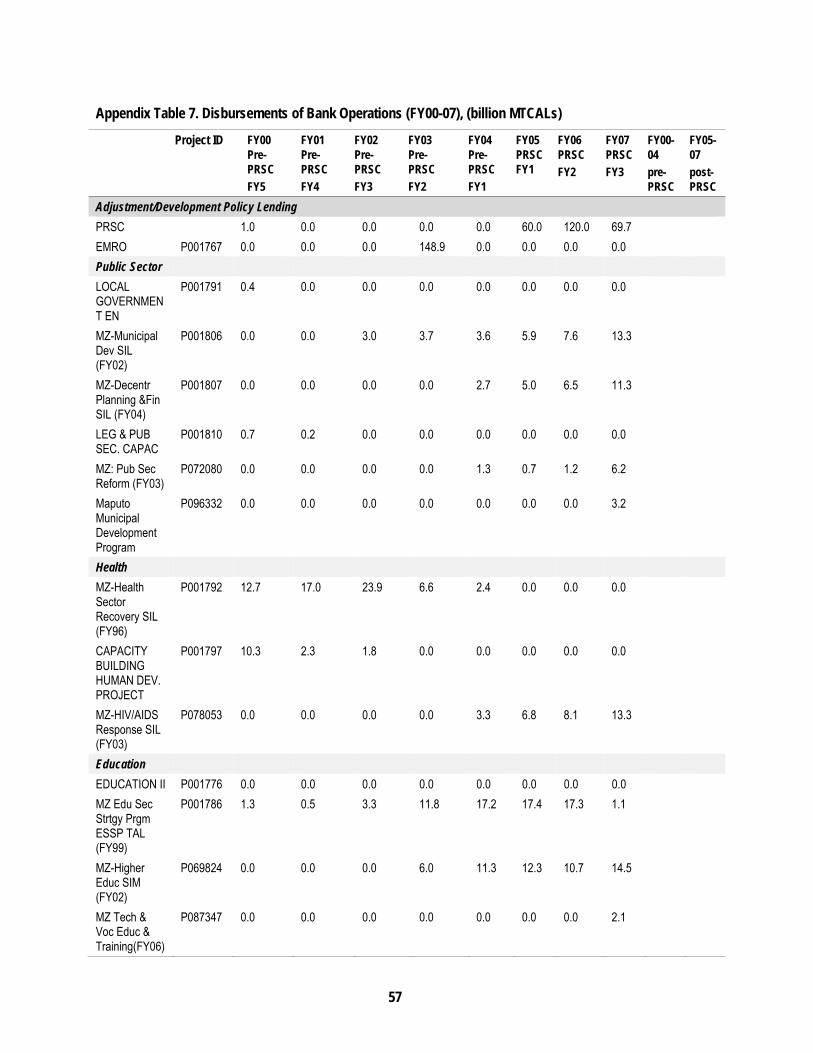
57
Appendix Table 7. Disbursements of Bank Operations (FY00-07), (billion MTCALs)
Project ID FY00 Pre-PRSC
FY5
FY01 Pre-PRSC
FY4
FY02 Pre-PRSC
FY3
FY03 Pre-PRSC
FY2
FY04 Pre-PRSC
FY1
FY05 PRSC FY1
FY06 PRSC
FY2
FY07 PRSC
FY3
FY00-04
pre-PRSC
FY05-07
post-PRSC
Adjustment/Development Policy Lending
PRSC 1.0 0.0 0.0 0.0 0.0 60.0 120.0 69.7
EMRO P001767 0.0 0.0 0.0 148.9 0.0 0.0 0.0 0.0
Public Sector
LOCAL GOVERNMENT EN
P001791 0.4 0.0 0.0 0.0 0.0 0.0 0.0 0.0
MZ-Municipal Dev SIL (FY02)
P001806 0.0 0.0 3.0 3.7 3.6 5.9 7.6 13.3
MZ-Decentr Planning &Fin SIL (FY04)
P001807 0.0 0.0 0.0 0.0 2.7 5.0 6.5 11.3
LEG & PUB SEC. CAPAC
P001810 0.7 0.2 0.0 0.0 0.0 0.0 0.0 0.0
MZ: Pub Sec Reform (FY03)
P072080 0.0 0.0 0.0 0.0 1.3 0.7 1.2 6.2
Maputo Municipal Development Program
P096332 0.0 0.0 0.0 0.0 0.0 0.0 0.0 3.2
Health
MZ-Health Sector Recovery SIL (FY96)
P001792 12.7 17.0 23.9 6.6 2.4 0.0 0.0 0.0
CAPACITY BUILDING HUMAN DEV. PROJECT
P001797 10.3 2.3 1.8 0.0 0.0 0.0 0.0 0.0
MZ-HIV/AIDS Response SIL (FY03)
P078053 0.0 0.0 0.0 0.0 3.3 6.8 8.1 13.3
Education
EDUCATION II P001776 0.0 0.0 0.0 0.0 0.0 0.0 0.0 0.0
MZ Edu Sec Strtgy Prgm ESSP TAL (FY99)
P001786 1.3 0.5 3.3 11.8 17.2 17.4 17.3 1.1
MZ-Higher Educ SIM (FY02)
P069824 0.0 0.0 0.0 6.0 11.3 12.3 10.7 14.5
MZ Tech & Voc Educ & Training(FY06)
P087347 0.0 0.0 0.0 0.0 0.0 0.0 0.0 2.1

58
Appendix Table 7. Disbursements of Bank Operations (FY00-07), (billion MTCALs)
Project ID
FY00 Pre-PRSC
FY5
FY01 Pre-PRSC
FY4
FY02 Pre-PRSC
FY3
FY03 Pre-PRSC
FY2
FY04 Pre-PRSC
FY1
FY05 PRSC FY1
FY06 PRSC
FY2
FY07 PRSC
FY3
FY00-04
pre-PRSC
FY05-07
post-PRSC
Transport
MZ-Roads & Bridges MMP (FY02)
P001785 0.0 0.0 0.0 4.4 15.2 41.0 64.7 49.2
FIRST ROAD & COASTAL SHIPPING
P001790 13.9 0.0 0.0 0.0 0.0 0.0 0.0 0.0
MZ 2nd Road and Coastal
P001804 20.5 24.9 8.3 9.1 12.6 0.0 0.0 0.0
MZ-Railway & Port Restr (FY00)
P042039 0.0 3.0 11.3 18.8 14.5 20.4 10.4 16.3
MZ-Beira Railway SIL (FY05)
P082618 0.0 0.0 0.0 0.0 0.0 0.0 18.1 30.7
Agriculture, Natural Resources, Rural Develop. AGR.SER. REHAB. P001781 1.9 0.3 0.0 0.0 0.0 0.0 0.0 0.0
RURAL REHABILITATION
P001796 3.2 0.7 0.0 0.0 0.0 0.0 0.0 0.0
MZ-Agr Sec Pep (FY99)
P001799 0.5 2.3 5.1 1.5 3.9 9.4 5.1 0.0
MZ-Mineral NRMCP (FY01)
P001808 0.0 0.0 0.9 2.1 6.6 5.0 3.4 1.3
FOOD SECURITY P001801
MZ-Coastal & Marine Biodiv Mgmt (FY00)
P070305 0.0 0.3 0.1 0.4 0.5 1.0 2.2 1.5
Energy
MZ GAS ENGINEERING (ENGY)
P001780 1.5 1.3 2.0 0.8 0.2 0.0 0.0 0.0
MZ - Energy Reform and Access SiL (FY04)
P069183 0.0 0.0 0.0 0.0 1.3 0.5 1.7 3.7
Industry, Trade and Finance
INDUSTRIAL ENTERPRISE
P001784 5.5 0.0 0.0 0.0 0.0 0.0 0.0 0.0
Enterprise Dev (FY00)
P049874 0.0 3.9 2.8 3.1 3.5 5.8 4.5 1.4
FINANCE SECTOR CAPACITY
P001811 2.1 1.0 0.0 0.0 0.0 0.0 0.0 0.0
MZ-TFCA & Tourism Dev(FY06)
P071465 0.0 0.0 0.0 0.0 0.0 0.0 0.5 2.2

59
Appendix Table 7. Disbursements of Bank Operations (FY00-07), (billion MTCALs)
Project ID
FY00 Pre-PRSC
FY5
FY01 Pre-PRSC
FY4
FY02 Pre-PRSC
FY3
FY03 Pre-PRSC
FY2
FY04 Pre-PRSC
FY1
FY05 PRSC FY1
FY06 PRSC
FY2
FY07 PRSC
FY3
FY00-04
pre-PRSC
FY05-07
post-PRSC
MZ-Com Sec Reform
P073479 0.0 0.0 0.0 3.1 1.5 2.1 1.8 3.6
MZ-Fin. Sect tech assistance Project
P086169 0.0 0.0 0.0 0.0 0.0 0.0 0.8 0.7
MZ-Market Led Smallholder Dev (FY06)
P093165 0.0 0.0 0.0 0.0 0.0 0.0 0.0 2.0
Regional Development
WSS
MZ-Natl Water 1 (FY98)
P039015 1.8 2.1 2.9 3.7 6.5 9.6 8.1 0.0
MZ-Natl Water 2 (FY99)
P052240 1.0 1.3 3.9 5.0 4.9 20.2 14.6 16.4
Natural Disaster 0.0 0.0 0.0 0.0 0.0 0.0 0.0 0.0
Flood Emergency Recovery Project
P070432 0.0 28.7 -0.2 0.0 0.0 0.0 0.0 0.0
Total, of which 78.2 89.9 69.1 292.5 183.5 223.0 307.5 263.7 713.4
794.2
PL/PRSC 1.0 0.0 0.0 212.4 70.7 60.0 120.0 69.7 284.1
249.8
Investment credits
77.2 89.9 69.1 80.1 112.9 163.0 187.5 193.9 429.3
544.4
Share of DPL&PRSCs in Total Disburse
1.3 0.0 0.0 72.6 38.5 26.9 39.0 26.5 39.8 31.4
Share of investment credits
98.7 100.0 100.0 27.4 61.5 73.1 61.0 73.5 60.2 68.6
Sources: Government of Mozambique, World Bank

60
Appendix Table 8. Relative Importance of PRSC Disbursements (billion MTCALs)
FY00 Pre-
PRSCFY3
FY01 Pre-
PRSCFY2
FY02 Pre-
PRSCFY1
FY03 PRSC FY2
FY04 PRSC FY3
FY05 PRSC FY4
FY06 PRSC FY5
FY07 PRSC FY3
FY04-07
post-PRSC
A. Credits and Loans (BFCAF
IDA (EMRO, EMRSO)
IDA PRSC 1.206 1.440 1.560 1.798
AfDB 0.058 1.570 0.789
Total 1.206 1.498 3.130 2.588
B. Grants Billion MTCALs0
EU fixed 0.736 0.982 0.803 1.520
EU variable 0.221 0.370 0.476 0.000
Germany 0.084 0.106 0.330 0.275
Belgium 0.074 0.062 0.099 0.082
Denmark 0.000 0.228 0.068 0.390
Finland 0.098 0.122 0.161 0.139
France 0.076 0.094 0.099 0.054
Holland 0.454 0.434 0.595 0.490
Ireland 0.143 0.187 0.187 0.249
Italy 0.076 0.194 0.000 0.109
Norway 0.189 0.257 0.486 0.588
United Kingdom 0.551 1.356 1.677 1.816
Sweden 0.279 0.415 0.681 1.153
Switzerland (Fixed) 0.149 0.091 0.174 0.181
Switzerland (Variable)
0.000 0.091 0.000 0.000
Spain 0.000 0.086 0.099 0.111
Canada 0.000 0.048 0.055 0.111
Portugal 0.000 0.036 0.039 0.039
Total bilateral 3.132 5.160 6.029 7.308
Total general budget support multilateral plus bilateral 0.000 0.000 0.000 0.000 4.338 6.658 9.160 9.895
C. Total ODA (=external financing, inc grants)
7.388 15.111 19.280 18.758 20.363 15.194 24.910 27.557
D. Government Expenditures and revenues
Total Govt Current Expenditures (BCAF)
7.686 10.345 13.468 16.431 19.006 21.092 25.528 31.838
Total Govt Capital Expenditures (BCAF)
6.060 11.808 12.149 13.362 12.543 12.971 21.292 24.314
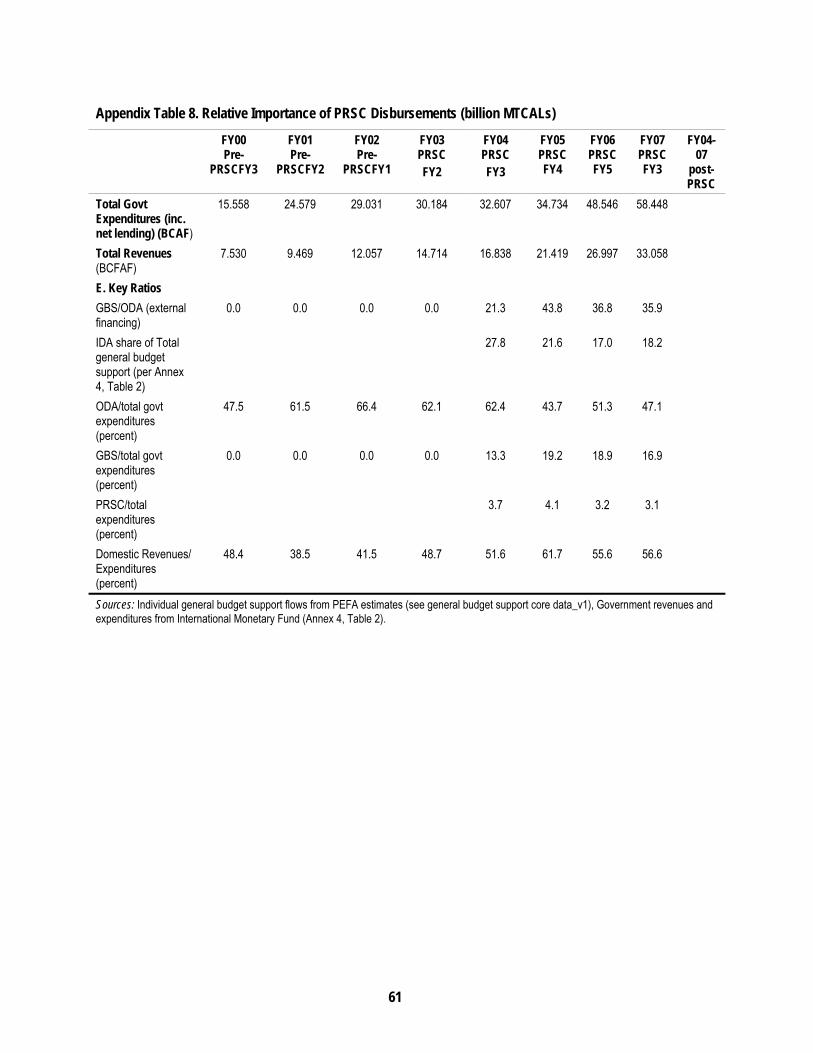
61
Appendix Table 8. Relative Importance of PRSC Disbursements (billion MTCALs)
FY00 Pre-
PRSCFY3
FY01 Pre-
PRSCFY2
FY02 Pre-
PRSCFY1
FY03 PRSC FY2
FY04 PRSC FY3
FY05 PRSC FY4
FY06 PRSC FY5
FY07 PRSC FY3
FY04-07
post-PRSC
Total Govt Expenditures (inc. net lending) (BCAF)
15.558 24.579 29.031 30.184 32.607 34.734 48.546 58.448
Total Revenues (BCFAF)
7.530 9.469 12.057 14.714 16.838 21.419 26.997 33.058
E. Key Ratios
GBS/ODA (external financing)
0.0 0.0 0.0 0.0 21.3 43.8 36.8 35.9
IDA share of Total general budget support (per Annex 4, Table 2)
27.8 21.6 17.0 18.2
ODA/total govt expenditures (percent)
47.5 61.5 66.4 62.1 62.4 43.7 51.3 47.1
GBS/total govt expenditures (percent)
0.0 0.0 0.0 0.0 13.3 19.2 18.9 16.9
PRSC/total expenditures (percent)
3.7 4.1 3.2 3.1
Domestic Revenues/ Expenditures (percent)
48.4 38.5 41.5 48.7 51.6 61.7 55.6 56.6
Sources: Individual general budget support flows from PEFA estimates (see general budget support core data_v1), Government revenues and expenditures from International Monetary Fund (Annex 4, Table 2).

62
Appendix Table 9. Consolidated Government Operations and Financing
1997 1998 1999 2000 2001 2002 2003 2004 2005 2006 2007 Total Shares A. Total Revenue 4.623 5.324 6.210 7.530 9.469 12.057 14.714 16.838 21.419 26.997 33.058 79.968
Total Recurrent Expenditure, o.w. 4.272 5.268 6.331 7.686 10.345 13.468 16.431 19.006 21.092 25.528 31.838 82.057
foreign interest 0.496 0.442 0.318 0.099 0.147 0.322 0.317 0.411 0.459 0.464 0.404 0.923
Total capital expenditure 6.001 6.060 11.808 12.149 13.362 12.543 12.971 21.292 24.314 60.168
B. Total Ext.+net lending 9.498 10.141 12.814 15.558 24.579 29.031 30.184 32.607 34.734 48.546 58.448 146.071
C.
Overall balance, p.o.basis
-4.875 -4.817 -6.604 -8.028 -15.11
-16.974 -15.47
-15.769
-13.315
-21.549
-25.390 -66.103
D. Net change in arrears
E. Unallocated expenditure 0.139 -0.106 -0.220 0.043 -0.101 0.208 -0.458 -0.310 -0.141 -0.507 -1.775 -1.416
F.
Overall balance, cash basis, exc. Grants
-4.736 -4.923 -6.824 -7.985
-15.211
-16.766
-15.928
-16.079
-13.456
-22.056
-27.165 -67.519
Grants,o.w. 3.705 3.818 6.073 4.576 10.519 10.020 10.841 10.053 10.363 19.124 19.268 50.381 Projects 1.962 1.894 2.787 2.112 7.044 6.728 6.671 6.185 4.938 9.569 11.189 27.363 Non project 1.743 1.924 3.287 2.464 3.475 3.292 4.170 3.868 5.037 5.940 8.079 19.015
HIPC/MDRI via Central Bank 0.388 3.615 4.003
Overall balance, after Grants
-1.031 -1.105 -0.751 -3.409 -4.692 -6.746 -5.087 -6.026 -3.093 -2.932 -7.897 -17.138
Financing, o.w. 1.031 1.105 0.754 3.404 4.691 6.745 5.087 6.025 3.094 2.932 7.855 17.138
Domestic, inc privatization
-1.298 -1.067 -0.156 0.966 1.382 0.806 0.093 1.754 -1.941 -5.835 0.382 -5.929
G. External, o.w. 2.329 2.172 0.910 2.438 3.309 5.939 4.994 4.271 5.035 8.767 7.473 23.1 100.0 projects 1.897 1.641 1.394 2.268 3.108 5.886 5.348 6.937 3.148 5.172 3.976 20.6 89.3
non project (inc.budget Support) 0.855 1.03 0.000 0.544 1.484 3.374 2.569 3.373 2.071 4.229 4.313 12.2 53.1
amortization -0.423 -0.499 -0.483 -0.286 -0.311 -0.485 -0.591 -0.668 -0.734 -1.084 -0.817 -3.1 -13.3
HIPC relief 0.000 0.455 0.513 0.538 0.237 0.484 0.7
Investment Abroad 2.482 0.550 0.450 3.5 15.1
H.
Total Ext. Financing , inc grants, ow 6.457 6.489 7.468 7.388 15.111 19.280 18.758 20.363 15.194 24.910 27.557 79.2 100.0
projects, 3.859 3.535 4.181 4.380 10.152 12.614 12.019 13.122 8.086 14.741 15.165 48.0 100.0
non-project financing (i.e. program spt inc general budget support, i.e General Budget Support) , o.w. 2.598 2.954 3.287 3.008 4.959 6.666 6.739 7.241 7.108 10.169 12.392 31.3
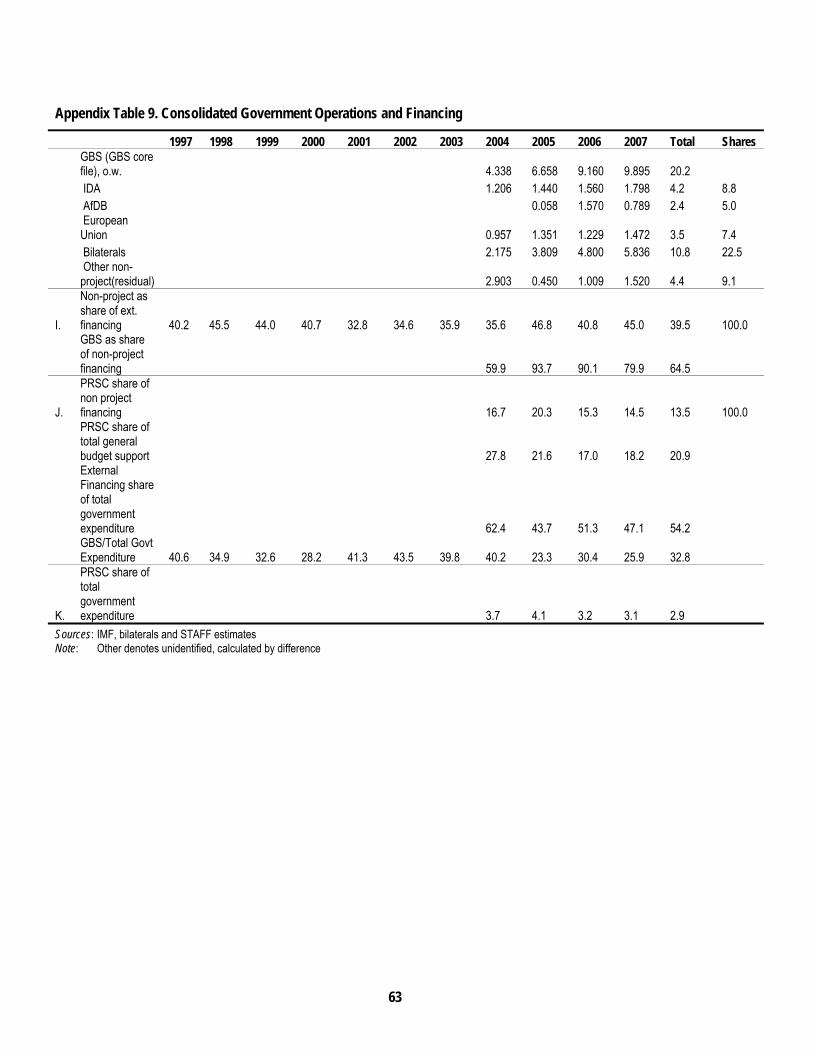
63
Appendix Table 9. Consolidated Government Operations and Financing
1997 1998 1999 2000 2001 2002 2003 2004 2005 2006 2007 Total Shares
GBS (GBS core file), o.w. 4.338 6.658 9.160 9.895 20.2
IDA 1.206 1.440 1.560 1.798 4.2 8.8 AfDB 0.058 1.570 0.789 2.4 5.0
European Union 0.957 1.351 1.229 1.472 3.5 7.4
Bilaterals 2.175 3.809 4.800 5.836 10.8 22.5
Other non-project(residual) 2.903 0.450 1.009 1.520 4.4 9.1
I.
Non-project as share of ext. financing 40.2 45.5 44.0 40.7 32.8 34.6 35.9 35.6 46.8 40.8 45.0 39.5 100.0
GBS as share of non-project financing 59.9 93.7 90.1 79.9 64.5
J.
PRSC share of non project financing 16.7 20.3 15.3 14.5 13.5 100.0
PRSC share of total general budget support 27.8 21.6 17.0 18.2 20.9
External Financing share of total government expenditure 62.4 43.7 51.3 47.1 54.2
GBS/Total Govt Expenditure 40.6 34.9 32.6 28.2 41.3 43.5 39.8 40.2 23.3 30.4 25.9 32.8
K.
PRSC share of total government expenditure 3.7 4.1 3.2 3.1 2.9
Sources: IMF, bilaterals and STAFF estimates Note: Other denotes unidentified, calculated by difference

64
Appendix Table 10. Inventory of General Budget Support, by Donor
Donor Using Single Performance Assessment Matrix/policy matrix (using entire matrix or subset)
Financing contingent on satisfactory
macroframework as
determined by IMF
Participating in joint review process/
mission (additional donor specific
missions)
Single tranche or multi-tranche/
Variable tranche disbursement
Using uniform general budget support reporting requirement or requiring
additional reporting
IDA/PRSC Subset yes Yes; but missions required for pre-appraisal and appraisal
Generally single tranche, but can be two if needed
Additional, in that PRSCs must be approved by Board
AfDB To be verified Yes Additional, in that support must be approved by Board
European Commission
Whole Performance Assessment Matrix
yes Yes Split response: i.e, fixed plus variable tranches
Variable tranche is contingent upon satisfactory performance based on (i) outcome indicators in social sectors (50 percent), and (ii) budget indicators (50 percent)
Switzerland Whole Performance Assessment Matrix
yes Yes Fixed Plus variable Preliminary commitment made at time of MTR, on basis of performance in yr n-1 and performance in yr n up to time of MTR. For the fixed portion (50 percent of total direct budget support) assessment is made on basis of general performance against PES/PAF commitments, including in particular macro performance. This assessment will also take into account discussions on headline information of PES and budget for yr. n+1 Variable portion (50 percent) is based on: PFM (20 percent of DBS); revenue mobilization (15 percent); and PSD (15 percent). Commitment only confirmed after approval of Budget and PES for yr. n+1. Also,
Sweden Whole Performance Assessment Matrix
Fixed plus variable Variable portion is linked to performance wrt the financial sector and governance targets/indicators for yr n+1 agreed at the August MTR review in yr n. These will be linked to 30 percent of Sweden’s total DBS. Performance is assessed at the time of the Annual Review in yr n+1,and if satisfactory, the variable portion is then confirmed
All others Whole Performance Assessment
No

65
Appendix Table 10. Inventory of General Budget Support, by Donor
Donor Using Single Performance Assessment Matrix/policy matrix (using entire matrix or subset)
Financing contingent on satisfactory
macroframework as
determined by IMF
Participating in joint review process/
mission (additional donor specific
missions)
Single tranche or multi-tranche/
Variable tranche disbursement
Using uniform general budget support reporting requirement or requiring
additional reporting
Matrix
IDA/PRSC Subset yes Yes; but missions required for pre-appraisal and appraisal
Generally single tranche, but can be two if needed
Additional, in that PRSCs must be approved by Board
AfDB To be verified Yes Additional, in that support must be approved by Board
European Commission
Whole Performance Assessment Matrix
yes Yes Split response: i.e, fixed plus variable tranches
Variable tranche is contingent upon satisfactory performance based on (i) outcome indicators in social sectors (50 percent), and (ii) budget indicators (50 percent)
Switzerland Whole Performance Assessment Matrix
yes Yes Fixed Plus variable Preliminary commitment made at time of MTR, on basis of performance in yr n-1 and performance in yr n up to time of MTR. For the fixed portion (50 percent of total direct budget support) assessment is made on basis of general performance against PES/PAF commitments, including in particular macro performance. This assessment will also take into account discussions on headline information of PES and budget for yr. n+1 Variable portion (50 percent) is based on: PFM (20 percent of DBS); revenue mobilization (15 percent); and PSD (15 percent). Commitment only confirmed after approval of Budget and PES for yr. n+1. Also,
Sweden Whole Performance Assessment Matrix
Fixed plus variable Variable portion is linked to performance wrt the financial sector and governance targets/indicators for yr n+1 agreed at the August MTR review in yr n. These will be linked to 30 percent of Sweden’s total DBS. Performance is assessed at the time of the Annual Review in yr n+1,and if satisfactory, the variable portion is then confirmed
All others Whole Performance Assessment Matrix
No
Sources: Government of Mozambique, World Bank

66
Appendix Table 11. Predictability of PRSC and general budget support flows (2004-2007) (millions USD)
GBS Financier Amount Expected
Amount Disbursed
Disbursed/ Expected (%)
Commitment made prior to budget be-ing submitted to Parliament (yes/no)
Quarter disburse-ment expected per MOF budget plan
Quarter of actual disbursement
Country FY quarter in which dis-bursed
A. 2004
IDA PRSC 1 60 60 100.0 3 3(sept)
Germany 4.2 4.3 102.4 3 3 3 Belgium 3.4 3.7 108.8 1 1 1 Denmark 10 0 0.0 Finland 4.8 4.9 102.1 2 2 2 France 3.4 3.8 111.8 1 1 1 NL 21 22.6 107.6 1,3,4 1,3,4 1,3,4 Ireland 6.9 7.1 102.9 2 2 2 Italy 3.6 3.8 105.6 2 2 2 Norway 8.8 9.4 106.8 4 4 4 UK 24.3 27.4 112.8 1 1 1 Sweden 13.8 13.9 100.7 3,4 3,4 Switzerland 7.4 7.4 100.0 3 3 EU 45 47.6 105.8 3 3 Spain African DB Canada Portugal Total 216.6 215.9 99.7
B. 2005
IDA PRSC 2 1st tranche 60 60 100 4 4 (oct) 4
Germany 4.7 4.4 100 2 2 Belgium 2.7 2.6 100 2 2 Denmark 10 9.5 100 4 4 Finland 4.8 5.1 100 2 2 France 7.2 3.9 100 1 1 NL 18.6 18.1 100 1 1 Ireland 7.2 7.8 100 1 1 Italy 4.3 8.1 188% 1 1,3 Norway 10 10.7 100 1 1 UK 29 56.5 195% 1 1 Sweden 14.9 17.3 116% 3 3 Switzerland 7.4 7.6 100 3 3 EU 57.9 56.3 97% 3 3 Spain 3 3.6 100 4 4 African DB 2.4 1 Canada 2.2 2 100 2 2 Portugal 1.5 1.5 100 3 3
Total 245.4 277.4 113.0
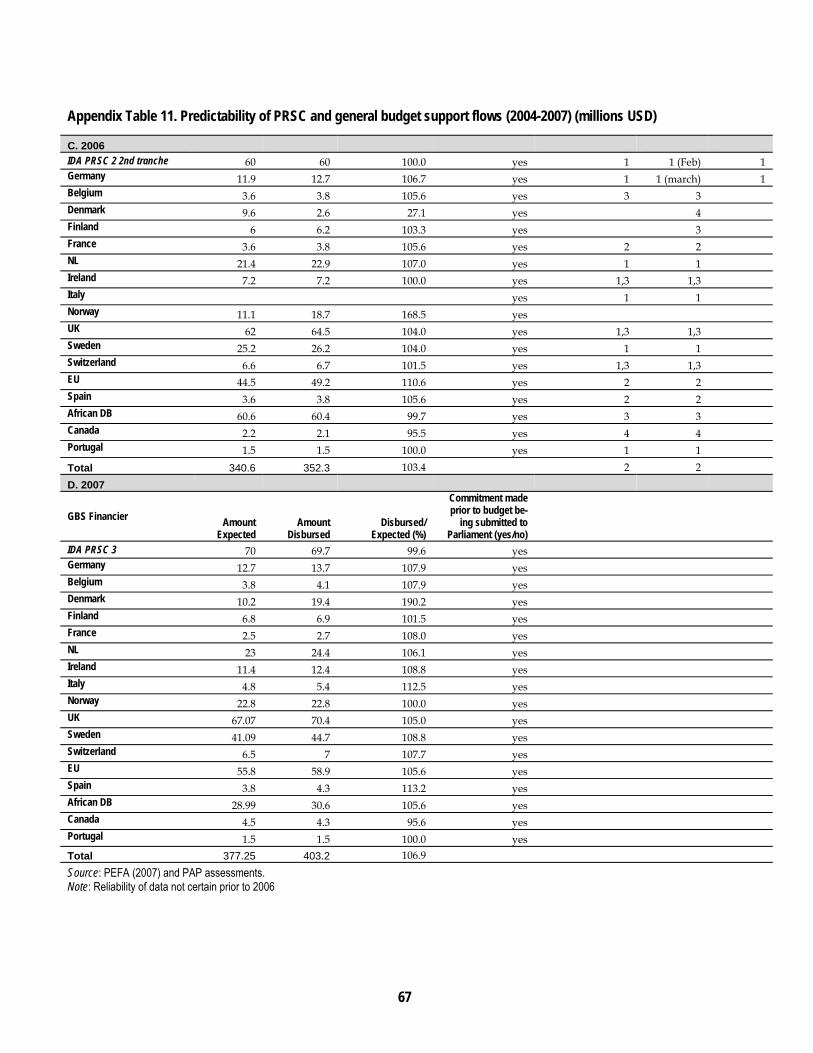
67
Appendix Table 11. Predictability of PRSC and general budget support flows (2004-2007) (millions USD)
C. 2006
IDA PRSC 2 2nd tranche 60 60 100.0 yes 1 1 (Feb) 1 Germany 11.9 12.7 106.7 yes 1 1 (march) 1 Belgium 3.6 3.8 105.6 yes 3 3 Denmark 9.6 2.6 27.1 yes 4 Finland 6 6.2 103.3 yes 3 France 3.6 3.8 105.6 yes 2 2 NL 21.4 22.9 107.0 yes 1 1 Ireland 7.2 7.2 100.0 yes 1,3 1,3 Italy yes 1 1 Norway 11.1 18.7 168.5 yes UK 62 64.5 104.0 yes 1,3 1,3 Sweden 25.2 26.2 104.0 yes 1 1 Switzerland 6.6 6.7 101.5 yes 1,3 1,3 EU 44.5 49.2 110.6 yes 2 2 Spain 3.6 3.8 105.6 yes 2 2 African DB 60.6 60.4 99.7 yes 3 3 Canada 2.2 2.1 95.5 yes 4 4 Portugal 1.5 1.5 100.0 yes 1 1
Total 340.6 352.3 103.4 2 2
D. 2007
GBS Financier Amount Expected
Amount Disbursed
Disbursed/ Expected (%)
Commitment made prior to budget be-
ing submitted to Parliament (yes/no)
IDA PRSC 3 70 69.7 99.6 yes Germany 12.7 13.7 107.9 yes Belgium 3.8 4.1 107.9 yes Denmark 10.2 19.4 190.2 yes Finland 6.8 6.9 101.5 yes France 2.5 2.7 108.0 yes NL 23 24.4 106.1 yes Ireland 11.4 12.4 108.8 yes Italy 4.8 5.4 112.5 yes Norway 22.8 22.8 100.0 yes UK 67.07 70.4 105.0 yes Sweden 41.09 44.7 108.8 yes Switzerland 6.5 7 107.7 yes EU 55.8 58.9 105.6 yes Spain 3.8 4.3 113.2 yes African DB 28.99 30.6 105.6 yes Canada 4.5 4.3 95.6 yes Portugal 1.5 1.5 100.0 yes
Total 377.25 403.2 106.9
Source: PEFA (2007) and PAP assessments. Note: Reliability of data not certain prior to 2006

68
Appendix Table 12. Budget data 2000-2006
Budgetary Receipts and Expenditures (MT million)
2000 2001 2002 2003 2004 2005 2006 2007 2008
Receipts 7530 9469 12057 14714 16838 21419 26977 33058 37773
Recurrent Expenditures incl. interest (source International Monetary Fund)
7686 10345 13468 16431 19006 21092 25518 31838 37886
Interest (domestic plus foreign)- source International Monetary Fund)
109 477 1274 1318 1321 1248 1380 1277 1651
Reccurrent net of interest 7577 9868 12194 15113 17685 19844 24138 30561 36235
Investment – total 6060 11808 12419 13362 12543 12971 21292 24314 40450
Investment – internal 2046 3140 3167 3662 3911 5317 6102 7944 9612
Total Expenditure in MT, exc. Net lending
13746 22153 25887 29793 31549 34063 46810 56152 78336
Total Expenditure in MT, inc. Net lending
15558 24579 29031 30184 32607 34734 48546 58448 83220
Total recurrent expenditure and domestic Investment
9732 13485 16635 20093 22917 26409 31620 39782 47498
Exchange rate MT/$ 15.7 20.7 23.2 23.3 20.1 24.0 26.0 25.8 24.0
Total Expenditure in U.S. $ million 1080 1145 1183 1216 1570 1419 1800 2176 3264
Total recurrent and domestic Investment in U.S. $ million
634 649 910 1014 1140 1100 1216 1542 1979
ODA net (from ODA website) US mill
876.1 931.1 2200.7 1036.7 1234.9 1276.5 1276.5 1610.9 1462.9
ODA gross = Ext. Financing from International Monetary Fund
470.6 730.0 831.0 805.1 1013.1 633.1 958.1 1068.1
Sources: For Budget Support data; prior to 2004; OECD DAC general budget support evaluation table B3.1; 2004 and later, PEFA reports and mission estimates. For Expenditure data: International Monetary Fund staff reports (Art IV, 2005 and staff reports thereafter. For Exchange rate: International Monetary Fund 2007 Art 4 consultation, 2000-03 exchange rate OECD-DAC general budget support evaluation report table 3B1 for 2008: Budget proposal

69
Appendix Table 13. Alignment of PRSC with Domestic Planning/Budgeting Processes and GBS Process
Month National Budget/Planning
Process
PRS Annual Review (This is the same thing as the
BdPES)
PRSC 3
PRSC 4
General Budget Support Process
January
Drafting of BdPES for yr (n-1)
Drafting of BdPES for yr n-1
February
February 15. BdPES completed for yr (n-1) and issued The BdPES assesses performance against all Performance Assessment Matrix indicators for yr (n-1)
February 15. BdPES completed for yr (n-1) and issued The BdPES assesses performance against all Performance Assessment Matrix indicators for yr (n-1)
March
IMF program review and Art IV mission (reviews performance for yr (n-1)
April
MTFF discussed in Cabinet
G19 Joint Review, following production of the BdPES for yr n-1
May
15 May: BER issued for Q1 of yr n 31 May: Ceilings and guidelines for yr n+1 Budget sent to Departments
G 19 Commitments for general budget support following completion of JR
June
Line Ministries draft budget for yr n+1
Line Ministries draft PES for yr n+1
Follow up meetings to G19 Joint Review
July
31 July: Draft sector budgets submitted to MPD/MF
31 July: Draft sector inputs for PES (n+1) submitted to MPD/MF
August
Aug 31: Draft Budget Law finalized
Aug. 15: Draft BdPES and BER produced for 1st Semester Aug. 31: Draft PES (n+1) finalized;
1. G19 MTR mission (i) follows production of half year BdPES for yr. n and (ii) precedes submission of Budget and PES for yr n+1 to Parliament. The PES contains the Performance Assessment Matrix for yr (n+1, n+2 and n+3) 2. International Monetary Fund Budget Review Mission 3 August 31. PAPs confirm their financing commitments for yr n+1
September
Submission of Budget to Cabinet 30 September Draft Budget submitted to Parliament
Submission of PES to Cabinet. 30 September Submission of draft PES Parliament
2
October
IMF program review mission
November
15 November: BER for q3 issued
11/08 PCN 11/20 ROC
10/25 PCN 11/28: ROC
December 31
Discussion and approval of Budget for yr n+1
Discussion and approval of PES for yr n+1
12/19: Docs to Board
12/20: Docs to Board
Follow up meeting to G19 MTR meetings
Sources: Government of Mozambique, World Bank:
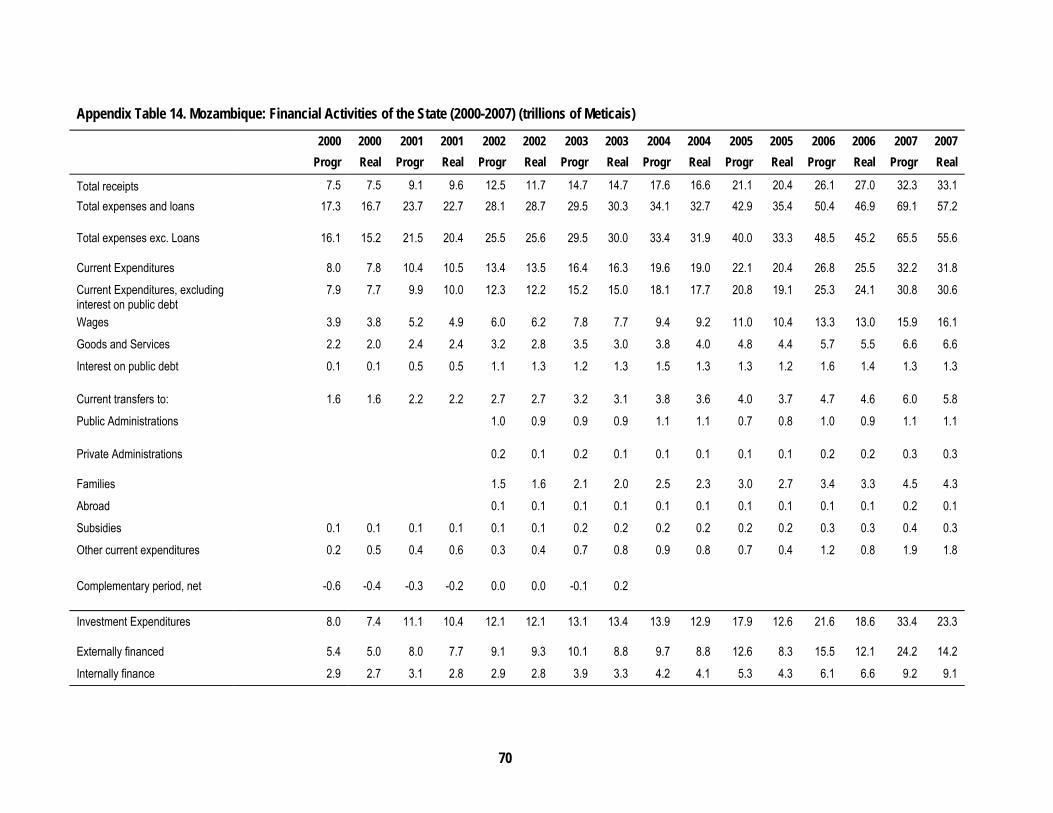
70
Appendix Table 14. Mozambique: Financial Activities of the State (2000-2007) (trillions of Meticais)
2000 2000 2001 2001 2002 2002 2003 2003 2004 2004 2005 2005 2006 2006 2007 2007
Progr Real Progr Real Progr Real Progr Real Progr Real Progr Real Progr Real Progr Real
Total receipts 7.5 7.5 9.1 9.6 12.5 11.7 14.7 14.7 17.6 16.6 21.1 20.4 26.1 27.0 32.3 33.1
Total expenses and loans 17.3 16.7 23.7 22.7 28.1 28.7 29.5 30.3 34.1 32.7 42.9 35.4 50.4 46.9 69.1 57.2
Total expenses exc. Loans 16.1 15.2 21.5 20.4 25.5 25.6 29.5 30.0 33.4 31.9 40.0 33.3 48.5 45.2 65.5 55.6
Current Expenditures 8.0 7.8 10.4 10.5 13.4 13.5 16.4 16.3 19.6 19.0 22.1 20.4 26.8 25.5 32.2 31.8
Current Expenditures, excluding interest on public debt
7.9 7.7 9.9 10.0 12.3 12.2 15.2 15.0 18.1 17.7 20.8 19.1 25.3 24.1 30.8 30.6
Wages 3.9 3.8 5.2 4.9 6.0 6.2 7.8 7.7 9.4 9.2 11.0 10.4 13.3 13.0 15.9 16.1
Goods and Services 2.2 2.0 2.4 2.4 3.2 2.8 3.5 3.0 3.8 4.0 4.8 4.4 5.7 5.5 6.6 6.6
Interest on public debt 0.1 0.1 0.5 0.5 1.1 1.3 1.2 1.3 1.5 1.3 1.3 1.2 1.6 1.4 1.3 1.3
Current transfers to: 1.6 1.6 2.2 2.2 2.7 2.7 3.2 3.1 3.8 3.6 4.0 3.7 4.7 4.6 6.0 5.8
Public Administrations 1.0 0.9 0.9 0.9 1.1 1.1 0.7 0.8 1.0 0.9 1.1 1.1
Private Administrations 0.2 0.1 0.2 0.1 0.1 0.1 0.1 0.1 0.2 0.2 0.3 0.3
Families 1.5 1.6 2.1 2.0 2.5 2.3 3.0 2.7 3.4 3.3 4.5 4.3
Abroad 0.1 0.1 0.1 0.1 0.1 0.1 0.1 0.1 0.1 0.1 0.2 0.1
Subsidies 0.1 0.1 0.1 0.1 0.1 0.1 0.2 0.2 0.2 0.2 0.2 0.2 0.3 0.3 0.4 0.3
Other current expenditures 0.2 0.5 0.4 0.6 0.3 0.4 0.7 0.8 0.9 0.8 0.7 0.4 1.2 0.8 1.9 1.8
Complementary period, net -0.6 -0.4 -0.3 -0.2 0.0 0.0 -0.1 0.2
Investment Expenditures 8.0 7.4 11.1 10.4 12.1 12.1 13.1 13.4 13.9 12.9 17.9 12.6 21.6 18.6 33.4 23.3
Externally financed 5.4 5.0 8.0 7.7 9.1 9.3 10.1 8.8 9.7 8.8 12.6 8.3 15.5 12.1 24.2 14.2
Internally finance 2.9 2.7 3.1 2.8 2.9 2.8 3.9 3.3 4.2 4.1 5.3 4.3 6.1 6.6 9.2 9.1
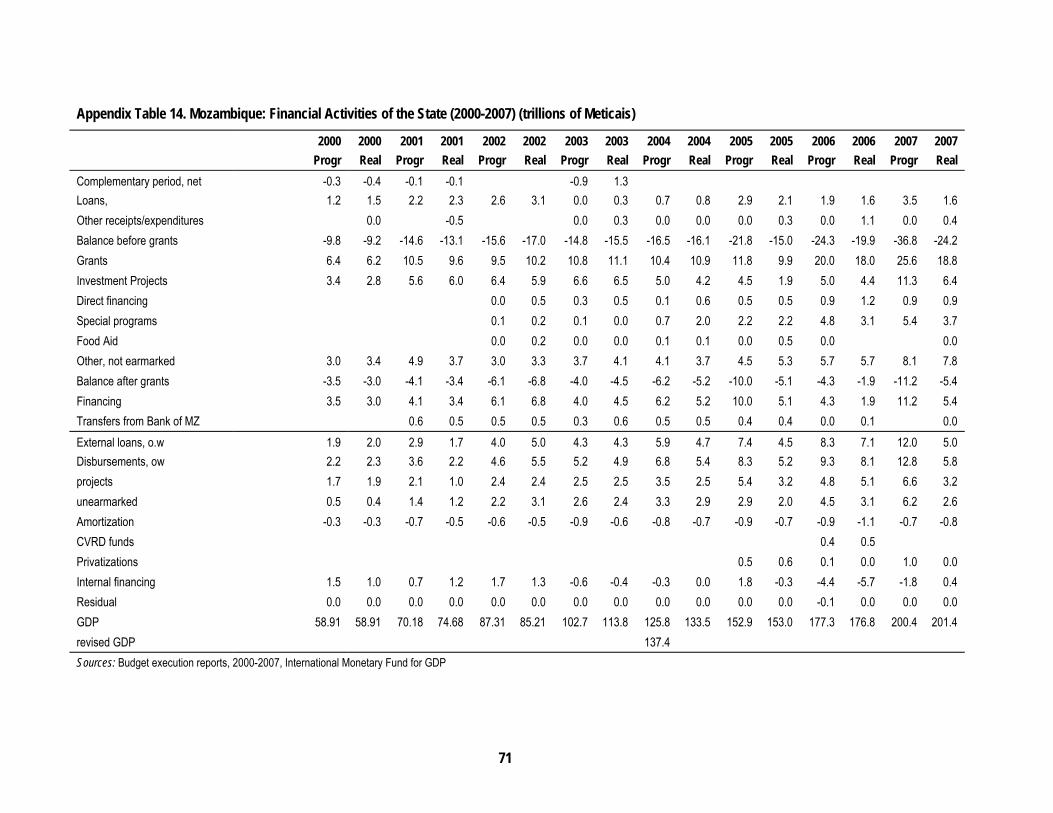
71
Appendix Table 14. Mozambique: Financial Activities of the State (2000-2007) (trillions of Meticais)
2000 2000 2001 2001 2002 2002 2003 2003 2004 2004 2005 2005 2006 2006 2007 2007
Progr Real Progr Real Progr Real Progr Real Progr Real Progr Real Progr Real Progr Real
Complementary period, net -0.3 -0.4 -0.1 -0.1 -0.9 1.3
Loans, 1.2 1.5 2.2 2.3 2.6 3.1 0.0 0.3 0.7 0.8 2.9 2.1 1.9 1.6 3.5 1.6
Other receipts/expenditures 0.0 -0.5 0.0 0.3 0.0 0.0 0.0 0.3 0.0 1.1 0.0 0.4
Balance before grants -9.8 -9.2 -14.6 -13.1 -15.6 -17.0 -14.8 -15.5 -16.5 -16.1 -21.8 -15.0 -24.3 -19.9 -36.8 -24.2
Grants 6.4 6.2 10.5 9.6 9.5 10.2 10.8 11.1 10.4 10.9 11.8 9.9 20.0 18.0 25.6 18.8
Investment Projects 3.4 2.8 5.6 6.0 6.4 5.9 6.6 6.5 5.0 4.2 4.5 1.9 5.0 4.4 11.3 6.4
Direct financing 0.0 0.5 0.3 0.5 0.1 0.6 0.5 0.5 0.9 1.2 0.9 0.9
Special programs 0.1 0.2 0.1 0.0 0.7 2.0 2.2 2.2 4.8 3.1 5.4 3.7
Food Aid 0.0 0.2 0.0 0.0 0.1 0.1 0.0 0.5 0.0 0.0
Other, not earmarked 3.0 3.4 4.9 3.7 3.0 3.3 3.7 4.1 4.1 3.7 4.5 5.3 5.7 5.7 8.1 7.8
Balance after grants -3.5 -3.0 -4.1 -3.4 -6.1 -6.8 -4.0 -4.5 -6.2 -5.2 -10.0 -5.1 -4.3 -1.9 -11.2 -5.4
Financing 3.5 3.0 4.1 3.4 6.1 6.8 4.0 4.5 6.2 5.2 10.0 5.1 4.3 1.9 11.2 5.4
Transfers from Bank of MZ ( C)
0.6 0.5 0.5 0.5 0.3 0.6 0.5 0.5 0.4 0.4 0.0 0.1 0.0
External loans, o.w 1.9 2.0 2.9 1.7 4.0 5.0 4.3 4.3 5.9 4.7 7.4 4.5 8.3 7.1 12.0 5.0
Disbursements, ow 2.2 2.3 3.6 2.2 4.6 5.5 5.2 4.9 6.8 5.4 8.3 5.2 9.3 8.1 12.8 5.8
projects 1.7 1.9 2.1 1.0 2.4 2.4 2.5 2.5 3.5 2.5 5.4 3.2 4.8 5.1 6.6 3.2
unearmarked 0.5 0.4 1.4 1.2 2.2 3.1 2.6 2.4 3.3 2.9 2.9 2.0 4.5 3.1 6.2 2.6
Amortization -0.3 -0.3 -0.7 -0.5 -0.6 -0.5 -0.9 -0.6 -0.8 -0.7 -0.9 -0.7 -0.9 -1.1 -0.7 -0.8
CVRD funds 0.4 0.5
Privatizations 0.5 0.6 0.1 0.0 1.0 0.0
Internal financing 1.5 1.0 0.7 1.2 1.7 1.3 -0.6 -0.4 -0.3 0.0 1.8 -0.3 -4.4 -5.7 -1.8 0.4
Residual 0.0 0.0 0.0 0.0 0.0 0.0 0.0 0.0 0.0 0.0 0.0 0.0 -0.1 0.0 0.0 0.0
GDP 58.91 58.91 70.18 74.68 87.31 85.21 102.7 113.8 125.8 133.5 152.9 153.0 177.3 176.8 200.4 201.4
revised GDP 137.4
Sources: Budget execution reports, 2000-2007, International Monetary Fund for GDP

72
Appendix Table 15. Expenditure in Priority and Nonpriority Sectors (trillions of Meticais)
1999 2000 2001 2002 2003 2004 2005 2006 2007 2009
actual actual actual actual prelim
projected July 07
projected July 08
Total Revenues 6.207 7.535 9.469 12.057 14.714 16.838 21.418 26.997 31.941 33.058
Total Exp, exc Bank restructuring costs 12.815 14.602 22.994 25.036 29.71
Total Exp, exc Bank restructuring costs and interest 12.491 14.493 22.517 23.456 28.391
Total Exp, exc Bank restructuring & net lending 31.549 34.063 46.810 63.508 56.152
Total Exp, exc Bank restructuring, net lending and interest payments
30.228 32.815 45.430 61.270 54.875
Interest on public debt 0.324 0.109 0.477 1.274 1.319 1.321 1.248 1.380 2.238 1.277
Total Expenditure in PARPA priority sectors 6.895 10.795 13.774 15.323 18.197 19.033 21.756 29.575 41.719 33.734
Percent of GDP, 13.3 19.0 19.4 18.0 17.7 14.3 13.8 15.3 19.0 16.7
Percent of total expenditure, exc. Bank restructuring and interest payments,
55.2 74.5 61.2 65.3 64.1
Percent of total expenditure, exc. Bank restructuring, net lending and interest payments,
63.0 66.3 65.1 68.1 61.5
Total Expenditure in PARPA Sectors 6.895 10.795 13.774 15.324 18.196 19.033 21.979 31.540 41.574 33.742
Education, o.w. 1.795 3.141 4.874 4.217 5.264 6.317 6.542 9.109 12.508 12.145
Primary 1.410 2.727 3.875 3.608 4.291 5.325 5.572 7.556 12.407
Postsecondary 0.384 0.414 1.000 0.610 0.973 0.992 0.965
Health 1.493 2.038 2.08 2.953 3.866 3.183 4.159 6.628 8.011 7.351
HIV/AIDs 0 0.006 0.11 0.188 0.061 0.123 0.217 0.665 0.850
Infrastructure 1.481 2.49 3.643 3.861 3.257 3.982 6.131 7.435 11.440 7.538
Roads 1.881 1.86 2.083 3.112 4.620 4.641 7.361
Sanitation/ PW 1.763 2.001 1.174 0.87 1.483 2.742 2.730
ARD 0.583 0.994 0.707 1.243 1.883 1.322 1.290 1.522 3.774 1.928
Governance, o. w 0.991 1.244 1.615 1.9 2.411 2.936 2.913 5.671 4.021 4.262
Security and PO 0.722 0.843 1.048 1.267 1.367 1.753 1.453 1.943 2.597
Governance 0.006 0.142 0.244 0.235 0.553 0.483 0.601 2.719 0.343
Judicial 0.209 0.258 0.323 0.399 0.492 0.699 0.859 1.009 1.081
Other, o.w 0.552 0.882 0.745 0.962 1.454 1.170 0.727 0.510 0.970 0.518
Social actions 0.069 0.192 0.196 0.211 0.308 0.201 0.209 0.329 0.527
Labor/Employment 0.055 0.056 0.074 0.117 0.126 0.123 0.108 0.108 0.181
Minerals/Energy 0.428 0.634 0.475 0.633 1.020 0.846 0.407
Nominal GDP 51.913 56.917 71.135 85.206 102.753 133.319 157.345 193.322 220.150 201.436
Percent of GDP
Total Expenditure in PARPA Sectors 13.3 19.0 19.4 18.0 17.7 14.3 21.4 16.3 18.9 15.3
Education, o.w. 3.5 5.5 6.9 4.9 5.1 4.7 4.2 4.7 5.7 6.0
Sources: Government of Mozambique, World Bank
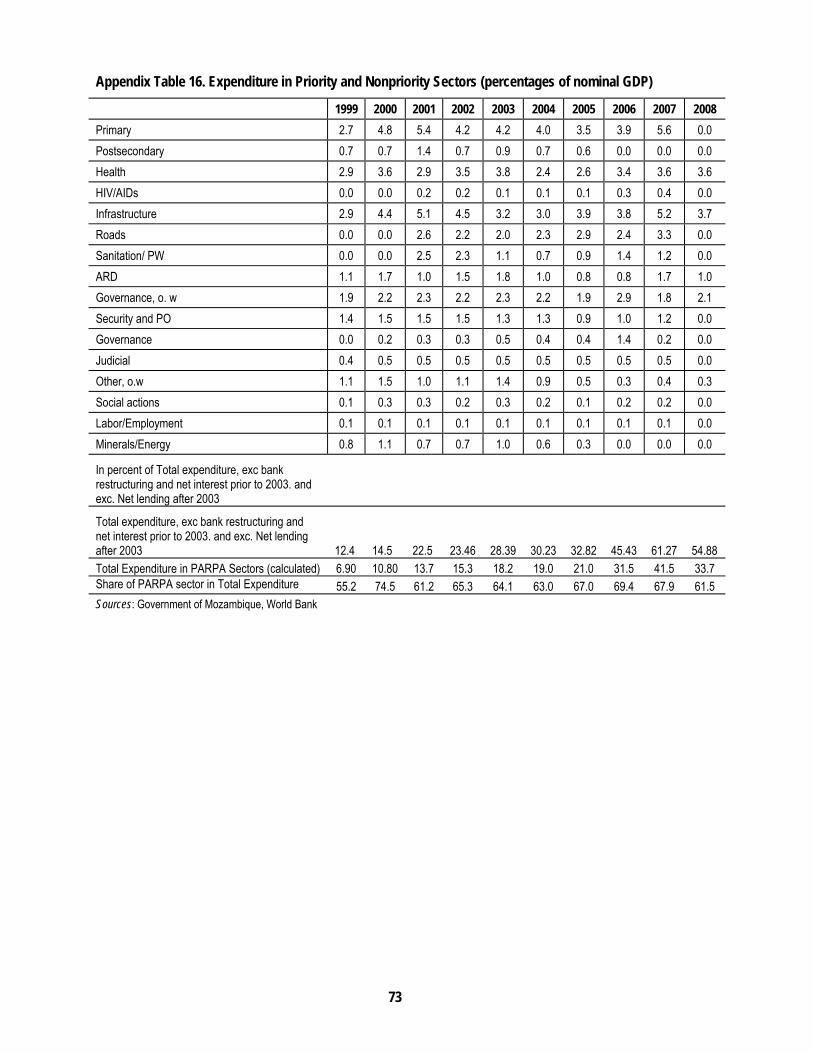
73
Appendix Table 16. Expenditure in Priority and Nonpriority Sectors (percentages of nominal GDP)
1999 2000 2001 2002 2003 2004 2005 2006 2007 2008
Primary 2.7 4.8 5.4 4.2 4.2 4.0 3.5 3.9 5.6 0.0
Postsecondary 0.7 0.7 1.4 0.7 0.9 0.7 0.6 0.0 0.0 0.0
Health 2.9 3.6 2.9 3.5 3.8 2.4 2.6 3.4 3.6 3.6
HIV/AIDs 0.0 0.0 0.2 0.2 0.1 0.1 0.1 0.3 0.4 0.0
Infrastructure 2.9 4.4 5.1 4.5 3.2 3.0 3.9 3.8 5.2 3.7
Roads 0.0 0.0 2.6 2.2 2.0 2.3 2.9 2.4 3.3 0.0
Sanitation/ PW 0.0 0.0 2.5 2.3 1.1 0.7 0.9 1.4 1.2 0.0
ARD 1.1 1.7 1.0 1.5 1.8 1.0 0.8 0.8 1.7 1.0
Governance, o. w 1.9 2.2 2.3 2.2 2.3 2.2 1.9 2.9 1.8 2.1
Security and PO 1.4 1.5 1.5 1.5 1.3 1.3 0.9 1.0 1.2 0.0
Governance 0.0 0.2 0.3 0.3 0.5 0.4 0.4 1.4 0.2 0.0
Judicial 0.4 0.5 0.5 0.5 0.5 0.5 0.5 0.5 0.5 0.0
Other, o.w 1.1 1.5 1.0 1.1 1.4 0.9 0.5 0.3 0.4 0.3
Social actions 0.1 0.3 0.3 0.2 0.3 0.2 0.1 0.2 0.2 0.0
Labor/Employment 0.1 0.1 0.1 0.1 0.1 0.1 0.1 0.1 0.1 0.0
Minerals/Energy 0.8 1.1 0.7 0.7 1.0 0.6 0.3 0.0 0.0 0.0
In percent of Total expenditure, exc bank restructuring and net interest prior to 2003. and exc. Net lending after 2003
Total expenditure, exc bank restructuring and net interest prior to 2003. and exc. Net lending after 2003 12.4 14.5 22.5 23.46 28.39 30.23 32.82 45.43 61.27 54.88 Total Expenditure in PARPA Sectors (calculated) 6.90 10.80 13.7 15.3 18.2 19.0 21.0 31.5 41.5 33.7 Share of PARPA sector in Total Expenditure 55.2 74.5 61.2 65.3 64.1 63.0 67.0 69.4 67.9 61.5 Sources: Government of Mozambique, World Bank

74
Appendix Table 17. PEFA Summary Indicators 2006
A. PFM OUT-TURNS: Credibility of the Budget
PI-1 Aggregate expenditure out-turn compared to original approved budget B
PI-2 Composition of expenditure out-turn compared to original approved budget C
PI-3 Aggregate revenue out-turn compared to original approved budget C
PI-4 Stock and monitoring of expenditure payment arrears B+
B: KEY CROSS-CUTTING ISSUES: Comprehensiveness and Transparency
PI-5 Classification of the Budget B
PI-6 Comprehensiveness of information included in budget documentation B
PI-7 Extent of unreported government operations C+
PI-8 Transparency of inter-governmental fiscal operations C+
PI-9 Oversight of aggregate fiscal risk from public sector entities D+
PI-10 Public access to key fiscal information B
C: BUDGET CYCLE
C(i) Policy-based Budgeting
PI-11 Orderliness and participation in the annual budget process B+
PI-12 Multi-year perspective in fiscal planning, expenditure policy and budgeting C+
C(ii) Predictability and Control in Budget Execution
PI-13 Transparency of tax-payers’ obligations and liabilities B+
PI-14 Effectiveness of measures for tax-payer registration and tax assessment B
PI-15 Effectiveness in collection of tax payments D+
PI-16 Predictability in the availability of funds for commitment of expenditures C+
PI-17 Recording and management of cash balances, debt and guarantees A
PI-18 Effectiveness of payroll controls B
PI-19 Competition, value for money and controls in procurement B
PI-20 Effectiveness of internal controls for non-salary expenditure B
PI-21 Effectiveness of internal audit B
C(iii) Accounting, Recording and Reporting
PI-22 Timeliness and regularity of accounts reconciliation B+
PI-23 Availability of information on resources received by service delivery units D
PI-24 Quality and timeliness of in-year budget reports C+
PI-25 Quality and timeliness of annual financial statements C+
C(iv) External Scrutiny and Audit
PI-26 Scope, nature and follow-up of External Audit D+
PI-27 Legislative scrutiny of the annual budget law B+
PI-28 Legislative scrutiny of external audit reports C+
D. DONOR PRACTICES
D-1 Predictability of Direct Budget Support A
D-2 Financial information provided by Donors for budgeting and reporting on project aid D+
D-3 Proportion of aid that is managed by use of national procedures D
Source: Government of Mozambique; World Bank

75
Appendix Table 18. Economic Indicators for Mozambique
Growth* 1991 1992 1993 1994 1995 1996 1997 1998 1999 2000 2001 2002 2003 2004 2005 2006 2007 Avg GDP growth (annual %) 4.90 .. 6.80 7.00 3.3 6.8 11.1 12.6 7.5 1.9 13.1 8.2 7.9 7.5 6.2 8.5 7.0 7.7 GNI per capita, Atlas method (current USD ) 180.0 150.0 140.0 130.0 140.0 150.0 170.0 200.0 220.0 210.0 210.0 210.0 230.0 270.0 310.0 340.0 195.3 GNI per capita, PPP (current international $) 520.0 460.0 490.0 510.0 520.0 560.0 630.0 690.0 740.0 750.0 830.0 940.0 1010.0 1080.0 1150.0 1220.0 741.3 GDP per capita growth (annual %) 2.4 -11.6 2.8 3.1 -0.1 3.7 8.2 10.0 5.2 -0.2 10.7 6.0 5.8 5.4 4.3 6.6 4.8 Agriculture, value added (annual % growth) -4.0 -18.8 22.1 -1.4 14.8 8.9 8.5 6.8 5.6 -11.3 9.4 10.8 9.1 8.3 1.7 9.0 6.8 Industry, value added (annual % growth) 3.5 -5.2 -2.5 8.0 12.4 20.0 26.0 29.5 17.1 10.8 20.9 9.8 10.1 5.1 7.7 9.7 12.3 Services, etc., value added (annual % growth) 15.3 -5.6 -2.8 17.8 -6.9 2.9 6.0 9.8 1.3 6.0 13.6 5.7 4.6 8.8 8.9 7.8 5.6 Macroeconomic Indicators* Gross capital formation (% of GDP) 20.6 25.5 24.9 25.5 30.5 21.8 20.6 24.2 36.7 33.5 25.9 29.8 27.4 22.6 18.7 19.0 19.2 24.1 Public Investment 11.6 10.3 15.4 12.5 12.5 9.4 8.6 12.1 12.1 Private investment 25.1 23.2 10.5 17.3 14.9 13.2 10.1 6.9 7.1 Gross domestic savings (% of GDP) -4.1 -5.4 -9.4 -8.4 5.0 5.4 8.1 10.8 13.7 11.6 8.0 11.0 11.7 14.3 11.9 20.2 8.1 Inflation, consumer prices (annual %) 32.9 45.5 42.2 63.2 54.4 48.5 7.4 1.5 2.9 12.7 9.0 16.8 13.4 12.7 7.2 13.2 8.2 21.8
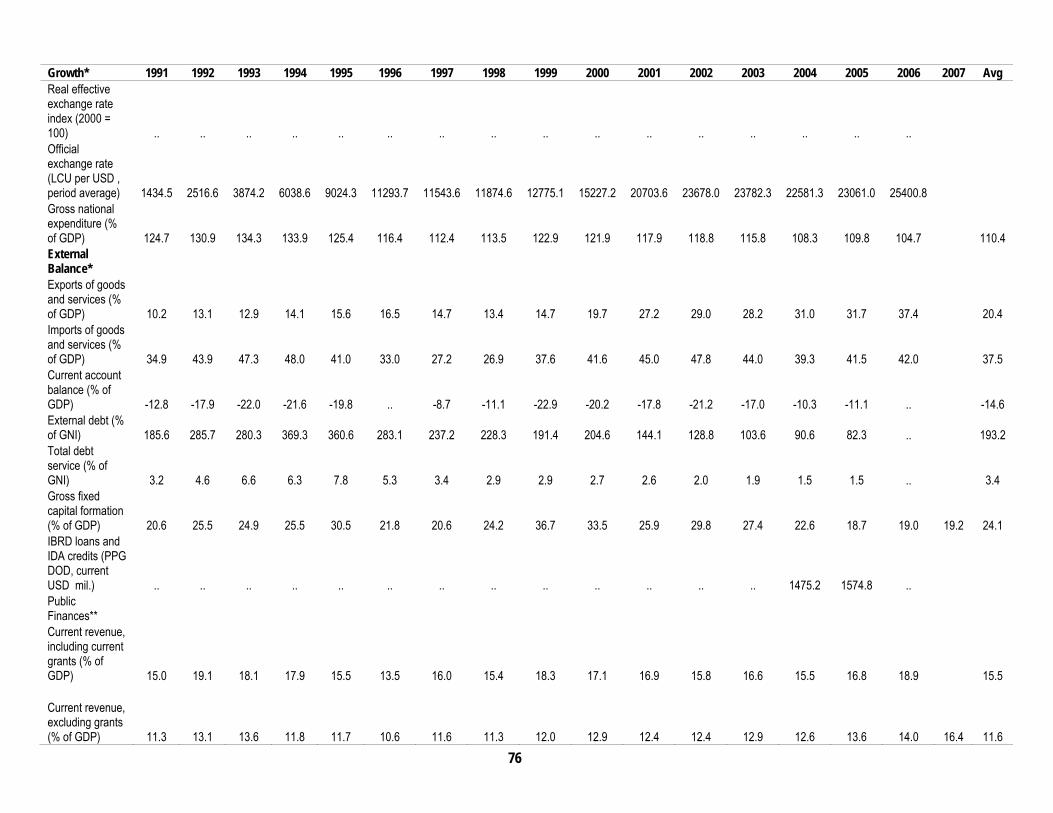
76
Growth* 1991 1992 1993 1994 1995 1996 1997 1998 1999 2000 2001 2002 2003 2004 2005 2006 2007 Avg Real effective exchange rate index (2000 = 100) .. .. .. .. .. .. .. .. .. .. .. .. .. .. .. .. Official exchange rate (LCU per USD , period average) 1434.5 2516.6 3874.2 6038.6 9024.3 11293.7 11543.6 11874.6 12775.1 15227.2 20703.6 23678.0 23782.3 22581.3 23061.0 25400.8 Gross national expenditure (% of GDP) 124.7 130.9 134.3 133.9 125.4 116.4 112.4 113.5 122.9 121.9 117.9 118.8 115.8 108.3 109.8 104.7 110.4 External Balance* Exports of goods and services (% of GDP) 10.2 13.1 12.9 14.1 15.6 16.5 14.7 13.4 14.7 19.7 27.2 29.0 28.2 31.0 31.7 37.4 20.4 Imports of goods and services (% of GDP) 34.9 43.9 47.3 48.0 41.0 33.0 27.2 26.9 37.6 41.6 45.0 47.8 44.0 39.3 41.5 42.0 37.5 Current account balance (% of GDP) -12.8 -17.9 -22.0 -21.6 -19.8 .. -8.7 -11.1 -22.9 -20.2 -17.8 -21.2 -17.0 -10.3 -11.1 .. -14.6 External debt (% of GNI) 185.6 285.7 280.3 369.3 360.6 283.1 237.2 228.3 191.4 204.6 144.1 128.8 103.6 90.6 82.3 .. 193.2 Total debt service (% of GNI) 3.2 4.6 6.6 6.3 7.8 5.3 3.4 2.9 2.9 2.7 2.6 2.0 1.9 1.5 1.5 .. 3.4 Gross fixed capital formation (% of GDP) 20.6 25.5 24.9 25.5 30.5 21.8 20.6 24.2 36.7 33.5 25.9 29.8 27.4 22.6 18.7 19.0 19.2 24.1 IBRD loans and IDA credits (PPG DOD, current USD mil.) .. .. .. .. .. .. .. .. .. .. .. .. .. 1475.2 1574.8 .. Public Finances** Current revenue, including current grants (% of GDP) 15.0 19.1 18.1 17.9 15.5 13.5 16.0 15.4 18.3 17.1 16.9 15.8 16.6 15.5 16.8 18.9 15.5 Current revenue, excluding grants (% of GDP) 11.3 13.1 13.6 11.8 11.7 10.6 11.6 11.3 12.0 12.9 12.4 12.4 12.9 12.6 13.6 14.0 16.4 11.6
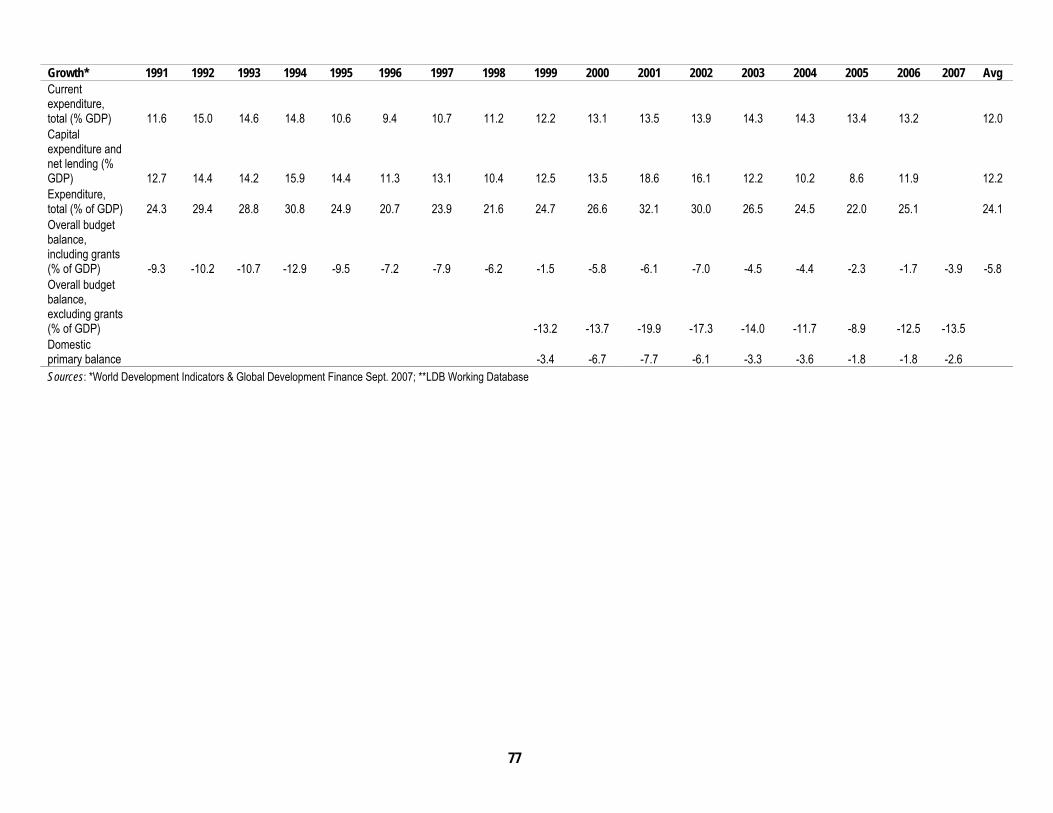
77
Growth* 1991 1992 1993 1994 1995 1996 1997 1998 1999 2000 2001 2002 2003 2004 2005 2006 2007 Avg Current expenditure, total (% GDP) 11.6 15.0 14.6 14.8 10.6 9.4 10.7 11.2 12.2 13.1 13.5 13.9 14.3 14.3 13.4 13.2 12.0 Capital expenditure and net lending (% GDP) 12.7 14.4 14.2 15.9 14.4 11.3 13.1 10.4 12.5 13.5 18.6 16.1 12.2 10.2 8.6 11.9 12.2 Expenditure, total (% of GDP) 24.3 29.4 28.8 30.8 24.9 20.7 23.9 21.6 24.7 26.6 32.1 30.0 26.5 24.5 22.0 25.1 24.1 Overall budget balance, including grants (% of GDP) -9.3 -10.2 -10.7 -12.9 -9.5 -7.2 -7.9 -6.2 -1.5 -5.8 -6.1 -7.0 -4.5 -4.4 -2.3 -1.7 -3.9 -5.8 Overall budget balance, excluding grants (% of GDP) -13.2 -13.7 -19.9 -17.3 -14.0 -11.7 -8.9 -12.5 -13.5 Domestic primary balance -3.4 -6.7 -7.7 -6.1 -3.3 -3.6 -1.8 -1.8 -2.6 Sources: *World Development Indicators & Global Development Finance Sept. 2007; **LDB Working Database

78