IEG Working Paper 2010/13 - World Banklnweb90.worldbank.org/oed/oeddoclib.nsf/DocUNID... · IEG...
51
Transcript of IEG Working Paper 2010/13 - World Banklnweb90.worldbank.org/oed/oeddoclib.nsf/DocUNID... · IEG...


IEG Working Paper 2010/13 Have Country Assistance Strategies Capitalized on Intersectoral Linkages to Improve Health Outcomes Among the Poor?
Shampa Sinha Judith Gaubatz
2010 The World Bank
Washington, D.C.
© 2010 Independent Evaluation Group, The World Bank Group 1818 H St., NW Washington, DC 20433
IEG: Improving Development Results Through Excellence in Evaluation
The Independent Evaluation Group is an independent unit within the World Bank Group; it reports directly to the Bank’s Board of Executive Directors. IEG assesses what works, and what does not; how a borrower plans to run and maintain a project; and the lasting contribution of the Bank to a country’s overall development. The goals of evaluation are to learn from experience, to provide an objective basis for assessing the results of the Bank’s work, and to provide accountability in the achievement of its objectives. It also improves Bank work by identifying and disseminating the lessons learned from experience and by framing recommendations drawn from evaluation findings. IEG Working Papers are an informal series to disseminate the findings of work in progress to encourage the exchange of ideas about development effectiveness through evaluation. The findings, interpretations, and conclusions expressed here are those of the author(s) and do not necessarily reflect the views of the Board of Executive Directors of the World Bank or the governments they represent, or IEG management. The World Bank cannot guarantee the accuracy of the data included in this work. The boundaries, colors, denominations, and other information shown on any map in this work do not imply on the part of the World Bank any judgment of the legal status of any territory or the endorsement or acceptance of such boundaries. ISBN-10: 1-60244-157-X ISBN-13: 978-1-60244-157-6 Contact: IEG Communication, Learning and Strategies (IEGCS) e-mail: [email protected] Telephone: 202-458-4497 Facsimile: 202-522-3125 http:/www.worldbank.org/ieg


iii
Contents
ABBREVIATIONS ............................................................................................................................... v
ACKNOWLEDGEMENTS ................................................................................................................ vi
SUMMARY ........................................................................................................................................ vii
1. INTRODUCTION .......................................................................................................................... 1
2. METHODOLOGY ........................................................ ERROR! BOOKMARK NOT DEFINED.
3. FINDINGS ...................................................................................................................................... 5
IS THE HNP SECTOR IDENTIFIED AS A PRIORITY IN THE CAS? .................................................... 5
Focus on HNP Status.................................................................................................................... 6 Focus on the Poor ......................................................................................................................... 8 HNP Outcome Targets ................................................................................................................. 9
IS THE CAS DISCUSSION OF HNP PRIORITIES INFORMED BY PRIOR ANALYTIC WORK? ......... 12
PROPOSED BANK HNP ACTIVITIES ............................................................................................... 13
MULTISECTORAL APPROACHES TO IMPROVING HNP OUTCOMES ............................................. 15
Does the CAS Acknowledge the Contribution of Other sectors to HNP Outcomes? ........... 15 Does the CAS Acknowledge the Contribution of HNP to Outcomes in Other Sectors? ...... 16 Does the CAS Propose a Multisectoral Lending Strategy to Improve HNP Outcomes? ..... 18 Features of Parallel Lending for HNP ...................................................................................... 22
CAS IMPLEMENTATION: HNP OUTCOMES AND MULTISECTORAL APPROACHES ..................... 23
Health Outcomes ........................................................................................................................ 23 Multisectoral Approaches .......................................................................................................... 24
4. CONCLUSIONS ............................................................ ERROR! BOOKMARK NOT DEFINED.
REFERENCES .................................................................................................................................... 27
APPENDIX A: TABLE OF COUNTRY ASSISTANCE STRATEGIES REVIEWED ... ERROR! BOOKMARK NOT DEFINED.
APPENDIX B: WEIGHTED RESULTS .......................................................................................... 33
APPENDIX C: TABLES BY INCOME GROUP ........................................................................... 34
APPENDIX D: TABLES BY REGION ........................................................................................... 37
iv
Figures
Figure 3.1: Share of CASs that Prioritized HNP ...................................................................... 6 Figure 3.2: Prioritization of HNP status, by Country Income Level and Region ..................... 8 Figure 3.3: Focus on the Poor by Country Income Level and Region ..................................... 9 Figure 3.4: Setting of HNP Status Targets, by Country Income and Region ......................... 10 Figure 3.5: Setting of HNP Targets for the Poor, by Country Income and Region ................ 12 Figure 3.6: Prior Analytic Work, by Country Income and Region ......................................... 13 Figure 3.7: Proposed HNP Lending and Analytic Work, by Country Income and Region .... 14 Figure 3.8: CAS Acknowledgement of Other Sectors’ Contributions to HNP Outcomes ..... 16 Figure3.9: CAS Acknowledgement of the Contribution of HNP Outcomes to Other Development Objectives, by Country Income and Region .................................................... 17 Figure 3.10: Percent of CASs with Multisectoral Lending Strategies, total and HIV-related, by Country Income and Region .............................................................................................. 20
Tables
Table 1.1: Potential for Intersectoral Synergies to Achieve the Millennium Development Goals for Health and Nutrition ................................................................................................. 2 Table 2.1: Distribution of Country Assistance Strategies issued in FY97-06, by Region ........ 3 Table 3.1: Prioritization of the HNP Sector by FY ................................................................... 5 Table 3.2: Prioritization of HNP Status, by FY ........................................................................ 7 Table 3.3: Focus on the Poor, by FY of Approval .................................................................... 9 Table 3.4: Setting of HNP Status Targets, by FY of Approval .............................................. 10 Table 3.5: Setting of HNP Targets for the Poor, by FY of Approval ..................................... 11 Table 3.6: Prior Analytic Work, by FY of Approval .............................................................. 12 Table 3.7: Proposed HNP Activities, by FY of Approval ...................................................... 13 Table 3.8: Prior vs. Proposed Analytic work, if Prioritized HNP Sector (N=112) ................ 14 Table 3.9: Trend in CAS Acknowledgement of Other Sectors’ Aontributions to HNP Outcomes, by FY of Approval ................................................................................................ 15 Table 3.10: Trend in CAS Acknowledgment of Contribution of HNP Outcomes to Other Development Objectives, by FY of Approval ........................................................................ 17 Table 3.11: Multisectoral Lending Atrategies for HNP Outcomes, by FY of Approval ....... 18 Table 3.12: Trends in non-HNP Sectors Selected for Parallel Lending, by FY of Approval21 Table 3.13: Non-HNP Sectors Selected for Parallel Lending, by Income ............................. 22 Table 3.14: Non-HNP Sectors Selected for Parallel Lending, by Region ............................. 22 Table 3.15: Trends in Parallel Lending, by FY of Approval .................................................. 23 Table 3.16: Aspects of Parallel Lending, by Income ............................................................. 23 Table 3.17: Trends in CAS Implementation: HNP Outcomes ................................................ 24 Table 3.18: Implementation of Multisectoral Approaches ..................................................... 24

v
ABBREVIATIONS
AAA Analytical and Advisory Activities AFR Africa region AIDS Acquired immune deficiency syndrome ARDE Annual Review of Development Effectiveness CAS Country Assistance Strategy CASCR Country Assistance Strategy Completion Report DPL Development policy lending EAP East Asia and Pacific region ECA Eastern Europe and Central Asia region ESW Economic and Sector Work FY Fiscal Year HIV Human immunodeficiency virus HNP Health, nutrition, and population IDA International Development Association IEG Independent Evaluation Group IMR Infant mortality rate LCR Latin America and Caribbean region LIC Low-income country LMIC Lower middle-income country MDG Millennium Development Goal MNA Middle East and North Africa region MMR Maternal mortality rate OED Operations Evaluation Department (now IEG) PPAR Project Performance Assessment Report PRSP Poverty Reduction Strategy Paper SAR South Asia Region TA Technical assistance UMIC Upper middle-income country WSS Water supply and sanitation

vi
ACKNOWLEDGEMENTS
This paper was prepared as background for the IEG evaluation of the World Bank’s support for health, nutrition, and population (HNP). The authors would like to thank Martha Ainsworth for her invaluable guidance and contribution, Christoph Kurowski (peer reviewer), Arup Banerji, Monika Huppi, and Victoria Monchuk for their insightful feedback, Kavita Mathur for her very useful inputs, the HNP evaluation team for their feedback, and Marie-Jeanne Ndiaye for her excellent support in formatting and graphics. The findings, interpretations, and conclusions expressed in this paper are entirely those of the authors and do not represent the views of the World Bank, its Executive Directors, or the countries they represent.
vii
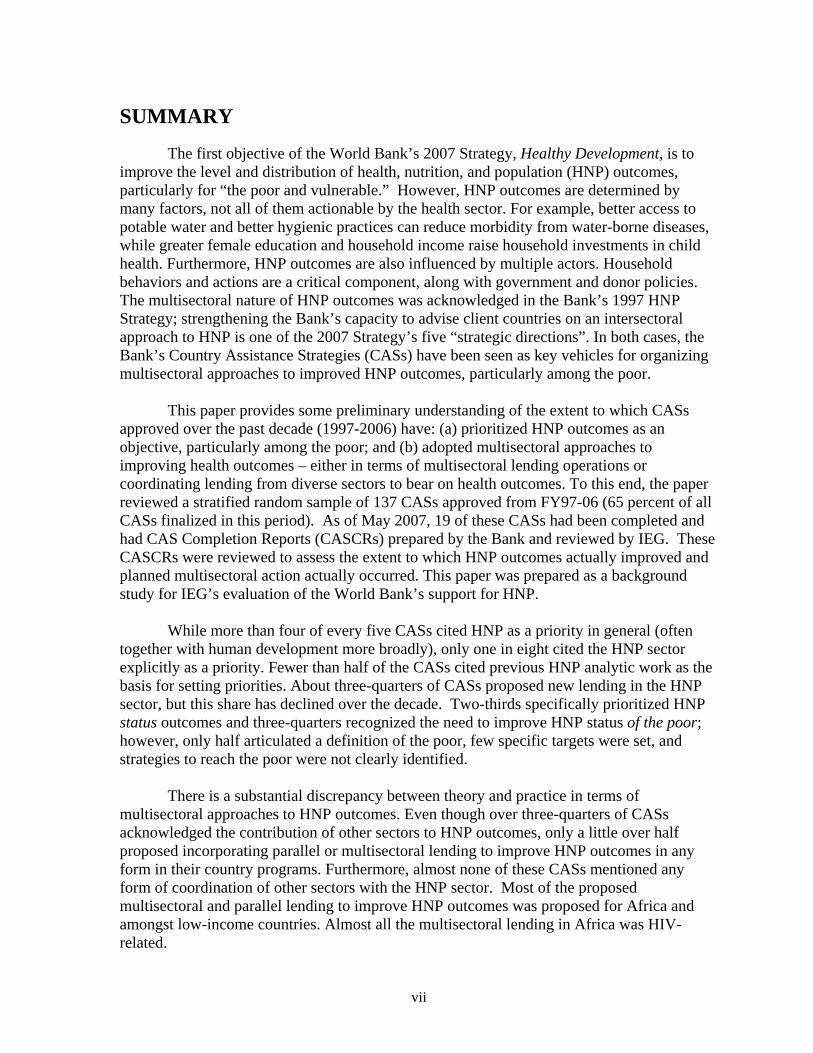
SUMMARY
The first objective of the World Bank’s 2007 Strategy, Healthy Development, is to improve the level and distribution of health, nutrition, and population (HNP) outcomes, particularly for “the poor and vulnerable.” However, HNP outcomes are determined by many factors, not all of them actionable by the health sector. For example, better access to potable water and better hygienic practices can reduce morbidity from water-borne diseases, while greater female education and household income raise household investments in child health. Furthermore, HNP outcomes are also influenced by multiple actors. Household behaviors and actions are a critical component, along with government and donor policies. The multisectoral nature of HNP outcomes was acknowledged in the Bank’s 1997 HNP Strategy; strengthening the Bank’s capacity to advise client countries on an intersectoral approach to HNP is one of the 2007 Strategy’s five “strategic directions”. In both cases, the Bank’s Country Assistance Strategies (CASs) have been seen as key vehicles for organizing multisectoral approaches to improved HNP outcomes, particularly among the poor.
This paper provides some preliminary understanding of the extent to which CASs
approved over the past decade (1997-2006) have: (a) prioritized HNP outcomes as an objective, particularly among the poor; and (b) adopted multisectoral approaches to improving health outcomes – either in terms of multisectoral lending operations or coordinating lending from diverse sectors to bear on health outcomes. To this end, the paper reviewed a stratified random sample of 137 CASs approved from FY97-06 (65 percent of all CASs finalized in this period). As of May 2007, 19 of these CASs had been completed and had CAS Completion Reports (CASCRs) prepared by the Bank and reviewed by IEG. These CASCRs were reviewed to assess the extent to which HNP outcomes actually improved and planned multisectoral action actually occurred. This paper was prepared as a background study for IEG’s evaluation of the World Bank’s support for HNP.
While more than four of every five CASs cited HNP as a priority in general (often
together with human development more broadly), only one in eight cited the HNP sector explicitly as a priority. Fewer than half of the CASs cited previous HNP analytic work as the basis for setting priorities. About three-quarters of CASs proposed new lending in the HNP sector, but this share has declined over the decade. Two-thirds specifically prioritized HNP status outcomes and three-quarters recognized the need to improve HNP status of the poor; however, only half articulated a definition of the poor, few specific targets were set, and strategies to reach the poor were not clearly identified.
There is a substantial discrepancy between theory and practice in terms of multisectoral approaches to HNP outcomes. Even though over three-quarters of CASs acknowledged the contribution of other sectors to HNP outcomes, only a little over half proposed incorporating parallel or multisectoral lending to improve HNP outcomes in any form in their country programs. Furthermore, almost none of these CASs mentioned any form of coordination of other sectors with the HNP sector. Most of the proposed multisectoral and parallel lending to improve HNP outcomes was proposed for Africa and amongst low-income countries. Almost all the multisectoral lending in Africa was HIV-related.
viii
About a third of the completed CASs with multisectoral HNP lending strategies fully
implemented them in the way originally envisaged, a third implemented them partially, and a third did not implement them at all. However, even in the cases where the proposed lending was undertaken, the health component of this lending was often omitted or the health impacts of the lending were not tracked.
These findings suggest three areas where CAS performance with respect to the pro-poor focus of HNP actions and multisectoral approaches can be improved:
CASs need to be more specific in terms of how HNP outcomes among the poor will be addressed in implementation and how they will be measured and tracked – both in HNP and other sector operations aimed to improve HNP outcomes.
Analytic work needs to be launched to understand better the contribution of other sectors to HNP outcomes and the value added of multisectoral approaches in different contexts.
The institutional incentives in the Bank and countries that are inhibiting greater cross-sectoral collaboration, focus, and results on HNP outcomes need to be better understood.

1
1. Introduction
1.1 The first objective of the World Bank’s 2007 Strategy, Healthy Development, is to improve the level and distribution of health, nutrition, and population (HNP) outcomes, particularly for “the poor and vulnerable” (World Bank 2007 ). This is consistent with the main objective of the previous HNP strategy, issued a decade earlier, to improve HNP outcomes among the poor. However, HNP outcomes are determined by many factors, not all of them actionable by the health sector (Table 1.1). For example, better access to potable water and better hygienic practices can reduce morbidity from water-borne diseases, while greater female education and household income raise household investments in child health. Furthermore, health outcomes are also influenced by multiple actors. Household behaviors and actions are a critical component, along with government and donor policies (Filmer 2003). The multisectoral nature of health outcomes was acknowledged in the 1997 Health Strategy and the Country Assistance Strategy (CAS) was proposed as the vehicle for coordinating the contributions of different sectors to HNP outcomes.1 The 1999 evaluation of the Bank’s health, nutrition, and population (HNP) support by the Independent Evaluation Group (IEG) found that “Bank-supported programs have not placed adequate emphasis on… the intersectoral dimensions of health” and recommended that the Bank’s Human Development Network and Regional Vice Presidents identify several key areas for improving intersectoral collaboration within the Bank (Johnston and Stout 1999, p. 31).2 IEG’s 2006 Annual Review of Development Effectiveness (ARDE) found evidence that cross-sectoral synergies are being under-utilized by Bank operations at the expense of obtaining stronger results.
1.2 However, there are institutional and other issues that make multisectoral action difficult. Obstacles to designing such interventions are present on both the donor and country fronts. They include factors such as the lack of sufficient incentives for operational staff and government ministries to exchange information and initiate collaborative efforts. For instance, budgetary allocations are usually made on the basis of sectoral and ministerial portfolios which often discourage staff from exploiting cross-sectoral linkages. The record of truly multisectoral operations (though not systematically evaluated) appears to be problematic. The 2006 ARDE found only 9 percent of Bank staff surveyed were satisfied with coordination across sectors in cases where multisectoral teams were created (IEG 2006, pp. 27-28).
1.3 Nevertheless, achieving the Millennium Development Goals (MDGs) in health will depend on seeking strategic complementarity of investments in different domains to improve HNP outcomes (Table 1.1). The greater need for intersectoral collaboration is explicitly recognized in the Bank’s 2007 HNP strategy, and strengthening the Bank’s capacity to advise client countries on an intersectoral approach to HNP results is one of the five “strategic
1 According to the 1997 strategy, the CAS “provides an opportunity to highlight stubborn cross-sectoral issues and to establish critical links between the HNP sector and a country’s poverty and fiscal agendas”.(World Bank 1997, p.12). 2 IEG/World Bank was formerly known as the Operations Evaluation Department (OED).

2
directions” to be launched. From the perspective of the Bank’s operations, there are at least two distinct approaches:
a) multisectoral lending operations, in which inputs from different sectors are jointly implemented under a single management structure (or occasionally under a multiple management structure, but still in a single operation) for a specific objective; and
b) strategic use of complementary lending in different sectors to maximize impact on a common objective, like health outcomes.
1.4 The 2007 HNP strategy proposes a new analytical tool called the Multisectoral Constraints Assessment for Health Outcomes tool, to help country teams identify the investments and sector work most likely to result in improved health outcomes, especially among the poor, in the preparation of Country Assistance Strategies (World Bank 2007, Annex E). Such analysis might result in either multisectoral operations or strategically complementary sectoral lending. The specifics of this new analytic instrument have yet to be elaborated. To date, there has been no systematic review of the extent to which the Bank’s CAS’s over the past decade have already addressed HNP in a multisectoral way, and the lessons learned.
Table 1.1: Potential for Intersectoral Synergies to Achieve the Millennium Development Goals for Health and Nutrition
Millennium Development Goal Target Multisectoral Inputs Country Examples Key Sectors
Reduce maternal mortality
Improve access to emergency obstetric care
Availability of transport, roads, and referral facilities
Bangladesh, Tanzania, Vietnam
Transport, road infrastructure, health
Reduce indoor air pollution Improved cooking practices, fuel, and ventilation
China, Guatemala, India, Kenya
Energy, housing, health
Reduce Child mortality Reduce diarrheal diseases in children through hand-washing, use of latrines, and proper disposal of young children’s stools
Improved hand-washing practices, using soap and plenty of water
Costa Rica, El Salvador, Guatemala, Ghana, India, Nepal, Peru, Senegal
Wáter and sanitation, health, private sector (soap manufacturers)
Reduce indoor air pollution Improved fuel, ventilation, and childplay practices
China, Guatemala, India, Kenya, Mongolia, Nicaragua
Energy, housing, prívate health, private sector (improved stove production)
Reduce hunger and improve nutrition
Regulate food prices, raise women’s income, and promote dietary diversity and food security at the household level
Improved agricultural practices, tariffs, and trade; reduced women’s workload; better gender relations in intrahousehold decision-making
Bangladesh, India, Kenya, Tanzania, Vietnam
Agriculture, rural development, gender, trade
Source: World Bank 2004. 1.5 This study looks at the extent to which CASs prioritized HNP and specifically HNP status among the poor over the decade 1997-2006. The first part of the paper explores this question. Second, the study assesses the extent to which these CASs adopted multisectoral strategies to improve HNP outcomes – either in terms of multisectoral lending operations or coordinating lending from diverse sectors to bear on health outcomes. For CASs that have been completed, IEG CAS Completion Reports (CASCRs) are reviewed to assess the extent

3
to which health outcomes improved, especially among the poor, and the extent to which planned multisectoral action actually occurred.3 This paper was background for the 2009 IEG evaluation of the World Bank’s support for HNP.
1.6 The next section of the paper presents the methodology, review questions, and the sample of CASs and CASCRs reviewed. The subsequent two sections assess, respectively, whether HNP status was prioritized in the CASs and to what extent the CASs proposed multisectoral lending and non-lending activities. The penultimate section reviews the findings from CASCRs on the extent to which the multisectoral approaches proposed in the CASs were actually implemented, and the final section summarizes the findings.
2.1 This study relies on a desk review of a sample of Country Assistance Strategies approved between fiscal years (FY) 1997-2006.4 Over this period, a total of 211 CASs were issued for 42 low-, 44 lower-middle and 24 upper-middle income countries, distributed regionally as in Table 2.1.5
Table 1.2: Distribution of Country Assistance Strategies issued in FY97-06, by Region and Year
Region FY97-01 FY02-06 Total Sample Sub-Saharan Africa 29 26 55 31 Eastern Europe and Central Asia 31 29 60 29 East Asia & Pacific 12 11 23 23 Latin America and Caribbean 20 20 40 21 Middle-East and North Africa 9 10 19 19 South Asia 7 7 14 14 Total 108 103 211 137 Source: World Bank data.
2.2 In light of the large number of countries in three regions, namely Sub-Saharan Africa (AFR), Latin America and the Caribbean (LCR) and Eastern Europe and Central Asia (ECA), a review of all CASs was not possible given resource constraints, hence the study reviewed a stratified sample of CASs that includes: (a) all CASs for the regions with fewer countries namely, East Asia and the Pacific (EAP), the Middle East and North Africa (MNA) and South Asia (SAR); and (b) a random sample consisting of roughly half of all CASs for ECA, LCR and AFR. Tables presenting results by region are self-weighted; weighted results for the main variables for the whole sample, the two time periods, and by country income group are presented in Annex 2. Detailed tables by country income level and by region are in Annexes 3 and 4, respectively.
3 This study does not assess the impact of these combined lending operations on health outcomes; this has been done in the context of field-based country case studies and Project Performance Assessment Reports (PPAR) in the course of the IEG evaluation of Bank support for HNP. Also, we do not presume that some sort of multisectoral action is necessarily warranted. Operations in other sectors may have health impacts, even if not implemented collaboratively and even without explicit HNP objectives. 4 Fiscal year (FY) 1997 ran from July 1, 1996-June 30, 1997. 5 A list of all of the CASs issued, by country and year, is in Annex 1.

4
2.3 The approved CASs were systematically reviewed to answer the following questions:
a) Is the HNP sector identified as a priority in the CAS? Is improving HNP status a specific priority? Were targets set? Does it prioritize HNP status or access among the poor? If so, how are the poor
to be targeted? Are targets set? What Bank-specific activities are proposed? (e.g., lending, analytic work)
b) Is the CAS discussion of HNP priorities informed by prior analytic work?
c) Does the CAS acknowledge the contribution of other sectors to HNP outcomes? If so, which other sectors? Does it acknowledge the contribution of HNP to outcomes in other sectors?
d) Does the CAS propose a multisectoral lending strategy to improve HNP outcomes (e.g., multisectoral lending, parallel lending by complementary sectors)? If multisectoral lending, is it in the form of an investment loan or development
policy lending (DPL)? If parallel lending, which sectors are deemed most relevant to contributing to
HNP outcomes?
e) In the event that the CAS does not adopt a multi-sectoral perspective on improving HNP outcomes, does it nevertheless propose activities in other sectors that are likely to have an impact on HNP outcomes?
2.4 As of May 2007, IEG had received and reviewed a total of 30 CAS Completion Reports (CASCR) since March 2003, when IEG formally launched the process. Nineteen of these completed and reviewed CASs were approved from FY97-06 and in the sample of approved CASs in Table 2.1. For completed CASs, the study consulted CASCRs to assess the extent to which HNP outcomes improved, especially among the poor, and the extent to which planned multi-sectoral activities occurred. As of May 21, 2007, only 19 CASs in our sample had been completed and had CASCRs available.
2.5 The findings of this paper are limited by the fact that they are based on a desk review of documents. As such, the paper aims only to investigate if the Bank implemented multisectoral approaches in HNP and whether it focused on the poor. It does not attempt to explain the reasons behind the findings. For a more contextual understanding of the paper’s findings this research would need to be supplemented by interviews with task managers and Country Directors.

5
3. Findings
Is the HNP Sector Identified as a Priority in the CAS?
3.1 For the purposes of this review, the HNP sector was considered to have been flagged as a “priority” in the CAS if HNP issues were identified as a key component of the Bank’s development strategy for a country. While some CASs are explicit in identifying the HNP sector as a priority sector (e.g., “five areas… were identified as subjects for special emphasis: health”6), others more generally point to a human development sector focus that implicitly includes health (e.g., ”support to… those under-funded sectors critical to achieving [Millennium Development Goals]”7). In either case, this was usually exemplified by a substantive discussion of HNP status issues in the main text of the CAS – especially in the discussion of the CAS objectives and strategy.
3.2 Most CAS explicitly or implicitly cited HNP as a priority sector.8 This was the case in more than four-fifths of CASs. The HNP sector was identified explicitly as a priority by only 13 percent of CASs but implicitly in another 69 percent (Table 3.1). There was no change in that share over the decade under review. Of those that did not prioritize the HNP sector, more than half nevertheless discussed HNP issues (but not health system issues, such as health sector finance or insurance reform).
Table 3.1: Prioritization of the HNP Sector by FY
Did the CAS mention HNP as a priority sector?
FY97-01 N = 76
FY02-06 N = 61
Total N = 137
No. (%) No. (%) No. (%) YES, of which: 62 (82) 50 (82) 112 (82) Explicit priority 9 (12) 9 (15) 18 (13) Implicit priority 53 (70) 41 (67) 94 (69) NO, of which: 14 (18) 11 (18) 25 (18) HNP issues other than health status mentioned
6
(8)
8
(13)
14
(10)
Source: IEG CAS review.
3.3 CASs in low-income countries (LICs) and Africa are more likely to cite HNP as a priority overall whether implicitly or explicitly, however HNP is most likely to be an explicit priority in upper-middle income countries and LCR (Figure 3.1).9 HNP was least likely to be cited as a priority, explicitly or implicitly, in MNA, and very unlikely to be explicitly cited in LMICs, ECA, and East Asia and Pacific.
6 Mexico CAS, April 2002. 7 China CAS, January 2003. 8 Any instance where the CAS specifically mentioned prioritizing HNP as one of the key pillars of its strategy was regarded as an “explicit” reference to HNP as a priority sector. Where the CAS did not mention HNP as a specific priority but prioritized human development or the expansion of coverage of basic social services, the CAS was regarded as implicitly prioritizing the HNP sector. 9 See also Appendix C, Table C.1, and Appendix D, Table D.1.

6
Figure 3.1: Share of CASs that Prioritized HNP
Source: IEG CAS review. FOCUS ON HNP STATUS
3.4 The review considered whether the CAS specifically identified HNP status (such as morbidity, mortality, fertility, nutritional status, prevalence or incidence of disease), as the objective, rather than other intermediate outcomes (such as vaccination rates, contraceptive use or access to health care), health sector outputs (such as number of nurses or facilities, new institutions), or inputs (such as health expenditures).
3.5 Most CASs prioritized improved HNP status. HNP status was cited as the priority in two-thirds of the CASs overall (Table 3.2). Of those that did not prioritize HNP status, almost one-quarter nevertheless prioritized other intermediate HNP outcomes. The share of CASs that prioritized health status declined slightly over time. The most common HNP indicators cited were the infant mortality rate (IMR), maternal mortality rate (MMR), and HIV prevalence rate. Of the types of indicators cited, health indicators were most frequently cited, including mortality indicators (cited 85 times) and disease-specific indicators (cited 43 times); population indicators were cited least (cited 10 times). In addition, five of the six most commonly cited indicators are directly related to the Millennium Development Goals (MDGs), with four of those being cited more frequently over time.
0
20
40
60
80
100
Low-income(n=51)
Lower-middleincome(n=60)
Upper-middleincome(n=26)
Africa(n=31)
EastAsia
(n=23)
ECA(n=29)
LCR(n=21)
MNA(n=19)
SouthAsia
(n=14)
Per
cent
Explicit priority Implicit priority
INCOME LEVEL REGION
90
78
73
94
8379
86
63
79

7
Table 3.2: Prioritization of HNP Status, by FY
Was HNP status prioritized?
FY97-01 N = 76
FY02-06 N = 61
Total N = 137
No. % No. % No. % YES 53 70 39 64 92 67 Specific HNP indicators: Mortality -Infant mortality rate --Maternal mortality rate -Under-5 mortality rate -Life expectancy
22 15 7 4
29 20 9 5
12 14 10 1
20 23 16 2
34 29 17 5
25 21 12 4
Disease-specific -HIV incidence or prevalence -TB incidence or fatality rate -STD incidence -Malaria incidence -“other” disease
9 5 1 3 1
12 7 1 4 1
14
5 2 0 3
23 8 3 0 5
23
10 3 3 4
17 7 2 2 3
Fertility -Total fertility rate -Crude birth rate -Population growth rate
6 0 1
8 0 1
2 1 0
3 2 0
8 1 1
6 1 1
Malnutrition -Child malnutrition
-Pregnant/nursing women or low birth weight
14 2
18 3
4
0
7 0
18
2
13 1
NO 23 30 22 36 45 33 Of which, intermediate HNP outcomes, HNP outputs or inputs were prioritized
4
5
6
10
10
7
Source: IEG CAS review.
3.6 HNP status was prioritized most often by CASs in low-income countries and in South Asia and Africa. Seventy-eight percent of low-income country CASs prioritized HNP status as did 93 percent of South Asian and 81 percent of African CASs (Figure 3.2). Of the health indicators, Africa, Latin America and the Caribbean, and South Asia were most likely to cite the IMR and MMR, with Africa also most frequently citing life expectancy. South Asia and Africa were most likely to cite HIV incidence or prevalence, with Europe and Central Asia most likely to cite TB incidence. Of the population indicators, South Asia was most likely to cite the total fertility rate. Of the nutrition indicators, Latin America, South Asia and Africa were most likely to cite stunting and wasting. 10 Low-income countries were much more likely than countries in the other income groups to cite mortality indicators, as well as HIV incidence or prevalence, the total fertility rate, and child malnutrition.11
10 See Appendix C, Table C.2. 11 See Appendix D, Table D.2.

8
Figure 3.2: Prioritization of HNP Status, by Country Income Level and Region
Source: IEG CAS review.
FOCUS ON THE POOR
3.7 The majority of CASs recognized the need to focus on HNP issues among the poor, particularly in low-income countries (Table 3.3). Almost three-quarters of CASs overall specifically referred to health issues among the poor, a proportion that increased slightly (70 to 79 percent) over the two time periods. However, only half articulated a definition of the “poor” and less than a quarter cited a method to target the poor. The proportion of CASs that had a focus on the poor was highest among low-income countries (82 percent, Figure 3.3).12 Regionally, East Asia and Pacific most often specified a focus among the poor (91 percent).13
12 See Appendix C, Table C.3. 13 See Appendix D, Table D.3.
78
65
50
81
48
66 67
53
93
0
20
40
60
80
100
Low-income(n=51)
Lowmiddle-income(n=60)
Uppermiddle-income(n=26)
Africa(n=31)
EastAsia
(n=23)
ECA(n=29)
LCR(n=21)
MNA(n=19)
SAR(n=14)
Pe
rce
nt
of
CA
Ss
REGIONINCOME LEVEL

9
Table 3.3: Focus on the Poor, by FY of Approval
Was there a focus on health among the poor?
FY97-01 N = 76
FY02-06 N = 61
Total N = 137
No. % No. % No. % YES 53 70 48 79 101 74 Of which, the poor were identified as:
Low income group Poor region Rural area Minority group
3 9 12 3
4
12 16 4
8 8 8 1
13 13 13 2
11 17 20 4
8
12 15 3
Of which, the poor were to be reached by: Health subsidies, vouchers or cash transfers Increase in services used by the poor Reduction in insurance or user fees Increase in govt. budget allocation to poor
areas
2 2 2
2
3 3 3 3
5 3 2 1
8 5 3 2
7 5 4 3
5 4 3 2
NO 23 30 13 21 36 26 Source: IEG CAS review.
Figure 3.3: Focus on the Poor by Country Income Level and Region
Source: IEG CAS review.
HNP OUTCOME TARGETS
3.8 The review also considered whether the CAS, in aiming to achieve HNP outcomes, set specific target values that were monitorable and attributable to the time period covered by the CAS, either in terms of average outcomes or outcomes specifically for the poor.
3.9 Only about a third of CASs overall set specific targets for HNP outcomes, and this has not changed over time (Table 3.4). In some cases, the CAS referred to Government or Poverty Reduction Strategy Paper (PRSP) targets instead of setting its own separate
82
73
58
74
91
6671
63
79
0
20
40
60
80
100
Low-income(n=51)
Lowmiddle-income(n=60)
Uppermiddle-income(n=26)
Africa(n=31)
EastAsia
(n=23)
ECA(n=29)
LCR(n=21)
MNA(n=19)
SAR(n=14)
Pe
rce
nt
of
CA
Ss
REGIONINCOME LEVEL
10
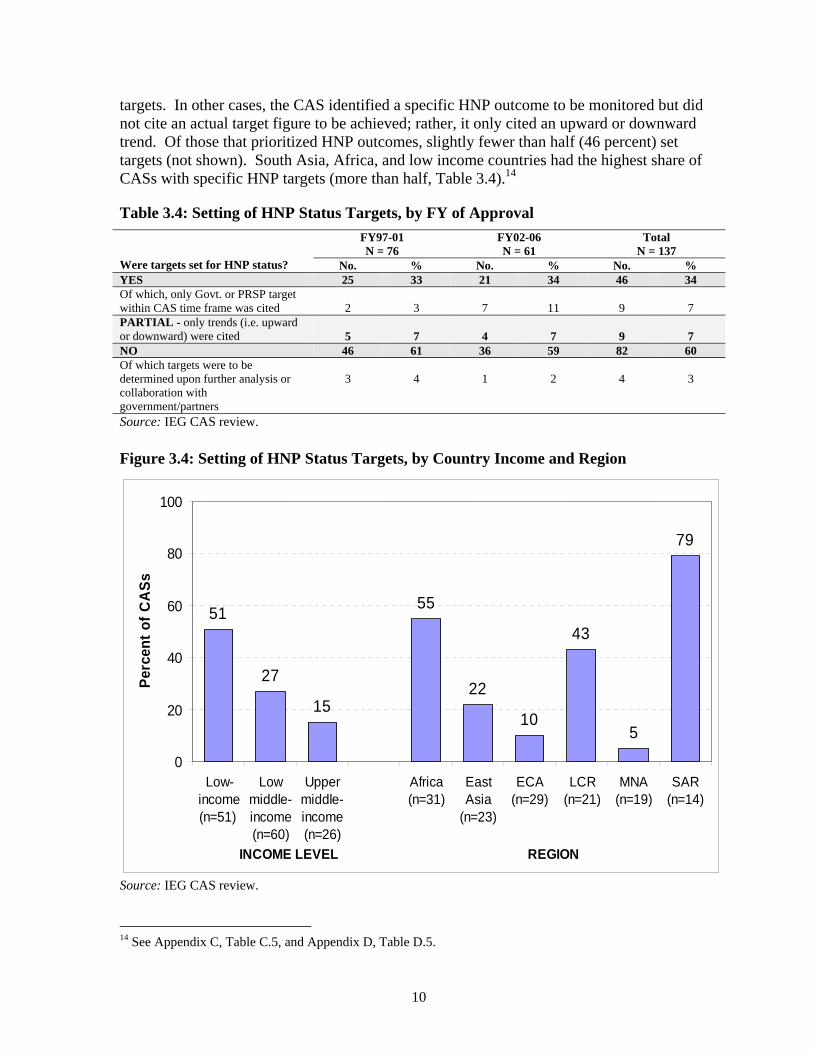
targets. In other cases, the CAS identified a specific HNP outcome to be monitored but did not cite an actual target figure to be achieved; rather, it only cited an upward or downward trend. Of those that prioritized HNP outcomes, slightly fewer than half (46 percent) set targets (not shown). South Asia, Africa, and low income countries had the highest share of CASs with specific HNP targets (more than half, Table 3.4).14
Table 3.4: Setting of HNP Status Targets, by FY of Approval
Were targets set for HNP status?
FY97-01 N = 76
FY02-06 N = 61
Total N = 137
No. % No. % No. % YES 25 33 21 34 46 34 Of which, only Govt. or PRSP target within CAS time frame was cited
2
3
7
11
9
7
PARTIAL - only trends (i.e. upward or downward) were cited
5
7
4
7
9
7
NO 46 61 36 59 82 60 Of which targets were to be determined upon further analysis or collaboration with government/partners
3
4
1
2
4
3
Source: IEG CAS review.
Figure 3.4: Setting of HNP Status Targets, by Country Income and Region
Source: IEG CAS review.
14 See Appendix C, Table C.5, and Appendix D, Table D.5.
51
27
15
55
22
10
43
5
79
0
20
40
60
80
100
Low-income(n=51)
Lowmiddle-income(n=60)
Uppermiddle-income(n=26)
Africa(n=31)
EastAsia
(n=23)
ECA(n=29)
LCR(n=21)
MNA(n=19)
SAR(n=14)
Per
cen
t o
f C
AS
s
REGIONINCOME LEVEL
11
3.10 Although the majority of CASs recognize the need to focus on HNP issues among the poor, only a few CASs set specific targets for HNP access or health status of the poor. In fact, only 15 percent of CASs did this. For those that emphasized HNP issues for the poor, fewer than a quarter (22 percent) set targets specifically for the poor (not shown). However, the share of CASs that set HNP status or access targets for the poor nearly doubled (11 percent to 21 percent) over time, albeit from a low starting point. There were no differences in the propensity to set outcome or access targets for the poor by country income 3.11 About one in four CASs in Africa and LCR set HNP outcome or access targets for the poor, while this was much less likely in other regions.15
Table 3.5: Setting of HNP Targets for the Poor, by FY of Approval
Were HNP outcome or access targets set for the poor?
FY97-01 N = 76
FY02-06 N = 61
Total N = 137
No. % No. % No. % YES 8 11 13 21 21 15 Specific HNP status indicators:
Child malnutrition Pregnant/nursing female
malnutrition HIV incidence or
prevalence
2
1
0
3 1 0
1 0 1
2 0 2
3 1 1
2
1
1 Sub-total 3 4 2 3 5 4 Specific access indicators:
Availability/ coverage of services
Household exp. on health Insurance coverage Utilization rate Vaccination rate Govt. budget alloc. Index rating for
inequality
4
1 1 0 0 0
1
5 1 1 0 0 0 1
5 3 3 4 2 2 0
8 5 5 7 3 3 0
9 4 4 4 2 2 1
7
3 3 3 1 1
1 Sub-total 7 9 19 31 26 19 PARTIAL - only trends (upward or downward) were cited
7
9
8
13
15
11
NO 61 80 40 66 101 74 Of which targets were to be determined upon further analysis or collaboration with government/partners
2
3
1
2
3
2
Source: IEG CAS review.
15 See Appendix C, Table C.6, and Appendix D, Table D.6.
12
Figure 3.5: Setting of HNP Targets for the Poor, by Country Income and Region
Source: IEG CAS review.
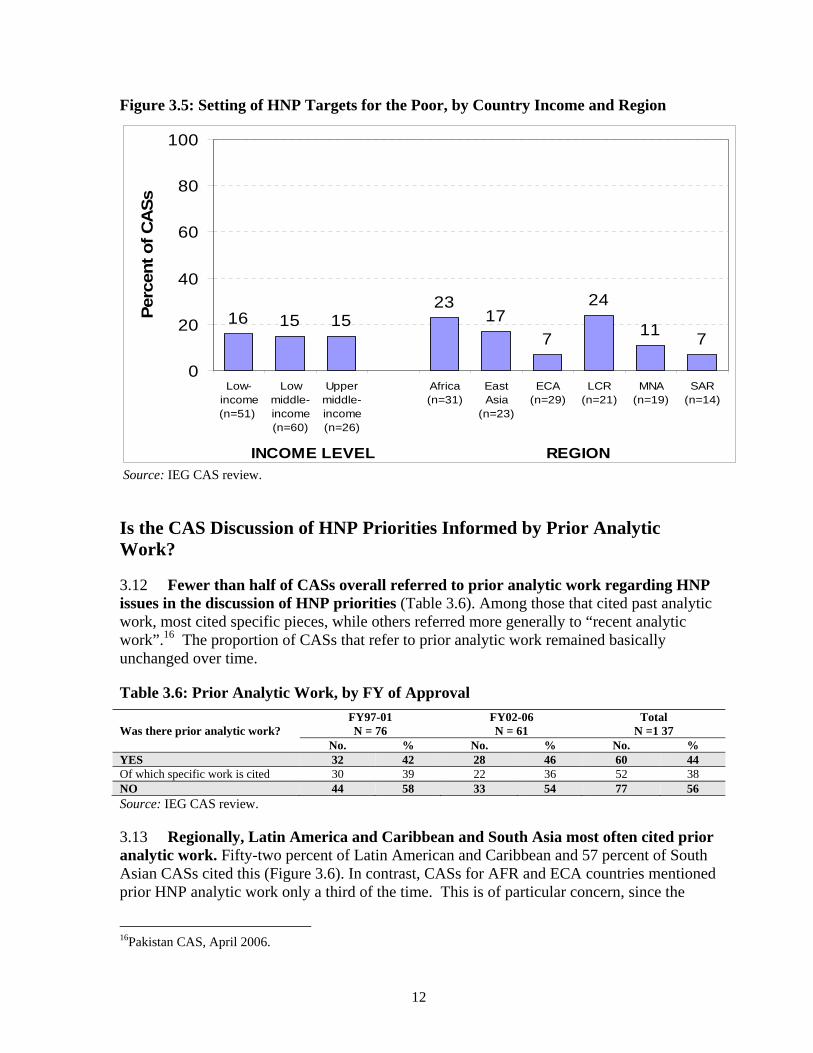
Is the CAS Discussion of HNP Priorities Informed by Prior Analytic Work?
3.12 Fewer than half of CASs overall referred to prior analytic work regarding HNP issues in the discussion of HNP priorities (Table 3.6). Among those that cited past analytic work, most cited specific pieces, while others referred more generally to “recent analytic work”.16 The proportion of CASs that refer to prior analytic work remained basically unchanged over time.
Table 3.6: Prior Analytic Work, by FY of Approval
Was there prior analytic work?
FY97-01 N = 76
FY02-06 N = 61
Total N =1 37
No. % No. % No. % YES 32 42 28 46 60 44 Of which specific work is cited 30 39 22 36 52 38 NO 44 58 33 54 77 56 Source: IEG CAS review.
3.13 Regionally, Latin America and Caribbean and South Asia most often cited prior analytic work. Fifty-two percent of Latin American and Caribbean and 57 percent of South Asian CASs cited this (Figure 3.6). In contrast, CASs for AFR and ECA countries mentioned prior HNP analytic work only a third of the time. This is of particular concern, since the
16Pakistan CAS, April 2006.
16 15 1523
17
7
24
117
0
20
40
60
80
100
Low-income(n=51)
Lowmiddle-income(n=60)
Uppermiddle-income(n=26)
Africa(n=31)
EastAsia
(n=23)
ECA(n=29)
LCR(n=21)
MNA(n=19)
SAR(n=14)
Perc
ent
of C
AS
s
INCOME LEVEL REGION

13
Africa region was among those most likely to cite HNP status as a priority. Low-income and lower middle-income countries were slightly more likely to cite prior analytic work than were upper middle-income countries.
Figure 3.6: Prior Analytic Work, by Country Income and Region
Source: IEG CAS review.
Proposed Bank HNP Activities
3.14 About three-quarters of CASs proposed new HNP lending activities, although this decreased between the first half of the evaluation period to the second (Table 3.7). Of those that did not propose new HNP lending, over half already had ongoing HNP lending. More than half (57 percent) of CASs overall proposed new analytic work. The proportion of CASs that proposed new HNP lending decreased over time (79 percent to 67 percent), though the share that already had ongoing health lending increased slightly.
Table 3.7: Proposed HNP Activities, by FY of Approval
What Bank HNP activities were proposed?
FY97-01 N = 76
FY02-06 N = 61
Total N = 137
No. % No. % No. % LENDING 60 79 41 67 101 74 In addition to which, no new planned HNP lending, but HNP lending ongoing
8
11
10
16
19
14
ANALYTIC WORK 40 53 36 59 78 57 Source: IEG CAS review.
45 4539 39
48
31
5247
57
0
20
40
60
80
100
Low-income(n=51)
Lowmiddle-income(n=60)
Uppermiddle-income(n=26)
Africa(n=31)
EastAsia
(n=23)
ECA(n=29)
LCR(n=21)
MNA(n=19)
SAR(n=14)
Pe
rce
nt o
f CA
Ss
REGIONINCOME LEVEL

14
3.15 The proportion of CASs that proposed new HNP lending was highest among low-income countries, South Asia and LCR (Figure 3.7). UMICs, which had the lowest proportion of ongoing lending (4 percent), had the second highest proportion of new lending (77 percent).17 More than half of CASs in all regions except ECA proposed new HNP analytic work.
Figure 3.7: Proposed HNP Lending and Analytic Work, by Country Income and Region
Source: IEG CAS review. 3.16 Among the CASs that prioritized the HNP sector, most proposed future analytic work. Nearly three-quarters of CASs (71 percent) proposed this (Table 3.8). In almost half of the CASs where future HNP analytic work was proposed, the CAS also cited previous analytic work on HNP. About one in five CASs that prioritized the HNP sector neither cited prior nor proposed future analytic work.
Table 3.8: Prior vs. Proposed Analytic Work, if Prioritized HNP Sector (N = 112)
Prior analytic work
Future analytic work
Proposed Did not propose Total
No. % No. % No. % Cited 39 35 12 11 51 46 Did not cite 40 36 21 19 61 54 Total 79 71 33 30 112 100 Source: IEG CAS review.
17 See Appendix C, Table C.7.
0
20
40
60
80
100
Low-income(n=51)
Lowmiddle-income(n=60)
Uppermiddle-income(n=26)
Africa(n=31)
EastAsia
(n=23)
ECA(n=29)
LCR(n=21)
MNA(n=19)
SAR(n=14)
Per
cent of C
AS
s
Lending Economic and sector work
INCOME LEVEL REGION

15
Multisectoral Approaches to Improving HNP Outcomes
DOES THE CAS ACKNOWLEDGE THE CONTRIBUTION OF OTHER SECTORS TO HNP
OUTCOMES?
3.17 Most CASs acknowledged the contribution of other sectors to HNP outcomes, and this share was stable over the 10-year period, More than three-quarters of CASs acknowledged this (Table 3.9). Water supply and sanitation (WSS) was the sector most often regarded as having an impact on HNP outcomes (half of the CASs referred to this), followed by education (22 percent) and the environment (20 percent). There were no discernable trends in the prominence of the sectors mentioned between the first and second half of the period.
Table 3.9: Trend in CAS Acknowledgement of Other Sectors’ Aontributions to HNP Outcomes, by FY of Approval
Does the CAS acknowledge the contribution of other sectors to HNP outcomes?
FY97-01 (N =7 6)
FY02-06 (N = 61)
Total
(N = 137) No. % No. % No. %
YES 60 79 47 77 107 78 Of which, sectors mentioned were: Water Supply and Sanitation 37 49 31 51 68 50 Education 18 24 12 20 30 22 Environment 14 18 14 23 28 20 Transport/Infrastructure 14 18 9 15 23 17 Energy 4 5 4 7 8 6 Public Sector Reform 4 5 4 7 8 6 Social Security 1 1 4 7 5 4 Agriculture 2 3 1 2 3 2 Indigenous/Rural Development 2 3 1 2 3 2 Labor 1 1 1 2 2 1 Microfinance 1 1 0 0 1 1 Defense 0 0 1 2 1 1 Urban Development 1 1 1 2 2 1 NO 16 21 14 23 30 22 Source: IEG CAS review.
3.18 Only about half of upper middle-income country strategies acknowledged multisectoral linkages to HNP outcomes, compared to more than 8 out of 10 CASs in low- and lower-middle income countries (Figure 3.8). The importance of water and sanitation on HNP outcomes was acknowledged in nearly three-quarters of low-income country CASs, compared with fewer than half of the CASs for LMICs and UMICs. Most of the CASs in four out of six regions acknowledged the impact of other sectors on HNP outcomes. More than 80 per cent of CASs from countries in Africa, South Asia, Middle East and North Africa and East Asia acknowledged the impact of other sectors on HNP outcomes, compared with Latin America (62 percent) and Eastern Europe and Central Asia (52 percent, Figure 3.8). WSS was the sector most frequently cited as contributing to HNP outcomes in all regions, particularly in Africa and South Asia (71 percent).
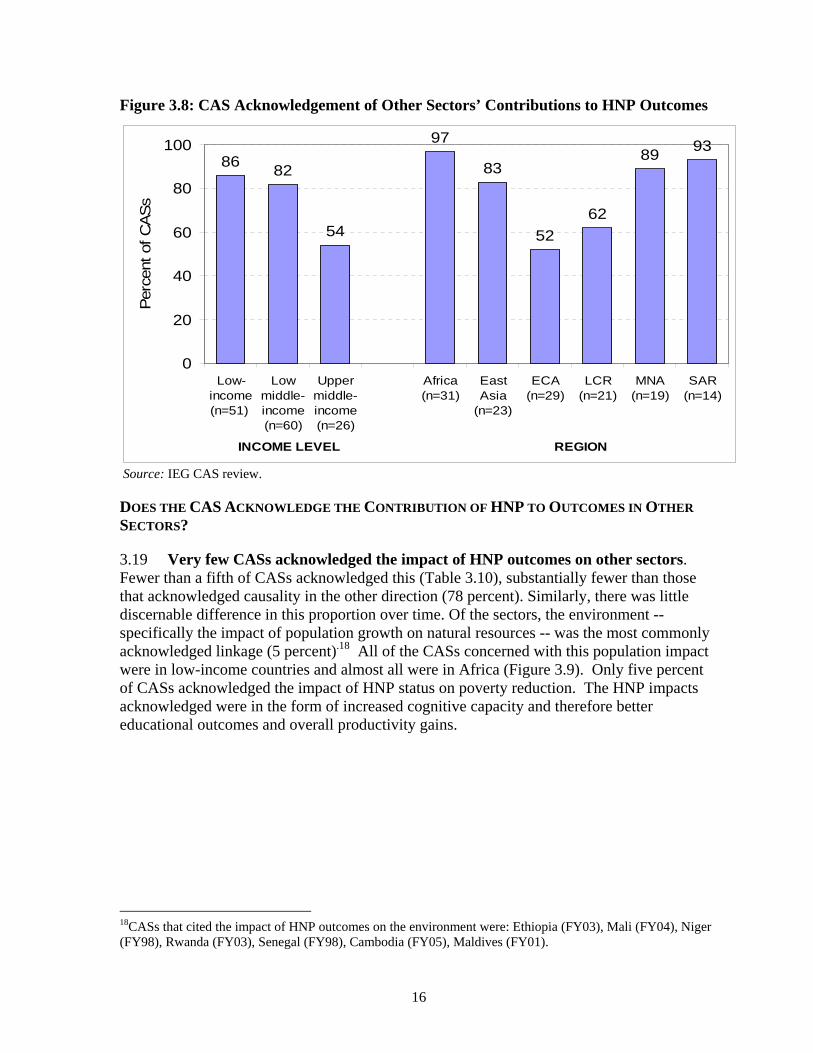
16
Figure 3.8: CAS Acknowledgement of Other Sectors’ Contributions to HNP Outcomes
Source: IEG CAS review.
DOES THE CAS ACKNOWLEDGE THE CONTRIBUTION OF HNP TO OUTCOMES IN OTHER
SECTORS?
3.19 Very few CASs acknowledged the impact of HNP outcomes on other sectors. Fewer than a fifth of CASs acknowledged this (Table 3.10), substantially fewer than those that acknowledged causality in the other direction (78 percent). Similarly, there was little discernable difference in this proportion over time. Of the sectors, the environment -- specifically the impact of population growth on natural resources -- was the most commonly acknowledged linkage (5 percent).18 All of the CASs concerned with this population impact were in low-income countries and almost all were in Africa (Figure 3.9). Only five percent of CASs acknowledged the impact of HNP status on poverty reduction. The HNP impacts acknowledged were in the form of increased cognitive capacity and therefore better educational outcomes and overall productivity gains.
18CASs that cited the impact of HNP outcomes on the environment were: Ethiopia (FY03), Mali (FY04), Niger (FY98), Rwanda (FY03), Senegal (FY98), Cambodia (FY05), Maldives (FY01).
8682
54
97
83
52
62
8993
0
20
40
60
80
100
Low-income(n=51)
Lowmiddle-income(n=60)
Uppermiddle-income(n=26)
Africa(n=31)
EastAsia
(n=23)
ECA(n=29)
LCR(n=21)
MNA(n=19)
SAR(n=14)
Per
cent
of C
AS
s
REGIONINCOME LEVEL
17
Table 3.10: Trend in CAS Acknowledgment of Contribution of HNP Outcomes to Other Development Objectives, by FY of Approval
Does the CAS acknowledge the contribution of HNP outcomes to other development objectives?
FY97-01 N = 76
FY02-06 N = 61
Total
N = 137
No.
%
No.
%
No.
% Yes 12 16 13 21 25 18 Of which, sectors mentioned were: Environment Poverty Reduction Education Public Sector Reform Agriculture Labor Transport/Infrastructure
3 3 3 0 1 1 1
4 4 4
0 1 1 1
4 4 3 1 0 1 0
7 7 5 2 0 2
0
7 7 6 1 1 2 1
5 5 4
1 1 1 0
No 64 84 48 79 112 82 Source: IEG CAS review.
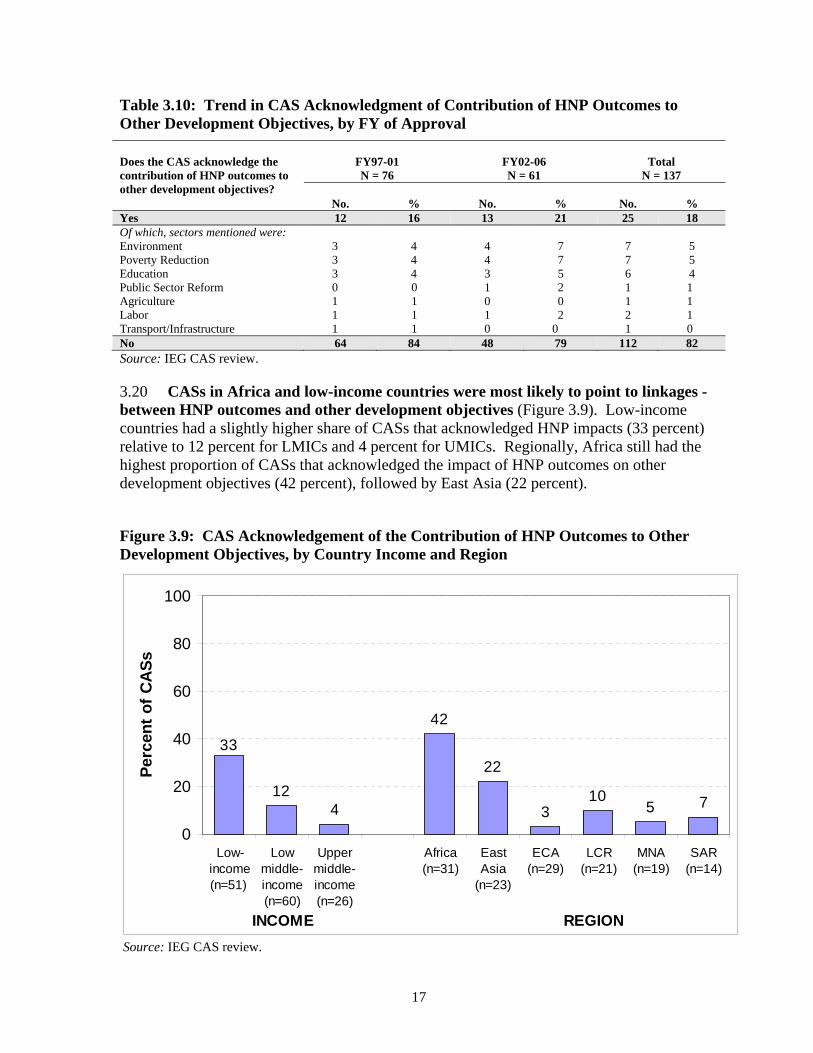
3.20 CASs in Africa and low-income countries were most likely to point to linkages -between HNP outcomes and other development objectives (Figure 3.9). Low-income countries had a slightly higher share of CASs that acknowledged HNP impacts (33 percent) relative to 12 percent for LMICs and 4 percent for UMICs. Regionally, Africa still had the highest proportion of CASs that acknowledged the impact of HNP outcomes on other development objectives (42 percent), followed by East Asia (22 percent).
Figure 3.9: CAS Acknowledgement of the Contribution of HNP Outcomes to Other Development Objectives, by Country Income and Region
Source: IEG CAS review.
124
42
22
310
5 7
33
0
20
40
60
80
100
Low-income(n=51)
Lowmiddle-income(n=60)
Uppermiddle-income(n=26)
Africa(n=31)
EastAsia
(n=23)
ECA(n=29)
LCR(n=21)
MNA(n=19)
SAR(n=14)
Per
cen
t o
f C
AS
s
REGIONINCOME
18
DOES THE CAS PROPOSE A MULTISECTORAL LENDING STRATEGY TO IMPROVE HNP
OUTCOMES?
3.21 The CASs proposed to ensure that investments in other sectors are brought to bear on improving health status through two main strategies: (a) multisectoral lending operations, defined as any single operation with the objective of improving HNP outcomes that financed more than one sector; or (b) “parallel lending”, in which non-HNP sectoral lending operations are explicitly brought to bear on health outcomes, including instances in which some formal collaboration may be implied with the HNP sector but lending is channeled through the non-HNP sector. Examples of operations labeled parallel lending for the purposes of the review include mention in the CAS that "the Bank is modifying the design of its water and sanitation projects to help maximize health benefits" (India, FY2001), that it intended to address nutrition issues through interventions linked with education (India FY98) or that public sector reform projects were proposed to support institutional reforms in revenue and expenditure management and improve the poverty impact of selected public programs including health (Thailand FY98). In both categories “multisectoral approaches” was interpreted liberally and included a broad spectrum of proposed actions ranging from CASs in which health components explicitly included lending in non-HNP sectors to those in which CASs simply mentioned the health benefits of lending in these sectors.
3.22 Fewer CASs proposed multisectoral lending strategies than acknowledged multisectoral linkages. While 82 percent of CASs prioritized HNP and 78 percent acknowledged the contribution of other sectors to HNP outcomes, only 53 percent incorporated multisectoral lending strategies, either in terms of parallel or multisectoral lending (Table 3.11). The most common strategy for including the contribution of interventions in other sectors to HNP outcomes was through parallel lending (45 percent) with multisectoral lending proposed by 17 percent of the CASs. Most CASs did not specify the type of lending instrument for multisectoral operations; only one CAS specified that it was in the form of development policy lending (DPL), 8 percent specified it was in the form of investment lending. Even fewer CASs proposed multisectoral analytic and advisory services on HNP, although those that did were far more explicit in the cross-sectoral linkages.
Table 3.11: Multisectoral Lending Atrategies for HNP Outcomes, by FY of Approval
Did the CAS propose a multisectoral lending strategy for HNP outcomes?
FY97-01 N = 76
FY02-06 N = 61
Total N = 137
No. % No. % No. % Any multisectoral lending strategy, 38 50 35 57 73 53Of which: Parallel lending only 28 37 22 36 50 36 Multisectoral lending only 3 4 8 13 11 8 Both (MS plus PL) 7 9 5 8 12 9 MS lending that was HIV-related 3 4 11 18 14 10 No multisectoral lending strategy, 38 50 26 43 64 47Of which: Multisectoral contribution acknowledged but no action proposed
18 24 15 25 33 24
No multisectoral contribution acknowledged 20 26 11 18 31 23 Source: IEG CAS review.

19
3.23 The share of CASs proposing multisectoral strategies to achieve HNP outcomes has increased slightly over time. Most of this increase is due to an increase in multisectoral lending operations from 13 percent in the first half of the review period to 17 percent in the latter half, almost all of which is related to HIV/AIDS. The share of multisectoral lending operations that were for HIV/AIDS overall was 61 percent, rising from 30 percent of multisectoral HNP operations in the first period to 85 percent in the second period.
3.24 Few CASs proposed multisectoral analytic work on HNP, but multisectoral linkages were more explicit than for lending strategies. The review recorded instances of Analytic and Advisory work (AAA - both economic and sector work and technical assistance) if the CAS explicitly referred to how it was going to address health issues in the context of other sectors.19 Although only 5 percent of CASs proposed AAA that qualified as multisectoral in nature, those that did explicitly discussed how they would incorporate HNP issues within the scope of their work. Only CASs in the LAC and EAP regions had no multisectoral AAA incorporating HNP issues in their proposed strategies. The other regions had two multisectoral AAA products planned, except for ECA which had one multisectoral AAA planned within the review period. UMICs only had one AAA product planned whereas LICs and LMICs had three multisectoral AAA products planned. The studies planned in the review period included a study on the impact of education and training on HIV/AIDS, a water strategy paper (with a focus on health outcomes), a rural development strategy paper (also with a focus on health issues), a study on the environment (incorporating consideration of environmental health issues), a cross-sectoral human development review, a study on the health impacts of rural water supply and one on urban and indoor air quality.
3.25 Across income levels, multisectoral strategies were incorporated in the CASs for more than two-thirds of LICs, compared with only about half in LMICs and about a quarter in UMICs (Figure 3.10). All of the strictly multisectoral lending in LICs was related to HIV/AIDS (24 percent).20 Of the 23 CASs that proposed multisectoral HNP lending, over half (52 percent) were in LICs. Parallel lending was most common in countries at all three income levels; multisectoral lending was not part of the strategy for improving HNP outcomes in any of the UMICs (Figure 3.11).
3.26 Africa had the highest proportion of CASs that incorporated multisectoral strategies due to a higher percentage of HIV/AIDS-related multisectoral lending. 84 percent of African CASs incorporated multisectoral lending strategies of which 39 percent of African CASs had HIV/AIDS-related multisectoral lending (Figure 3.10). Africa was the region most likely to incorporate multisectoral lending, either alone or in combination with parallel lending (Figure 3.12). In fact, CASs in the other regions almost exclusively embraced multisectoral strategies of parallel lending: only SAR and LAC had any proposed
19 The authors acknowledge that this does not cover all AAA work in the evaluation period that may have met this criteria but only captures those clearly referred to in the CAS as connecting HNP issues with other sectors. 20Even though early childhood development (ECD) projects are generally implemented through the health sector as multisectoral projects, several CASs, such as Egypt FY2005 mentioned that they were going to be administered through the education sector. Consequently this review tabulated ECD projects as parallel lending not multisectoral lending.
20
multisectoral lending. Three-quarters of the CASs in South Asia and about two-thirds in EAP proposed parallel lending to improve HNP outcomes.
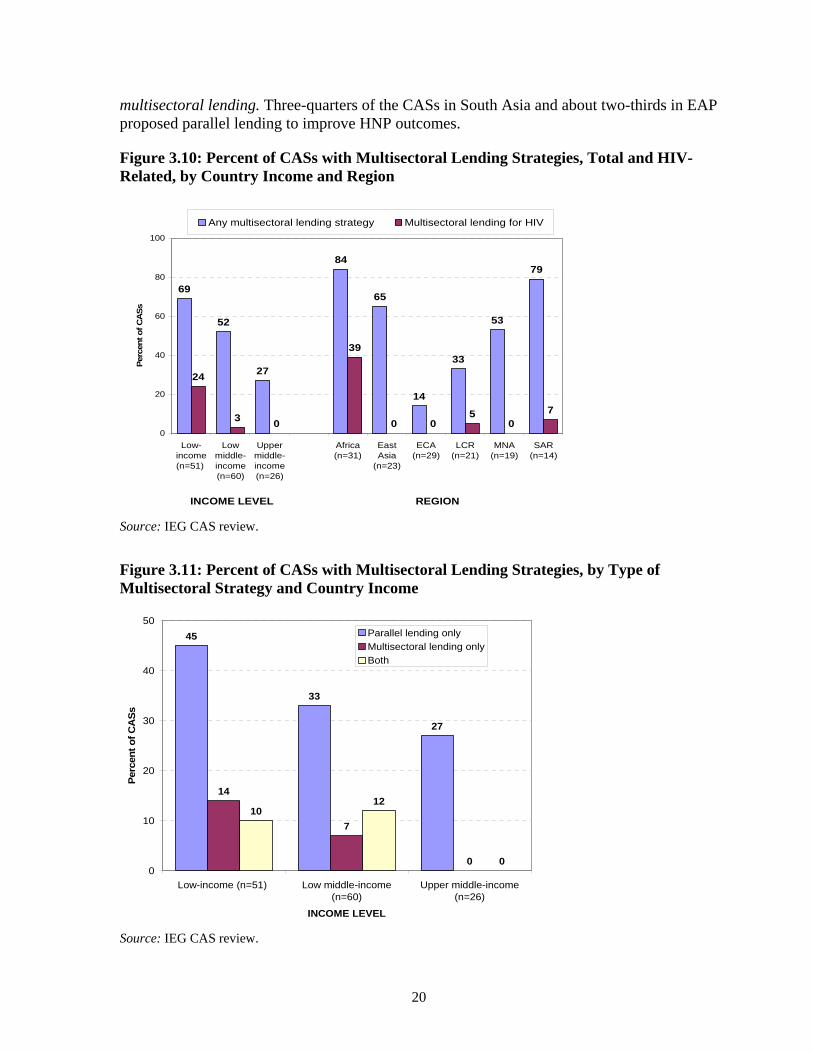
Figure 3.10: Percent of CASs with Multisectoral Lending Strategies, Total and HIV-Related, by Country Income and Region
Source: IEG CAS review.
Figure 3.11: Percent of CASs with Multisectoral Lending Strategies, by Type of Multisectoral Strategy and Country Income
Source: IEG CAS review.
69
52
27
84
65
14
33
53
79
24
30
39
0 05
07
0
20
40
60
80
100
Low-income(n=51)
Lowmiddle-income(n=60)
Uppermiddle-income(n=26)
Africa(n=31)
EastAsia
(n=23)
ECA(n=29)
LCR(n=21)
MNA(n=19)
SAR(n=14)
Per
cent of C
AS
s
Any multisectoral lending strategy Multisectoral lending for HIV
INCOME LEVEL REGION
45
33
27
14
7
0
1012
00
10
20
30
40
50
Low-income (n=51) Low middle-income(n=60)
Upper middle-income(n=26)
INCOME LEVEL
Per
cen
t o
f C
AS
s
Parallel lending onlyMultisectoral lending onlyBoth

21
Figure 3.12: Percent of CASs with Multisectoral Lending Strategies, by Type of Multisectoral Strategy and Country Income
Source: IEG CAS review. 3.27 Most parallel lending was concentrated in the water supply and sanitation sector, followed by transport or infrastructure (Table 3.12). LICs and LMICs had a higher proportion of parallel lending than UMICs (Table 3.13). The former accounted for almost all of the parallel lending in the WSS sector to improve HNP outcomes, while UMICs were the most likely to cite public sector reform as part of such a strategy. None of the LICs had any parallel lending in public sector reform that made a reference to improvements in the HNP sector. East Asian, South Asian and African countries had a slightly higher percentage of parallel lending concentrated in the WSS sector than countries in the other regions (Table 3.14).
Table 3.12: Trends in Non-HNP Sectors Selected for Parallel Lending, by FY of Approval
Sector
FY97-01 N = 76
FY02-06 N = 61
Total N = 137
No. % No. % No. % Water and Sanitation 17 22 18 30 35 26 Transport/Infrastructure 2 3 6 10 8 6 Environment 4 5 3 5 7 5 Public Sector Reform 4 5 1 2 5 4 Education 2 3 3 5 5 4 Energy 2 3 1 2 3 2 Source: IEG CAS review.
35
56
1410
53
71
23
9 10
36
14
7
0
10
20
30
40
50
60
70
80
Africa (n=31) East Asia(n=23)
ECA (n=29) LCR (n=21) MNA (n=19) SAR (n=14)
REGION
Per
cent of C
AS
s
Parallel lending onlyMultisectoral lending only
Both

22
Table 3.13: Non-HNP Sectors Selected for Parallel Lending, by Income
Sector
LIC N = 51
LMIC N = 60
UMIC N = 26
No. % No. % No. % Water and Sanitation 18 35 15 25 2 7 Transport/Infrastructure 4 8 4 7 0 0 Public Sector Reform 0 0 2 3 3 12 Environment 3 6 4 7 0 0 Energy 1 2 2 3 0 0 Education 3 6 2 3 0 0 Source: IEG CAS review.
Table 3.14: Non-HNP Sectors Selected for Parallel Lending, by Region
Sector
ECA N =2 9
EAP N = 23
SAR N = 14
LAC N = 21
MNA N = 19
AFR N = 31
No. (% ) No. (%) No. (%) No. (%) No. (%) No. (%) Water and Sanitation 2 (7) 10 (43) 5 (36) 1 (5) 5 (26) 12 (39) Transport/Infrastructure 2 (7) 3 (13) 3 (21) 0 (0) 0 (0) 0 (0) Public Sector Reform 2 (7) 1 (4) 0 (0) 2 (10) 0 (0) 0 (0) Environment 0 (0) 1 (4) 1 (7) 2 (10) 2 (11) 1 (3) Energy 2 (7) 1 (4) 0 (0) 0 (0) 0 (0) 0 (0) Education 0 (0) 0 (0) 2 (14) 0 (0) 3 (16) 0 (0) Source: IEG CAS review.
FEATURES OF PARALLEL LENDING FOR HNP
3.28 In cases where the CASs incorporated parallel lending, the review considered whether or not the parallel lending entailed some form of common targeting or common management (i.e., consultations and/or implementation arrangements made coordinated with counterparts in the HNP sector).
3.29 Most of the CASs with parallel lending did not specify or envisage any form of coordination with the HNP sector. In almost all of the CASs that incorporated parallel lending (91 percent of the 62 CASs that had parallel lending) there was no indication that specific HNP targets would be incorporated or that coordination with the HNP sector would take place in implementing the parallel lending (Table 3.15).
3.30 Lower middle-income countries had more instances of linkages between sectors in parallel lending operations than low- or upper middle-income countries (Table 3.16). Only three regions had some linkages between parallel operations (not tabulated). Only Africa, East Asia and Pacific and South Asia regions had one example each of common targeting. These involved including reduction in child mortality and improvement in maternal health as a target for a WSS project (Ghana FY04), including “increased number of trips to health clinics” (inter alia) as a progress indicator for a transport project (Laos FY99), including the percentage of primary health care centers repaired in under-served areas as an indicator for infrastructure projects (Sri Lanka FY03). Of these regions, only the East Asia and Pacific region had any cases of common management of parallel operations in two CASs namely Thailand FY98 and Philippines FY02.
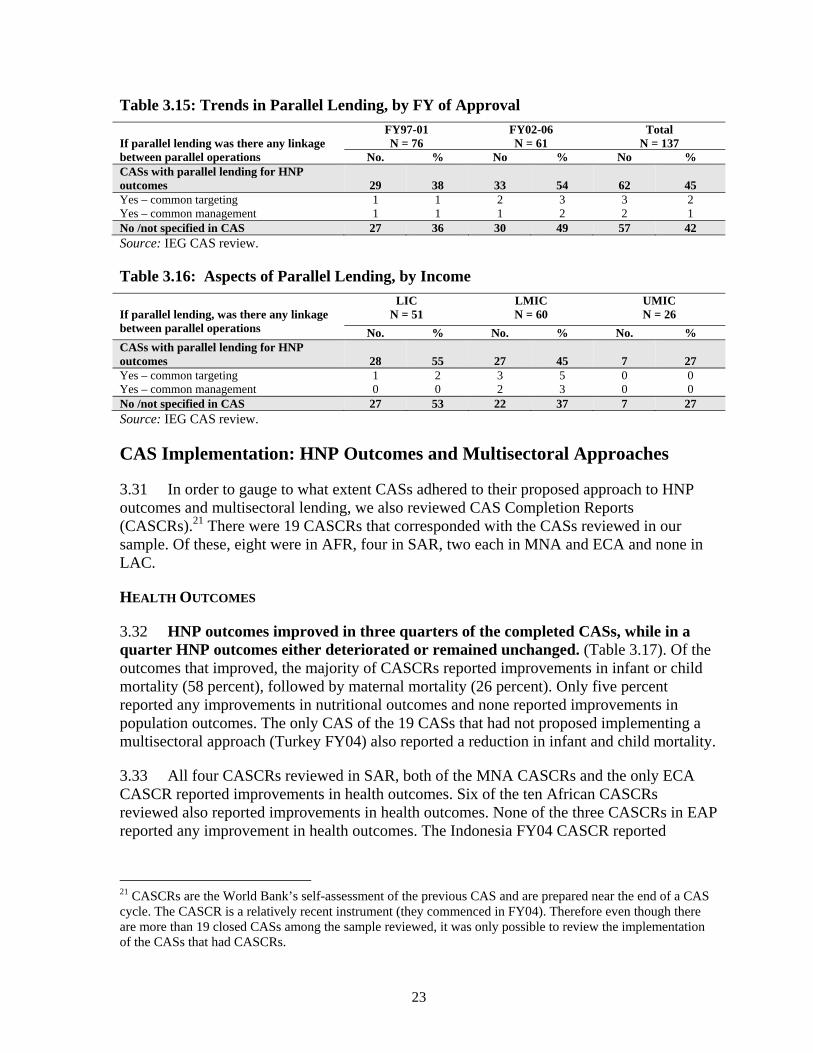
23
Table 3.15: Trends in Parallel Lending, by FY of Approval
If parallel lending was there any linkage between parallel operations
FY97-01 N = 76
FY02-06 N = 61
Total N = 137
No. % No % No % CASs with parallel lending for HNP outcomes
29
38
33
54
62
45
Yes – common targeting 1 1 2 3 3 2 Yes – common management 1 1 1 2 2 1No /not specified in CAS 27 36 30 49 57 42 Source: IEG CAS review.
Table 3.16: Aspects of Parallel Lending, by Income
If parallel lending, was there any linkage between parallel operations
LIC N = 51
LMIC N = 60
UMIC N = 26
No. % No. % No. % CASs with parallel lending for HNP outcomes
28
55
27
45
7
27
Yes – common targeting 1 2 3 5 0 0 Yes – common management 0 0 2 3 0 0 No /not specified in CAS 27 53 22 37 7 27 Source: IEG CAS review.
CAS Implementation: HNP Outcomes and Multisectoral Approaches
3.31 In order to gauge to what extent CASs adhered to their proposed approach to HNP outcomes and multisectoral lending, we also reviewed CAS Completion Reports (CASCRs).21 There were 19 CASCRs that corresponded with the CASs reviewed in our sample. Of these, eight were in AFR, four in SAR, two each in MNA and ECA and none in LAC.
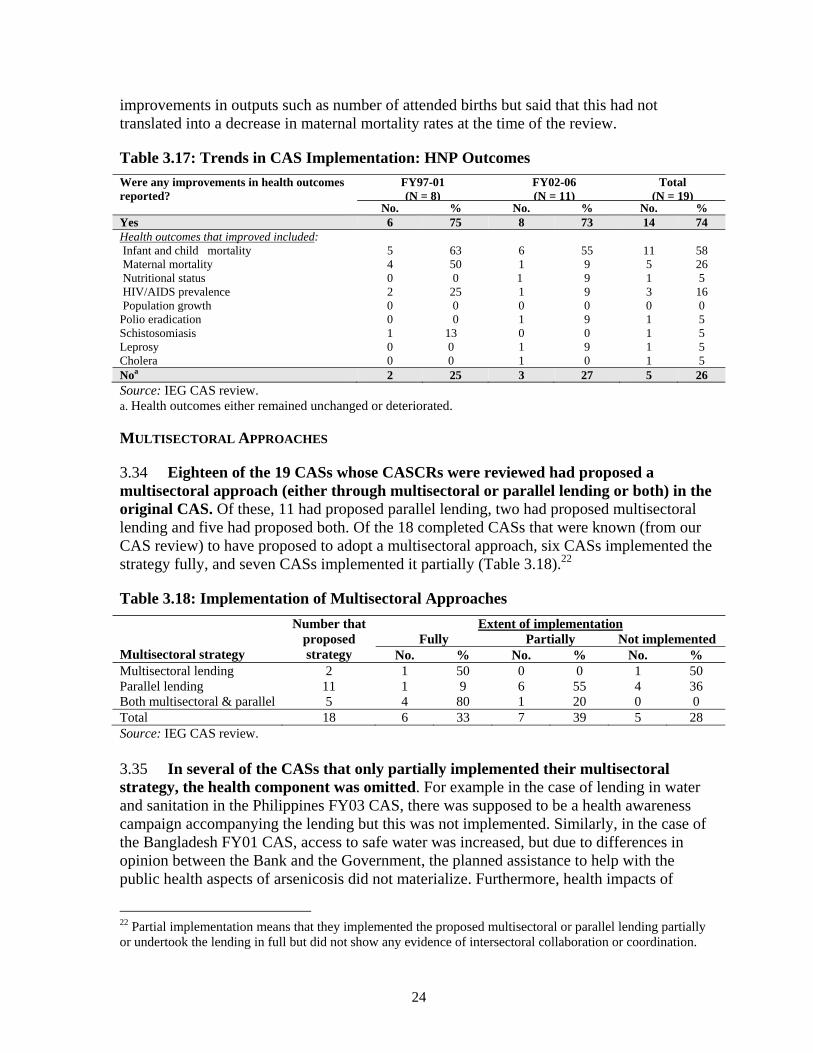
HEALTH OUTCOMES
3.32 HNP outcomes improved in three quarters of the completed CASs, while in a quarter HNP outcomes either deteriorated or remained unchanged. (Table 3.17). Of the outcomes that improved, the majority of CASCRs reported improvements in infant or child mortality (58 percent), followed by maternal mortality (26 percent). Only five percent reported any improvements in nutritional outcomes and none reported improvements in population outcomes. The only CAS of the 19 CASs that had not proposed implementing a multisectoral approach (Turkey FY04) also reported a reduction in infant and child mortality.
3.33 All four CASCRs reviewed in SAR, both of the MNA CASCRs and the only ECA CASCR reported improvements in health outcomes. Six of the ten African CASCRs reviewed also reported improvements in health outcomes. None of the three CASCRs in EAP reported any improvement in health outcomes. The Indonesia FY04 CASCR reported
21 CASCRs are the World Bank’s self-assessment of the previous CAS and are prepared near the end of a CAS cycle. The CASCR is a relatively recent instrument (they commenced in FY04). Therefore even though there are more than 19 closed CASs among the sample reviewed, it was only possible to review the implementation of the CASs that had CASCRs.
24
improvements in outputs such as number of attended births but said that this had not translated into a decrease in maternal mortality rates at the time of the review.
Table 3.17: Trends in CAS Implementation: HNP Outcomes
Were any improvements in health outcomes reported?
FY97-01 (N = 8)
FY02-06 (N = 11)
Total (N = 19)
No. % No. % No. % Yes 6 75 8 73 14 74 Health outcomes that improved included: Infant and child mortality 5 63 6 55 11 58 Maternal mortality 4 50 1 9 5 26 Nutritional status 0 0 1 9 1 5 HIV/AIDS prevalence 2 25 1 9 3 16 Population growth 0 0 0 0 0 0 Polio eradication Schistosomiasis Leprosy Cholera
0 1 0 0
0 13 0 0
1 0 1 1
9 0 9 0
1 1 1 1
5 5 5 5
Noa 2 25 3 27 5 26 Source: IEG CAS review. a. Health outcomes either remained unchanged or deteriorated. MULTISECTORAL APPROACHES
3.34 Eighteen of the 19 CASs whose CASCRs were reviewed had proposed a multisectoral approach (either through multisectoral or parallel lending or both) in the original CAS. Of these, 11 had proposed parallel lending, two had proposed multisectoral lending and five had proposed both. Of the 18 completed CASs that were known (from our CAS review) to have proposed to adopt a multisectoral approach, six CASs implemented the strategy fully, and seven CASs implemented it partially (Table 3.18).22
Table 3.18: Implementation of Multisectoral Approaches
Multisectoral strategy
Number that proposed strategy
Extent of implementation Fully Partially Not implemented
No. % No. % No. % Multisectoral lending 2 1 50 0 0 1 50 Parallel lending 11 1 9 6 55 4 36 Both multisectoral & parallel 5 4 80 1 20 0 0 Total 18 6 33 7 39 5 28 Source: IEG CAS review. 3.35 In several of the CASs that only partially implemented their multisectoral strategy, the health component was omitted. For example in the case of lending in water and sanitation in the Philippines FY03 CAS, there was supposed to be a health awareness campaign accompanying the lending but this was not implemented. Similarly, in the case of the Bangladesh FY01 CAS, access to safe water was increased, but due to differences in opinion between the Bank and the Government, the planned assistance to help with the public health aspects of arsenicosis did not materialize. Furthermore, health impacts of
22 Partial implementation means that they implemented the proposed multisectoral or parallel lending partially or undertook the lending in full but did not show any evidence of intersectoral collaboration or coordination.

25
lending in other sectors were often not tracked even when lending was undertaken so it was not possible to gauge the value-added of a multisectoral approach. In cases where they were tracked (even ex-post), improvements were generally noted, such as in the case of the Mali (FY04 CAS) where improved sanitation was found to have an impact on reducing cholera incidence.
3.36 Multisectoral approaches in the form of parallel lending were most often implemented in water supply and sanitation (nine CASs). However, the results of this lending were usually reported in terms of outputs or intermediate outcomes, such as increased access to safe water with no data on final health outcomes.
4.1 The World Bank’s 2007 HNP strategy, Healthy Development, commits to improving the level and distribution of HNP outcomes, especially for the poor, and advocates using intersectoral action to bring this about. It follows on the 1997 HNP strategy which also advocated improving HNP outcomes among the poor and the use of multisectoral approaches. This paper has reviewed a stratified random sample of the CASs approved from FY97-06, to assess the extent to which HNP is prioritized, especially among the poor, and the extent to which intersectoral actions were planned to achieve this. It has also looked at the small group of CASs for which there are CAS Completion Reports, to assess the extent to which both objectives were achieved.
4.2 The need to improve the health status of the poor was well-recognized, as almost three-quarters of CASs had such a focus. However, there was an overall lack of clarity on the means for improving health among the poor, as only a minority of CASs set up HNP status or access targets for the poor, only half set out a definition of the poor, and fewer than a quarter cited any targeting method for reaching the poor. More than three-quarters of CASs cited HNP as a priority sector, either explicitly or implicitly and most proposed new HNP lending activities, though this decreased over time. There was an emphasis on achieving health status outcomes, as opposed to intermediate outcomes or outputs. Only about a third of CASs set specific and monitorable targets to be achieved during the CAS period.
4.3 To date, the CAS has not delivered on its promise as the instrument for realizing the benefits of multisectoral action to improve HNP outcomes, as envisioned in the 1997 and 2007 HNP strategies. More than three-quarters of CASs acknowledged the contribution of other sectors to HNP outcomes but only slightly more than half proposed incorporating parallel or multisectoral lending in any form in their country programs. Furthermore, almost all of the CASs that did incorporate multisectoral approaches to HNP did not incorporate any specific HNP targets or indicate that any form of coordination with the HNP sector was envisaged. Only about a third of the completed CASs reviewed implemented multisectoral lending fully in the way originally envisaged, and another third only partially implementing the strategy. However, even where lending was undertaken as proposed, health indicators were not tracked, hence it was difficult to gauge the value-added of implementing a multisectoral approach. There was little evidence of intersectoral collaboration or coordination, even when multisectoral lending was undertaken as proposed.

26
4.4 Looking forward, these findings suggest several areas where CAS performance with respect to the pro-poor focus of HNP actions and multisectoral approaches can be improved.
a) CASs need to be more specific about how HNP outcomes among the poor will be addressed in implementation and how they will be measured and tracked – both in HNP and other sector operations aimed to improve HNP outcomes.
b) Analytic work needs to be launched to understand better the contribution of other sectors to HNP outcomes and the value added of multisectoral approaches in different contexts.
c) A study needs to be launched to better understand the institutional incentives in the Bank and countries that are inhibiting greater cross-sectoral collaboration, focus, and results on HNP outcomes need to be better understood.

27
REFERENCES
Filmer, Deon. 2003. “Determinants of Health and Education Outcomes.” World Bank, Washington, DC.
IEG. 2006. Annual Review of Development Effectiveness 2006: Getting Results. Washington, DC: World Bank.
Johnston, Timothy, and Susan Stout. 1999. Investing in Health: Development Effectiveness in the Health, Nutrition, and Population Sector. Washington, DC: Operations Evaluation Department, World Bank.
Pawinski and Lalloo. 2004. “Overcoming obstacles to facilitate operational multi-sectoral relationships to improve care in HIV/AIDS.” 15th International Conference on STDs and AIDS, Bangkok, Thailand Jul 11-16; Abstract no: TuPeE5332.
World Bank. 2007. Healthy Development: The World Bank Strategy for Health, Nutrition and Population Results. Washington, DC.
———. 2004. “The Millennium Development Goals for Health – Rising to the Challenges.” Washington, DC.
———. 1997. Health, Nutrition, and Population Sector Strategy Paper. Washington, DC.
———. 1996. “AIDS Prevention and Mitigation in Sub-Saharan Africa: An Updated World Bank Strategy.” Report No. 15569-AFR Human Resources and Poverty Division, Technical Department, Africa Region, Washington, DC.
———. 1995. “Regional AIDS Strategy for the Sahel.” Report no. 13411-AFR, Western Africa Department, Population and Human Resources Division, Washington, DC.


Appendix A
29
APPENDIX A: TABLE OF COUNTRY ASSISTANCE STRATEGIES REVIEWED
Region Income Fiscal Yeara 1997 1998 1999 2000 2001 2002 2003 2004 2005 2006 Total
East Asia and Pacific Cambodia LIC 1997, 1999, 2005 X X X 3 Laos LIC 1999, 2004 X X 2 Mongolia LIC 1998, 2004 X X 2 Papua New Guinea LIC 1999 X 1 Vietnam LIC 1999, 2002, 2007 X X 3 China LMIC 1997, 2003, 2006 X X X 3 Indonesia LMIC 1997, 2001, 2004 X X X 3 Philippines LMIC 1999, 2002, 2005 X X X 3 Thailand LMIC 1998, 2003 X X 2 Timor-Leste LMIC 2005 X 1 Malaysia UMIC 1999 X 1 11 countries Total CASs 3 2 6 0 1 2 2 3 3 1 23 Sample 3 2 6 0 1 2 2 3 3 1 23 Europe and Central Asia Kyrgyz Republic LIC 1998, 2003 X X 2 Tajikistan LIC 1998, 2003, 2006 X X X 3 Uzbekistan LIC 1998, 2002 X X 2 Albania LMIC 1999, 2002, 2006 X X X 3 Armenia LMIC 1998, 2001, 2004 X X X 3 Azerbaijan LMIC 1999, 2003, 2006 X X X 3 Belarus LMIC 1999, 2002 X X 2 Bosnia & Herzegovina LMIC 1998, 2000, 2005 X X X 3 Bulgaria LMIC 1998, 2002, 2006 X X X 3 Georgia LMIC 1998, 2004, 2006 X X X 3 Kazakhstan LMIC 1998, 2001, 2005 X X X 3 Macedonia LMIC 1999, 2004, 2007 X X 2 Moldova LMIC 1999, 2005 X X 2 Serbia and Montenegro LMIC 2005 X 1

Appendix A
30
Region Income Fiscal Yeara 1997 1998 1999 2000 2001 2002 2003 2004 2005 2006 Total
Turkmenistan LMIC 1997, 2001 X X 2 Ukraine LMIC 2001, 2004 X X 2 Croatia UMIC 1999, 2004, X X 2 Hungary UMIC 1998 X 1 Latvia UMIC 1998, 2002 X X 2 Lithuania UMIC 1999, 2004 X X 2 Poland UMIC 1997, 2003, 2005 X X X 3 Romania UMIC 1997, 2001, 2006 X X X 3 Russia UMIC 1997, 2000, 2002, 2007 X X X 3 Slovak Republic UMIC 2001, 2004 X X 2 Turkey UMIC 1998, 2001, 2004 X X X 3 25 countries Total CASs 4 11 7 2 7 7 3 7 5 7 60 Sample 2 5 4 1 6 3 0 4 2 2 29 Latin America and the Caribbean Bolivia LMIC 1998, 2004 X X 2 Brazil LMIC 2000, 2004 X X 2 Colombia LMIC 1998, 2003 X X 2 Dominican Republic LMIC 1999, 2005 X X 2 Ecuador LMIC 2003 X 1 El Salvador LMIC 1997, 2002, 2005 X X X 3 Guatemala LMIC 1998, 2005 X X 2 Guyana LMIC 2002 X 1 Honduras LMIC 2000, 2003, 2007 X X 2 Jamaica LMIC 2001, 2005 X X 2 Nicaragua LMIC 1998, 2003 X X 2 Paraguay LMIC 1997, 2004 X X 2 Peru LMIC 1997, 2003, X X 2 Argentina UMIC 1997, 2001, 2004, 2006 X X X X 4 Belize UMIC 2001 X 1 Chile UMIC 2002 X 1 Costa Rica UMIC 2004 X 1 Mexico UMIC 1999, 2002, 2007 X X 2 Panama UMIC 1999 X 1 Trinidad and Tobago UMIC 1999 X 1

Appendix A
31
Region Income Fiscal Yeara 1997 1998 1999 2000 2001 2002 2003 2004 2005 2006 Total
Uruguay UMIC 1997, 2000, 2005 X X X 3 Venezuela UMIC 1997 X 1 22 countries Total CASs 6 4 4 3 3 4 5 5 5 1 40 Sample 4 3 4 1 1 2 1 1 3 1 21 South Asia Bangladesh LIC 1998, 2001, 2006 X X X 3 Bhutan LIC 2000, 2006 X X 2 India LIC 1998, 2001, 2005 X X X 3 Nepal LIC 1999, 2004 X X 2 Pakistan LIC 2002, 2006 X X 2 Maldives LMIC 2001 X 1 Sri Lanka LMIC 2003 X 1 7 countries Total CASs 0 2 1 1 3 1 1 1 1 3 14 Sample 0 2 1 1 3 1 1 1 1 3 14 Middle East and North Africa Yemen LIC 1999, 2003, 2006 X X X 3 Algeria LMIC 1996, 2003 X 2 Egypt LMIC 1997, 2001, 2005 X X X 3 Djibouti LMIC 2001, 2005 X X 2 Jordan LMIC 2000, 2003, 2006 X X X 3 Morocco LMIC 1997, 2001, 2005 X X X 3 Tunisia LMIC 2000, 2004 X X 2 Lebanon UMIC 1998, 2006 X X 2 8 countries Total CASs 2 1 1 2 3 0 3 1 3 3 19 Sample 2 1 1 2 3 0 3 1 3 3 19 Sub-Saharan Africa Benin LIC 2003 X 1 Burkina Faso LIC 2001, 2005 X X 2 Chad LIC 1999, 2004 X X 2 Cote d'Ivoire LIC 1998, X 1 Ethiopia LIC 1998, 2003 X X 2 Ghana LIC 1998, 2004 X X 2 Guinea LIC 1998, 2003 X X 2 Guinea-Bissau LIC 1996 1

Appendix A
32
Region Income Fiscal Yeara 1997 1998 1999 2000 2001 2002 2003 2004 2005 2006 Total
Kenya LIC 1996, 1999, 2004 X X 3 Madagascar LIC 1997, 2004, 2007 X X 2 Malawi LIC 1999, 2003, 2007 X X 2 Mali LIC 1998, 2004 X X 2 Mauritania LIC 1997, 2002, 2007 X X 2 Mozambique LIC 1998, 2000, 2004, 2007 X X X 3 Niger LIC 1998, 2003 X X 2 Nigeria LIC 2005 X 1 Rwanda LIC 1998, 2003 X X 2 Sao Tome and Principe LIC 2001, 2005 X X 2 Senegal LIC 1998, 2003, 2007 X X 2 Sierra Leone LIC 2005 X 1 Tanzania LIC 1997, 2000, 2007 X X 2 The Gambia LIC 1999, 2003 X X 2 Uganda LIC 1997, 2001, 2006 X X X 3 Zambia LIC 2000, 2004 X X 2 Zimbabwe LIC 1997 X 1 Cameroon LMIC 2004 X 1 Cape Verde LMIC 1998, 2005 X X 2 Lesotho LMIC 1998, 2006 X X 2 Gabon UMIC 1999, 2005 X X 2 Mauritius UMIC 1997, 2002, 2007 X X 2 South Africa UMIC 1999 X 1 35 countries Total CASs 6 11 6 3 3 2 8 9 5 2 55 Sample 3 7 4 2 1 1 4 4 4 1 31 TOTAL CASs 22 31 23 11 20 166 23 25 22 17 211 Sample 14 20 18 7 15 9 11 14 16 11 137 Source: IEG CAS review. a. Bold CASs were included in the review of CASCRs.

Appendix B
33
APPENDIX B: WEIGHTED RESULTS
Variable
Entire sample
FY97-01
FY02-06
LICs
LMICs
UMICs
MICs
Poverty variables: Prioritization of HNP in the CAS 83 83 84 90 81 75 79 Focus on health status 68 70 68 78 68 53 63 Focus on the poor 72 69 76 84 73 57 67 HNP outcome targets 33 29 39 48 27 16 23 Prior analytic work 42 37 48 40 45 37 43 HNP outcome targets for the poor 16 12 21 19 14 16 14 Proposed HNP activities: Lending 75 78 69 87 64 76 69 AAA 54 49 56 60 48 53 49 Multisectoral variables: Contribution of other sectors to HNP outcomes
75 76 71 82 76 55 69
Impact of HNP on other sectors 32 17 18 36 10 4 8 Multisectoral lending strategies 49 49 48 67 43 26 39 Of which: Parallel lending 41 41 39 52 48 24 34 Multisectoral lending 18 11 26 34 10 4 9 HIV/AIDS projects 12 5 20 26 5 0 4 Sectors of parallel lending: Water and sanitation 22 21 25 34 21 5 16 Transport/Infrastructure 5 2 9 5 7 0 4 Public Sector Reform 4 5 3 0 3 12 7 Environment 5 5 4 5 7 0 4 Energy 2 2 4 1 5 0 3 Education 2 2 3 4 2 0 2 Aspects of parallel lending: Common targeting 2 1 3 4 1 0 1 Common management 1 1 1 1 1 0 1 Source: IEG CAS review.

Appendix C
34
APPENDIX C: TABLES BY INCOME GROUP
The tables in this annex have not been weighted to take into account the sampling stratification. Weighted results for the main variables by income group are in Appendix B. Table C.1: Prioritization of HNP Sector by Country Income
Did the CAS mention HNP as a priority sector?
LIC N = 51
LMIC N = 60
UMIC N = 26
No. % No. % No. % YES, of which: 46 90 47 78 19 73 Explicit priority 9 18 3 5 6 23 Implicit priority 37 73 44 73 13 50 NO, of which: 5 10 13 22 7 27 HNP issues other than health status mentioned 1 2 9 15 4 15 Source: IEG CAS review.
Table C.2: Prioritization of HNP Status, by Income Level
Were HNP outcomes, in terms of HNP status, prioritized?
LIC N = 51
LMIC N = 60
UMIC N = 26
No. % No. % No. % YES 40 78 39 65 13 50 Specific HNP indicators: Mortality -IMR -MMR -Under-5 MR -Life expectancy
21 20 10 2
41 40 20 4
11 8 5 2
18 13 8 3
2 1 2 1
8 4 8 4
Disease-specific -HIV incidence or prevalence -TB incidence or fatality rate -STD incidence - Malaria incidence -other endemic disease incidence
15 3 1 3 1
30 6 2 6 2
4 3 1 0 1
7 5 2 0 2
4 4 1 0 2
15 15 4 0 8
Fertility -TFR -Crude birth rate -Population growth rate
7 0 1
14 0 2
1 1 0
2 2 0
0 0 0
0 0 0
Malnutrition -Child malnutrition
-Pregnant/nursing women or low birth weight
10 1
20 2
7 0
12 0
1 1
4 4
NO 11 22 21 35 13 50 Of which, intermediate HNP outcomes, HNP outputs or inputs were prioritized
4
8
4
7
2
8
Source: IEG CAS review.

Appendix C
35
Table C.3: Focus on the Poor by Country Income
Was there a focus on health status among the poor?
LIC N = 51
LMIC N = 60
UMIC N = 26
No. % No. % No. % YES 42 82 44 73 15 58 Of which, the poor were identified as:
Low income group Poor region Rural area Minority group
4 9 8 1
8
18 16 2
5 3 10 1
8 5
17 2
2 5 2 2
8
19 8 8
Of which, the poor were to be reached by: Health subsidies, vouchers or cash transfers Increase in services used by the poor Reduction in insurance or user fees Increase in govt. budget allocation to poor
areas
2 1 2
1
4 2 4 2
3 3 2
1
5 5 3 2
2 1 0
1
8 4 0 4
NO 9 18 16 27 11 42 Source: IEG CAS review.
Table C.4: Prior Analytic Work, by Income Level
Was there prior analytic work?
LIC N = 51
LMIC N = 60
UMIC N = 26
No. % No. % No. % YES 23 45 27 45 10 39 Of which specific work is cited 21 41 22 37 9 35 NO 28 55 33 55 16 62 Source: IEG CAS review.
Table C.5: Setting of HNP Targets by Country Income
Were targets set in terms of HNP status?
LIC N = 51
LMIC N = 60
UMIC N = 26
No. % No. % No. % YES 26 51 16 7 4 15 Of which, only Govt. or PRSP target within CAS time frame was cited
7
14
1
2
1
4)
PARTIAL - only trends (i.e. upward or downward) were cited
2
4
5
8
2
8
NO 23 45 39 65 20 77 Of which targets were to be determined upon further analysis or collaboration with government/partners
0
0
4
7
0
0
Source: IEG CAS review.
Table C.6: Proposed HNP Activities, by Country Income
What Bank activities were proposed for HNP?
LIC N = 51
LMIC N = 60
UMIC N = 26
No. % No. % No. % LENDING 44 86 37 62 20 77 In addition to which, no new planned HNP lending, but HNP lending ongoing
4
8
13
22
1
4
AAA 31 61 33 55 14 54 Source: IEG CAS review.

Appendix C
36
Table C.7: CAS Acknowledgement of Contribution of HNP Outcomes to Other Development Objectives, by Income
Does the CAS acknowledge the contribution of HNP outcomes to other development objectives?
LIC N = 51
LMIC N = 60
UMIC N = 26
No. % No. % No. % Yes 17 33 7 12 1 4 Of which: Environment 6 12 1 2 0 0 Poverty Reduction 4 8 1 2 1 8 Education 4 8 2 3 0 0 Public Sector Reform 1 2 0 0 0 0 Agriculture 1 2 0 0 0 0 Labor 2 4 0 0 0 0 Transport/Infrastructure 1 2 0 0 0 0 No 34 67 53 88 25 96 Source: IEG CAS review.
Table C.8: CAS Acknowledgement of Other Sectors’ Contributions to HNP Outcomes, by Income Level
Does the CAS acknowledge the contribution of other sectors to HNP outcomes?
LIC N = 51
LMIC N = 60
UMIC N = 26
No. % No. % No. % Yes 44 86 49 82 14 54 Of which, sectors mentioned were: Water and Sanitation 36 72 25 41 7 27 Education 18 36 8 13 3 12 Environment 11 22 18 30 3 12 Transport/Infrastructure 13 26 13 21 2 8 Energy 7 14 3 5 0 0 Public Sector Reform 3 6 3 5 2 8 Social Security 0 0 3 5 2 8 Agriculture 4 8 1 2 0 0 Indigenous/Rural Development 1 2 1 2 2 8 Labor 0 0 1 2 0 0 Microfinance 1 2 0 0 0 Defense 0 0 1 2 0 0 Urban Development 1 2 4 7 0 0 No 10 16 12 21 12 46
Source: IEG CAS review.
Table C.9: Approaches to Multisectoral Lending, by Income
Multisectoral lending strategy for HNP outcomes
LIC N = 51
LMIC N = 60
UMIC N = 26
No. % No. % No % Any lending, of which: 35 69 31 52 7 27Parallel lending only 23 45 20 33 7 27 Multisectoral lending only 7 14 4 7 0 0 Combination (MS plus PL) 5 10 7 12 0 0 MS lending that was HIV-related 12 24 2 3 0 0 No lending, of which 16 31 29 48 19 73Multisectoral contribution acknowledged but no action proposed
9
18
15
25
9
35
No multisectoral contribution acknowledged 7 14 14 23 10 38 Source: IEG CAS review.

Appendix D
37
APPENDIX D: TABLES BY REGION
As the sampling of CASs was stratified by region, these tables do not require weighting. Table D.1: Prioritization of the HNP Sector by Region
Was HNP mentioned as a priority sector?
AFR
N = 31
EAP
N = 23
ECA
N = 29
LAC
N = 21
MNA N = 19
SAR
N = 14 No. % No. % No. % No. % No. % No. %
YES, of which: 29 94 19 83 23 79 18 86 12 63 11 79 Explicit 6 19 2 9 2 7 5 24 1 5 2 14 Implicit 23 74 17 74 21 72 13 62 11 58 9 64 NO, of which: 2 6 4 17 6 21 3 14 7 37 3 21 HNP issues other than health status mentioned
1
3
2
9
4
14
1
5
6
32
0
0
Source: IEG CAS review.
Table D.2: Prioritization of HNP Status, Overall and by Region
Was HNP status, prioritized?
AFR N = 31
EAP N = 23
ECA N = 29
LAC N = 21
MNA N = 19
SAR N = 14
No. % No. % No. % No. % No. % No. % YES 25 81 11 48 19 66 14 67 10 53 13 93
Specific HNP indicators: Mortality -IMR --MMR -Under-5 MR -Life expectancy
9
10 7 3
29 32 23 10
5 5 1 0
22 22 4 0
1 1 3 2
3 3
10 7
8 5 0 0
38 24 0 0
3 3 1 0
16 16 5 0
8 5 5 0
57 36 36 0
Disease-specific -HIV incidence or prevalence -TB incidence or fatality rate -STD incidence or prevalence -malaria incidence -other endemic disease incidence
11 3 1 1 0
35
10
3
3
0
1
0
0
2
0
4 0 0 9 0
4
6
0
0
1
14
21 0 0 3
2
0
0
0
0
10 0 0 0 0
0
0
0
0
0
0 0 0 0 0
5
1
2
0
1
36
7
14
0
7 Fertility -TFR -Crude birth rate -Population growth rate
3 0 0
10 0
0
1 1
0
4 4 0
0 0
0
0 0 0
0 0
0
0 0 0
0 0
0
0 0 0
4 0
1
29 0
7 Malnutrition
-Child malnutrition -Pregnant/nursing women or low birth weight
6 0
19
9
3
0
13 0
0
0
0 0
5
1
24 5
1
0
5 0
3
1
21
7
NO 6 19 12 52 10 35 7 33 9 47 1 7 Of which, intermediate HNP outcomes, outputs or inputs were prioritized
2
6
6
26
1
3
1
5
0
0
0
0 Source: IEG CAS review.

Appendix D
38
Table D.3: Focus on the Poor by Region
Was there a focus on health among the poor?
AFR N = 31
EAP N = 23
ECA N = 29
LAC N = 21
MNA N = 19
SAR N = 14
No. % No. % No. % No. % No. % No. % YES 23 74 21 91 19 66 15 71 12 63 11 79 Of which, the poor were identified as: Low income group Poor region Rural area Minority group
0 6 6 0
0
19 19 0
3 4 4 1
13 17 17 4
5 1 1 1
17 3 3 3
0 4 4 2
0 19 19 10
2 1 1 0
11 5 5 0
1 1 4 0
7 7 29 0
Of which, the poor were to be reached by: Health subsidies, vouchers or cash transfers Increase in services used by the poor Reduction in insurance or user Fees
Increase in gov’t budget allocation to poor areas
0
0
1
2
0 0 3
6
3
2
1
0
13
9
4
0
1
0
1
0
3
0
3
0
0
2
1
1
0
10
5
5
1
0
0
0
5
0
0
0
2
1
0
0
14
7
0
0
NO 8 26 2 9 10 35 6 29 7 37 3 21 Source: IEG CAS review.
Table D.4: Prior Analytic Work, Overall and by Region
Was there prior analytic work?
AFR N = 31
EAP N =2 3
ECA N = 29
LAC N = 21
MNA N = 19
SAR N = 14
No. % No. % No. % No. % No. % No. % YES 12 39 11 48 9 31 11 52 9 47 8 57 Of which specific work is cited Public expenditure review Health sector review Poverty assessment or PRSP Health sector strategy Survey data Social sector review Country economic review
11 1 2
4 0 0 0 2
35 3 6 0 0 0 6
9 4 0 3 3 2 1 0
39 17 0
13 13 9 4 0
8 2 3 1 0 1 0 0
28 7 10 3 0 3 0 0
10 2 0 5 1 0 2 0
48 10 0
24 5 0
10 0
7 1 1 2 0 0 2 0
37 5 5
10 0 0
10 0
7 1 0 4 0 0 3 0
50 7 0
29 0 0 21 0
NO 19 61 12 52 20 69 10 48 10 53 6 43 Source: IEG CAS review.

Appendix D
39
Table D.5: Setting of HNP Targets by Region
Were targets set in terms of HNP status, for within the CAS period?
AFR N =3 1
EAP N = 23
ECA N = 29
LAC N = 21
MNA N = 19
SAR N = 14
No. % No. % No. % No. % No. % No. % YES 17 55 5 22 3 10 9 43 1 5 11 79 Of which, explicit target for Govt. or PRSP only cited
6
19)
0
0
0
0)
0
0
0
0)
3
21
PARTIAL – Only “improvement” in certain health indicators cited
0
0
2
9
4
14
2
10
1
5
0
0
NO 14 45 16 70 22 76 10 48 17 89 3 21 Of which targets were to be determined upon further analysis or collaboration with government/partners
0
0
0
0
1
3
1
5
2
11
0
0
Source: IEG CAS review.
Table D.6: Setting of HNP Targets for the Poor, by Region
Were HNP outcome or access targets set for the poor?
AFR N = 31
EAP N = 23
ECA N = 29
LAC N =2 1
MNA N = 19
SAR N = 14
No. % No. % No. % No. % No. % No. % YES 7 23 4 17 2 7 5 24 2 11 1 7 Specific HNP status indicators:
Child malnutrition Pregnant/ nursing female
malnutrition HIV prevalence
1
0
0
3 0 0
1
1
0
4 0 0
0
0
0
0 0 0
1
1
1
5 5 5
0
0
0
0 0 0
0 0 0
0
0
0 Sub-total 1 1 2 2 0 0 3 3 0 0 0 0 Specific access indicators: Availability/ coverage of
services Household exp. on health Insurance coverage Utilization rate Vaccination rate Govt. budget alloc. Index for inequality
4 1 0 0 0 0 1
13 3 0 0 0 0 3
1 2 1 2 1 2 0
4 9 4 9 4 9 0
2 1 0 0 0 0 0
7 3 0 0 0 0 0
1 0 2 1 1 0 0
5 0
10 5 5 0 0
1 0 1 0 0 0 0
5 0 5 0 0 0 0
0 0 0 1 0 0 0
0 0 0 7 0 0 0
Sub-total 6 19 9 39 3 10 5 24 2 11 1 7 PARTIAL - only trends (i.e. upward or downward) were cited
1
3
4
17
7
24
0
0
0
0
3
21
NO 23 74 15 65 20 69 16 76 17 90 10 71 Of which targets were to be determined upon further analysis or collaboration with government/partners
0
0
1
4
1
3
1
5
0
0
0
0
Source: IEG CAS review.

Appendix D
40
Table D.7: Proposed HNP Activities, by Region
What Bank activities were proposed for HNP?
AFR N = 31
EAP N = 23
ECA N = 29
LAC N =2 1
MNA N = 19
SAR N = 14
No.
%
No.
%
No.
%
No.
%
No.
%
No.
%
LENDING 23 74 16 70 22 76 18 86 9 47 13 93 No lending planned, but there was ongoing HNP lending
3
10
1
4
5
17
3
14
7
37 0
0
AAA 17 55 15 65 10 35 13 62 13 68 10 71 Source: IEG CAS review.
Table D.8: CAS Acknowledgement of Other Sectors’ Contributions to HNP Outcomes, by Region
Does the CAS acknowledge the contribution of other sectors to HNP outcomes?
AFR N = 31
EAP N = 23
ECA N = 29
LAC N = 21
MNA N = 19
SAR N = 14
No. % No. % No. % No. % No % No. % YES 30 97 19 83 15 52 13 62 17 89 13 93 Of which, sectors mentioned were: Water and sanitation
22 71 10 43 10 34 7 33 9 47 10 71
Education 9 29 3 13 2 7 3 14 7 37 6 43 Environment 3 10 6 26 7 24 3 14 5 26 6 43 Transport/ infrastructure
4
13
1
4
5
17
1
5
4
21
7
50
Energy 2 6 1 4 2 7 0 0 1 5 2 14 Public sector reform
2 6 1 4 1 3 2 10 2 11 0 0
Social security 1 3 0 0 1 3 1 5 2 11 0 0 Agriculture 1 3 2 9 0 0 0 0 0 0 0 0 Indigenous/rural development
0
0
0
0
0
0
0
0
1
5
0
0
Labor 0 0 1 4 0 0 0 0 0 0 1 7 Microfinance 0 0 0 0 0 0 0 0 0 0 1 7 Defense 0 0 0 0 0 0 0 0 0 0 1 7 Urban development 0 0 1 4 0 0 1 5 0 0 1 7 NO 1 3 4 17 14 48 4 19 2 11 1 7 Source: IEG CAS review.

Appendix D
41
Table D.9: Multisectoral Lending Strategies, by Region
What was the multisectoral lending strategy?
AFR N = 31
EAP N = 23
ECA N = 29
LAC N = 21
MNA N = 19
SAR N = 14
No. % No. % No. % No. % No. % No. % Any lending, of which: 26 84 15 65 4 14 7 33 10 53 11 79 Parallel lending only 11 35 13 56 4 14 2 10 10 53 10 71 Multisectoral lending only 7 23 2 9 0 0 2 10 0 0 0 0 Both (MS plus PL) 8 36 0 0 0 0 3 14 0 0 1 7 MS lending that was HIV-related
12 39 0 0 0 0 1 5 0 0 1 7
No lending, of which 5 16 8 35 25 86 14 67 9 47 3 21Multisectoral contribution acknow-ledged but no action proposed
5
16
3
13
10
34
7
33
6
32
2
14
No multisectoral contribution acknowledged
0
0
5
22
15
52
7
33
3
16
1
7
Source: IEG CAS review.