IEEE-USA CONSULTANTS FEE SURVEY REPORTgmsystems.com/uploads/3/4/4/4/34441255/ieeeusa...IEEE-USA...
36
IEEE-USA CONSULTANTS 2015 EDITION FEE SURVEY REPORT
Transcript of IEEE-USA CONSULTANTS FEE SURVEY REPORTgmsystems.com/uploads/3/4/4/4/34441255/ieeeusa...IEEE-USA...

IEEE-USA CONSULTANTS
2 0 1 5 E D I T I O NFEE SURVEY REPORT

IEEE-USA CONSULTANTS FEE SURVEY REPORT | 2015 EDITION
2015 EDITION
The IEEE-USA Consultants Fee Survey Report, 2015 Edition, focuses on the compensation of U.S. members of IEEE.
IEEE prepared the summary report.
Published and Hosted by IEEE-USA.
Copyright © 2015 by IEEE-USA. All rights reserved. Printed in the United States of America
Edited by Georgia C. Stelluto, IEEE-USA Publishing Manager
Cover design and layout by Gregory O. Hill
This IEEE-USA publication is made possible through funding provided by a special dues assessment of IEEE members residing in the United States.
Copying this material in any form is not permitted without prior written approval from the IEEE.

3
IEEE-USA CONSULTANTS FEE SURVEY REPORT | 2015 EDITION
EXECUTIVE SUMMARYIEEE-USA has conducted surveys of the compensation of IEEE’s U.S. members since 1972. A separate survey, focusing on the compensation of consultants was implemented in 2002, and then reconnected in 2009. With the 2015 survey, data collection and survey distribution have, once again, been handled separately.
• In the summer of 2015, 10,479 U.S. IEEE members identified as consultants using the IEEE membership database were emailed an invitation to complete the 2015 Consultants Fee Survey. 1,072 respondents participated in the survey (response rate = 10.2%). All findings in this report represent only those who were identified as self-employed consultants; defined as the 632 individuals who indicated that 50%, or more, of their consulting hours came from working independently, with partners, or incorporated (from herein referred to as “consultants”).
• The age of the average (mean) consultant is 55 years old. As with IEEE’s membership in general, the vast majority of consultants are male (95%). Slightly fewer than nine in ten (88%) consultants self-identify as non-Hispanic white.
• On average, consultants have just over 21 years of experience in the profession, and about 15½ years of experience in consulting.
• Slightly below one in five consultants holds a Ph.D. Nearly half (47%) of consultants’ highest degree is a Masters, the largest portion being MSEE/MSCE holders (19%). About a third of consultants’ highest degree (33%) is a Bachelors; the majority of that group (a quarter of all respondents, at 25%) holding either a BSEE, or a BSCE degree.
• Nearly six in ten consultants (58.2%) indicated that their primary sector before becoming a fee-based consultant was Private Industry (excluding Utilities or Defense).
• Most consultants (66%) work out of a home office, and 34% work solely as an independent consultant. About two-thirds (66%) of consultants’ business comes from repeat clients.
• The median hourly rate charged by consultants is $150 reflecting an increase of $15 (11%) over the previous two years’ annual reports. About 1 in 5 consultants (20%, up 2 percentage points over last year) charge $200 or more per hour.
• Consistent with prior reports (excluding the 2014 report on 2013 data), median hourly wage increases with number of years of experience in consulting. The median rate is $155 for consultants with less than 15 years of professional experience and increases nearly 18% to $183 for those with 25-34 years of experience or more. Those with 35 years of experience or more charged an average of $167, up from $135 in the 2014 report and $150 in the 2013 report.
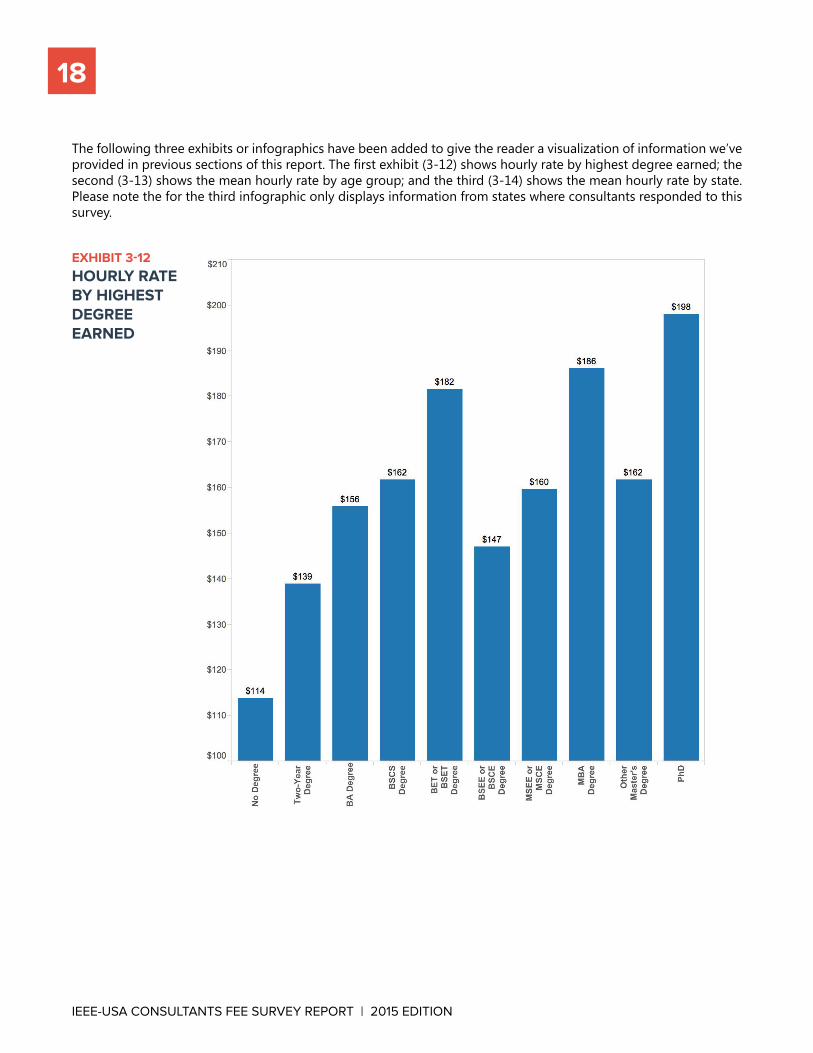
• When education levels are examined, those holding a PhD boast the highest median hourly rate at $198. Achieving a Master’s level of education is slightly above the mean rate, at $160 per hour.
• Sector also affects hourly rate. Those who work in Private Industry (other than utilities) charge $171, while those in utilities also charge $171.
• A number of lines of business had median incomes above the group mean, including Communications ($182), Computers ($198), Electrical/Electronic Manufacturing ($171), Electrical/Electronic Services ($179) and Utilities ($170).
• When looking at the United States in terms of Census Regions, the Pacific and Middle Atlantic regions have the highest median hourly fees, at $184 and $182, respectively. The medians for the remaining Census Regions were all below the group mean.
IEEE-USA CONSULTANTS
2 0 1 5 E D I T I O NFEE SURVEY REPORT
IEEE-USA CONSULTANTS FEE SURVEY REPORT | 2015 EDITION
CONTENTS
EXECUTIVE SUMMARY ...................................................................................................................................................................................3
1 INTRODUCTION 1.1 The Institute and IEEE-USA .................................................................................................................................................................5 1.2 The Survey .................................................................................................................................................................................................5
2 CONSULTANT PROFILE 2.1 Demographics ..........................................................................................................................................................................................62.2 Experience, Education and Specialties ...........................................................................................................................................72.3 Type of Work ..........................................................................................................................................................................................10
3 COMPENSATION3.1 Billings/Rates ..........................................................................................................................................................................................133.2 Detailed Results .....................................................................................................................................................................................14
4 METHODOLOGICAL NOTES4.1 Sampling and Response ...................................................................................................................................................................21
5 APPENDIX 5.1 Web Questionnaire ........................................................................................................................................................................... 23

5
IEEE-USA CONSULTANTS FEE SURVEY REPORT | 2015 EDITION
IEEE-USA CONSULTANTS
2 0 1 5 E D I T I O NFEE SURVEY REPORT
1. INTRODUCTION
1.1 THE INSTITUTE AND IEEE-USA
IEEE-USA promotes the career and public policy interests of more than 200,000 U.S. members of the IEEE, the world’s largest technical professional society, with a worldwide membership of more than 426,000 electrical, electronics, and computer engineers, and computer scientists, in more than 160 countries. The IEEE’s constitution defines its purpose as “scientific and educational... [and] professional, directed toward the advancement of the standing of the members of the professions it serves; means to this end include, but are not limited to, the conduct and publication of surveys and reports on matters of professional concern to the members...” Pursuant to these purposes, IEEE-USA has conducted, analyzed and distributed a Salary and Fringe Benefit Survey of IEEE members in the United States, since 1972, and for nine out of the past ten years, it has expanded the information gathered about industry consultants, specifically.
1.2 THE SURVEY
Invitations to the Web-based 2015 Consultants Survey were emailed in the summer of 2015, to 10,479 U.S. IEEE members. To create the sample, all records of higher-grade non-student members—Associate Members, Members, Senior Members, and Fellows—who consent to receive email communications from IEEE; and who indicated that their typical job function, responsibility, or title was consulting, were drawn from the member database. Members were emailed an online survey; all data for the 2015 survey was collected exclusively via the Internet.
A total of 1,072 usable responses to the survey were collected. All findings in this report represent only those who were identified as self-employed consultants; defined as the 632 individuals who indicated that 50% or more of their consulting hours came from working independently, with partners, or incorporated (from herein referred to as “consultants”). Estimates of proportions are subject to a maximum sampling error of ±3.8 percentage points at the 95% confidence level. Compensation results are reported in terms of percentiles, rather than proportions or means. Sampling error is not readily quantified for such statistics calculated from non-normal distributions.
As in any survey, results are somewhat less precise when the database is carved up into subgroups. Results based on rather small numbers of cases may still be of interest to IEEE’s U.S. members, and are provided in this report, along with suitable cautions for care in their use. The minimal reportable group is fixed at 25 cases, a threshold selected as a common and reasonable lower limit for large-sample statistical procedures.
EXHIBIT 1-1THE SURVEY DATA BASE
Sampling Frame:
10,479 In the summer of 2015, IEEE-USA invited 10,479 higher-grade members who consent to receive email communications; and are identified as someone whose typical job function, responsibility, or title was consulting in the IEEE member database, to participate in the Consultants Fee Survey.
Survey Data:
1,072 Data was collected through online surveys. Final number of responses was 1,072 (response rate =
10.2%).
Categories of Respondents:
632 Self-employed consultants (reported here) 440 Defined as not self- employed consultants
Trended Results. IEEE-USA has conducted annual surveys focusing on the compensation of consultants from 2002 to 2015 (except for 2003, 2005, and 2008). Other than 2009, all surveys were stand-alone surveys, and they were not a part of the overall Salary & Fringe Benefits Surveys.
In 2009, the two survey efforts were combined. As a result, the sampling frame and qualifying definition of “consultant” were changed from previous implementations. These changes may have affected survey results and caution should be used when making comparisons.

6
IEEE-USA CONSULTANTS FEE SURVEY REPORT | 2015 EDITION
2. CONSULTANT PROFILE
2.1 DEMOGRAPHICS
Age and Gender. More than nine in ten (94.9%) of consultants are male. The average consultant is just over 55 years old. However, consultants are trending younger: 6.3% are 70 or older, up about one percentage point, compared with last year’s report.
EXHIBIT 2-1AGE
Mean 55.3 yearsMedian 57.0 years70 and up 6.3%65-69 11.1%60-64 19.9%
55-59 23.0%50-54 13.6%45-49 11.1%
40-44 5.5%35-39 3.7%30-34 4.1%
25-29 1.7%Under 25 0.0% *Total may not equal 100%, due to rounding to the nearest whole number.
Number of cases: 632
Ethnicity and Citizenship. Close to nine in ten consultants (88%) describe themselves as non-Hispanic Whites. Asian, or Pacific Islander, is the largest minority group among consultants, at 4.3% (down slightly from last year). 3.6% identify as Hispanic (up one percentage point, from 2.6% last year), and 1% identify as African American (not Hispanic origin). Another 3.6% classify themselves as an ethnicity “other” than those provided in the survey question.
88.5% of respondents are U.S. citizens by birth. Another 8.4% are naturalized citizens, while 2.5% are permanent resident aliens (up from 1% last year). Less than one in one hundred (0.5%) are Visa holders.
EXHIBIT 2-2ETHNICITY
White (not Hispanic origin) 87.5%African American (not Hispanic origin) 0.9%Hispanic 3.6%
Asian or Pacific Islander 4.3%American Indian or Alaskan Native 0.2%Other ethnicity 3.6%
*Total may not equal 100%, due to rounding to the nearest whole number.
Number of cases: 632
EXHIBIT 2-3YEARS OF EXPERIENCE IN THE PROFESSION
Mean: 21.3 yearsMedian: 21 years
45 or more 1.6%40-44 6.2%35-39 9.7%
30-34 12.5%25-29 11.3%20-24 12.4%
15-19 11.6%10-14 15.7%5-9 10.5%Less than 5 8.6%
*Total may not equal 100%, due to rounding to the nearest whole number.
Number of cases: 632

7
IEEE-USA CONSULTANTS FEE SURVEY REPORT | 2015 EDITION
IEEE-USA CONSULTANTS
2 0 1 5 E D I T I O NFEE SURVEY REPORT
2.2 EXPERIENCE, EDUCATION, AND SPECIALTIES
Experience. Consultants had a mean of 21 years in the profession, consistent with the 2014 report. Men have, on average, nearly five years more experience than women. The mean years of experience for women was about 17 years, nearly five years lower than men, at 21 years, 9 months.
Consultants have an average of 15.5 years of experience in consulting. Further, just more than two in five (41%) have been consulting for 25 years, or more. Men have more years in consulting than women, with the female average having nine months’ less experience (14 years, 9 months). Although the median appears largely unchanged from last year, the proportion with 25 or more years’ experience declined steeply (down from 40.8% in 2014 to 18.4% in 2015). The middle categories all experienced large increases, as three in every five respondents had between five and 19 years’ consulting experience.
EXHIBIT 2-4YEARS OF CONSULTING EXPERIENCE
Mean: 15.5 yearsMedian 15 years
25 or more 18.4%20-24 11.2%15-19 20.8%
10-14 19.5%5-9 19.4%Less than 5 10.7%
*Total may not equal 100%, due to rounding to the nearest whole number.
Number of cases: 632
Education and Certification. Nearly a fifth of consultants hold a Ph.D., or equivalent (19.6%); while 42.7% of consultants’ highest degree is a Master’s. 31.2% of consultants’ highest degree is a Bachelor’s, and the majority have either a BSEE, or a BSCE (25.4%).
Although professional registration is a prerequisite for practice as an engineer in many countries in the world, registration has not been essential for most EEs in the United States. Currently, 29.6% of consultants are registered professional engineers (P.E.s). This percentage is up slightly from the 2014 report (28.8%).

8
IEEE-USA CONSULTANTS FEE SURVEY REPORT | 2015 EDITION
EXHIBIT 2-5HIGHEST DEGREE HELD
Number of cases: 632
NOTE: Within levels, degrees were ranked as they appear in the chart, left to right. For example, if a member had both an MSEE and an MBA, the MBA was counted as the higher degree. Distinctions within broad degree levels, e.g., among different kinds of Master’s degrees, are necessarily somewhat arbitrary; the important differences are between the Bachelor’s, Master’s, and Ph.D. levels.
Technical Specialties. To better understand their areas of expertise, consultants were asked to select all the technical specialties (of 91 listed), in which they offer consulting services. The top five were each mentioned by a quarter or more consultants: Systems Engineering (35.4%); Project Management (31.5%); Electrical Power Systems (28.6%); Software Development, Application and Management (25.3%); and Management (24.9%). Exhibit 2-6 shows the percent of respondents who said that they offer consulting services in select technical specialties. Respondents were able to select multiple technical specialties, so the numbers add up to well above 100%.

9
IEEE-USA CONSULTANTS FEE SURVEY REPORT | 2015 EDITION
IEEE-USA CONSULTANTS
2 0 1 5 E D I T I O NFEE SURVEY REPORT
EXHIBIT 2-6TECHNICAL SPECIALTIES
*Total may not equal 100%, due to rounding to the nearest whole number.Number of cases: 632
Acoustics .................................. 4.7%Aerospace ................................. 9.8%Analog Design ......................... 11.8%Antenna ................................... 7.5%Application Software .................17.6%ASIC......................................... 4.5%Automation ............................. 14.3%Broadcast, Radio and Television ................................. 4.4%Business Application & Management ............................. 9.6%Business Planning.................... 12.0%C++ ....................................... 13.1%C## ......................................... 5.1%CAD ......................................... 7.3%Circuits and Printed Circuit Design .................................... 13.2%Client Server ............................. 7.3%Communications ...................... 19.5%Computers Engineering ............ 14.5%Consumer Electronics .............. 13.9%Databases and Data Management ........................... 11.8%Defense .................................. 11.5%Diagnostic Software ................... 6.6%Digital Design ......................... 10.5%DSP .......................................... 8.5%Electrical Automotive ................. 5.2%Electrical Power Generation, Transmissions & Distributions ... 22.6%Electrical Power Quality, Reliability and Safety ............... 20.0%Electrical Power Systems .......... 28.6%Electrical Power, Transformers, Switchgear and Controls .......... 21.4%
Electro-Mechanical .................. 12.5%Electromagnetics, including EMI, EMC and EMP ........................... 9.8%Electronic Components ...............7.7%Embedded Systems, Hardware, Software and Controls ..............15.7%Expert Witness ........................ 21.6%Failure Analysis ....................... 15.5%Fiber Optics .............................. 6.4%Financial ................................... 4.7%Forensic Engineer .................... 10.3%FPGA ........................................ 7.5%GaAs/PIC Design ....................... 0.2%GPS .......................................... 2.8%Hardware, General .................. 15.2%Human Factors .......................... 6.1%IC Design ................................. 4.9%Illumination/Lighting ................. 9.2%Instrumentation and Controls ... 18.5%Languages ................................ 1.2%Large Systems .......................... 9.4%Lasers ...................................... 3.7%Linux ........................................ 9.6%Management ........................... 24.9%Manufacturing ......................... 11.3%Marketing ................................. 8.7%Materials and Material Handling .. 3.5%Mechanical ................................ 9.4%Medical ..................................... 9.6%Microprocessors ...................... 12.0%Microwave ................................ 7.0%Mobile Applications/Systems ...... 7.1%Motors ...................................... 8.7%Networks - LAN/WAN - Other ... 15.9%
New Product Development ....... 19.3%Object Oriented Design .............. 8.5%Oceanic .................................... 1.7%Optics....................................... 5.4%Packaging ................................. 3.1%Peripherals ................................ 3.0%Power Supply Design ................. 8.9%Process Controls ...................... 12.9%Project Management ................ 31.5%Quality and ISO-Related ............ 6.4%Radar ....................................... 4.4%Reliability and Availability ........... 8.7%RF Circuit Design ....................... 6.1%RF Systems ............................. 10.3%Semiconductor Fab .................... 3.3%Servo/Control Systems ............... 6.3%Signal Conditioning .................... 5.4%Silicon IC Design ....................... 2.6%Simulation and Modeling .......... 14.1%Software Development, Application & Management ...... 25.3%Systems Engineering ............... 35.4%Technical Writing ..................... 22.3%Telecom and Telephone ........... 12.0%Telemetry ................................. 6.3%Test Engineering, Equipment or Services ...............................17.6%Testability ................................. 4.5%Thermodynamics ....................... 2.4%Training .................................. 15.5%Troubleshooting ...................... 14.1%UNIX ........................................ 6.6%Wireless Networks, Systems, Instrumentation ...................... 15.3%

10
IEEE-USA CONSULTANTS FEE SURVEY REPORT | 2015 EDITION
2.3 TYPE OF WORK
Work Setting. Consistent with the 2014 report, the work setting for about two-thirds of consultants (66.1%) is a home office.
Just slightly over half (51.4%, up from 46% in 2014) carry professional liability (errors & omissions) insurance.
37.8% percent worked solely as an independent consultant in calendar year 2014, while 47.3% did not do any independent consulting that year, performing their consulting hours with partners, as a contract employee ( job shopping), as an employee of another company (not their own), or incorporated.
As a group, when their 2014 consulting hours are allotted to each of these business structure categories, the average amount of time spent is mostly as an independent (45.3%, consistent with last year); and just over a quarter of their hours were considered incorporated (25.5%). Little time, overall, was spent with partners (6.4%); and even less as a contract employee (5.3%). Consistent with last year’s report, the percentage of hours as an employee of someone else’s company held steady at 16.6%, but is overall up from 12% in 2013, and far above the 1% reported in 2012).
EXHIBIT 2-7PERCENTAGE OF HOURS BY CATEGORY (MEAN SUMMARY)
An independent 45.3%With partners 6.4%Incorporated 25.5%As a contract employee (job shopping) 5.3%As an employee of another company (not your own)
16.6%
TOTAL 99.1%
*Total may not equal 100%, due to rounding to the nearest whole number.
Number of cases: 632
Basis for Earnings. The majority of the average consultants’ business (56.8%) comes from repeat clients. But having outside connections is important, as significant earnings also come from referrals from clients and friends (12.2%), and contacts made by networking (10.8%).
EXHIBIT 2-8PERCENTAGE OF EARNINGS (MEAN SUMMARY)
Repeat business from your clients 57.8%Client contacts made by networking 13.4%Referrals from clients and friends 11.3%
Contacts through IEEE directories or databases
2.0%
Print advertising 1.6%Cold calls 1.0%A marketing or referral service with a fee 0.4%A previous employer 7.5%Other 4.9%
TOTAL 99.9%
*Total may not equal 100%, due to rounding to the nearest whole number.
Number of cases: 632

11
IEEE-USA CONSULTANTS FEE SURVEY REPORT | 2015 EDITION
IEEE-USA CONSULTANTS
2 0 1 5 E D I T I O NFEE SURVEY REPORT
Client characteristics. The majority of consultants (58.2%) work with private, non-defense companies; when defense-related firms are added in, the private industry share rises to nearly 70%. Among other sectors, no other one was indicated by more than 13.0% of respondents.
EXHIBIT 2-9SECTOR
Private Industry: Defense 10.7%Private Industry: Other than Defense or Utilities
58.2%
Utilities 13.0%
Federal Government: Defense 3.5%Federal Government: Other than Defense 2.6%State or Local Government 1.6%
Educational Institution 2.9%Non-Profit Institution: Except Education 0.9%Other Sector 6.6%
TOTAL 100%
*Total may not equal 100%, due to rounding to the nearest whole number.
Number of cases: 632
Reflective of the membership as a whole, consultants as a group worked in a variety of lines of business before becoming consultants, with Consulting (13.3%) being the most represented. Electrical/Electronic Manufacturing (12.8%) and Utilities (12.6%) rounded out the top three lines of business.
EXHIBIT 2-10LINES OF BUSINESS
Aerospace 8.0%Automotive 1.7%Communications 8.7%Computers 7.1%Consulting 13.3%Defense (Except Aerospace) 6.6%
Education 2.2%Electrical/Electronic Manufacturing 12.8%Electrical/Electronic Services 4.5%Medical 3.6%Metals 0.2%Petroleum/Chemical 3.1%
Transportation 1.4%Utilities 12.6%Other Line of Business 14.2%
TOTAL 100%
*Total may not equal 100%, due to rounding to the nearest whole number.
Number of cases: 632

12
IEEE-USA CONSULTANTS FEE SURVEY REPORT | 2015 EDITION
Fields of Work. To better understand the types of work in which they are spending their time, consultants were asked to estimate the percentage of their consulting hours spent in each of several fields. On average, the most time was spent in Power and Software, at 20.9% and 14.8%, respectively.
These averages present an abstract profile of all members, rather than any one individual. Of the 16 fields listed, all but one (Power) show less than 20% of consultants’ allotted time.
EXHIBIT 2-11PERCENTAGE OF HOURS BY FIELD (MEAN SUMMARY)
Hardware 8.8%Software 14.8%Management 5.7%
Marketing 1.4%Manufacturing 3.3%ICs and devices 2.5%RF 5.0%Telecom 5.0%IT 4.8%Computers 1.5%System Engineering 11.7%Power 20.9%
Quality and Reliability 2.3%Control Systems 2.8%Expert Witness & Forensics 5.2%
Other 4.1%
TOTAL 99.8%
*Total may not equal 100%, due to rounding to the nearest whole number.
Number of cases: 632

13
IEEE-USA CONSULTANTS FEE SURVEY REPORT | 2015 EDITION
IEEE-USA CONSULTANTS
2 0 1 5 E D I T I O NFEE SURVEY REPORT
3. COMPENSATION
3.1 BILLINGS/RATES
Billable Time. Consultants can choose to charge for their services in a variety of ways. Billing at an hourly rate is most common. Just under three-fourths (72.2%) of consultants’ time was billed that way, on average; and just over half of all consultants (50.3%) billed only that way.
Quoting a fixed price is the next most common billing method, which accounted for an average of 18.3% of their time in 2014. Only a small part of their consulting time (5.1% on average) was charged using a daily rate.
On average, 16.6% are having trouble getting paid. This percentage is up compared to 13.0% in the 2013 report, but down from 18.0% in the 2014 report.
EXHIBIT 3-1BILLINGS PERCENTAGE (MEAN SUMMARY)
Hourly 74.6%Daily 5.3%Fixed price 19.9%
TOTAL 99.8%
*Total may not equal 100%, due to rounding to the nearest whole number.
Number of cases: 632
The average consultant billed 30 hours per week in calendar year 2014. This number is below the standard 40 hours per week, but remains unchanged from the 2014 report.
Because they may not have all worked the same number of hours over the course of that year, the detailed compensation results summarized in the next section will focus on current hourly rates (rather than 2014 gross income), to more accurately and fairly compare earnings.
Hourly Rate. Consultants were asked to indicate their current hourly rate for consulting, by converting other rates to an equivalent hourly rate, and using the average of the most common rate, if their rate varied. According
to this method, the typical (median) consultant indicated $150 per hour. Medians (and other percentiles) are the preferred measure for most analyses of income, because they are not affected by extreme cases, as means would be.
EXHIBIT 3-2BILLABLE HOURS PER WEEK
Mean: 30 hoursMedian: 30 hours
50 or more 7.3%40 - 49 22.1%30 - 39 25.3%20 - 29 24.8%10 - 19 12.5%Less than 10 8.0%
TOTAL 100%
*Total may not equal 100%, due to rounding to the nearest whole number.
Number of cases: 632
EXHIBIT 3-3HOURLY RATE
Mean: $166Median: $150
$200 per hour or more 27.0%$175 - $199 8.2%$150 - $174 17.1%$125 - $149 15.0%$100 - $124 15.6%$75 - $99 10.8%Less than $75 per hour 6.3%
TOTAL 100%
*Total may not equal 100%, due to rounding to the nearest whole number.
Number of cases: 632

14
IEEE-USA CONSULTANTS FEE SURVEY REPORT | 2015 EDITION
3.2 DETAILED RESULTS
Where sufficient responses were received (n ≥ 25), five compensation statistics, including the median, are presented in this section, using the reported hourly rate data:
• lowest decile (10% earn less)
• lower quartile (25% earn less)
•median (50% earn less)
• upper quartile (75% earn less)
• highest decile (90% earn less)
These statistics are shown against many different characteristics (e.g., experience, education, types of clients and location), to help understand what may drive variations in rates among consultants.
The Effect of Experience More experience, as an example, could logically translate to an increase in hourly
rate. However, the 2015 findings show the possibility of some flattening across experience levels. The typical consultants, who have been in their profession for less than 15 years, report a lower rate than those with more experience; their median hourly rate is $155 per hour. Those with 25-34 years of experience report the highest median hourly rate. At $183, it is up substantially from $140 in the 2014 report.
An upward trend exists when the data focuses on the number of years as a consultant (rather than in the profession). The typical rate begins at $151 per hour, for those with less than five years of consulting experience (up from $130 in the 2014 report); and increases to $185 per hour, after 25 years. The latter figure reflects a $45 increase in the median earnings, for those with that level of consulting experience. The median for those with 25 or more years in the 2014 report was $140 per hour.
EXHIBIT 3-4HOURLY RATE BY YEARS OF EXPERIENCE IN THE PROFESSION
Number of Cases
Lowest Decile
Lower Quartile Median Upper
QuartileHighest
Decile
All respondents 630 $80 $107 $166 $200 $275
Less than 15 years 219 75 100 155 175 250
15 – 24 years 151 80 105 162 200 250
25 – 34 years 150 80 123 183 205 297
35 or more years 110 84 105 167 200 270
EXHIBIT 3-5HOURLY RATE BY YEARS OF CONSULTING EXPERIENCE
Number of Cases
Lowest Decile
Lower Quartile Median Upper
QuartileHighest
Decile
All respondents 630 $80 $107 $166 $200 $275
Less than 5 67 65 90 151 200 275
5-9 121 80 110 163 200 250
10-14 122 75 100 158 180 255
15-19 130 85 110 169 200 250
20-24 70 80 100 162 185 280
25 or more 115 90 120 185 225 350

15
IEEE-USA CONSULTANTS FEE SURVEY REPORT | 2015 EDITION
IEEE-USA CONSULTANTS
2 0 1 5 E D I T I O NFEE SURVEY REPORT
Education and Hourly Rate. Education is another factor that was examined. In this case, those holding a Ph.D. have a $32 advantage in their median hourly rate (at $198). Those with an MSEE or MSCE had an average rate of $160, up $15 over the 2014 report; and up $35 from the 2013 report. All others with a Master’s degree
averaged $162 (up $17 compared to last year’s report).
Compared to the 2014 report, which showed a $21 per hour advantage for those with a Professional Engineer’s (P.E.) license, the advantage has disappeared. Median hourly wages for those with a P.E. license ($165), and those without ($166), are virtually identical.
EXHIBIT 3-6HOURLY RATE BY HIGHEST DEGREE HELD
Number of Cases
Lowest Decile
Lower Quartile Median Upper
QuartileHighest
Decile
All respondents 630 $80 $107 $166 $200 $275
Ph.D. 99 90 122 198 250 350
MBA 53 85 133 186 245 280
MSEE or MSCE 94 85 110 160 200 235
Other Master's 68 80 105 162 180 250
BSEE or BSCE 128 75 100 147 175 225
EXHIBIT 3-7HOURLY RATE BY P.E. LICENSURE
Number of Cases
Lowest Decile
Lower Quartile Median Upper
QuartileHighest
Decile
All respondents 630 $80 $107 $166 $200 $275
Licensed P.E. 184 90 123 165 200 255
Not Licensed 409 80 100 166 200 280

16
IEEE-USA CONSULTANTS FEE SURVEY REPORT | 2015 EDITION
Variations by Sector and Line of Business. The following exhibits show variations in hourly rate based upon select characteristics of consultants’ clients. Those working with clients in the Utilities industry and Private industry (other than defense or utilities) report the highest median hourly rates (both at $171).
Among the lines of business with sufficient response, the most lucrative for consultants to work in are Computers and Communications (with median hourly rates of $198 and 182, respectively). In the case of Communications, this represents an increase of $32 over the 2014 report (The median hourly wage for consultants was reported at $150).
EXHIBIT 3-8HOURLY RATE BY SECTOR
Number of Cases
Lowest Decile
Lower Quartile Median Upper
QuartileHighest
Decile
All respondents 630 $80 $107 $166 $200 $275
Private Industry: Defense 62 85 110 145 174 200
Private Industry: Other than Defense or Utilities 336 85 105 171 200 280
Utilities 75 98 125 171 200 280
Other 38 50 105 158 200 250
EXHIBIT 3-9HOURLY RATE BY LINE OF BUSINESS
Number of Cases
Lowest Decile
Lower Quartile Median Upper
QuartileHighest
Decile
All respondents 630 $80 $107 $166 $200 $275
Aerospace 46 80 120 151 175 210
Automotive - - - - - -
Communications 50 88 110 182 227 325
Computers 41 93 125 198 225 445
Consulting 77 80 120 163 183 275
Defense (except Aerospace) 38 75 100 141 156 200
Electrical/Electronic Manufacturing 74 90 105 171 200 270
Electrical/Electronic Services 26 100 125 179 225 325
Medical - - - - - -
Metals - - - - - -
Petroleum/Chemical - - - - - -
Transportation - - - - - -
Utilities 73 98 125 170 200 250
Other 82 60 100 164 200 280

17
IEEE-USA CONSULTANTS FEE SURVEY REPORT | 2015 EDITION
IEEE-USA CONSULTANTS
2 0 1 5 E D I T I O NFEE SURVEY REPORT
Hourly Rate by Location. When looking at the United States in terms of Census Regions, the Middle Atlantic and West South Central regions have the highest medians (at $194 and $193, respectively). The New England region has a high average as well, at $183.
When examined by the location of the largest number of their clients within the United States, those whose clients are primarily in the Pacific or Middle Atlantic regions have the highest medians, at $184 and $182, respectively.
EXHIBIT 3-10HOURLY RATE BY OFFICE LOCATION, U.S. CENSUS REGION
Number of Cases
Lowest Decile
Lower Quartile Median Upper
QuartileHighest
Decile
All respondents 630 $80 $107 $166 $200 $275
East North Central 36 50 95 149 172 300
East South Central - - - - - -
Middle Atlantic 32 100 130 194 230 315
Mountain 45 68 95 133 160 205
New England 28 80 105 183 200 400
Pacific 78 93 115 164 200 225
South Atlantic 61 84 120 163 193 235
West North Central - - - - - -
West South Central 32 75 98 193 262 300
EXHIBIT 3-11HOURLY RATE BY LOCATION OF LARGEST NUMBER OF CLIENTS, U.S. CENSUS REGION
Number of Cases
Lowest Decile
Lower Quartile Median Upper
QuartileHighest
Decile
All respondents 630 $80 $107 $166 $200 $275
East North Central 56 50 90 153 180 275
East South Central - - - - - -
Middle Atlantic 60 100 125 182 200 315
Mountain 51 75 100 141 165 240
New England 39 75 100 144 150 200
Pacific 146 100 125 184 215 300
South Atlantic 97 75 110 153 176 250
West North Central - - - - - -
West South Central 55 78 100 156 180 265
Outside the United States - - - - - -
Census Regions: New England - New Hampshire, Vermont, Massachusetts, Rhode Island, Connecticut; Middle Atlantic - New York, Pennsylvania, New Jersey; East North Central - Wisconsin, Michigan, Illinois, Indiana, Ohio; West North Central - Missouri, North Dakota, South Dakota, Nebraska, Kansas, Minnesota, Iowa; South Atlantic - Delaware, Maryland, District of Columbia, Virginia, West Virginia, North Carolina, South Carolina, Georgia, Florida; East South Central - Kentucky, Tennessee, Mississippi, Alabama; West South Central - Oklahoma, Texas, Arkansas, Louisiana; Mountain - Idaho, Montana, Wyoming, Nevada, Utah, Colorado, Arizona, New Mexico; Pacific - Alaska, Washington, Oregon, California, Hawaii
18
IEEE-USA CONSULTANTS FEE SURVEY REPORT | 2015 EDITION
The following three exhibits or infographics have been added to give the reader a visualization of information we’ve provided in previous sections of this report. The first exhibit (3-12) shows hourly rate by highest degree earned; the second (3-13) shows the mean hourly rate by age group; and the third (3-14) shows the mean hourly rate by state. Please note the for the third infographic only displays information from states where consultants responded to this survey.
EXHIBIT 3-12HOURLY RATE BY HIGHEST DEGREE EARNED

19
IEEE-USA CONSULTANTS FEE SURVEY REPORT | 2015 EDITION
IEEE-USA CONSULTANTS
2 0 1 5 E D I T I O NFEE SURVEY REPORT
EXHIBIT 3-13MEAN HOURLY RATE BY AGE GROUP

20
IEEE-USA CONSULTANTS FEE SURVEY REPORT | 2015 EDITION
EXHIBIT 3-14MEAN HOURLY RATE BY STATE

21
IEEE-USA CONSULTANTS FEE SURVEY REPORT | 2015 EDITION
IEEE-USA CONSULTANTS
2 0 1 5 E D I T I O NFEE SURVEY REPORT
4. METHODOLOGICAL NOTES
4.1 SAMPLING AND RESPONSE
Invitations to the Web-based 2015 Consultants Fee Survey were emailed in the summer of 2015 to 10,479 IEEE members. To create the sample, all records of higher-grade members—Associate Members, Members, Senior Members and Fellows—who consent to receive email communications from IEEE, who indicated that their typical job function, responsibility, or title was consulting, were drawn from the member database. As noted in Exhibit 1-1, 10.2% of those invited responded, a total of 1,072 were usable returns.
All findings in this report represent only those who were identified as self-employed consultants; defined as the 632 individuals who indicated that 50%, or more, of their consulting hours came from working independently, with partners, or incorporated. Estimates of proportions are subject to a maximum sampling error of ±3.8 percentage points, at the 95% confidence level. Compensation results are reported in terms of percentiles, rather than proportions or means. Sampling error is not readily quantified for such statistics calculated from non-normal distributions.
As in any survey, results are somewhat less precise when the database is carved up into subgroups. Results based on rather small numbers of cases may still be of interest to IEEE’s U.S. members, and are provided in this report, along with suitable cautions for care in their use. The minimal reportable group is fixed at 25 cases, a threshold selected as a common and reasonable lower limit for large-sample statistical procedures.
The descriptive statistics reported include percentages; measures of central tendency, such as means and medians; and measures of dispersion, such as ranges and percentiles. Percentages in tabulations are rounded to the ones place, in recognition of the larger-magnitude effects of sampling error. Means—arithmetic averages—appear only occasionally, as they are not a preferred measure for analysis of income. Means tend to be biased high, because of the undue influence of very large values at the top of a distribution.
Medians and other percentiles are points that divide a ranked distribution into equal-sized groups. The median divides a distribution in half; quartiles divide it into quarters; deciles divide it into tenths; percentiles divide it into hundredths. The median is also the second quartile, the fifth decile, and the 50th percentile. Interpolated values are used, if necessary. For example, if the number of cases in a distribution is even, the median is the value half-way between the two cases, in the middle.

5. APPENDIX
5.1 WEB QUESTIONNAIRE
2015 CONSULTANTS FEE SURVEY
Thank you for choosing to participate in the 2015 IEEE-USA Consultants Fee Survey! This survey will take a few minutes to complete. If you need to leave the survey before completing it, you may return to the form by clicking on the link in the email invitation you received to participate in the survey. Please be assured that your personal information is confidential. None of your individual data or contact information will be shared with any third party, nor used by IEEE-USA, except in connection with the writing of the IEEE-USA Consultants Fee Survey Report.
If you have question about or problems with the survey, please contact: Daryll Griffin [email protected] Program Manager for Careers & Innovation Programs IEEE-USA 2001 L Street, NW, Suite 700 Washington, DC 20036-4928 (202) 530-8337 Direct www.ieeeusa.org
---------------------------------------------------------------------------------------------------------------------------------------------------------
q1Did you perform any work or services as a fee-based consultant during calendar year 2014?
� Yes� No
q1aDid half, or more, of your personal earned income in calendar year 2014 come from fee-based consulting?
� Yes� No

q2How many years of professional and/or managerial experience did you have in electrical, electronics and computer engineering, or related technical fields, before you started fee-base consulting? Do not include undergraduate or graduate school as years of experience.
Please round to the nearest whole number; enter 0 if you have six months or less experience.
� 0� 1 � 2� 3� 4� 5� 6� 7� 8� 9� 10� 11� 12� 13� 14� 15� 16� 17� 18� 19
� 20� 21� 22� 23� 24� 25� 26� 27� 28� 29� 30� 31� 32� 33� 34� 35� 36� 37� 38
� 39� 40� 41� 42� 43� 44� 45� 46� 47� 48� 49� 50� 51� 52� 53� 54� 55� 56� 57
� 58� 59� 60� 61� 62� 63� 64� 65� 66� 67� 68� 69� 70� 71� 72� 73� 74� 75
q3How many years of consulting experience have you had?
Please round to the nearest whole number; enter 0 if you have six months, or less, experience.
� 0� 1� 2� 3� 4� 5� 6� 7� 8� 9� 10� 11� 12� 13� 14� 15� 16� 17� 18� 19
� 20� 21� 22� 23� 24� 25� 26� 27� 28� 29� 30� 31� 32� 33� 34� 35� 36� 37� 38
� 39� 40� 41� 42� 43� 44� 45� 46� 47� 48� 49� 50� 51� 52� 53� 54� 55� 56� 57
� 58� 59� 60� 61� 62� 63� 64� 65� 66� 67� 68� 69� 70� 71� 72� 73� 74� 75

q4Please indicate what percentage of your consulting hours was performed for each of the categories below during 2014.
Please fill in each blank with a whole number. The total should add to 100%.
% An independent ______________________________
% With partners ______________________________
% Incorporated ______________________________
% As a contract employee (job shopping) ______________________________
% As an employee of another company (not your own) ______________________________
q5What percentage of your time consulting do you bill in each of these ways?
Please fill in each blank with a whole number. The total should add to 100%.
% hourly ______________________________
% daily ______________________________
% fixed price ______________________________q6During 2014, what was your average number of billable hours per week, as a consultant?
Please fill in a number below; 0 if none
q7What is your current hourly rate for consulting? Please convert other rates to an equivalent hourly rate. If your rate varies, select the average, or most common, rate.
Please enter whole numbers, without a dollar sign, or a comma.
$ per hour ______________________________
q7aHow are you usually compensated for any travel time, overnight travel, or extra expenses?
(Please select all that apply.)
� All travel time or extra hours are billed at full rate� All travel time or extra hours are billed at a discounted rate� Per diem for meals and hotel at IRS tables rate� Per diem for meals and hotel at negotiated rate� Paid mileage at IRS published rate� Paid mileage at negotiated rate� Not paid (must bid an all-inclusive rate)� Not applicable

q7bIf you have different rates for different consulting services, what are they?
Please list up to four different types of consulting services you offer, and their corresponding hourly rates, in USD.
q7b2 - Hourly Rate q7b1 - Service Type
$ per hour (1) ______ ______
$ per hour (2) ______ ______
$ per hour (3) ______ ______
$ per hour (4) ______ ______
q8What is the net income that you received in 2013 from consulting?
Please enter whole numbers, without a dollar sign, or a comma.
$ ______________________________
q9Are you having trouble getting paid?
� Yes� No
q10What was your IEEE Membership Grade, as of 1 January 2015 (or as of the date you joined, if you joined after 1 January 2015)?
(Note: “Life” is not a membership grade.)
� Fellow� Senior Member�Member� Associate Member� Student Member� Graduate Student Member
q11As of 1 January 2015, what degrees did you hold?
Select all that apply.
� No Degree� Two-Year Degree� BA Degree� BET or BSET Degree� BSCS Degree� BSEE or BSCE Degree�MSEE or MSCE Degree� Other Master’s Degree�MBA Degree� Law Degree� PhD or equivalent
q12Do you have a Professional Engineer’s (P.E.) license?
� Yes� No

q13What is your Gender?
�Male� Female
q14As of 1 January 2014, what was your age?
q15What is your ethnicity?
�White (not Hispanic origin)� African American (not Hispanic origin)� Hispanic� Asian or Pacific Islander� American Indian or Alaskan Native� Other ethnicity, please specify____________
q16As of 1 January 2014, please indicate your citizenship status.
� Citizen of the USA, by birth� Citizen, by naturalization� Permanent resident alien� Visa Holder, H-1� Visa Holder, other, please specify____________
q17Please enter the 5-digit zip code for your work location, or your primary employment (or self-employment) in calendar year 2014. If no such code applies, enter the zip code for your primary 2015 residence.
q18Is your office in your home?
� Yes� No
q19Do you carry professional liability (errors & omissions) insurance?
� Yes� No
q20How many different clients have you worked for during the calendar year of 2014?

q21How do you get your consulting business? Estimate the percentage of total dollars earned from each of the fol-lowing.
Please fill in each blank with a whole number. The total should add to 100%.
% Repeat business from your clients ______________________________
% Client contacts made by networking ______________________________
% Referrals from clients and friends ______________________________
% Contacts through IEEE directories/databases ______________________________
% Print advertising ______________________________
% Cold calls ______________________________
% A marketing or referral service with a fee ______________________________
% From previous employer(s) ______________________________
% Other ______________________________
q22Estimate the percentage of consulting hours that you do in the following fields.
Please fill in each blank with a whole number; 0 if none. The total should add to 100%.
% Hardware ______________________________
% Software ______________________________
% Management ______________________________
% Marketing ______________________________
% Manufacturing ______________________________
% ICs and devices ______________________________
% RF ______________________________
% Telecom ______________________________
% IT ______________________________
% Computers ______________________________
% System Engineering ______________________________
% Power ______________________________
% Quality and Reliability ______________________________
% Control Systems ______________________________
% Expert Witness & Forensics ______________________________
% Other ______________________________

q23Check the one response that best describes the sector you worked in, before becoming a fee-based consultant.
� Private Industry: Defense� Private Industry: Other than Defense or Utilities� Utilities� Federal Government: Defense� Federal Government: Other than Defense� State or Local Government� Educational Institution� Non-Profit Institution: Except Education� Other Sector (please specify) ____________
q24Check the one response that best describes the line of business of your primary employer(s), before you became a fee-based consultant.
� Aerospace� Automotive� Communications� Computers� Consulting� Defense (except Aerospace)� Education� Electrical/Electronic Manufacturing� Electrical/Electronic Services�Medical�Metals� Petroleum/Chemical� Transportation� Utilities� Other (please specify) ____________

q25Please select all of the technical specialties listed below, in which you offer consulting services.
Select all that apply.
� Acoustics� Aerospace� Analog Design� Antenna� Application Software� ASIC� Automation� Broadcast, Radio and Television� Business Application & Management� Business Planning� C++� CAD� Circuits and Printed Circuit Design� Client Server� Communications� Computers� Consumer Electronics� Databases and Data Management� Diagnostic Software� Digital Design� DSP� Electrical Power Generation, Transmissions & Amp,
Distributions� Electrical Power Quality, Reliability and Safety� Electrical Power Systems� Electrical Power, Transformers, Switchgear and Controls� Electro-Mechanical� Electromagnetics, including EMI, EMC and EMP� Electronic Components� Embedded Systems, Hardware, Software and Controls� Expert Witness� Failure Analysis� Fiber Optics� Financial� Forensic Engineer� FPGA� GPS� Hardware, General� Human Factors� IC Design� Illumination/Lighting� Instrumentation and Controls� LAN/WAN� Languages� Large Systems� Lasers
� Linux�Management�Manufacturing�Marketing�Materials and Material Handling�Mechanical�Medical�Microprocessors�Microwave�Military�Motors�MS Windows� Networks - LAN/WAN - Other� New Product Development� Object Oriented� Oceanic� Optics� Packaging� Peripherals� Power Supply Design� Process Controls� Project Management� Quality and ISO-Related� Radar� Reliability and Availability� RF� Semiconductor Fab� Servo/Control Systems� Signal Conditioning� Simulation and Modeling� Software Development, Application &
Management� Systems Engineering� Technical Writing� Telecom and Telephone� Telemetry� Test Engineering, Equipment, or Services� Testability� Thermodynamics� Training� Troubleshooting� UNIX� Vehicular�Wireless Networks, Systems, Instrumentation�World Wide Web

q26Please specify below any additional technical specialties that did not appear in the above list, but in which you offer consulting services:
q27Using the definitions of levels of professional engineering responsibility provided, please choose the one level that best describes your responsibility, as of the date that you were last previously employed. These definitions are based on U.S. Department of Labor criteria, and have been used for many years by IEEE-USA, to support more precise information on the compensation of engineers. Note that a tenth and final level applies, if you are work-ing, but are not employed as an engineer. If you are currently unemployed; a full-time student; or completely retired, and no longer working, use the level that applied to your most recent job.
Click here to view definitions:
� Engineer Level 1 (equivalent to GS-5)� Engineer Level 2 (equivalent to GS-7)� Engineer Level 3 (equivalent to GS-9 or Academic Instructor)� Engineer Level 4 (equivalent to GS-11 or Assistant Professor)� Engineer Level 5 (equivalent to GS-12 or Associate Professor)� Engineer Level 6 (equivalent to GS-13 or Full Professor)� Engineer Level 7 (equivalent to GS-14 or Distinguished Professor or Academic Department Head)� Engineer Level 8 (equivalent to GS-15 or Academic Department Head or Dean)� Engineer Level 9 (greater than GS-15 or Academic Dean or higher)� Other/Not Employed as Engineer� Unknown
q28Listed below are ten broad areas of technical competence. Please select the one response that best describes your primary area of technical competence. Circuits and Devices (includes Circuits and Systems; Components, Packaging and Manufacturing Technology; Electronic Devices; Lasers and Electro-Optics; Solid-State Circuits); Communications Technology (includes Broadcast Technology; Communications; Consumer Electronics; Vehicular Technology); Computers (includes Hardware; Non-Internet Software Development; Non-Internet Systems Analysis/Integration; Non-Internet Software Applications, including Database Admin.; Internet/Web Development/Applications; Other, or combinations of the above); Electromagnetics and Radiation (includes Antennas and Propagation; Electromagnetic Compatibility; Magnetics; Microwave Theory and Techniques; Nuclear and Plasma Sciences); Energy and Power Engineering (includes Power Engineering); Engineering and Human Environment (includes Education; Engineering Management; Professional Communication; Reliability; Social Implications of Technology); Industrial Applications (includes Dielectrics and Electrical Insulation; Industry Applications; Instrumentation and Measurement; Power Electronics); Signals and Applications (includes Aerospace and Electronic Systems; Geoscience and Remote Sensing; Oceanic Engineering; Signal Processing; Ultrasonics, Ferroelectrics and Frequency Control); Systems and Control (includes Control Systems; Engineering in Medicine and Biology; Industrial Electronics; Information Theory; Robotics and Automation; Systems, Man and Cybernetics).
� Circuits and Devices� Communications Technology� Computers� Electromagnetics and Radiation� Energy and Power Engineering� Engineering and Human Environment� Industrial Applications� Signals and Applications� Systems and Control� Other (please specify)____________

q28aWithin the area of Circuits and Devices, please check the one response that best describes your primary area of technical competence.
� Circuits and Systems� Components, Packaging and Manufacturing Technology� Electronic Devices� Lasers and Electro-Optics� Solid-State Circuits� Other Circuits and Devices specialties or combinations of the above, please specify____________
q28bWithin the area of Communications Technology, please check the one response that best describes your prima-ry area of technical competence.
� Broadcast Technology� Communications� Consumer Electronics� Vehicular Technology� Other Communications Technology specialties, or combinations of the above; please specify____________
q28cWithin the area of Computers please check the one response that best describes your primary area of technical competence.
� Hardware/+ firmware & embedded systems� Non-Internet Software Development� Non-Internet Systems Analysis/Integration� Non-Internet Software Applications, including Database Admin.� Internet/Web Development/Applications� Other Computer specialties, or combinations of the above; please specify____________
q28dWithin the area of Electromagnetics and Radiation, please check the one response that best describes your prima-ry area of technical competence.
� Antennas and Propagation� Electromagnetic Compatibility�Magnetics�Microwave Theory and Techniques� Nuclear and Plasma Sciences� Other Electromagnetics and Radiation specialties, or combinations of the above; please specify____________

q28eWithin the area of Engineering and Human Environment, please check the one response that best describes your primary area of technical competence.
� Education� Engineering Management� Professional Communication� Reliability� Social Implications of Technology� Other Engineering and Human Environment specialties, or combinations of the above; please specify____________
q28fWithin the area of Industrial Applications, please check the one response that best describes your primary area of technical competence.
� Dielectrics and Electrical Insulation� Industry Applications� Instrumentation and Measurement� Power Electronics� Other Industrial Applications specialties, or combinations of the above; please specify____________
q28gWithin the area of Signals and Applications, please check the one response that best describes your primary area of technical competence.
� Aerospace and Electronic Systems� Geoscience and Remote Sensing� Oceanic Engineering� Signal Processing� Ultrasonics, Ferroelectrics and Frequency Control� Other Signals and Applications specialties, or combinations of the above; please specify____________
q28hWithin the area of Systems and Control, please check the one response that best describes your primary area of technical competence.
� Control Systems� Engineering in Medicine and Biology� Industrial Electronics� Information Theory� Robotics and Automation� Systems, Man and Cybernetics� Other Systems and Control specialties, or combinations of the above; please specify____________
q29As of 1 January 2015, were you employed (or self-employed), in your primary area of technical competence, as indicated in the previous question?
� Yes� No

q30Where are the largest numbers of your clients located?
� In the United States or Canada� Outside the United States or Canada
q30aIn what State/Province are the largest numbers of your clients located?
� Alabama� Alaska� Arizona� Arkansas� California� Colorado� Connecticut� Delaware� District of Columbia� Florida� Georgia� Hawaii� Idaho� Illinois� Indiana� Iowa� Kansas� Kentucky� Louisiana�Maine�Maryland�Massachusetts�Michigan�Minnesota�Mississippi�Missouri�Montana� Nebraska� Nevada� New Hampshire� New Jersey� New Mexico� New York� North Carolina� North Dakota
� Ohio� Oklahoma� Oregon� Pennsylvania� Rhode Island� South Carolina� South Dakota� Tennessee� Texas� Utah� Vermont� Virginia�Washington�West Virginia�Wisconsin�Wyoming� Alberta� British Columbia�Manitoba� New Brunswick� Newfoundland and Labrador� Nova Scotia� Northwest Territories� Nunavut� Ontario� Prince Edward Island� Québec� Saskatchewan� Yukon

q31How has your consulting business been affected by the trend to move engineering offshore? Do you manage, work with, or subcontract to offshore engineering resources?
q32How has your consulting business been affected by the slow economic recovery, if at all?
q32aWhat trends in the consulting business have you observed, or been affected by, over the past year?
q33What action do you recommend that the IEEE Consultants’ Network take, in response to your answers to the two questions immediately preceding?

q34IEEE-USA has an online Consultants Database (see http://www.ieeeusa.org/consultants) to allow member consul-tants to advertise their services to prospective clients. What is your level of interest in the Database?
� I am currently a member� I am a former member� I have been aware of the Database, but choose not to join� I have been aware of the Database, and may have an interest in joining� I have not been aware of the Database, and do not have an interest in joining� I have not been aware of the Database, and may have an interest in joining
q36If you would like a coupon for a free 2015 Survey Report emailed to you, please provide your email address here. (The Survey Report will be published as an IEEE-USA eBook, and offered for sale to non-respondents.)
q37Would you consider joining a fee-based, national consultants network, started by IEEE-USA? The fee would in-clude a listing into IEEE-USA’s Consultants Database, access to special consulting webinars, and an eBook:
� I would be likely to join� I would be unlikely to join� Unsure

2001 L St, NW Suite 700Washington, D.C. 20036
+1 202 785 0017www.ieeeusa.org