
IEEE TRANSACTIONS ON ENGINEERING … · work analysis) and operational ... robustness, simulation,...
13
This article has been accepted for inclusion in a future issue of this journal. Content is final as presented, with the exception of pagination. IEEE TRANSACTIONS ON ENGINEERING MANAGEMENT 1 Supply Chain Network Robustness Against Disruptions: Topological Analysis, Measurement, and Optimization Kang Zhao, Kevin Scheibe, Jennifer Blackhurst, and Akhil Kumar, Senior Member, IEEE Abstract—This paper focuses on understanding the robustness of a supply network in the face of a disruption. We propose a decision support system for analyzing the robustness of supply chain networks against disruptions using topological analysis, per- formance measurement relevant to a supply chain context, and an optimization for increasing supply network performance. The topology of a supply chain network has considerable implications for its robustness in the presence of disruptions. The system al- lows decision makers to evaluate topologies of their supply chain networks in a variety of disruption scenarios, thereby proactively managing the supply chain network to understand vulnerabilities of the network before a disruption occurs. Our system calculates performance measurements for a supply chain network in the face of disruptions and provides both topological metrics (through net- work analysis) and operational metrics (through an optimization model). Through an example application, we evaluate the impact of random and targeted disruptions on the robustness of a supply chain network. Index Terms—Decision support, disruption, optimization, robustness, simulation, supply chain network topology. I. INTRODUCTION T HE MANAGEMENT of disruptions in modern supply chain networks is a timely and relevant topic for both managers and researchers alike. A disruption in a supply chain is an unplanned and unanticipated event that disrupts the normal flow of material [14]. Supply chains are inherently vulnerable to disruptions because they are interconnected, global, and volatile [4], [20], [47], [58]. A disruption may initially affect or disable a few entities in the system, but its cascading effects may propa- gate to many others, disrupting an entire system [24], [25], [42], [43]. Prior research has noted that the cascading effects of a disruption are difficult to understand in real-world settings [20]. Disruptions may impede the flow of people, goods, information, Manuscript received August 4, 2016; revised February 28, 2017, August 14, 2017, and January 3, 2018; accepted January 12, 2018. Review of this manuscript was arranged by Department Editor S. Talluri. (Corresponding au- thor: Jennifer Blackhurst.) K. Zhao and J. Blackhurst are with the Management Sciences Department, Henry B. Tippie College of Business, University of Iowa, Iowa City, IA 52242- 1994 USA (e-mail: [email protected]; [email protected]). K. Scheibe is with the Supply Chain and Information Systems Department, Iowa State University, Ames, IA 50011 USA (e-mail: [email protected]). A. Kumar is with the Smeal College of Business, Pennsylvania State Univer- sity, University Park, PA 16801 USA (e-mail: [email protected]). Color versions of one or more of the figures in this paper are available online at http://ieeexplore.ieee.org. Digital Object Identifier 10.1109/TEM.2018.2808331 and funds with serious consequences, such as lost market share, increased cost, or even company failure [9]. However, disrup- tions do not always end in dire consequences [56]–[58]. The outcome can be positively influenced by the robustness of the supply chain. To increase robustness, it is appropriate to design supply chain networks to be adaptable to different disruption scenarios (i.e., different disruption types and their effects) [20], [27], [28] and to have the ability to reconfigure or restructure the network and redistributes flows in the face of changing con- ditions [5], [24]. By considering multiple alternative networks, robustness can be enhanced by analyzing the effects of possible disruptions before they occur in different network configura- tions [5] providing valuable network robustness insight [22], [26] into supply chain performance [60]. Previous research has demonstrated the efficacy of a topolog- ical approach to rewiring networks to enhance robustness [63], [64]. Specifically, network robustness has been evaluated using various topologies [53], and this work was extended with a new robustness metric [64], and a new topological design approach to supply chain networks [63]. One of the noted weaknesses in previous work in network robustness in the face of supply chain disruptions is the absence of network optimization techniques in robustness analysis [63]. In this paper, we extend prior research by developing a decision support approach that will allow sup- ply chain managers to evaluate the robustness of different supply chain network designs using both a topological approach and an optimization approach [46], [53], [63]. In fact, there have been recent calls for supply chain managers and researchers alike to better understand the structure of the supply chain to determine the ability to adapt and recover from supply chain disruptions [24], [54]. In the context of this research, topology is the relative spatial placement of nodes and their connections or links specifically within the supply chain network (see [62] for a description and discussion of network topologies). Here, we adopt the topo- logical perspective and propose a framework for robustness evaluation, including metrics for robustness and analysis us- ing simulation, graph analysis, and optimization. The decision support system (DSS) not only simulates various types of disrup- tions and evaluates their impacts, but also allows users to con- sider “what-if” scenarios by modifying the structure through the rewiring of the supply chain network [37]. The DSS can config- ure and rewire a supply chain network using models supported by the system. Meanwhile, if network construction and rewiring 0018-9391 © 2018 IEEE. Personal use is permitted, but republication/redistribution requires IEEE permission. See http://www.ieee.org/publications standards/publications/rights/index.html for more information.
Transcript of IEEE TRANSACTIONS ON ENGINEERING … · work analysis) and operational ... robustness, simulation,...
This article has been accepted for inclusion in a future issue of this journal. Content is final as presented, with the exception of pagination.
IEEE TRANSACTIONS ON ENGINEERING MANAGEMENT 1
Supply Chain Network Robustness AgainstDisruptions: Topological Analysis, Measurement,
and OptimizationKang Zhao, Kevin Scheibe, Jennifer Blackhurst, and Akhil Kumar, Senior Member, IEEE
Abstract—This paper focuses on understanding the robustnessof a supply network in the face of a disruption. We propose adecision support system for analyzing the robustness of supplychain networks against disruptions using topological analysis, per-formance measurement relevant to a supply chain context, andan optimization for increasing supply network performance. Thetopology of a supply chain network has considerable implicationsfor its robustness in the presence of disruptions. The system al-lows decision makers to evaluate topologies of their supply chainnetworks in a variety of disruption scenarios, thereby proactivelymanaging the supply chain network to understand vulnerabilitiesof the network before a disruption occurs. Our system calculatesperformance measurements for a supply chain network in the faceof disruptions and provides both topological metrics (through net-work analysis) and operational metrics (through an optimizationmodel). Through an example application, we evaluate the impactof random and targeted disruptions on the robustness of a supplychain network.
Index Terms—Decision support, disruption, optimization,robustness, simulation, supply chain network topology.
I. INTRODUCTION
THE MANAGEMENT of disruptions in modern supplychain networks is a timely and relevant topic for both
managers and researchers alike. A disruption in a supply chainis an unplanned and unanticipated event that disrupts the normalflow of material [14]. Supply chains are inherently vulnerable todisruptions because they are interconnected, global, and volatile[4], [20], [47], [58]. A disruption may initially affect or disablea few entities in the system, but its cascading effects may propa-gate to many others, disrupting an entire system [24], [25], [42],[43]. Prior research has noted that the cascading effects of adisruption are difficult to understand in real-world settings [20].Disruptions may impede the flow of people, goods, information,
Manuscript received August 4, 2016; revised February 28, 2017, August14, 2017, and January 3, 2018; accepted January 12, 2018. Review of thismanuscript was arranged by Department Editor S. Talluri. (Corresponding au-thor: Jennifer Blackhurst.)
K. Zhao and J. Blackhurst are with the Management Sciences Department,Henry B. Tippie College of Business, University of Iowa, Iowa City, IA 52242-1994 USA (e-mail: [email protected]; [email protected]).
K. Scheibe is with the Supply Chain and Information Systems Department,Iowa State University, Ames, IA 50011 USA (e-mail: [email protected]).
A. Kumar is with the Smeal College of Business, Pennsylvania State Univer-sity, University Park, PA 16801 USA (e-mail: [email protected]).
Color versions of one or more of the figures in this paper are available onlineat http://ieeexplore.ieee.org.
Digital Object Identifier 10.1109/TEM.2018.2808331
and funds with serious consequences, such as lost market share,increased cost, or even company failure [9]. However, disrup-tions do not always end in dire consequences [56]–[58]. Theoutcome can be positively influenced by the robustness of thesupply chain. To increase robustness, it is appropriate to designsupply chain networks to be adaptable to different disruptionscenarios (i.e., different disruption types and their effects) [20],[27], [28] and to have the ability to reconfigure or restructurethe network and redistributes flows in the face of changing con-ditions [5], [24]. By considering multiple alternative networks,robustness can be enhanced by analyzing the effects of possibledisruptions before they occur in different network configura-tions [5] providing valuable network robustness insight [22],[26] into supply chain performance [60].
Previous research has demonstrated the efficacy of a topolog-ical approach to rewiring networks to enhance robustness [63],[64]. Specifically, network robustness has been evaluated usingvarious topologies [53], and this work was extended with a newrobustness metric [64], and a new topological design approachto supply chain networks [63]. One of the noted weaknesses inprevious work in network robustness in the face of supply chaindisruptions is the absence of network optimization techniques inrobustness analysis [63]. In this paper, we extend prior researchby developing a decision support approach that will allow sup-ply chain managers to evaluate the robustness of different supplychain network designs using both a topological approach and anoptimization approach [46], [53], [63]. In fact, there have beenrecent calls for supply chain managers and researchers alike tobetter understand the structure of the supply chain to determinethe ability to adapt and recover from supply chain disruptions[24], [54].
In the context of this research, topology is the relative spatialplacement of nodes and their connections or links specificallywithin the supply chain network (see [62] for a description anddiscussion of network topologies). Here, we adopt the topo-logical perspective and propose a framework for robustnessevaluation, including metrics for robustness and analysis us-ing simulation, graph analysis, and optimization. The decisionsupport system (DSS) not only simulates various types of disrup-tions and evaluates their impacts, but also allows users to con-sider “what-if” scenarios by modifying the structure through therewiring of the supply chain network [37]. The DSS can config-ure and rewire a supply chain network using models supportedby the system. Meanwhile, if network construction and rewiring
0018-9391 © 2018 IEEE. Personal use is permitted, but republication/redistribution requires IEEE permission.See http://www.ieee.org/publications standards/publications/rights/index.html for more information.

This article has been accepted for inclusion in a future issue of this journal. Content is final as presented, with the exception of pagination.
2 IEEE TRANSACTIONS ON ENGINEERING MANAGEMENT
models provided by the DSS are insufficient, a user can also pro-vide different supply chain network topologies for evaluation.In doing so, managers can evaluate different topological designsfor robustness against disruptions. In a supply network context,the relationship between the network’s topology and robustnessin the presence of targeted and random attacks has been inves-tigated using multi-agent model simulation, but the researchersdid not consider rewiring nodes nor identifying nodes that wouldbe most appropriate for fortification [37]. Therefore, our DSSincorporates both operational and topological metrics into a de-cision support tool to enable different ways to evaluate supplynetwork robustness using context of transshipments and logis-tics in a supply chain.
This research contributes in two ways: first, through simu-lation, the DSS allows users to evaluate the before and afterperformance of a supply chain network given various types ofdisruptions so that the network’s robustness against these dis-ruptions can be analyzed. These disruptions may be random ortargeted to study the impact of disrupting a particular node invarying topological models. This analysis will aid in identify-ing supply chain nodes that should be fortified. Second, thisresearch provides a combination of topological metrics for sup-ply chain networks that are relatively quick to calculate yet canstill accurately capture the performance of the network againstdisruptions as well as network optimization based on networktopology. In doing so, this approach can provide both topologi-cal metrics (through network analysis) and operational metrics(through optimization). Topological metrics can accurately ap-proximate the operational metrics, yet the former is much fasterto calculate than the latter, and thus enable quick robustnessevaluation of a large number of network designs or rewiringschemes. Therefore, from a decision analysis perspective, topo-logical metrics are quick to derive reasonable solutions to net-work rewiring in the face of disruptions. The incorporation ofboth the topology analyzer and the optimization solver allowssupply chains robustness to be examined.
Therefore, the purpose of this study is not to derive an optimaldesign of a network, but show that topological metrics performquick and satisfactory evaluations of different designs. At thesame time, the high similarity between topological metrics andoperational metrics makes it possible for future studies to op-timize a supply chain network based on topological metrics,which are much faster to calculate. This provides prescriptiveanalytics for supply chain robustness, so that users can quicklyevaluate many possible topological designs for large-scale sup-ply chain networks.
The remainder of the paper flows as follows. Next, we intro-duce supply chain network topologies, their nature, attributes,and general constraints. This is followed by a description ofthe architecture of our robustness decision support system. Theapproach will generate a supply chain network based on a setof parameters including source, sink, and transshipment nodesas well as the number and strength of the edges connectingthe nodes. After the network generator, we describe the sce-nario analyzer and disruption simulator where a disruption isintroduced into the supply chain network, randomly or directed,based on decision maker preferences. In conjunction with the
scenario analyzer and disruption simulator is the performanceevaluator whose job is to provide metrics of the network. Theperformance evaluator provides topological metrics and opti-mized operational metrics. The topology analyzer of the perfor-mance evaluator will provide topological metrics such as largestconnected component, characteristic path length the size of thelargest functional subnetwork, and average supply path length.The optimization solver in the performance evaluator consid-ers the flow through the network by accounting for total unitsdelivered (TUD) and average delivery cost (ADC). An exam-ple application of the decision support system is presented toillustrate the efficacy of the approach. Results are presented forboth random and targeted disruptions, and finally, we discussimplications and conclude.
II. BACKGROUND
A. Supply Chain Disruptions
Supply chain disruptions are inevitable and they are varied.Disruptions are both natural and man-made, and they have beenincreasing in frequency and severity over the last decade [52].Given the varied nature of disruptions and their unintendedconsequences [3], [43], as well as the fact that, unless contained,the disruptions will affect larger portions of the supply chain [3],[10], [33], it is critical to develop robust strategies to mitigatethem.
B. Network Science and Robustness
The decision support method presented in this paper isgrounded in network science which is defined as “the study ofnetwork representations of physical, biological, and social phe-nomena leading to predictive models of these phenomena” [13].There is a considerable body of knowledge existing for networkscience in many domains such as transportation, telecommu-nications, biological, social, and supply chain, and while thereis maturity in the field, there is also renewed and growing in-terest [29]. We do not present a comprehensive review of theliterature, but we do draw from select domains and projectsto support our research questions and direction. For example,researchers have used network science to draw insights into net-work disruptions in road networks for emergency services [40],telecommunication networks [23], spatial decision support sys-tems and wireless communications [44], [45], and supply chainnetworks [12], [18], [31], [58].
Within the domain of network science, robustness has beenstudied in many fields such as finance [21], transportation [50],and group decision making [38]. Bruneau et al. [6] define ro-bustness as the strength of a system, which is measured by itsability to resist damage or loss of functionality as a result ofan event. Robustness is one component that contributes to asystem’s resilience [6], [65], specifically by fostering pre-eventpreparedness [66], and is particularly interesting in evaluatingnetworks’ ability to absorb disruptions [50]. In a supply chaincontext, robustness is the ability to maintain normal operationsunder different scenarios including the event of a disruption[5], [27], [28]. A supply chain network that is robust should
This article has been accepted for inclusion in a future issue of this journal. Content is final as presented, with the exception of pagination.
ZHAO et al.: SUPPLY CHAIN NETWORK ROBUSTNESS AGAINST DISRUPTIONS: TOPOLOGICAL ANALYSIS, MEASUREMENT 3
compensate for disruptions with minimal impact in perfor-mance. One way to enhance the robustness of a supply chainnetwork is to investigate its ability to maintain operations inthe event of disruption by altering the structural level of the net-work. Therefore, in order to have a robust supply chain network,weak points or vulnerabilities in the system should be identifiedbefore the disruption occurs [5].
C. Supply Network Topology
Supply chain networks are dynamic, being made up of inter-acting entities with different roles, such as raw material suppli-ers, manufacturers, logistics, warehouses, retailers, customers,etc. Because supply chain networks involve collaboration ofpartners sharing real-time and often incomplete information,some have argued that these networks are complex adaptivesystems where they may change dynamically, causing the net-working problems to be ill structured and behavior based, thusmaking them difficult to be solved by analytical tools such asmathematical programming [36], [51]. Although entities vary inmanifestation and application domains, we refer to them gener-ically as network nodes. Topology and robustness have longbeen studied for their interplay in mitigating attacks and fail-ures [1], [8], [17], [37], [51]. A topology shows how the nodesin a network are connected together by edges or links; in otherwords, the topology is the structure of the network. For ex-ample, in an (ER) random network model, new edges betweennodes are added randomly. Many real-world networks (e.g., so-cial networks and some supply chain networks) have scale-freetopologies [2], [38], where the edges are added based on pref-erential attachment: high-degree nodes are more likely to beconnected. Scale-free networks are very robust to random fail-ures but are fragile to targeted attacks [37]. Additionally, supplychain networks may exhibit small-world (commonly referred toas six degrees of separation) characteristics where the nodes arelocally well connected [15], [59]. Small-world networks sharesimilar properties to random networks in regards to robustnessto failures [37]. Thus, robustness will vary depending upon themodel of topology.
Many previous topological robustness studies assumed thatnodes in networks are homogeneous in the sense that the differ-ent roles of nodes are not considered. Yet, supply chain networksare essentially heterogeneous with different types of nodes withdistinct roles, such as supply nodes, and distribution (or trans-shipment) nodes. As a result, when helping managers evaluatethe robustness of various network topologies and redesign thesupply chain network in cases of disruptions, we need to takenode heterogeneity into consideration [63], [64]. In consider-ing the topology of the supply chain network, we are mainlyfocusing on the logistic nature of the network, and note thatsupply chain networks are even more complex dealing with in-terpersonal, economic, and sourcing relationships. However, asper [3], the logistic nature of supply chains remains an area ofimportance.
It should be noted that supply chain networks are inclusiveall the way from raw materials to finished goods and have manystakeholders and multiple tiers. In this research, we focus on the
downstream components of a supply chain network related tothe distribution of goods. In this part of a supply chain network,manufacturers, distributors and retailers are closely connectedand supply chain managers often have high levels of knowledgeand control over the network’s structure. Given the nature ofthese supply chain networks, we limit the locus of control oftopology to nodes. Prior research has investigated the effectsof modifying links in the network to address disruptions (link-based or link-focused modeling) [40], [50] as well as node-based modeling [45], [61]. While supply chain managers areaware of links in their networks, such as road, rail, and air be-tween the nodes, they are more often concerned with the healthand well-being of the nodes in their networks such as suppli-ers, distribution centers (DCs), and warehouses [7], [9], [32],[54]. Even in supply chain network optimization problems, as-sumptions are often made that do not reflect the reality of actualsupply chains. For example, there may not always be paths fromsource to sink nodes [35] due to transshipment node failures, orif a node fails in the supply chain, the network may not simplybe rerouted around that node because that specific node is es-sential to adding value to the product or information traversingthe chain. Therefore, we focus on node-centric modifications toimprove or balance supply chain network robustness.
III. ARCHITECTURE OF A DECISION SUPPORT APPROACH FOR
ROBUSTNESS ANALYSIS
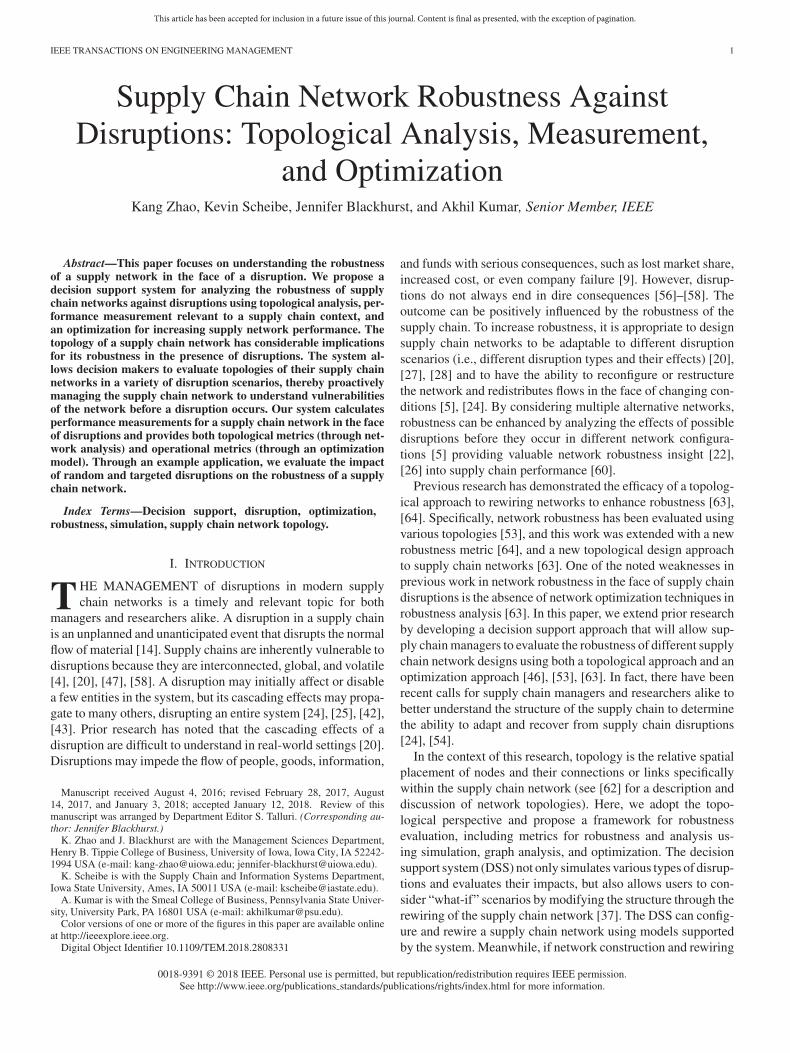
We adopt a framework for spatial decision support systems(SDSS) proposed by Snediker et al. [48]. This framework,shown in Fig. 1, aims at helping managers assess the robust-ness of supply chain networks with different topologies whenexposed to disruptive events, so that they can make informeddecisions about their network design. The main components ofthe system are the network generator, scenario analyzer, disrup-tion simulator, performance evaluator, and a network database.A user provides the network parameters and disruption scenar-ios (data input) to the scenario analyzer (impact assessment),which in turn invokes the network generator (scenario gener-ation). The network generator creates a supply chain networkbased on the input provided, and stores it in a network database.The scenario analyzer also notifies the disruption simulator tosimulate disruption scenarios according to users’ requirements.The scenario analyzer passes the disrupted network to the perfor-mance evaluator (measurement comparison and testing), whichcan provide two types of performance metrics: one is derivedonly from network topologies and the roles of nodes; the otheris based on the optimization of supply flows across the network.Lastly, the user may modify the supply chain network based ontest results (impact exploration and disruption mediation).
A. Network Generator
Given a set of parameters, this component generates a supplychain network as specified by a user. The inputs include bothtopological parameters and attributes of individual elements inthe network (as summarized in Table I). We will use the sim-ple supply chain network in Fig. 2 as an example to illustratethe input parameters. The network has three types of nodes:
This article has been accepted for inclusion in a future issue of this journal. Content is final as presented, with the exception of pagination.
4 IEEE TRANSACTIONS ON ENGINEERING MANAGEMENT
Fig. 1. Snediker et al. [48] framework for SDSS network scenarios.
TABLE IINPUT AND OUTPUT PARAMETERS
Input Nodes Numbers of Supply, Distribution, and Demand NodesSupply/demand capacityThroughput capacityGeographical location (if available)
Edges Number of edgesDirections of different types of edgesWeights of edges (if available)
Parameters related tonetwork topologies
Scale-free Degree preference exponent (r)
The number of initial nodesER-random Connection probabilitySmall world Lattice pattern
Rewiring probabilityPrioritized attachment for supply nodes Numbers of edges each type of node
can haveDegree preference parameter
Random Localized Rewiring Parameters for the original networkRewiring probability
Hierarchical Numbers of edges each type of nodecan have
Maximum connectiondistance
Geographical distance (kilometers or miles) or graphical distance (number of hops)
Disruption models Elements to be disrupted Node or/and edgeDisruption type Random, targeted (with the metric for
importance), mixed, or user-defined.Number of elements to be disrupted
Output Supply chain networktopology
Network adjacency matrix and the role of each node.
Topological performance metrics (size of the LFSN and average supply path length).Supply chain networkperformance
TUD
ADCFlow of goods on each edge
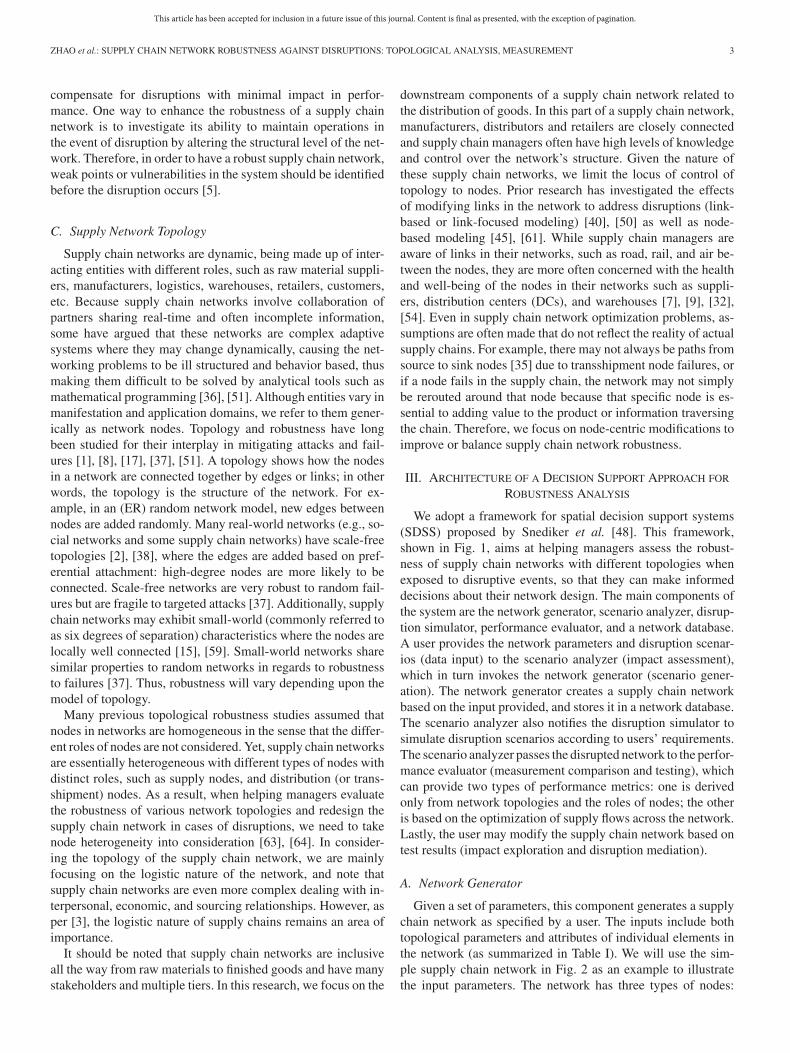
1) warehouses (W); 2) DCs; and 3) retail stores (S). Ware-houses act as supply nodes, stores are demand nodes, and DCsare trans-shipment nodes. To build the network, one needs tospecify the number of nodes for each type, the number of edges,and what is the network topology. In addition, each node isassociated with two types of capacities.
1) The supply/demand (S-D) capacity denotes how manygoods can be provided or consumed by a node. A supplynode has a positive S-D capacity as it provides goods tothe network; a demand node consumes goods provided
through the network and has a negative S-D capacity; anda transshipment node has a zero S-D capacity.
2) The throughput capacity represents how many units ofgoods a node can transfer to other nodes.
In other words, it is the capacity of a node to transfer goodsit received from upstream suppliers to downstream customers.Users can specify the S-D and throughput capacities of a node onthe basis of its type, designated role, location, etc. The capacityof a node may be increased at extra cost. Fig. 2 illustrates anexample of a supply chain network.
This article has been accepted for inclusion in a future issue of this journal. Content is final as presented, with the exception of pagination.
ZHAO et al.: SUPPLY CHAIN NETWORK ROBUSTNESS AGAINST DISRUPTIONS: TOPOLOGICAL ANALYSIS, MEASUREMENT 5
Fig. 2. Simple supply chain network with three types of nodes: warehouses(W), DCs, and stores (S).
As for edges, those between warehouses and DC/stores areunidirectional to denote the one-way flow of goods, while thosebetween DCs and stores bidirectional. Edges are also assignedweights that represent the cost of transporting goods over alink in the physical world. The weight could depend on thegeographical distance between two nodes, the means of trans-portation (by road, air, or sea), etc. Higher edge weight denoteshigher transportation cost on the edge.
The network generator supports various strategies to con-struct networks with many different topologies. It also allows auser to modify the topology of an existing supply chain networkthrough various adjustment strategies. It can generate networkswith standard models, such as ER-random, scale-free, and smallworld. More importantly, it also allows users to state specific re-quirements when constructing a supply chain network [59]. Forexample, the user can specify that each demand node connectsto at least two distribution nodes, or that a supply node can han-dle no more than ten distribution nodes. Further, the design of asupply chain network often faces some practical constraints. Insome supply chain networks, a demand node may have to con-nect to a distribution node that is geographically more proximatethan another distant distribution node. Thus, this generator alsomakes it possible to enforce an upper limit on the geographicaldistance that an edge can span in a supply chain network, so thatthe resulting network has fewer long-distance hops and reflectsa more realistic supply chain. Table I summarizes the input andoutput parameters of our decision support system. It is worthnoting that supporting network models listed in Table I are notcomprehensive nor are real-world supply chains limited to thoselisted. For example, it is rare to find a supply chain network thatis totally random. However, by allowing users to access thesemodels, the system gives decision makers options for what-ifanalysis without being overwhelming. However, as described inour literature review, the models and parameters listed in Table Iare most salient and pertinent for supply chain networks.
B. Scenario Analyzer and the Disruption Simulator
The scenario analyzer lies at the center of our architecture. Itreceives inputs such as supply chain network topologies andsettings for simulating disruptions and other scenarios. The
analyzer will invoke the disruption simulator to simulate dis-ruptions to the supply chain network. The disruption simula-tor receives the disruption settings as input, such as the typeof disruption (random/targeted/mixed/user-defined), the num-ber of nodes/edges to be removed, and the strategy for selectingimportant targets, etc. Then it simulates these disruptions byremoving nodes or edges from the network. The output of thedisruption simulator is the disrupted network.
When disruptions are random, each node and/or edge has thesame failure probability. These random disruptions might be ac-cidental such as earthquakes, fires, or power outages. They maybe unexpected economic events like the dot com bubble burstor a bankruptcy. In order to simulate these random disruptions,we randomly remove nodes or edges from the supply network.When a node is removed, the connected edges to that node arealso removed. In contrast to random disruptions, targeted dis-ruptions are directed at critical system entities such as networkhubs. The criticality of a node may be measured by its impor-tance in a network through measures such as degree, closeness,and betweenness [39]. In addition to random and targeted dis-ruption scenarios, users may manually define how to removenodes or edges from a supply chain network.
C. Performance Evaluator
As its name suggests, the performance evaluator is responsi-ble for evaluating the performance of a supply chain networkafter disruptions. It interacts with two other modules, each pro-viding one set of performance metrics: the topology analyzer fo-cuses on network topologies and generates topological metrics;the optimization solver formulates and solves an optimizationproblem to find operational metrics based on the optimal supplyflows. We will illustrate how the two sets of performance met-rics relate to each other in the case study later. After disruptions,the performance of a supply chain network usually deteriorates.The less its performance deteriorates, the more robust the supplychain network is. By comparing the values of a network’s per-formance metrics before and after a disruption, the performanceevaluator helps users gain insights into the network’s robustnessagainst disruptions.
D. Topology Analyzer
Topological metrics have been used by many network studiesto evaluate the robustness of a network [37]. The most importantinclude the size of the largest connected component, clusteringcoefficient, and characteristic path length [37], [51]. The largestconnected component of a network is the largest subnetworkwhere there exists a path between any pair of nodes. The char-acteristic path length is the average shortest path length betweenall pairs of nodes. Clustering coefficient captures the nature ofsmall-world networks in that the probability of the nearness oftwo nodes is related to the nearness of a third to the first two [37].In the context of supply chain networks, topological metrics canalso be good indicators of network performance [26].
Taking the topology of a supply chain network (weighted orunweighted) and the role of each node in the network as inputs,this approach provides two topological metrics that extend the
This article has been accepted for inclusion in a future issue of this journal. Content is final as presented, with the exception of pagination.
6 IEEE TRANSACTIONS ON ENGINEERING MANAGEMENT
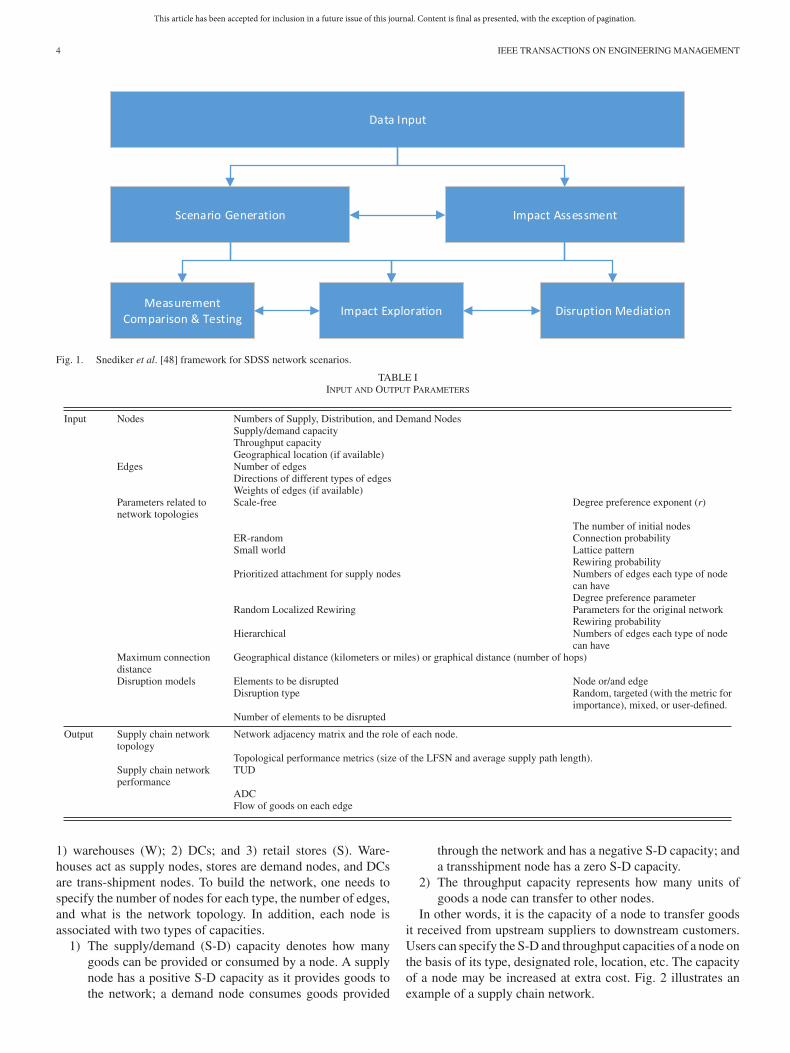
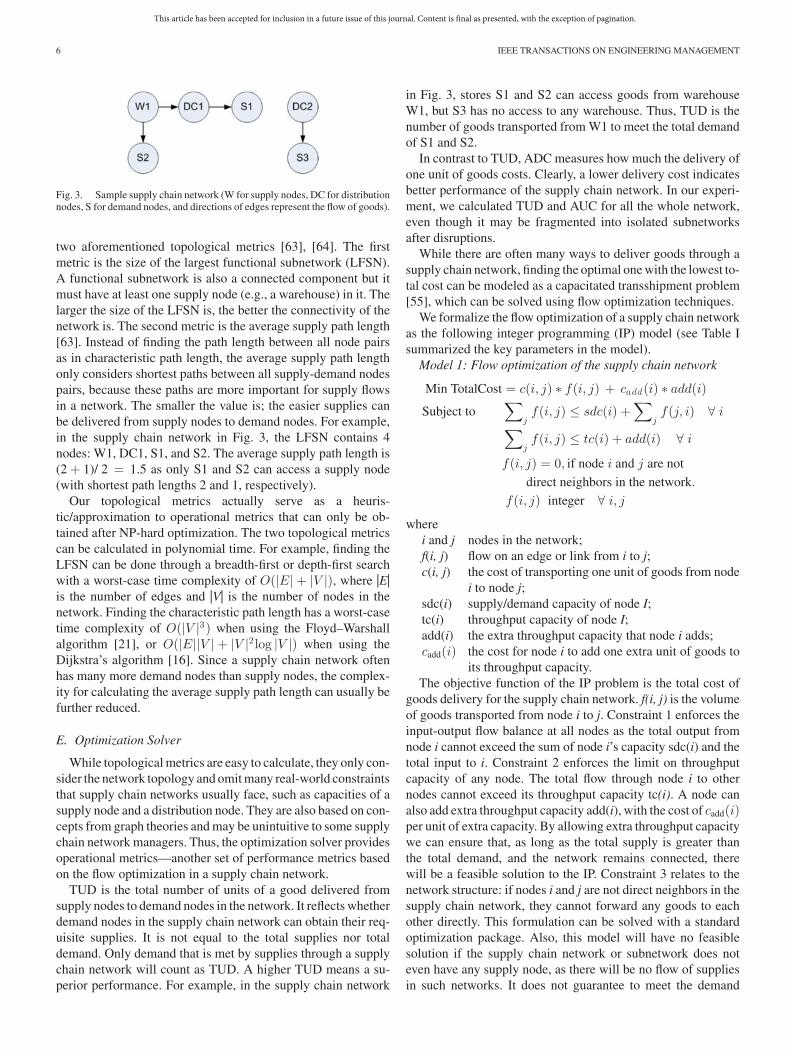
Fig. 3. Sample supply chain network (W for supply nodes, DC for distributionnodes, S for demand nodes, and directions of edges represent the flow of goods).
two aforementioned topological metrics [63], [64]. The firstmetric is the size of the largest functional subnetwork (LFSN).A functional subnetwork is also a connected component but itmust have at least one supply node (e.g., a warehouse) in it. Thelarger the size of the LFSN is, the better the connectivity of thenetwork is. The second metric is the average supply path length[63]. Instead of finding the path length between all node pairsas in characteristic path length, the average supply path lengthonly considers shortest paths between all supply-demand nodespairs, because these paths are more important for supply flowsin a network. The smaller the value is; the easier supplies canbe delivered from supply nodes to demand nodes. For example,in the supply chain network in Fig. 3, the LFSN contains 4nodes: W1, DC1, S1, and S2. The average supply path length is(2 + 1)/ 2 = 1.5 as only S1 and S2 can access a supply node(with shortest path lengths 2 and 1, respectively).
Our topological metrics actually serve as a heuris-tic/approximation to operational metrics that can only be ob-tained after NP-hard optimization. The two topological metricscan be calculated in polynomial time. For example, finding theLFSN can be done through a breadth-first or depth-first searchwith a worst-case time complexity of O(|E| + |V |), where |E|is the number of edges and |V| is the number of nodes in thenetwork. Finding the characteristic path length has a worst-casetime complexity of O(|V |3) when using the Floyd–Warshallalgorithm [21], or O(|E||V | + |V |2 log |V |) when using theDijkstra’s algorithm [16]. Since a supply chain network oftenhas many more demand nodes than supply nodes, the complex-ity for calculating the average supply path length can usually befurther reduced.
E. Optimization Solver
While topological metrics are easy to calculate, they only con-sider the network topology and omit many real-world constraintsthat supply chain networks usually face, such as capacities of asupply node and a distribution node. They are also based on con-cepts from graph theories and may be unintuitive to some supplychain network managers. Thus, the optimization solver providesoperational metrics—another set of performance metrics basedon the flow optimization in a supply chain network.
TUD is the total number of units of a good delivered fromsupply nodes to demand nodes in the network. It reflects whetherdemand nodes in the supply chain network can obtain their req-uisite supplies. It is not equal to the total supplies nor totaldemand. Only demand that is met by supplies through a supplychain network will count as TUD. A higher TUD means a su-perior performance. For example, in the supply chain network
in Fig. 3, stores S1 and S2 can access goods from warehouseW1, but S3 has no access to any warehouse. Thus, TUD is thenumber of goods transported from W1 to meet the total demandof S1 and S2.
In contrast to TUD, ADC measures how much the delivery ofone unit of goods costs. Clearly, a lower delivery cost indicatesbetter performance of the supply chain network. In our experi-ment, we calculated TUD and AUC for all the whole network,even though it may be fragmented into isolated subnetworksafter disruptions.
While there are often many ways to deliver goods through asupply chain network, finding the optimal one with the lowest to-tal cost can be modeled as a capacitated transshipment problem[55], which can be solved using flow optimization techniques.
We formalize the flow optimization of a supply chain networkas the following integer programming (IP) model (see Table Isummarized the key parameters in the model).
Model 1: Flow optimization of the supply chain network
Min TotalCost = c(i, j) ∗ f(i, j) + cadd(i) ∗ add(i)
Subject to∑
jf(i, j) ≤ sdc(i) +
∑jf(j, i) ∀ i
∑jf(i, j) ≤ tc(i) + add(i) ∀ i
f(i, j) = 0, if node i and j are not
direct neighbors in the network.
f(i, j) integer ∀ i, j
wherei and j nodes in the network;f(i, j) flow on an edge or link from i to j;c(i, j) the cost of transporting one unit of goods from node
i to node j;sdc(i) supply/demand capacity of node I;tc(i) throughput capacity of node I;add(i) the extra throughput capacity that node i adds;cadd(i) the cost for node i to add one extra unit of goods to
its throughput capacity.The objective function of the IP problem is the total cost of
goods delivery for the supply chain network. f(i, j) is the volumeof goods transported from node i to j. Constraint 1 enforces theinput-output flow balance at all nodes as the total output fromnode i cannot exceed the sum of node i’s capacity sdc(i) and thetotal input to i. Constraint 2 enforces the limit on throughputcapacity of any node. The total flow through node i to othernodes cannot exceed its throughput capacity tc(i). A node canalso add extra throughput capacity add(i), with the cost of cadd(i)per unit of extra capacity. By allowing extra throughput capacitywe can ensure that, as long as the total supply is greater thanthe total demand, and the network remains connected, therewill be a feasible solution to the IP. Constraint 3 relates to thenetwork structure: if nodes i and j are not direct neighbors in thesupply chain network, they cannot forward any goods to eachother directly. This formulation can be solved with a standardoptimization package. Also, this model will have no feasiblesolution if the supply chain network or subnetwork does noteven have any supply node, as there will be no flow of suppliesin such networks. It does not guarantee to meet the demand
This article has been accepted for inclusion in a future issue of this journal. Content is final as presented, with the exception of pagination.
ZHAO et al.: SUPPLY CHAIN NETWORK ROBUSTNESS AGAINST DISRUPTIONS: TOPOLOGICAL ANALYSIS, MEASUREMENT 7
Fig. 4. Screenshot of the network graph of the supply chain.
of every demand node either. In other words, after disruptions,even though a demand node is still somehow connected to asupply node, its demand may not be completely satisfied dueto the loss of supply nodes. Similarly, a supply node may endup with excessive supplies that cannot be delivered to demandnodes.
It is worth noting that our work focuses on topological de-signs. Thus, the aforementioned IP model is about optimizationat the strategic level. Similar to previous work on strategic-leveloptimizations, the IP model does not consider specific rulesor constraints, such as sourcing, inventory management, trans-portation mode/carrier selections [49].
IV. IMPLEMENTATION
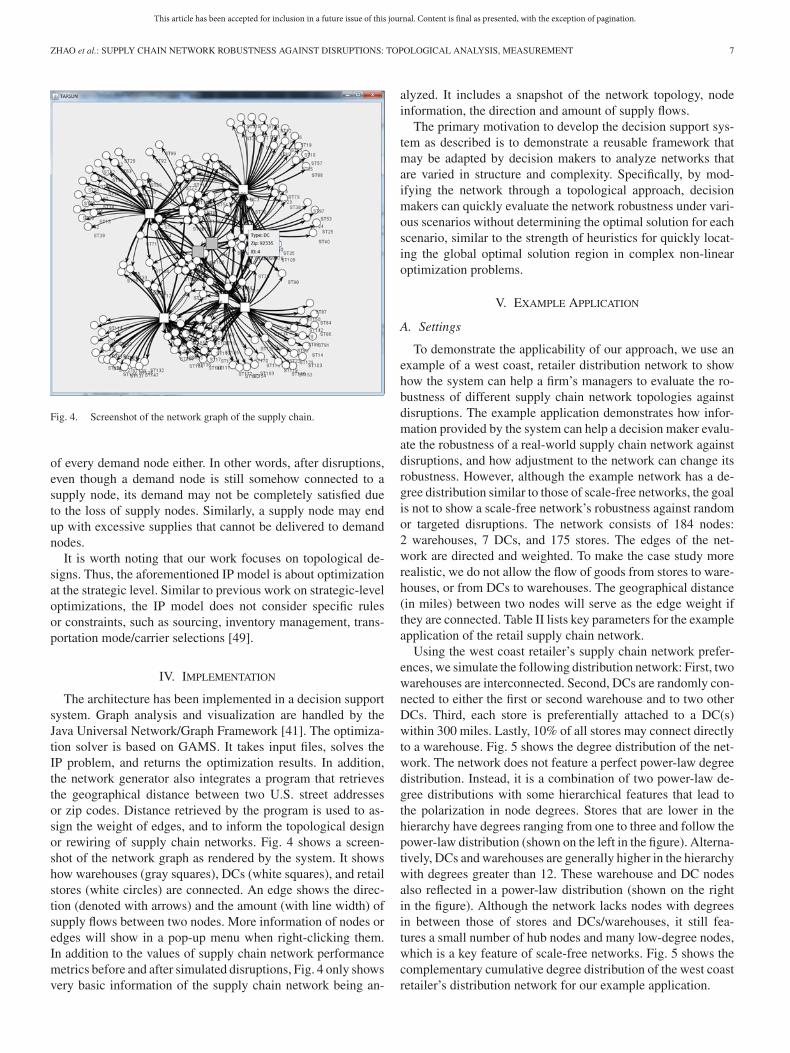
The architecture has been implemented in a decision supportsystem. Graph analysis and visualization are handled by theJava Universal Network/Graph Framework [41]. The optimiza-tion solver is based on GAMS. It takes input files, solves theIP problem, and returns the optimization results. In addition,the network generator also integrates a program that retrievesthe geographical distance between two U.S. street addressesor zip codes. Distance retrieved by the program is used to as-sign the weight of edges, and to inform the topological designor rewiring of supply chain networks. Fig. 4 shows a screen-shot of the network graph as rendered by the system. It showshow warehouses (gray squares), DCs (white squares), and retailstores (white circles) are connected. An edge shows the direc-tion (denoted with arrows) and the amount (with line width) ofsupply flows between two nodes. More information of nodes oredges will show in a pop-up menu when right-clicking them.In addition to the values of supply chain network performancemetrics before and after simulated disruptions, Fig. 4 only showsvery basic information of the supply chain network being an-
alyzed. It includes a snapshot of the network topology, nodeinformation, the direction and amount of supply flows.
The primary motivation to develop the decision support sys-tem as described is to demonstrate a reusable framework thatmay be adapted by decision makers to analyze networks thatare varied in structure and complexity. Specifically, by mod-ifying the network through a topological approach, decisionmakers can quickly evaluate the network robustness under vari-ous scenarios without determining the optimal solution for eachscenario, similar to the strength of heuristics for quickly locat-ing the global optimal solution region in complex non-linearoptimization problems.
V. EXAMPLE APPLICATION
A. Settings
To demonstrate the applicability of our approach, we use anexample of a west coast, retailer distribution network to showhow the system can help a firm’s managers to evaluate the ro-bustness of different supply chain network topologies againstdisruptions. The example application demonstrates how infor-mation provided by the system can help a decision maker evalu-ate the robustness of a real-world supply chain network againstdisruptions, and how adjustment to the network can change itsrobustness. However, although the example network has a de-gree distribution similar to those of scale-free networks, the goalis not to show a scale-free network’s robustness against randomor targeted disruptions. The network consists of 184 nodes:2 warehouses, 7 DCs, and 175 stores. The edges of the net-work are directed and weighted. To make the case study morerealistic, we do not allow the flow of goods from stores to ware-houses, or from DCs to warehouses. The geographical distance(in miles) between two nodes will serve as the edge weight ifthey are connected. Table II lists key parameters for the exampleapplication of the retail supply chain network.
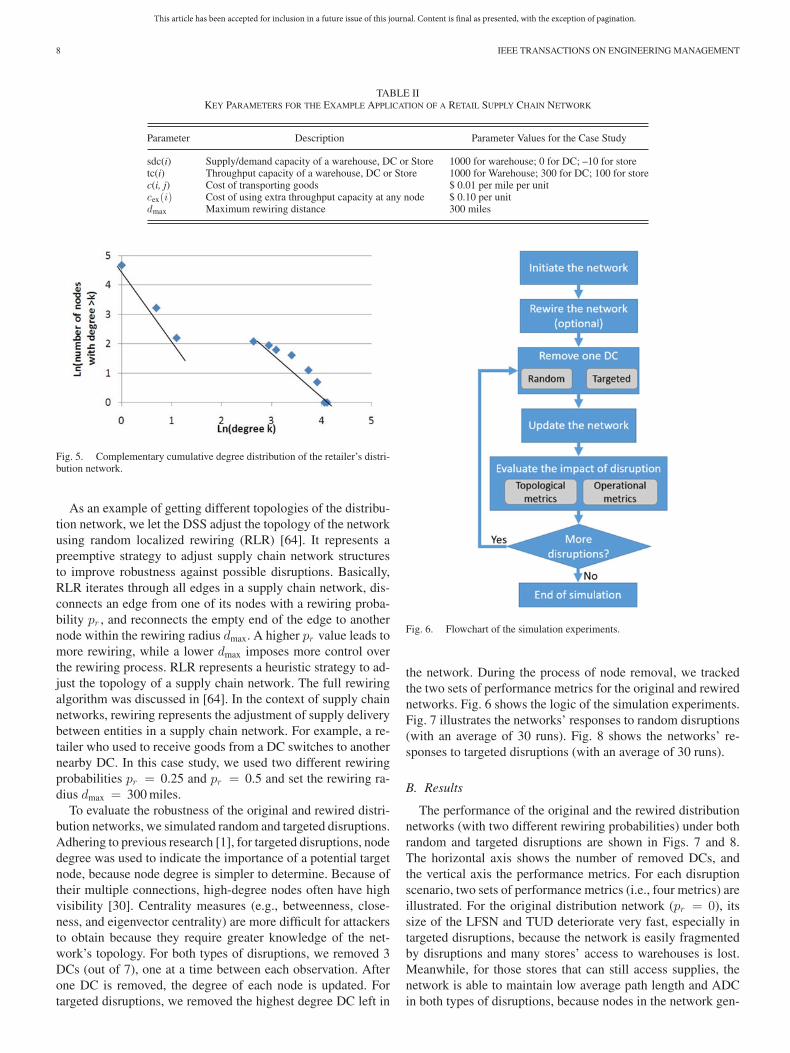
Using the west coast retailer’s supply chain network prefer-ences, we simulate the following distribution network: First, twowarehouses are interconnected. Second, DCs are randomly con-nected to either the first or second warehouse and to two otherDCs. Third, each store is preferentially attached to a DC(s)within 300 miles. Lastly, 10% of all stores may connect directlyto a warehouse. Fig. 5 shows the degree distribution of the net-work. The network does not feature a perfect power-law degreedistribution. Instead, it is a combination of two power-law de-gree distributions with some hierarchical features that lead tothe polarization in node degrees. Stores that are lower in thehierarchy have degrees ranging from one to three and follow thepower-law distribution (shown on the left in the figure). Alterna-tively, DCs and warehouses are generally higher in the hierarchywith degrees greater than 12. These warehouse and DC nodesalso reflected in a power-law distribution (shown on the rightin the figure). Although the network lacks nodes with degreesin between those of stores and DCs/warehouses, it still fea-tures a small number of hub nodes and many low-degree nodes,which is a key feature of scale-free networks. Fig. 5 shows thecomplementary cumulative degree distribution of the west coastretailer’s distribution network for our example application.
This article has been accepted for inclusion in a future issue of this journal. Content is final as presented, with the exception of pagination.
8 IEEE TRANSACTIONS ON ENGINEERING MANAGEMENT
TABLE IIKEY PARAMETERS FOR THE EXAMPLE APPLICATION OF A RETAIL SUPPLY CHAIN NETWORK
Parameter Description Parameter Values for the Case Study
sdc(i) Supply/demand capacity of a warehouse, DC or Store 1000 for warehouse; 0 for DC; –10 for storetc(i) Throughput capacity of a warehouse, DC or Store 1000 for Warehouse; 300 for DC; 100 for storec(i, j) Cost of transporting goods $ 0.01 per mile per unitcex(i) Cost of using extra throughput capacity at any node $ 0.10 per unitdmax Maximum rewiring distance 300 miles
Fig. 5. Complementary cumulative degree distribution of the retailer’s distri-bution network.
As an example of getting different topologies of the distribu-tion network, we let the DSS adjust the topology of the networkusing random localized rewiring (RLR) [64]. It represents apreemptive strategy to adjust supply chain network structuresto improve robustness against possible disruptions. Basically,RLR iterates through all edges in a supply chain network, dis-connects an edge from one of its nodes with a rewiring proba-bility pr , and reconnects the empty end of the edge to anothernode within the rewiring radius dmax. A higher pr value leads tomore rewiring, while a lower dmax imposes more control overthe rewiring process. RLR represents a heuristic strategy to ad-just the topology of a supply chain network. The full rewiringalgorithm was discussed in [64]. In the context of supply chainnetworks, rewiring represents the adjustment of supply deliverybetween entities in a supply chain network. For example, a re-tailer who used to receive goods from a DC switches to anothernearby DC. In this case study, we used two different rewiringprobabilities pr = 0.25 and pr = 0.5 and set the rewiring ra-dius dmax = 300 miles.
To evaluate the robustness of the original and rewired distri-bution networks, we simulated random and targeted disruptions.Adhering to previous research [1], for targeted disruptions, nodedegree was used to indicate the importance of a potential targetnode, because node degree is simpler to determine. Because oftheir multiple connections, high-degree nodes often have highvisibility [30]. Centrality measures (e.g., betweenness, close-ness, and eigenvector centrality) are more difficult for attackersto obtain because they require greater knowledge of the net-work’s topology. For both types of disruptions, we removed 3DCs (out of 7), one at a time between each observation. Afterone DC is removed, the degree of each node is updated. Fortargeted disruptions, we removed the highest degree DC left in
Fig. 6. Flowchart of the simulation experiments.
the network. During the process of node removal, we trackedthe two sets of performance metrics for the original and rewirednetworks. Fig. 6 shows the logic of the simulation experiments.Fig. 7 illustrates the networks’ responses to random disruptions(with an average of 30 runs). Fig. 8 shows the networks’ re-sponses to targeted disruptions (with an average of 30 runs).
B. Results
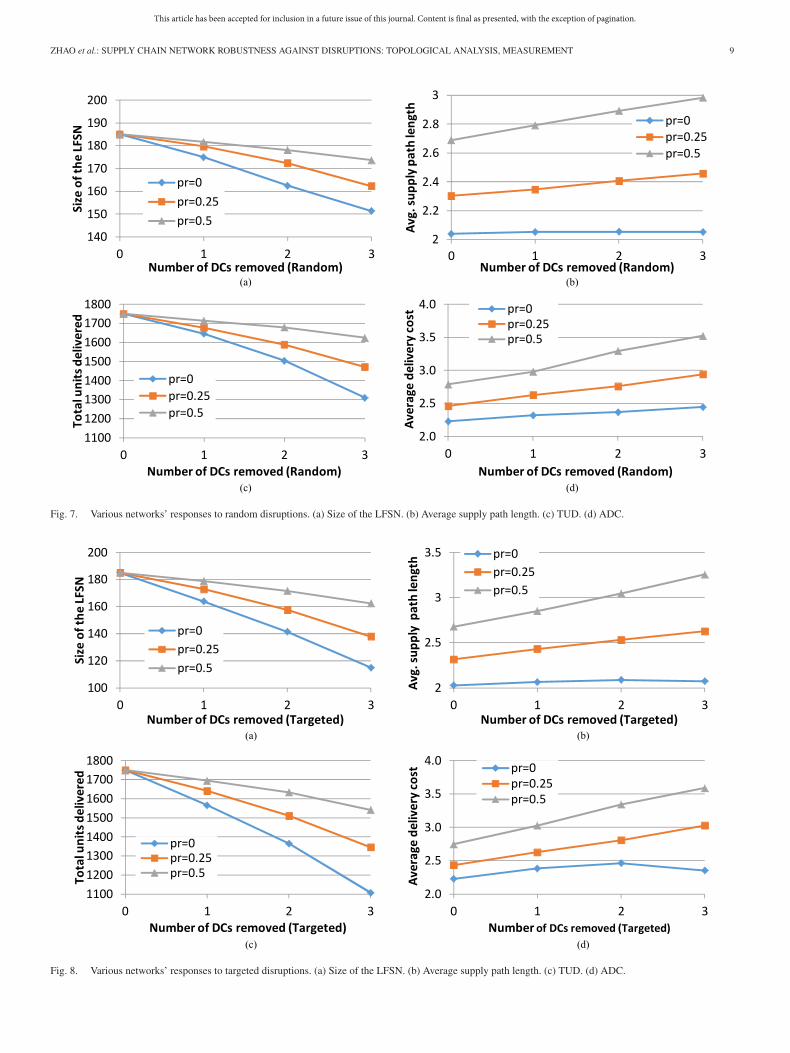
The performance of the original and the rewired distributionnetworks (with two different rewiring probabilities) under bothrandom and targeted disruptions are shown in Figs. 7 and 8.The horizontal axis shows the number of removed DCs, andthe vertical axis the performance metrics. For each disruptionscenario, two sets of performance metrics (i.e., four metrics) areillustrated. For the original distribution network (pr = 0), itssize of the LFSN and TUD deteriorate very fast, especially intargeted disruptions, because the network is easily fragmentedby disruptions and many stores’ access to warehouses is lost.Meanwhile, for those stores that can still access supplies, thenetwork is able to maintain low average path length and ADCin both types of disruptions, because nodes in the network gen-
This article has been accepted for inclusion in a future issue of this journal. Content is final as presented, with the exception of pagination.
ZHAO et al.: SUPPLY CHAIN NETWORK ROBUSTNESS AGAINST DISRUPTIONS: TOPOLOGICAL ANALYSIS, MEASUREMENT 9
Fig. 7. Various networks’ responses to random disruptions. (a) Size of the LFSN. (b) Average supply path length. (c) TUD. (d) ADC.
Fig. 8. Various networks’ responses to targeted disruptions. (a) Size of the LFSN. (b) Average supply path length. (c) TUD. (d) ADC.
This article has been accepted for inclusion in a future issue of this journal. Content is final as presented, with the exception of pagination.
10 IEEE TRANSACTIONS ON ENGINEERING MANAGEMENT
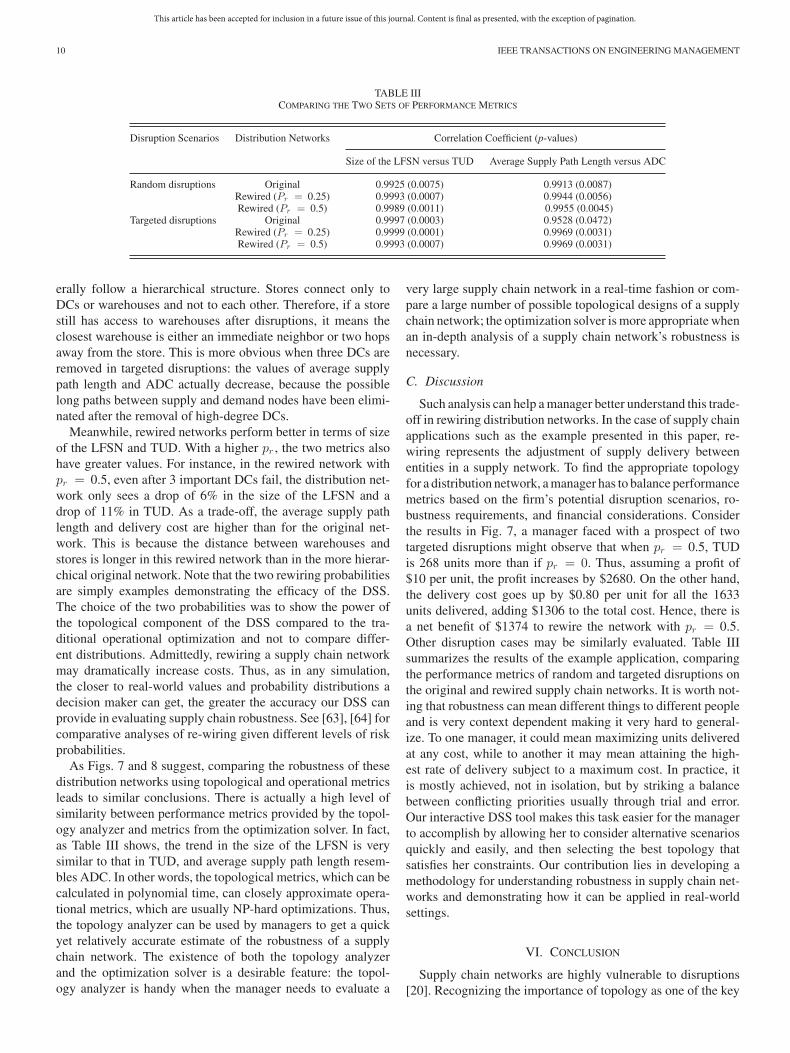
TABLE IIICOMPARING THE TWO SETS OF PERFORMANCE METRICS
Disruption Scenarios Distribution Networks Correlation Coefficient (p-values)
Size of the LFSN versus TUD Average Supply Path Length versus ADC
Random disruptions Original 0.9925 (0.0075) 0.9913 (0.0087)Rewired (Pr = 0.25) 0.9993 (0.0007) 0.9944 (0.0056)Rewired (Pr = 0.5) 0.9989 (0.0011) 0.9955 (0.0045)
Targeted disruptions Original 0.9997 (0.0003) 0.9528 (0.0472)Rewired (Pr = 0.25) 0.9999 (0.0001) 0.9969 (0.0031)Rewired (Pr = 0.5) 0.9993 (0.0007) 0.9969 (0.0031)
erally follow a hierarchical structure. Stores connect only toDCs or warehouses and not to each other. Therefore, if a storestill has access to warehouses after disruptions, it means theclosest warehouse is either an immediate neighbor or two hopsaway from the store. This is more obvious when three DCs areremoved in targeted disruptions: the values of average supplypath length and ADC actually decrease, because the possiblelong paths between supply and demand nodes have been elimi-nated after the removal of high-degree DCs.
Meanwhile, rewired networks perform better in terms of sizeof the LFSN and TUD. With a higher pr , the two metrics alsohave greater values. For instance, in the rewired network withpr = 0.5, even after 3 important DCs fail, the distribution net-work only sees a drop of 6% in the size of the LFSN and adrop of 11% in TUD. As a trade-off, the average supply pathlength and delivery cost are higher than for the original net-work. This is because the distance between warehouses andstores is longer in this rewired network than in the more hierar-chical original network. Note that the two rewiring probabilitiesare simply examples demonstrating the efficacy of the DSS.The choice of the two probabilities was to show the power ofthe topological component of the DSS compared to the tra-ditional operational optimization and not to compare differ-ent distributions. Admittedly, rewiring a supply chain networkmay dramatically increase costs. Thus, as in any simulation,the closer to real-world values and probability distributions adecision maker can get, the greater the accuracy our DSS canprovide in evaluating supply chain robustness. See [63], [64] forcomparative analyses of re-wiring given different levels of riskprobabilities.
As Figs. 7 and 8 suggest, comparing the robustness of thesedistribution networks using topological and operational metricsleads to similar conclusions. There is actually a high level ofsimilarity between performance metrics provided by the topol-ogy analyzer and metrics from the optimization solver. In fact,as Table III shows, the trend in the size of the LFSN is verysimilar to that in TUD, and average supply path length resem-bles ADC. In other words, the topological metrics, which can becalculated in polynomial time, can closely approximate opera-tional metrics, which are usually NP-hard optimizations. Thus,the topology analyzer can be used by managers to get a quickyet relatively accurate estimate of the robustness of a supplychain network. The existence of both the topology analyzerand the optimization solver is a desirable feature: the topol-ogy analyzer is handy when the manager needs to evaluate a
very large supply chain network in a real-time fashion or com-pare a large number of possible topological designs of a supplychain network; the optimization solver is more appropriate whenan in-depth analysis of a supply chain network’s robustness isnecessary.
C. Discussion
Such analysis can help a manager better understand this trade-off in rewiring distribution networks. In the case of supply chainapplications such as the example presented in this paper, re-wiring represents the adjustment of supply delivery betweenentities in a supply network. To find the appropriate topologyfor a distribution network, a manager has to balance performancemetrics based on the firm’s potential disruption scenarios, ro-bustness requirements, and financial considerations. Considerthe results in Fig. 7, a manager faced with a prospect of twotargeted disruptions might observe that when pr = 0.5, TUDis 268 units more than if pr = 0. Thus, assuming a profit of$10 per unit, the profit increases by $2680. On the other hand,the delivery cost goes up by $0.80 per unit for all the 1633units delivered, adding $1306 to the total cost. Hence, there isa net benefit of $1374 to rewire the network with pr = 0.5.Other disruption cases may be similarly evaluated. Table IIIsummarizes the results of the example application, comparingthe performance metrics of random and targeted disruptions onthe original and rewired supply chain networks. It is worth not-ing that robustness can mean different things to different peopleand is very context dependent making it very hard to general-ize. To one manager, it could mean maximizing units deliveredat any cost, while to another it may mean attaining the high-est rate of delivery subject to a maximum cost. In practice, itis mostly achieved, not in isolation, but by striking a balancebetween conflicting priorities usually through trial and error.Our interactive DSS tool makes this task easier for the managerto accomplish by allowing her to consider alternative scenariosquickly and easily, and then selecting the best topology thatsatisfies her constraints. Our contribution lies in developing amethodology for understanding robustness in supply chain net-works and demonstrating how it can be applied in real-worldsettings.
VI. CONCLUSION
Supply chain networks are highly vulnerable to disruptions[20]. Recognizing the importance of topology as one of the key
This article has been accepted for inclusion in a future issue of this journal. Content is final as presented, with the exception of pagination.
ZHAO et al.: SUPPLY CHAIN NETWORK ROBUSTNESS AGAINST DISRUPTIONS: TOPOLOGICAL ANALYSIS, MEASUREMENT 11
determinants for supply chain robustness, we proposed a DSSto evaluate the robustness of different supply chain networktopologies against disruptions. The architecture consists of ascenario analyzer, a network generator, a disruption simulator,and a performance evaluator. The network generator producesdifferent topologies using various network building and adjust-ment strategies. The disruption simulator applies different typesof random and targeted disruptions to a supply chain network.The robustness of a supply chain network against disruptionscan be measured by two modules in the performance evaluator.
1) The optimization solver finds the optimal way to routegoods through pre- and post-disruption supply chain net-works by solving an optimization model based on an IPformulation. The optimization outcome provides key op-erational metrics such as TUD, ADC, and the flow ofgoods between nodes.
2) The topology analyzer efficiently finds performance met-rics through network topologies and the heterogeneousroles of nodes.
The different roles of supply chain nodes are modeled torepresent real-world supply chains. Thus, the DSS’s ability toprovide the two sets of performance metrics further improvesits power in evaluating different topological designs of supplychain networks, and those networks’ abilities to perform at adesired level in the presence of disruptions.
It is desirable to have both topology analyzer and the op-timization solver within a decision support tool like the onewe proposed for two reasons: First, it offers two different usecases for managers to evaluate the performance of their dis-tribution networks against disruptions. The topology analyzeruseful when a manager needs to evaluate the post-disruptionperformance of a large distribution network in real time or tocompare the post-disruption performance of a large numberof possible topological designs of a supply distribution net-work. The optimization solver is more appropriate if an in-depth analysis of a supply distribution network’s robustness isnecessary. This is because computing topological metrics fromthe topology analyzer (polynomial time) is much faster thanfinding an optimal solution from the optimization solver (NP-hard). Using the topology analyzer also makes it possible formanagers to use this tool beyond their own distribution net-work, because it is easier to collect data for an inter-form supplychain network’s topology than operational data at different firms(e.g., delivery cost and capacities of other firms). With topol-ogy analyzer metrics, a manager can get an estimation of howthe firm’s supply chain network would perform if a disruptionoccurs.
We demonstrated the efficacy of our decision support sys-tem through an example application of a retailer’s distributionnetwork. Managers can perform scenario analysis and use thisDSS to evaluate how different topologies affect the robustnessof a supply chain network. Decision makers can perform stresstests of their supply chains through “what if” analyses by build-ing and modifying supply chain networks [9], [11]. By doingso, decision makers should be able to ask questions like “whatis the effect on our network when this node goes down?” or“what happens when an unexpected (random) disruption oc-curs?” These stress tests compare the performance of supply
chain networks under multiple topologies and disruption events,which will enable decision makers to increase the network ro-bustness. Although a firm does not often build a supply chainnetwork from scratch, they do make frequent adjustments torespond to today’s dynamic global markets [34] and launch newinitiatives in rebuilding their supply chain networks [19]. Thus,our DSS also allows a manager to adjust the topology of anexisting supply chain network in many ways and analyze theeffect of doing so.
In addition, this approach also enables managers to study howvarying other parameters in a supply chain network will influ-ence its robustness. Managers often underestimate or simplyignore the potential impact of disruptions in their supply chains.This DSS offers an interactive visualization, measurement, andoptimization of the influence of disruptions and their mitigationthrough topological design. For instance, a user may specifya range of values or statistical distributions for supply/demandcapacities, throughput capacities, as well as transportation anddistribution costs. The performance evaluator can generate dif-ferent weighted networks and optimization models for theseparameter values and evaluate the different “what-if” scenarioscorresponding to them. Also, by analyzing the removal of whichnodes/edges produces the most impact, a manager can identifythe most critical entities that should be fortified or protected.This decision support system fills a research gap in robustnessand supply chain network design [9], [11].
A limitation of this research is the lack of automation inselecting the ideal topology. However, this limitation is partlydue to the ontology of supply chain networks. While it wouldbe ideal to allow the DSS to select the optimal network, veryoften network nodes and edges are selected for reasons that falloutside of linear parameters. For example, a specific suppliermay or may not be selected based on some past experienceor organizational knowledge. Organizations have been burnedby single source suppliers, and create policies such as neverto have less than two sources. It may also be that there is astrong personal relationship that exists between the decisionmakers of a supplier-customer business relationship that affectsthe topology of the network in spite of the inherent risks. Thus,we believe that a DSS as an aid for decision makers is themost appropriate approach to this complex problem. Insteadof deriving the optimal topology based on the mathematicalprogramming components of the DSS, we choose to provide aset of alternatives and let the decision maker perform what-ifanalysis with the DSS. The complex nature of human decisionmaking with subtle and often non-explicit constraints is whatcontinues to drive the need for decision support systems overcompletely automated decision systems. Another limitation ofthis research is the focus on node-centric models. Supply chainnetworks may also suffer from disruptions in the links betweennodes, such as rail strike, highway closure, air delay or closuredue to weather or strike. Thus, supply chain managers wouldbenefit by not only evaluating node failures, but also specificallylink failures. There has been research in this area, specifically inthe transportation domain [40], [50], and supply chain networkswould benefit from these models as well. Finally, this researchis limited to the context of transshipment and logistics, and thusis not generalizable to all networks.
This article has been accepted for inclusion in a future issue of this journal. Content is final as presented, with the exception of pagination.
12 IEEE TRANSACTIONS ON ENGINEERING MANAGEMENT
For future research, we would like to add additional con-straints to the IP model in the optimization solver such as upperlimits on the capacities of nodes or flows along edges to ob-serve their effect on supply chain network performance androbustness. It would also be interesting to investigate supplychain network robustness via a link-based approach as well asmeasuring the assortativity of the network [15]. Additionally,as robustness is one component for resiliency, we envision anenhanced decision support system that would measure a supplychain network’s ability to recover to pre-disruption performancelevels as well as the rate of recovery [62]. Lastly, real-time eventmanagement would allow decision makers the ability to quicklyrespond to disruptions, and thereby reduce the impact of thedisruptions.
APPENDIX
REFERENCES
[1] R. Albert, H. Jeong, and A.-L. Barabasi, “Error and attack tolerance ofcomplex networks,” Nature, vol. 406, pp. 378–382, 2000.
[2] A. L. Barabasi and R. Albert, “Emergence of scaling in random networks,”Science, vol. 286, pp. 509–512, 1999.
[3] J. V. Blackhurst, C. W. Craighead, D. Elkins, and R. B. Handfield, Anempirically derived agenda of critical research issues for managing supply-chain disruptions, Int. J. Prod. Res., vol. 43, pp. 4067–4081, 2005.
[4] J. V. Blackhurst, K. P. Scheibe, and D. J. Johnson, “Supplier risk assess-ment and monitoring for the automotive industry,” Int. J. Phys. Distrib.Log. Manage., vol. 38, pp. 143–165, 2008.
[5] E. Brandon-Jones, B. Squire, C. W. Autry, and K. J. Petersen, “A contin-gent resource-based perspective of supply chain resilience and robustness,”J. Supply Chain Manage., vol. 50, pp. 55–73, 2014.
[6] M. Bruneau et al., “A framework to quantitatively assess and enhance theseismic resilience of communities,” Earthquake Spectra, vol. 19, pp. 733–752, 2003.
[7] P. Burnson, “Procurement is top area of risk, Consero survey reveals,” inSupply Chain Manage. Review. Morganville, NJ, USA: Peerless MediaLLC, 2015.
[8] D. S. Callaway, M. E. Newman, S. H. Strogatz, and D. J. Watts, “Networkrobustness and fragility: Percolation on random graphs,” Phys. Rev. Lett.,vol. 85, p. 5468, 2000.
[9] S. Chopra and M. S. Sodhi, “Managing risk to avoid supply-chain break-down,” MIT Sloan Manage. Rev., vol. 46, p. 53, 2004.
[10] S. Chopra and M. S. Sodhi, “Supply-chain breakdown,” MIT Sloan Man-age. Rev., vol. 46, pp. 53–61, 2004.
[11] S. Chopra and M. S. Sodhi, “Reducing the risk of supply chain disrup-tions,” MIT Sloan Manage. Rev., vol. 55, pp. 73–80, 2014.
[12] M. Christopher and H. Peck, “Building the resilient supply chain,” Int. J.Log. Manage., vol. 15, pp. 1–14, 2004.
[13] N. R. Council, Network Science. Washington, DC, USA: The NationalAcademies Press, 2005.
[14] C. W. Craighead, J. Blackhurst, M. J. Rungtusanatham, and R. B. Hand-field, “The severity of supply chain disruptions: Design characteristics andmitigation capabilities,” Decision Sci., vol. 38, pp. 131–156, 2007.
[15] S. Derrible and C. Kennedy, “The complexity and robustness of metronetworks,” Phys. A: Stat. Mech. Appl., vol. 389, pp. 3678–3691, 2010.
[16] E. Dijkstra, “A note on two problems in connexion with graphs,” Nu-merische Mathematik, vol. 1, pp. 269–271, 1959.
[17] S. N. Dorogovtsev and J. F. Mendes, “Evolution of networks,” Adv. Phys.,vol. 51, pp. 1079–1187, 2002.
[18] M. N. Faisal, D. Banwet, and R. Shankar, “Quantification of risk mitigationenvironment of supply chains using graph theory and matrix methods,”Eur. J. Ind. Eng., vol. 1, pp. 22–39, 2007.
[19] E. D. Fassoula, “Transforming the supply chain,” J. Manufacturing Tech-nol. Manage., vol. 17, pp. 848–860, 2006.
[20] J. Fiksel, M. Polyviou, K. L. Croxton, and T. J. Pettit, “From risk toresilience: Learning to deal with disruption,” MIT Sloan Manage. Rev.,vol. 56, p. 79, 2015.
[21] R. W. Floyd, “Algorithm 97: Shortest path,” Commun. ACM, vol. 5, p. 345,1962.
[22] A. Ghadge, S. Dani, and R. Kalawsky, “Systems thinking for modelingrisk propagation in supply networks,” in Proc. 2011 IEEE Int. Conf. Ind.Eng. Eng. Manage., 2011, pp. 1685–1689.
[23] T. H. Grubesic and A. T. Murray, “Vital nodes, interconnected infrastruc-tures, and the geographies of network survivability,” in Proc. Ann. Assoc.Amer. Geographers, 2006, vol. 96, pp. 64–83.
[24] E. J. Hearnshaw and M. M. Wilson, “A complex network approach to sup-ply chain network theory,” Int. J. Oper. Prod. Manage., vol. 33, pp. 442–469, 2013.
[25] U. Juttner and S. Maklan, “Supply chain resilience in the global financialcrisis: An empirical study,” Supply Chain Manage. Int. J., vol. 16, pp. 246–259, 2011.
[26] Y. Kim, T. Y. Choi, T. Yan, and K. Dooley, “Structural investigation ofsupply networks: A social network analysis approach,” J. Oper. Manage.,vol. 29, pp. 194–211, 2011.
[27] W. Klibi and A. Martel, “The design of robust value-creating supply chainnetworks,” OR Spectrum, vol. 35 pp. 867–903, 2013.
[28] W. Klibi, A. Martel, and A. Guitouni, “The design of robust value-creating supply chain networks: A critical review,” Eur. J. OperationalRes., vol. 203, pp. 283–293, 2010.
[29] L. Kocarev and V. In, “Network science: A new paradigm shift,” IEEENetw. Mag. Global Internetw., vol. 24, no. 6, pp. 6–9, Nov./Dec. 2010.
[30] V. Latora and M. Marchiori, “Vulnerability and protection of infrastructurenetworks,” Phys. Rev. E, vol. 71, p. 4, 2005.
[31] S. Lazzarini, F. Chaddad, and M. Cook, “Integrating supply chain andnetwork analyses: The study of netchains,” J. Chain Netw. Sci., vol. 1,pp. 7–22, 2001.
[32] I. Manuj and J. T. Mentzer, “Global supply chain risk management strate-gies,” Int. J. Phys. Distrib. Log. Manage., vol. 38, pp. 192–223, 2008.
[33] K. A. Marley, P. T. Ward, and J. A. Hill, “Mitigating supply chaindisruptions—A normal accident perspective,” Supply Chain Manage. Int.J., vol. 19, pp. 142–152, 2014.
[34] R. Martin, “Changing the mind of the corporation,” Harvard BusinessRev., vol. 71, no. 6, pp. 81–94, 1993.
[35] A. Nagurney, “Optimal supply chain network design and redesign at min-imal total cost and with demand satisfaction,” Int. J. Prod. Econ., vol. 128,pp. 200–208, 2010.
[36] A. Nair, R. Narasimhan, and T. Y. Choi, “Supply networks as a complexadaptive system: Toward simulation-based theory building on evolutionarydecision making,” Decision Sci., vol. 40, pp. 783–815, 2009.
[37] A. Nair and J. M. Vidal, “Supply network topology and robustness againstdisruptions—An investigation using multi-agent model,” Int. J. Prod. Res.,vol. 49, pp. 1391–1404, 2011.
[38] M. E. J. Newman, “The structure and function of complex networks,”SIAM Rev., vol. 45, pp. 167–256, 2003.
[39] M. E. J. Newman, “Mathematics of networks,” in The New Palgrave Ency-clopedia of Economics, L. E. Blume and S. N. Durlauf, Eds. Basingstoke,U.K.: Palgrave Macmillan, 2008.

This article has been accepted for inclusion in a future issue of this journal. Content is final as presented, with the exception of pagination.
ZHAO et al.: SUPPLY CHAIN NETWORK ROBUSTNESS AGAINST DISRUPTIONS: TOPOLOGICAL ANALYSIS, MEASUREMENT 13
[40] D. C. Novak and J. L. Sullivan, A link-focused methodology for evaluat-ing accessibility to emergency services, Decision Support Syst., vol. 57,pp. 309–319, 2014.
[41] J. O’Madadhain, D. Fisher, T. Nelson, S. White, and Y.-B. Boey,“The Java universal network/graph framework (JUNG): A brieftour,” in Proc. Music-to-Knowledge North Amer. Workshop, Univer-sity of Illinois, 2005. [Online]. Available: http://jung.sourceforge.net/presentations/JUNG_M2K.pdf
[42] J. B. Rice and F. Caniato, “Building a secure and resilient supply network,”Supply Chain Manage. Rev., vol. 7, pp. 22–30, 2003.
[43] K. P. Scheibe and J. V. Blackhurst, “Supply chain disruption propagation:A systemic risk and normal accident theory perspective,” Int. J. Prod. Res.,to be published.
[44] K. P. Scheibe, L. W. Carstensen, T. R. Rakes, and L. P. Rees, “Goingthe last mile: A spatial decision support system for wireless broadbandcommunications,” Decision Support Syst., vol. 42, pp. 557–570, 2006.
[45] K. P. Scheibe and C. T. Ragsdale, “A model for the capacitated, hop-constrained, per-packet wireless mesh network design problem,” Eur. J.Oper. Res., vol. 197, pp. 773–784, 2009.
[46] B. Shi, “A decentralized mechanism for improving the functional ro-bustness of distribution networks,” IEEE Trans. Syst., Man, Cybern. B,OnlineFirst, vol. 42, no. 5, pp. 1–14, Oct. 2012.
[47] J. B. Skipper and J. B. Hanna, Minimizing supply chain disruption riskthrough enhanced flexibility, Int. J. Phys. Distrib. Log. Manage., vol. 39,pp. 404–427, 2009.
[48] D. E. Snediker, A. T. Murray, and T. C. Matisziw, “Decision support fornetwork disruption mitigation,” Decision Support Syst., vol. 44, pp. 954–969, 2008.
[49] Spinnaker, Introduction to Strategic Supply Chain Network Design. Den-ver, CO, USA: Spinnaker Management Group LLC, 2012. [Online]. Avail-able: www.spinnakermgmt.com
[50] J. Sullivan, D. Novak, L. Aultman-Hall, and D. M. Scott, “Identifyingcritical road segments and measuring system-wide robustness in trans-portation networks with isolating links: A link-based capacity-reductionapproach,” Transport. Res. A: Policy Practice, vol. 44, pp. 323–336, 2010.
[51] A. Surana, S. Kumara, M. Greaves, and U. N. Raghavan, “Supply-chainnetworks: A complex adaptive systems perspective,” Int. J. Prod. Res.,vol. 43, pp. 4235–4265, 2005.
[52] C. S. Tang, “Robust strategies for mitigating supply chain disruptions,”Int. J. Log.: Res. Appl., vol. 9, pp. 33–45, 2006.
[53] H. P. Thadakamalla, U. N. Raghavan, S. Kumara, and R. Albert, “Surviv-ability of multiagent-based supply networks: A topological perspective,”IEEE Intell. Syst., vol. 19 pp. 24–31, 2004.
[54] G. S. Van Der Vegt, P. Essens, M. Wahlstrom, and G. George, “Managingrisk and resilience,” Acad. Manage. J., vol. 58, pp. 971–980, 2015.
[55] H. M. Wagner, “On a class of capacitated transportation problems,” Man-age. Sci., vol. 5, pp. 304–318, 1959.
[56] S. M. Wagner and C. Bode, “An empirical investigation into supply chainvulnerability,” J. Purchasing Supply Manage., vol. 12, pp. 301–312, 2006.
[57] S. M. Wagner and C. Bode, “Dominant risks and risk management prac-tices in supply chains,” in Supply Chain Risk. Boston, MA, USA: Springer,2009, pp. 271–290.
[58] S. M. Wagner and N. Neshat, “Assessing the vulnerability of supply chainsusing graph theory,” Int. J. Prod. Econ., vol. 126, pp. 121–129, 2010.
[59] D. J. Watts and S. H. Strogatz, “Collective dynamics of ‘small-world’networks,” Nature, vol. 393, pp. 440–442, 1998.
[60] A. Wieland, and C. M. Wallenburg, “Dealing with supply chain risks:Linking risk management practices and strategies to performance,” Int. J.Phys. Distrib. Log. Manage., vol. 42, pp. 887–905, 2012.
[61] F. Xie and D. Levinson, “Measuring the structure of road networks,”Geographical Anal., vol. 39, pp. 336–356, 2007.
[62] X. Zhang, E. Miller-Hooks, and K. Denny, “Assessing the role of networktopology in transportation network resilience,” J. Transport Geography,vol. 46, pp. 35–45, 2015.
[63] K. Zhao, A. Kumar, T. P. Harrison, and J. Yen, “Analyzing the resilienceof complex supply network topologies against random and targeted dis-ruptions,” IEEE Syst. J., vol. 5, no. 1, pp. 28–39, Mar. 2011.
[64] K. Zhao, A. Kumar, and J. Yen, “Achieving high robustness in supplydistribution networks by rewiring,” IEEE Trans. Eng. Manage., vol. 58,no. 2, pp. 347–362, May 2011.
[65] C. W. Zobel, “Representing perceived tradeoffs in defining disaster re-silience,” Decision Support Syst., vol. 50, pp. 394–403, 2011.
[66] C. W. Zobel and L. Khansa, “Characterizing multi-event disaster re-silience,” Comput. Oper. Res., vol. 42, pp. 83–94, 2014.
Kang Zhao received the Ph.D. degree in informationsciences and technology from Penn State University,State College, PA, USA, 2012.
He is currently an Assistant Professor with theTippie College of Business, University of Iowa, IowaCity, IA, USA. His current research interests includedata science and social computing, especially theanalysis, modeling, mining, and simulation of so-cial/business networks and social media. His researchhas been featured in public media from more than 20countries.
Prof. Zhao was the Chair for the INFORMS Artificial Intelligence Section2014–2016.
Kevin Scheibe received the Ph.D. degree in busi-ness information technology from Virginia Polytech-nic Institute and State University, Blacksburg, VA,USA, in 2003.
He is currently a Kingland Faculty Fellow in busi-ness analytics and Associate Professor of manage-ment information systems with Iowa State Univer-sity, Ames, IA, USA. His current research interestsinclude business analytics, IT privacy and security,supply chain risk, spatial decision support systems,wireless telecommunications, and IT outsourcing. He
has authored or co-authored in journals such as the Decision Sciences Journal,the European Journal of Operations Research, Decision Support Systems, Com-munications of the ACM, and Computers in Human Behavior.
Dr. Scheibe is a member of the Association for Information Systems and theDecision Sciences Institute.
Jennifer Blackhurst received the Ph.D. degree inindustrial engineering from the University of Iowa,Iowa City, IA, USA, in 2002.
She is currently a Professor of management sci-ences with the Tippie College of Business, Universityof Iowa. She is also the Faculty Director for the MBABusiness Analytics Career Academy and the Direc-tor of the Kathleen Dore - Henry B. Tippie Women’sMBA Leadership Program. Her current research in-terest include supply chain risk and disruption man-agement, supplier assessment and selection, and sup-
ply chain design and coordination.
Akhil Kumar (SM’16) received the Ph.D. degree inbusiness administration from the University of Cali-fornia, Berkeley, CA, USA, in 1998.
He is currently a Professor of information systemswith the Smeal College of Business, PennsylvaniaState University, University Park, PA, USA. His cur-rent research interests include business process man-agement (BPM) and workflow systems, process min-ing, supply chain and business analytics, and healthIT.
Dr. Kumar has been a Principal Investigator forthe National Science Foundation and also received support from IBM, Sun Mi-crosystems, and other organizations for his work. He is an Associate Editor forthe ACM Transactions on Management Information Systems.


![Welcome []Title Technology Disruptions Author Oracle Corporation Subject Technology Disruptions Keywords Technolgy Disruptions, Mobile Internet Access, Public Cloud, Consumer Technology,](https://static.fdocuments.net/doc/165x107/5f6684cb020da61543073133/welcome-title-technology-disruptions-author-oracle-corporation-subject-technology.jpg)