
IEEE P2020 Automotive Imaging White Paper · IEEE P2020 Automotive Imaging White Paper IEEE-SA...
32
IEEE P2020 Automotive Imaging White Paper IEEE-SA White Paper IEEE | 3 Park Avenue | New York, NY 10016-5997 | USA Authored by Members of the IEEE P2020 Working Group
Transcript of IEEE P2020 Automotive Imaging White Paper · IEEE P2020 Automotive Imaging White Paper IEEE-SA...
IEEE P2020 Automotive Imaging White Paper
IEEE-SA White Paper
IEEE | 3 Park Avenue | New York, NY 10016-5997 | USA
Authored by Members of the IEEE P2020
Working Group
i
Copyright © 2018 IEEE. All rights reserved.
IEEE P2020 Automotive Imaging
White Paper
Authored by
Members of the IEEE P2020 Working Group
ii
Copyright © 2018 IEEE. All rights reserved.
Trademarks and Disclaimers
IEEE believes the information in this publication is accurate as of its publication date; suchinformationissubjecttochangewithoutnotice.IEEEisnotresponsibleforanyinadvertenterrors.
TheInstituteofElectricalandElectronicsEngineers,Inc.3ParkAvenue,NewYork,NY10016‐5997,USACopyright©2018byTheInstituteofElectricalandElectronicsEngineers,Inc.Allrightsreserved.PublishedAugust2018.PrintedintheUnitedStatesofAmerica.IEEEisaregisteredtrademarkintheU.S.Patent&TrademarkOffice,ownedbyTheInstituteofElectricalandElectronicsEngineers,Incorporated.PDF:ISBN978‐1‐5044‐5113‐0STDVA23262IEEEprohibitsdiscrimination,harassment,andbullying.Formoreinformation,visithttp://www.ieee.org/web/aboutus/whatis/policies/p9‐26.html.Nopartofthispublicationmaybereproducedinanyform,inanelectronicretrievalsystem,orotherwise,withoutthepriorwrittenpermissionofthepublisher.ToorderIEEEPressPublications,call1‐800‐678‐IEEE.FindIEEEstandardsandstandards‐relatedproductlistingsat:http://standards.ieee.org
iii
Copyright © 2018 IEEE. All rights reserved.
Notice and Disclaimer of Liability Concerning the Use of IEEE‐SA Documents
This IEEE Standards Association (“IEEE‐SA”) publication (“Work”) is not a consensus standard document. Specifically, this document is NOT AN IEEE STANDARD. Information contained in this Work has been created by, or obtained from, sources believed to be reliable, and reviewed by members of the IEEE P2020 Working Group activity that produced this Work. IEEE and the IEEE P2020 Working Group members expressly disclaim all warranties (express, implied, and statutory) related to this Work, including, but not limited to, the warranties of: merchantability; fitness for a particular purpose; non‐infringement; quality, accuracy, effectiveness, currency, or completeness of the Work or content within the Work. In addition, IEEE and the IEEE P2020 Working Group members disclaim any and all conditions relating to: results; and workmanlike effort. This IEEE P2020 Working Group document is supplied “AS IS” and “WITH ALL FAULTS.” Although the IEEE P2020 Working Group members who have created this Work believe that the information and guidance given in this Work serve as an enhancement to users, all persons must rely upon their own skill and judgment when making use of it. IN NO EVENT SHALL IEEE OR IEEE P2020 WORKING GROUP MEMBERS BE LIABLE FOR ANY ERRORS OR OMISSIONS OR DIRECT, INDIRECT, INCIDENTAL, SPECIAL, EXEMPLARY, OR CONSEQUENTIAL DAMAGES (INCLUDING, BUT NOT LIMITED TO: PROCUREMENT OF SUBSTITUTE GOODS OR SERVICES; LOSS OF USE, DATA, OR PROFITS; OR BUSINESS INTERRUPTION) HOWEVER CAUSED AND ON ANY THEORY OF LIABILITY, WHETHER IN CONTRACT, STRICT LIABILITY, OR TORT (INCLUDING NEGLIGENCE OR OTHERWISE) ARISING IN ANY WAY OUT OF THE USE OF THIS WORK, EVEN IF ADVISED OF THE POSSIBILITY OF SUCH DAMAGE AND REGARDLESS OF WHETHER SUCH DAMAGE WAS FORESEEABLE. Further, information contained in this Work may be protected by intellectual property rights held by third parties or organizations, and the use of this information may require the user to negotiate with any such rights holders in order to legally acquire the rights to do so. IEEE and the IEEE P2020 Working Group members make no assurances that the use of the material contained in this work is free from patent infringement. Essential Patent Claims may exist for which no assurances have been made to the IEEE, whether by participants in this IEEE P2020 Working Group activity or entities outside the activity. The IEEE is not responsible for identifying essential patent claims for which a license may be required, for conducting inquiries into the legal validity or scope of patents claims, or determining whether any licensing terms or conditions, if any, or any licensing agreements are reasonable or non‐discriminatory. Users are expressly advised that determination of the validity of any patent rights, and the risk of infringement of such rights, is entirely their own responsibility. No commitment to grant licenses under patent rights on a reasonable or non‐discriminatory basis has been sought or received from any rights holder. The policies and procedures under which this document was created can be viewed at http://standards.ieee.org/about/sasb/iccom/. This Work is published with the understanding that IEEE and the IEEE P2020 Working Group members are supplying information through this Work, not attempting to render engineering or other professional services. If such services are required, the assistance of an appropriate professional should be sought. IEEE is not responsible for the statements and opinions advanced in this Work.
iv
Copyright © 2018 IEEE. All rights reserved.
CONTENTS
ABSTRACT .................................................................................................................................................. 1
ACRONYMS AND ABBREVIATIONS .............................................................................................................. 1
1. OVERVIEW ....................................................................................................................................... 2
A. GOALS OF THIS WHITE PAPER ................................................................................................................ 4
B. STRUCTURE OF THIS WHITE PAPER ......................................................................................................... 5
C. MOTIVATION FOR IEEE P2020 ................................................................................................................. 6
D. IEEE P2020 OVERVIEW AND LONG‐TERM OBJECTIVES ............................................................................. 6
E. SUBGROUPS ........................................................................................................................................... 7
2. PROBLEM STATEMENT ..................................................................................................................... 7
A. SUBGROUP 1—LED FLICKER STANDARDS ................................................................................................ 7
B. SUBGROUP 2—IMAGE QUALITY FOR VIEWING ..................................................................................... 10
C. SUBGROUP 3—IMAGE QUALITY FOR COMPUTER VISION ...................................................................... 14
3. GAP ANALYSIS ............................................................................................................................... 16
4. REFERENCES .................................................................................................................................. 23
5. AUTHORS (CONTRIBUTORS) ........................................................................................................... 24
1
Copyright © 2018 IEEE. All rights reserved.
IEEE P2020 Automotive Imaging White Paper
Abstract
The IEEE‐SA P2020 working group on automotive imaging standards was established in order to address the considerable ambiguity in measurement of image quality of automotive imaging systems, both human and computer vision based. This white paper outlines the goals, achievements, rationale and plans of the subgroup, which has started to work on development of a new standard.1
Image quality plays a crucial role for both automotive viewing and automotive computer vision applications and today’s image evaluation approaches do not necessarily meet the needs of such applications. Currently there is not a consistent approach within the industry to measure automotive image quality. The IEEE P2020 working group is attempting to remedy these deficiencies by connecting people in the field, identifying gaps in existing standards, and working to address these by creating a coherent set of key performance indicators by which camera systems and components may be evaluated in a manner consistent with their intended use. This white paper provides an overview of current activities including initial gap analysis and details of what may be expected from the full standard when published.
Acronyms and abbreviations
The following list of acronyms and abbreviations will be useful when reading this white paper:
ADAS advanced driver assistance system
ADC analog to digital converter
AEC automatic exposure control
AI artificial intelligence
AWB automatic white balance
CaaS car‐as‐a‐service
CDP contrast detection probability
CFA color filter array
CMS camera monitor system
CPIQ camera phone image quality (as used in IEEE Std 1858‐2016 [5])
CRA chief ray angle
CSP color separation probability
DR dynamic range
ECU electronic control unit
1 For information on IEEE P2020, please visit http://sites.ieee.org/sagroups‐2020/
2
Copyright © 2018 IEEE. All rights reserved.
FoV field of view/vision
FUN Fidelity, Usefulness, and Naturalness
GDP gross domestic product
HDR high dynamic range
IQ image quality
ISP image signal processor
JND just noticeable differences
KPI key performance indicators
LTM local tone mapping
MTF Modulation Transfer Function
OECF Opto‐Electronic Conversion Function
PWM pulse width modulation
QE quantum efficiency
QoE quality of experience
RVC rear‐view camera
SAE Society of Automotive Engineers
SNR signal‐to‐noise ratio
SVS surround‐view system
VGA video graphics array (definition of a 640 x 480 resolution display)
Overview
Telephones were once for talking, and cars were once for driving. Things have changed. Mobile phones are now ubiquitous digital assistants with cameras, sensors and extensive connectivity; while cars are on the verge of becoming multi‐sensor, multi‐camera, multi‐modal autonomous artificial intelligence (AI) platforms. There are a number of factors that drive this dramatic evolution of our vehicles—most notably, the ability to improve safety, enable more efficient urban plans, and create new disruptive business models. The key driver for this dramatic evolution in our vehicles is to increase safety.
The World Health Organization recently noted that more than 1.25 million people worldwide die each year as a result of road traffic accidents and between 20 and 50 million more people suffer non‐fatal injuries, with many incurring a disability due to their injury. This results in considerable economic losses to both individuals and their families and to nations as a whole, which equates to approximately 3% of gross domestic product (GDP) for most countries [1].
Advanced sensing will allow closer proximity inter‐vehicle travel distance than human‐controlled vehicles, reducing the necessary lane width and freeing up space for wider sidewalks, bike lanes, and other amenities. As cities transition away from ordinances that require large amounts of land to be used for parking and circulation, they will need to determine how best to make use of that freed‐up space through new approaches of land use and zoning (American Planning Association [2]). Furthermore, the transition to autonomous vehicles brings significant opportunity in terms of new mobility business models (Gao et al. [3]). Car‐as‐a‐service (CaaS) also will provide car mobility services for a large portion of the global population (Business Wire [4]), since no driver’s license is needed, and it will prove to be an affordable transportation solution.
3
Copyright © 2018 IEEE. All rights reserved.
While cameras are crucial for a vehicle to sense and perceive its surroundings, to date there has not been a consistent approach in the automotive industry to measure image quality.
There is an existing standard for mobile phone camera image quality—IEEE Std 1858 [5]. This standard, however, is generally not applicable to automotive requirements, and additionally other image quality standards, such as EMVA1288 [6] or ISO 12233 [7], fall short for when it comes to automotive image quality use cases. Automotive imaging imposes unique challenges due to its varied and distinct landscape of imaging conditions (fish eye, multi-camera, high dynamic range (HDR), temperature range, etc.), which are not adequately addressed in existing approaches. Therefore, the IEEE P2020 working group [8] has set the goal of shaping relevant metrics and key performance indicators (KPIs) for automotive image quality, enabling customers and suppliers to efficiently define, measure, and communicate image quality of their imaging systems.
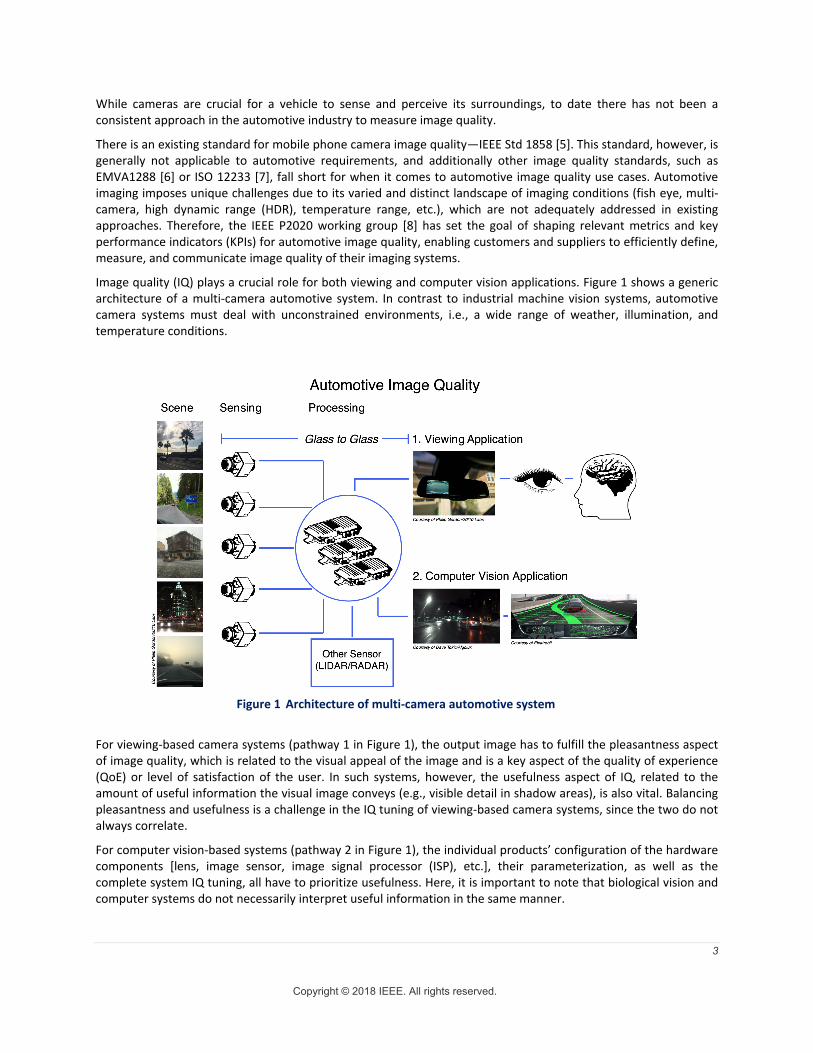
Image quality (IQ) plays a crucial role for both viewing and computer vision applications. Figure 1 shows a generic architecture of a multi-camera automotive system. In contrast to industrial machine vision systems, automotive camera systems must deal with unconstrained environments, i.e., a wide range of weather, illumination, and temperature conditions.
Figure 1 Architecture of multi-camera automotive system
For viewing-based camera systems (pathway 1 in Figure 1), the output image has to fulfill the pleasantness aspect of image quality, which is related to the visual appeal of the image and is a key aspect of the quality of experience (QoE) or level of satisfaction of the user. In such systems, however, the usefulness aspect of IQ, related to the amount of useful information the visual image conveys (e.g., visible detail in shadow areas), is also vital. Balancing pleasantness and usefulness is a challenge in the IQ tuning of viewing-based camera systems, since the two do not always correlate.
For computer vision-based systems (pathway 2 in Figure 1), the individual products’ configuration of the hardware components [lens, image sensor, image signal processor (ISP), etc.], their parameterization, as well as the complete system IQ tuning, all have to prioritize usefulness. Here, it is important to note that biological vision and computer systems do not necessarily interpret useful information in the same manner.
4
Copyright © 2018 IEEE. All rights reserved.
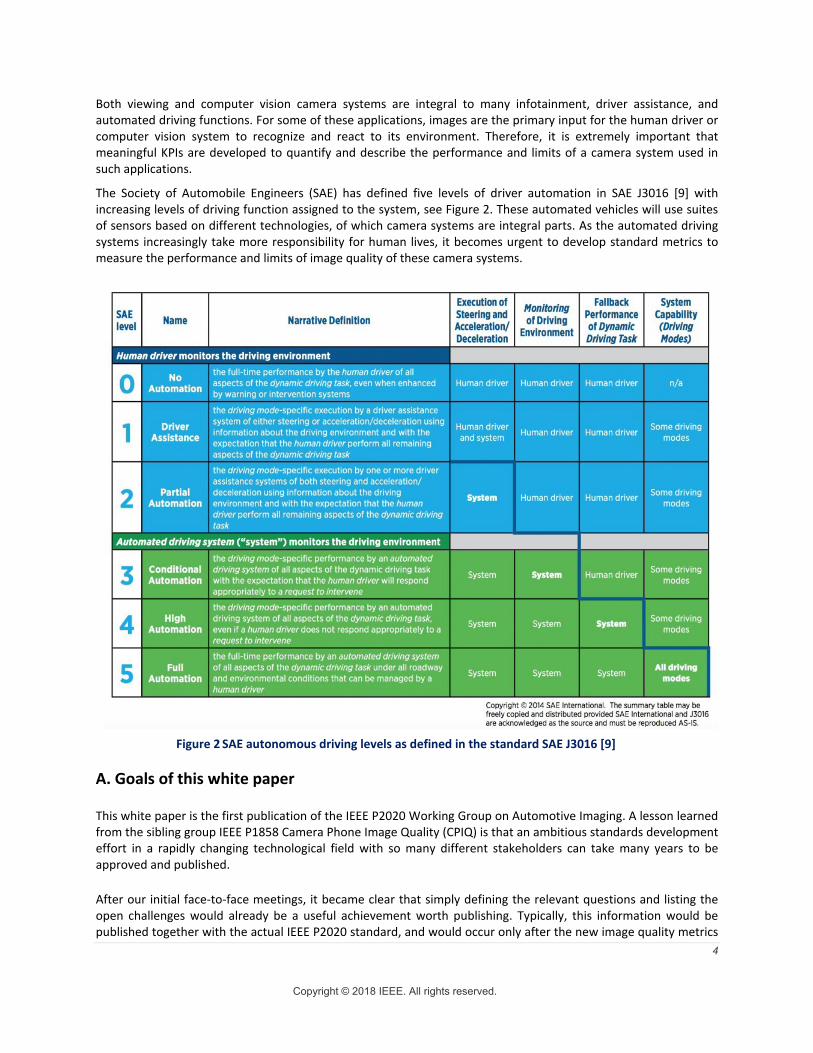
Both viewing and computer vision camera systems are integral to many infotainment, driver assistance, and automated driving functions. For some of these applications, images are the primary input for the human driver or computer vision system to recognize and react to its environment. Therefore, it is extremely important that meaningful KPIs are developed to quantify and describe the performance and limits of a camera system used in such applications.
The Society of Automobile Engineers (SAE) has defined five levels of driver automation in SAE J3016 [9] with increasing levels of driving function assigned to the system, see Figure 2. These automated vehicles will use suites of sensors based on different technologies, of which camera systems are integral parts. As the automated driving systems increasingly take more responsibility for human lives, it becomes urgent to develop standard metrics to measure the performance and limits of image quality of these camera systems.
Figure 2 SAE autonomous driving levels as defined in the standard SAE J3016 [9]
A. Goals of this white paper
This white paper is the first publication of the IEEE P2020 Working Group on Automotive Imaging. A lesson learned from the sibling group IEEE P1858 Camera Phone Image Quality (CPIQ) is that an ambitious standards development effort in a rapidly changing technological field with so many different stakeholders can take many years to be approved and published.
After our initial face-to-face meetings, it became clear that simply defining the relevant questions and listing the open challenges would already be a useful achievement worth publishing. Typically, this information would be published together with the actual IEEE P2020 standard, and would occur only after the new image quality metrics
5
Copyright © 2018 IEEE. All rights reserved.
and new relevant KPIs have been defined, which may still take some time. Therefore, independent of the IEEE P2020 standard publication stage, we decided to aim for intermediate publications to quickly communicate the progress that the working group has made toward understanding automotive image quality. This white paper is the first of these publications.
Consequently, the goals of this white paper are as follows:
1) Raise awareness that image quality for automotive application is not well-defined, critical metrics for specification are missing, leading to repeated work efforts towards that matter. This white paper has two sections that raise the awareness about missing image quality standards. Section 1-C gives the motivation to start the IEEE P2020 effort in the first place. This includes information from the project authorization request (PAR). Section 2 introduces several problem statements; each is a summary of findings by each subgroup. In Section 3, a gap analysis of the existing image quality standards is provided. This is a list of KPIs that are relevant for automotive image quality with a reference to existing standards, and also provides an indication of the KPIs that do not have a standard (i.e., gaps in the standards landscape). Further, the existing standards are often difficult or impossible to apply in automotive applications, or they lack certain key features (e.g., in ISO 12233 [7], the evaluation of HDR is not covered). The presented list contains commentary on what elements we consider missing or incomplete.
2) Raise awareness that the IEEE P2020 working group is trying to remedy these deficiencies to the best extent as possible. It is time to develop a common language that customers and suppliers can use to efficiently describe automotive image quality requirements. This publication attempts to raise awareness that such an effort is under way.
3) Connect with other people already working on similar challenges. Because this field of technology is advancing rapidly, and due to the enormous resources pouring into the development of new camera systems for the automotive market, there are many people and organizations worldwide that are already working on many individual aspects of automotive image quality. What applies to the goal of the standard applies to the development of the standard itself—avoid duplicated efforts by connecting people working in the field and raise synergies. This white paper points out the problematic state of automotive image quality, and thus an important goal of this publication is to link together those who are already working on solutions to fill the gaps.
4) Attract more people to help with the IEEE P2020 effort. This white paper is also a call to attract more people and forge collaborations to help shape the future standards of automotive image quality.
B. Structure of this white paper
The rest of this section explains the motivation for the IEEE P2020 working group in more detail, the long-term objectives of IEEE P2020 as well as the current structure of the working group with its different subgroups. The actual content follows in the next two main sections:
A problem statement by each subgroup is given in Section 2. A gap analysis is given in Section 3.
Section 2 describes the activity of each subgroup and formulates the challenges and missing standards in that area into a problem statement. Currently, three of the later mentioned six subgroups are active and work to define new quality metrics—subgroup 1: LED-Flicker, subgroup 2: IQ for viewing, and subgroup 3: IQ for computer vision.
The problem statements are generalized overviews of the main thrust of the work pursued by each subgroup. A more detailed list of missing metrics and lacking standards is further given in the gap analysis in Section 3, where Table 1 lists KPIs identified as important for automotive image quality. Where applicable, an existing standard is
6
Copyright © 2018 IEEE. All rights reserved.
quoted. In some cases, the table already proposes new metrics to complement or replace existing KPIs. The gap analysis list is a result of collaborative discussion by the working group before and during the preparation of this white paper. We strongly hope that this list of existing standards and the indication of what is missing will be extremely valuable for anyone working in the field of automotive image quality.
C. Motivation for IEEE P2020
The IEEE P2020 Working Group on automotive imaging was inaugurated at a plenary meeting prior to the AutoSens 2016 Conference in Brussels, Belgium. The foundation of such a group arose from the needs of stakeholders in the automotive imaging community after discussing relevant industry challenges.
Since the first automotive cameras were installed on vehicles, the Original Equipment Manufacturers (OEMs1) and the Tier 12 lacked a common language for describing the quality of images in a vehicle. The Tier 1 companies were unable to exchange requirements with Tier 2 component suppliers that unambiguously reflected the aspirations of the OEMs. There were standards developed for highly-restricted aspects of some components, but the industry lacked empirically verifiable, repeatable, and commonly agreed upon descriptions for most salient aspects of the image quality of a vision system in automotive.
In the absence of a clear description of image quality, the various stakeholders independently retreated into the heuristic descriptions, to name one: “image quality is FUN” where FUN is an acronym for the Fidelity, Usefulness, and Naturalness [10]. While providing a level of image quality semantics, this is an insufficient specification. The ambiguity made projects more costly and tension in the projects more likely.
The ambiguity began with a lack of a basic description of image quality itself. While component-level descriptions of performance criteria exist, their properties were neither monotonic indicators of image quality, nor did they articulate image quality sufficiently. Examples of this include the MTF properties of lenses (using objective physical units of cycles per mm) or the disparity of a recorded color value on a ColorChecker® chart3 (using objective physical units of Just Noticeable Differences in a color space).
After several engagements on a personal and professional level, largely facilitated by the AutoSens conference environment, a group of automotive imaging professionals formed and organized themselves into the IEEE P2020 working group.
An overview on the state of IEEE P2020 was delivered at AutoSens 2017 in Detroit on 21 May 2017 as part of the outreach work of the group in the industry [11].
D. IEEE P2020 overview and long-term objectives The overview and long-term objectives of the IEEE P2020 standard are summarized as follows:
a) Scope: This standard addresses the fundamental attributes that contribute to image quality for automotive advanced driver assistance systems (ADAS) applications, as well as identifying existing metrics and other useful information relating to these attributes. It defines a standardized suite of objective and subjective test methods for measuring automotive camera image quality attributes. Further, it specifies tools and test methods to facilitate standards-based communication and comparison among OEM and Tier 1 system integrators and component vendors regarding automotive image quality.
1 Original Equipment Manufacturers—the automobile companies. 2 A Tier 1 company is one that supplies components directly to the original equipment manufacturer (OEM) in the supply chain. A Tier n+1 company supplies a Tier n company in a supply chain. 3 ColorChecker is a registered trademark by X-Rite.
7
Copyright © 2018 IEEE. All rights reserved.
b) Purpose: This standard specifies methods and metrics for measuring and testing automotive image quality to ensure consistency and create cross-industry reference points.
c) Need for the project: Cameras are being used in greater numbers in automotive applications. Most of these systems have been developed independently, with no standardized calibration or measurement of image quality. Consumers have no standard reference point when using camera embedded systems, and OEM or Tier 1 developers cannot compare camera systems side by side.
d) Stakeholders for the standard: Automotive OEMs, Automotive Tier 1 suppliers, image processing software and hardware companies, optics companies, sensor manufacturers, safety certification bodies, end users (drivers).
E. Subgroups
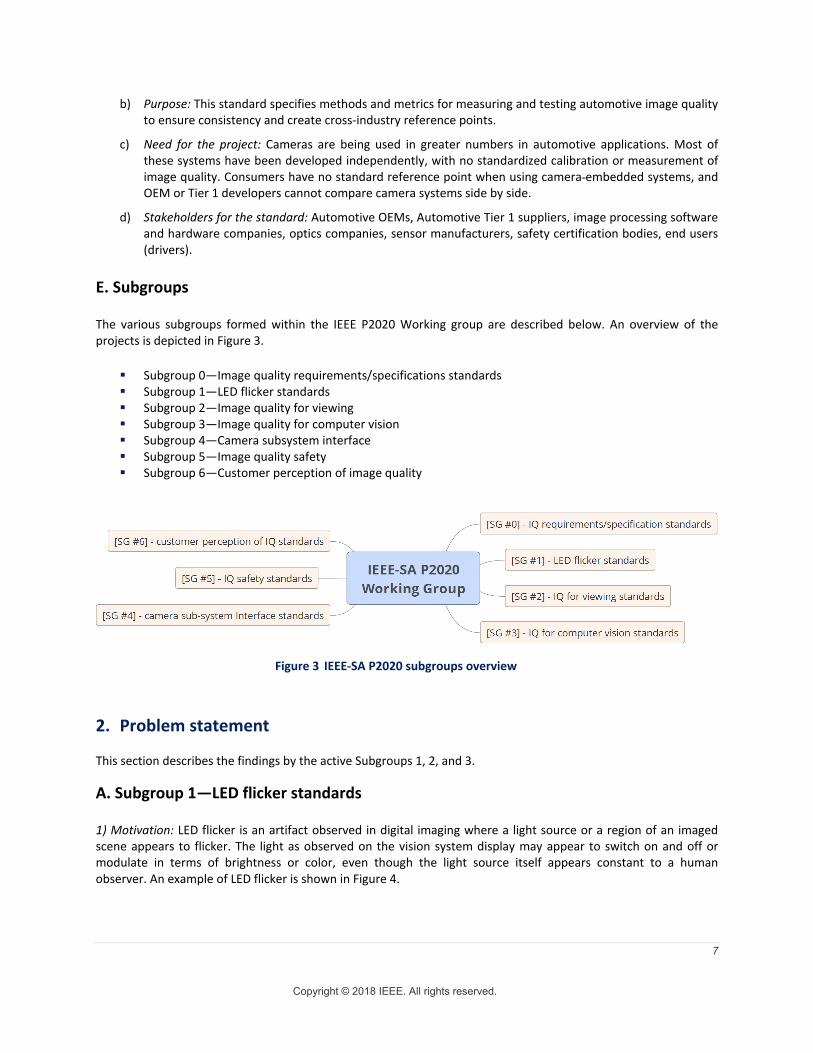
The various subgroups formed within the IEEE P2020 Working group are described below. An overview of the projects is depicted in Figure 3.
Subgroup 0—Image quality requirements/specifications standards Subgroup 1—LED flicker standards Subgroup 2—Image quality for viewing Subgroup 3—Image quality for computer vision Subgroup 4—Camera subsystem interface Subgroup 5—Image quality safety Subgroup 6—Customer perception of image quality
Figure 3 IEEE-SA P2020 subgroups overview
2. Problem statement
This section describes the findings by the active Subgroups 1, 2, and 3.
A. Subgroup 1—LED flicker standards
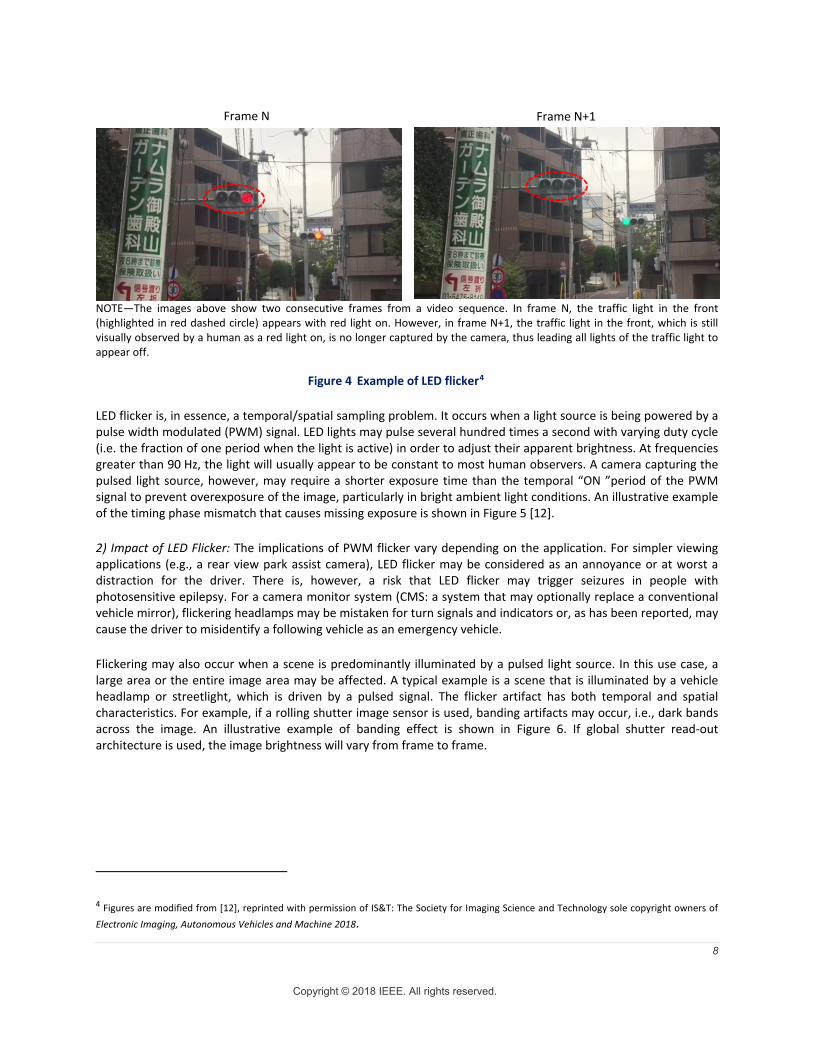
1) Motivation: LED flicker is an artifact observed in digital imaging where a light source or a region of an imaged scene appears to flicker. The light as observed on the vision system display may appear to switch on and off or modulate in terms of brightness or color, even though the light source itself appears constant to a human observer. An example of LED flicker is shown in Figure 4.
8
Copyright © 2018 IEEE. All rights reserved.
NOTE—The images above show two consecutive frames from a video sequence. In frame N, the traffic light in the front (highlighted in red dashed circle) appears with red light on. However, in frame N+1, the traffic light in the front, which is still visually observed by a human as a red light on, is no longer captured by the camera, thus leading all lights of the traffic light to appear off.
Figure 4 Example of LED flicker4
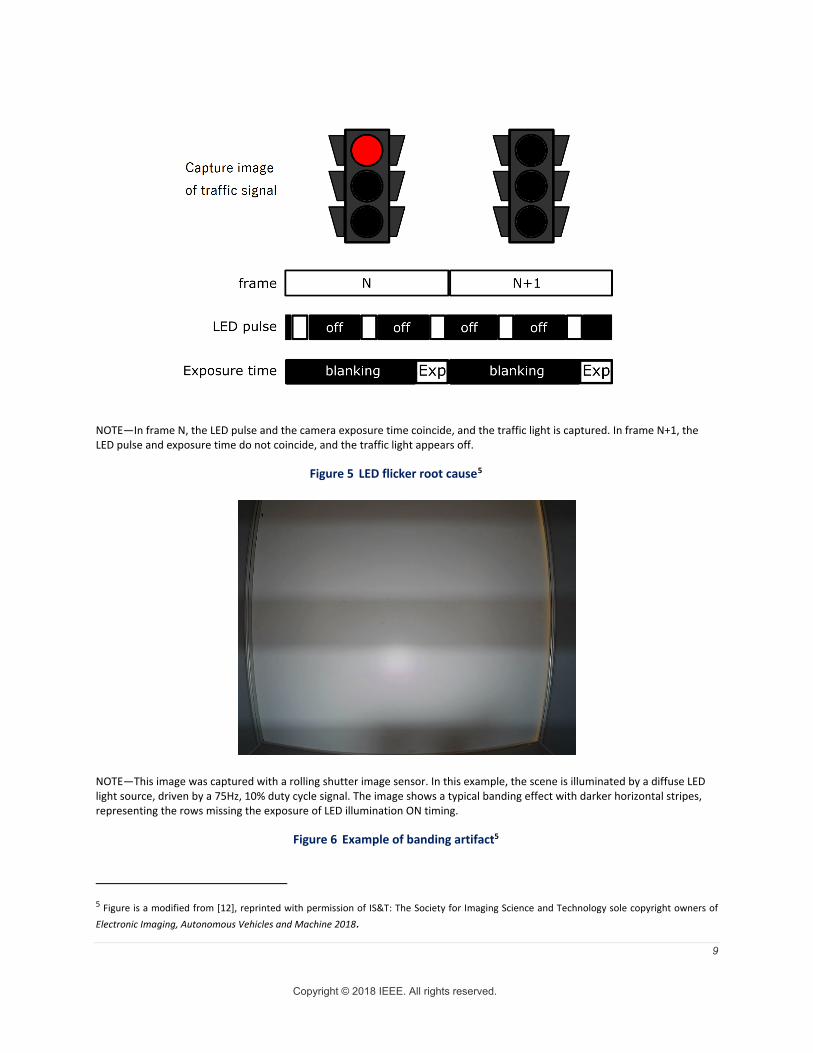
LED flicker is, in essence, a temporal/spatial sampling problem. It occurs when a light source is being powered by a pulse width modulated (PWM) signal. LED lights may pulse several hundred times a second with varying duty cycle (i.e. the fraction of one period when the light is active) in order to adjust their apparent brightness. At frequencies greater than 90 Hz, the light will usually appear to be constant to most human observers. A camera capturing the pulsed light source, however, may require a shorter exposure time than the temporal “ON ”period of the PWM signal to prevent overexposure of the image, particularly in bright ambient light conditions. An illustrative example of the timing phase mismatch that causes missing exposure is shown in Figure 5 [12].
2) Impact of LED Flicker: The implications of PWM flicker vary depending on the application. For simpler viewing applications (e.g., a rear view park assist camera), LED flicker may be considered as an annoyance or at worst a distraction for the driver. There is, however, a risk that LED flicker may trigger seizures in people with photosensitive epilepsy. For a camera monitor system (CMS: a system that may optionally replace a conventional vehicle mirror), flickering headlamps may be mistaken for turn signals and indicators or, as has been reported, may cause the driver to misidentify a following vehicle as an emergency vehicle.
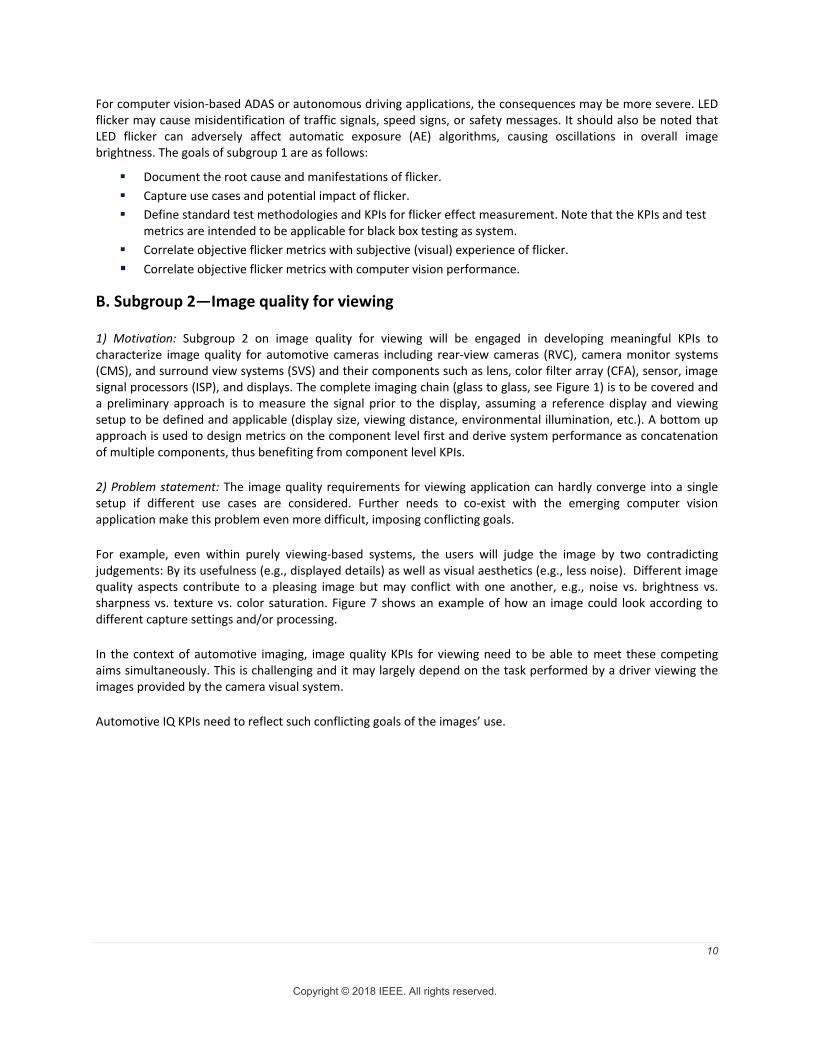
Flickering may also occur when a scene is predominantly illuminated by a pulsed light source. In this use case, a large area or the entire image area may be affected. A typical example is a scene that is illuminated by a vehicle headlamp or streetlight, which is driven by a pulsed signal. The flicker artifact has both temporal and spatial characteristics. For example, if a rolling shutter image sensor is used, banding artifacts may occur, i.e., dark bands across the image. An illustrative example of banding effect is shown in Figure 6. If global shutter read-out architecture is used, the image brightness will vary from frame to frame.
4 Figures are modified from [12], reprinted with permission of IS&T: The Society for Imaging Science and Technology sole copyright owners of Electronic Imaging, Autonomous Vehicles and Machine 2018.
Frame N Frame N+1
9
Copyright © 2018 IEEE. All rights reserved.
NOTE—In frame N, the LED pulse and the camera exposure time coincide, and the traffic light is captured. In frame N+1, the LED pulse and exposure time do not coincide, and the traffic light appears off.
Figure 5 LED flicker root cause5
NOTE—This image was captured with a rolling shutter image sensor. In this example, the scene is illuminated by a diffuse LED light source, driven by a 75Hz, 10% duty cycle signal. The image shows a typical banding effect with darker horizontal stripes, representing the rows missing the exposure of LED illumination ON timing.
Figure 6 Example of banding artifact5
5 Figure is a modified from [12], reprinted with permission of IS&T: The Society for Imaging Science and Technology sole copyright owners of Electronic Imaging, Autonomous Vehicles and Machine 2018.
10
Copyright © 2018 IEEE. All rights reserved.
For computer vision-based ADAS or autonomous driving applications, the consequences may be more severe. LED flicker may cause misidentification of traffic signals, speed signs, or safety messages. It should also be noted that LED flicker can adversely affect automatic exposure (AE) algorithms, causing oscillations in overall image brightness. The goals of subgroup 1 are as follows:
Document the root cause and manifestations of flicker. Capture use cases and potential impact of flicker. Define standard test methodologies and KPIs for flicker effect measurement. Note that the KPIs and test
metrics are intended to be applicable for black box testing as system. Correlate objective flicker metrics with subjective (visual) experience of flicker. Correlate objective flicker metrics with computer vision performance.
B. Subgroup 2—Image quality for viewing
1) Motivation: Subgroup 2 on image quality for viewing will be engaged in developing meaningful KPIs to characterize image quality for automotive cameras including rear-view cameras (RVC), camera monitor systems (CMS), and surround view systems (SVS) and their components such as lens, color filter array (CFA), sensor, image signal processors (ISP), and displays. The complete imaging chain (glass to glass, see Figure 1) is to be covered and a preliminary approach is to measure the signal prior to the display, assuming a reference display and viewing setup to be defined and applicable (display size, viewing distance, environmental illumination, etc.). A bottom up approach is used to design metrics on the component level first and derive system performance as concatenation of multiple components, thus benefiting from component level KPIs.
2) Problem statement: The image quality requirements for viewing application can hardly converge into a single setup if different use cases are considered. Further needs to co-exist with the emerging computer vision application make this problem even more difficult, imposing conflicting goals.
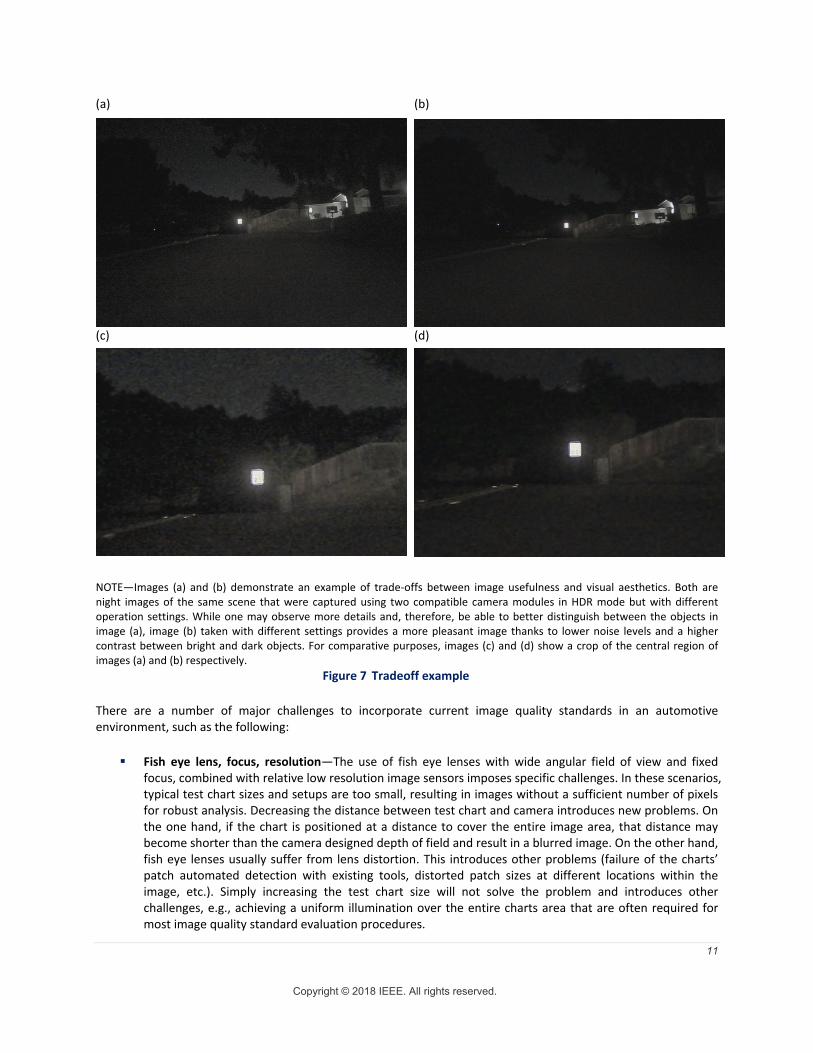
For example, even within purely viewing-based systems, the users will judge the image by two contradicting judgements: By its usefulness (e.g., displayed details) as well as visual aesthetics (e.g., less noise). Different image quality aspects contribute to a pleasing image but may conflict with one another, e.g., noise vs. brightness vs. sharpness vs. texture vs. color saturation. Figure 7 shows an example of how an image could look according to different capture settings and/or processing.
In the context of automotive imaging, image quality KPIs for viewing need to be able to meet these competing aims simultaneously. This is challenging and it may largely depend on the task performed by a driver viewing the images provided by the camera visual system.
Automotive IQ KPIs need to reflect such conflicting goals of the images’ use.
11
Copyright © 2018 IEEE. All rights reserved.
(a) (b)
(c) (d)
NOTE—Images (a) and (b) demonstrate an example of trade-offs between image usefulness and visual aesthetics. Both are night images of the same scene that were captured using two compatible camera modules in HDR mode but with different operation settings. While one may observe more details and, therefore, be able to better distinguish between the objects in image (a), image (b) taken with different settings provides a more pleasant image thanks to lower noise levels and a higher contrast between bright and dark objects. For comparative purposes, images (c) and (d) show a crop of the central region of images (a) and (b) respectively.
Figure 7 Tradeoff example
There are a number of major challenges to incorporate current image quality standards in an automotive environment, such as the following:
Fish eye lens, focus, resolution—The use of fish eye lenses with wide angular field of view and fixed focus, combined with relative low resolution image sensors imposes specific challenges. In these scenarios, typical test chart sizes and setups are too small, resulting in images without a sufficient number of pixels for robust analysis. Decreasing the distance between test chart and camera introduces new problems. On the one hand, if the chart is positioned at a distance to cover the entire image area, that distance may become shorter than the camera designed depth of field and result in a blurred image. On the other hand, fish eye lenses usually suffer from lens distortion. This introduces other problems (failure of the charts’ patch automated detection with existing tools, distorted patch sizes at different locations within the image, etc.). Simply increasing the test chart size will not solve the problem and introduces other challenges, e.g., achieving a uniform illumination over the entire charts area that are often required for most image quality standard evaluation procedures.
12
Copyright © 2018 IEEE. All rights reserved.
HDR—High dynamic range imagers are often combined with local tone mapping image processing. This creates challenges of texture and local contrast preservation, color fidelity/stability, SNR stability (see Figure 8), and motion artefacts.
Multi-cam—In applications such as SVS, image capture originating from multiple cameras with overlapping field of views are combined or “stitched” together. The created virtual image evaluation is problematic due to the individual characteristics of each camera and captured portion of the scene, i.e., different fields of view, local processing, different and mixed camera illumination.
Distributed—Distributed systems with some local image processing close to the imager and some ECU centralized processing. Local processing (e.g., tone mapping) does not preserve the original information at the camera and is therefore not invertible to be post recovered in the central ECU (e.g., glossy compression/quantization).
Dual purpose—The same camera feed may have to serve both for viewing and computer vision needs. Extrinsic components—System level image quality is affected by additional components of the vehicle
(lights, windshield, protection cover window, etc.). Video—Automotive systems use video imagery. Many of current imaging standards, however, were
originally targeted for still image application and typically do not cover motion video image quality. Illumination—The huge variety of the scene illumination in automotive use cases imposes additional
challenges for testing (e.g., xenon light, d65 light, sunlight, various LED street lamps).
Another issue is that the existing standards do not necessarily cover the specific challenges that occur in uncontrolled use environments, in which automotive camera applications need to operate.
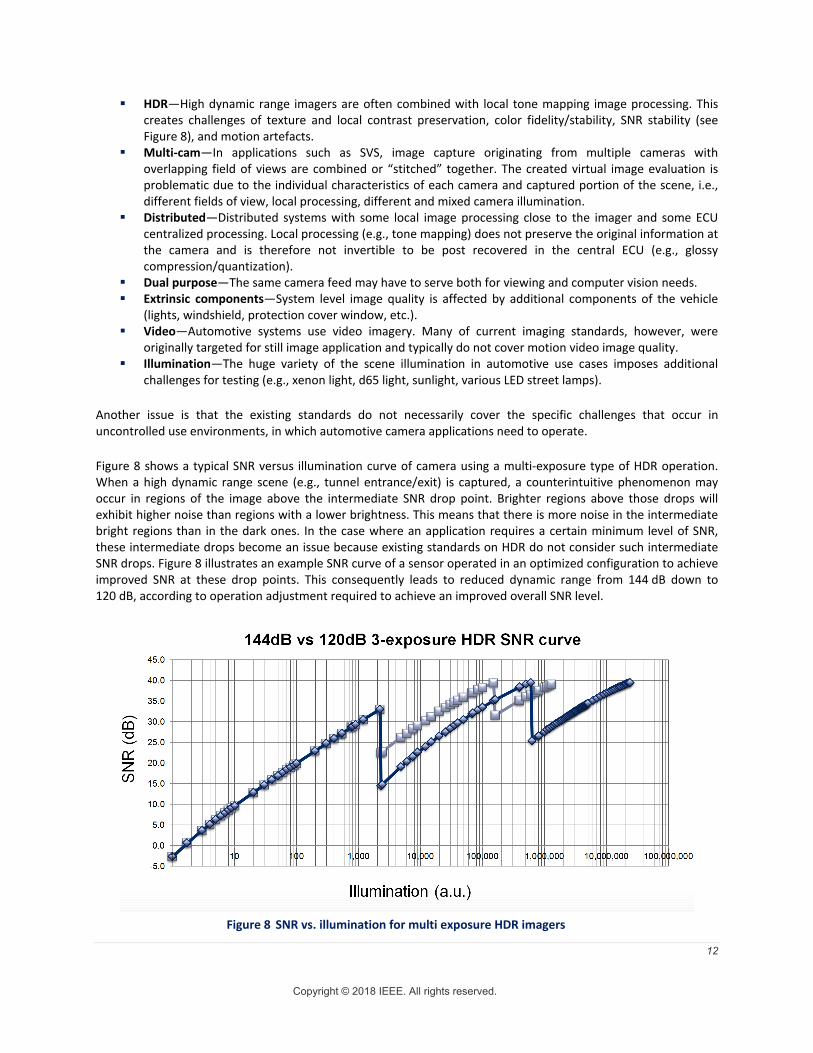
Figure 8 shows a typical SNR versus illumination curve of camera using a multi-exposure type of HDR operation. When a high dynamic range scene (e.g., tunnel entrance/exit) is captured, a counterintuitive phenomenon may occur in regions of the image above the intermediate SNR drop point. Brighter regions above those drops will exhibit higher noise than regions with a lower brightness. This means that there is more noise in the intermediate bright regions than in the dark ones. In the case where an application requires a certain minimum level of SNR, these intermediate drops become an issue because existing standards on HDR do not consider such intermediate SNR drops. Figure 8 illustrates an example SNR curve of a sensor operated in an optimized configuration to achieve improved SNR at these drop points. This consequently leads to reduced dynamic range from 144 dB down to 120 dB, according to operation adjustment required to achieve an improved overall SNR level.
Figure 8 SNR vs. illumination for multi exposure HDR imagers
13
Copyright © 2018 IEEE. All rights reserved.
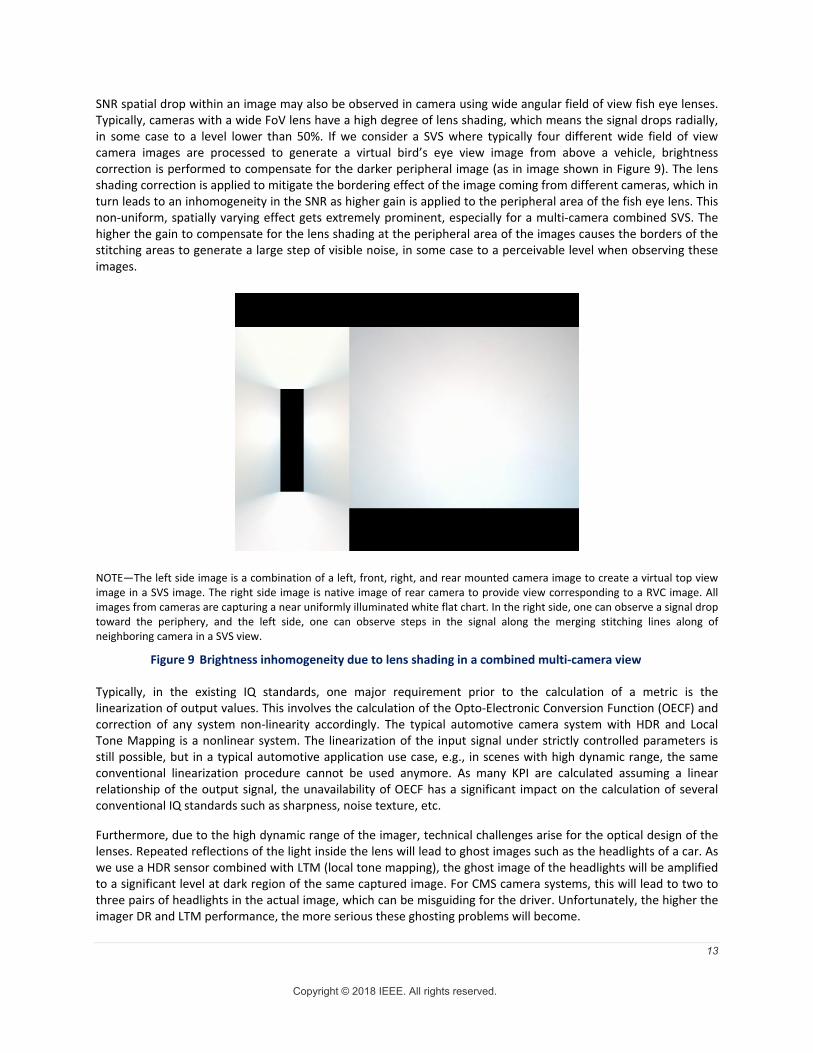
SNR spatial drop within an image may also be observed in camera using wide angular field of view fish eye lenses. Typically, cameras with a wide FoV lens have a high degree of lens shading, which means the signal drops radially, in some case to a level lower than 50%. If we consider a SVS where typically four different wide field of view camera images are processed to generate a virtual bird’s eye view image from above a vehicle, brightness correction is performed to compensate for the darker peripheral image (as in image shown in Figure 9). The lens shading correction is applied to mitigate the bordering effect of the image coming from different cameras, which in turn leads to an inhomogeneity in the SNR as higher gain is applied to the peripheral area of the fish eye lens. This non-uniform, spatially varying effect gets extremely prominent, especially for a multi-camera combined SVS. The higher the gain to compensate for the lens shading at the peripheral area of the images causes the borders of the stitching areas to generate a large step of visible noise, in some case to a perceivable level when observing these images.
NOTE—The left side image is a combination of a left, front, right, and rear mounted camera image to create a virtual top view image in a SVS image. The right side image is native image of rear camera to provide view corresponding to a RVC image. All images from cameras are capturing a near uniformly illuminated white flat chart. In the right side, one can observe a signal drop toward the periphery, and the left side, one can observe steps in the signal along the merging stitching lines along of neighboring camera in a SVS view.
Figure 9 Brightness inhomogeneity due to lens shading in a combined multi-camera view
Typically, in the existing IQ standards, one major requirement prior to the calculation of a metric is the linearization of output values. This involves the calculation of the Opto-Electronic Conversion Function (OECF) and correction of any system non-linearity accordingly. The typical automotive camera system with HDR and Local Tone Mapping is a nonlinear system. The linearization of the input signal under strictly controlled parameters is still possible, but in a typical automotive application use case, e.g., in scenes with high dynamic range, the same conventional linearization procedure cannot be used anymore. As many KPI are calculated assuming a linear relationship of the output signal, the unavailability of OECF has a significant impact on the calculation of several conventional IQ standards such as sharpness, noise texture, etc.
Furthermore, due to the high dynamic range of the imager, technical challenges arise for the optical design of the lenses. Repeated reflections of the light inside the lens will lead to ghost images such as the headlights of a car. As we use a HDR sensor combined with LTM (local tone mapping), the ghost image of the headlights will be amplified to a significant level at dark region of the same captured image. For CMS camera systems, this will lead to two to three pairs of headlights in the actual image, which can be misguiding for the driver. Unfortunately, the higher the imager DR and LTM performance, the more serious these ghosting problems will become.
14
Copyright © 2018 IEEE. All rights reserved.
A number of challenges arise when using the texture measurement metric in automotive applications (used by CPIQ), which is based on the dead leaves test chart. Again, the wide FoV and low resolution will not provide enough pixel counts for a robust and reliable measurement. Decreasing the distance or increasing the target size will distort the well-defined frequency distribution and geometrical invariances of the dead leaves within the test chart due to the high lens distortion. Typically, low texture KPI values are caused by high noise reduction filtering in the image. However, if we now have an image where the SNR is not a continuous function of the illumination due to the SNR drops, and the noise reduction filtering is hence not necessarily done equally over the whole image, then we have to ask: How much can we benefit from the measuring method as presently described in the CPIQ standard?
Given the multitude of use cases and complexity to achieve good KPIs, subgroup 2 has decided to first work on development of the following ease implementation ones, in a bottom up approach, before further moving to complex KPIs:
Dynamic range Sensitivity Depth of field Focus stability Dark current
Our ultimate goal is to design KPIs to characterize image quality with regard to both the pleasantness and usefulness to the automotive viewing camera systems; and will further tackle new KPIs at next stage.
C. Subgroup 3—Image quality for computer vision
1) Motivation: Video-based environment recognition is expected to be one of the major components of an advanced driver assist system (ADAS) or automated driving system. The process of environmental visual data acquisition is the result of a complex effect chain, also called imaging chain, which starts from a light source and ends with the final image stored in memory. In this information transfer chain, the signal suffers from a variety of intermediate disturbances, thus degradation of the signal quality will always take place to some extent. It is important that the system is designed so that enough relevant information about the world is still preserved in the chain. Hence, it is evident that meaningful KPIs need to be defined. Because the tasks of computer vision are so diverse and are solved in many and constantly evolving ways, existing standards such as EMVA 1288 [6], are typically restricted to component-level characterization. However, to cover special automotive use cases, the complete system along the imaging chain has to be considered. Existing international standards for image quality, while application based, almost exclusively focus on the case of digital imaging for human consumption. The machine vision use cases of automotive imaging are so diverse, and the penalty for failure so severe in critical cases, that existing standards are inadequate for computer vision automotive application. What might lead to merely acceptable image quality degradation for human consumption may lead to sudden unacceptable failure for a computer vision system.
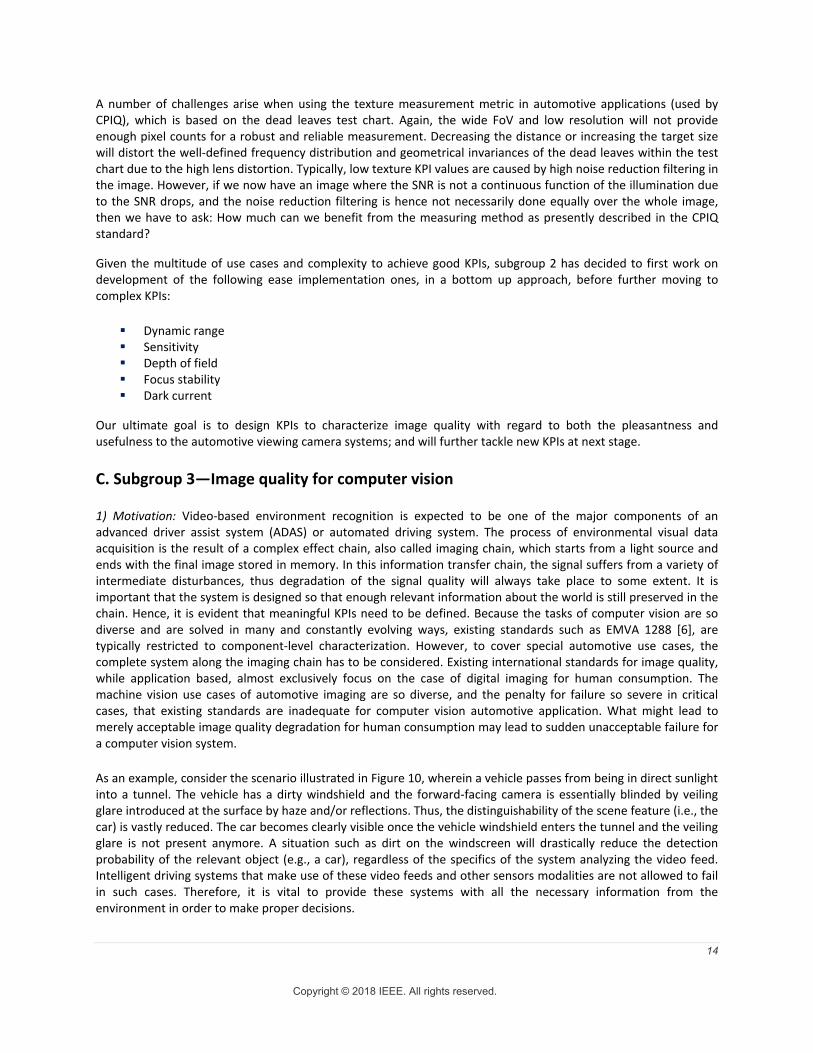
As an example, consider the scenario illustrated in Figure 10, wherein a vehicle passes from being in direct sunlight into a tunnel. The vehicle has a dirty windshield and the forward-facing camera is essentially blinded by veiling glare introduced at the surface by haze and/or reflections. Thus, the distinguishability of the scene feature (i.e., the car) is vastly reduced. The car becomes clearly visible once the vehicle windshield enters the tunnel and the veiling glare is not present anymore. A situation such as dirt on the windscreen will drastically reduce the detection probability of the relevant object (e.g., a car), regardless of the specifics of the system analyzing the video feed. Intelligent driving systems that make use of these video feeds and other sensors modalities are not allowed to fail in such cases. Therefore, it is vital to provide these systems with all the necessary information from the environment in order to make proper decisions.
15
Copyright © 2018 IEEE. All rights reserved.
NOTE—Two sequential video frames while entering a tunnel that demonstrate contrast reduction by veiling glare, caused by sunlight illuminated dust particles. In the left image, the effect significantly hinders the recognition of a preceding car while in the right image (only a few milliseconds later) the sunlight is blocked away and a robust detection of the car is possible.
Figure 10 Two sequential video frames while entering a tunnel that demonstrate contrast reduction by veiling glare6
2) Problem statement: Traditionally, the evaluation and characterization of components in the imaging chain were covered by specific expertise in the field of each component. For example, optics KPIs such as Modulation Transfer Function (MTF) and such as the quantization of various effects of scattered light in the optical system are not directly compatible with image sensor KPIs like signal-to-noise (SNR) and dynamic range (DR). The overlapping effects between components often do not have a common unified evaluation standard across the component chain. Following the example in Figure 10, a standard approach might have been to quantify how much veiling glare a dirty windshield adds to such an imaging situation, and for the vision system designers to account for this in their design, whatever the application might be.
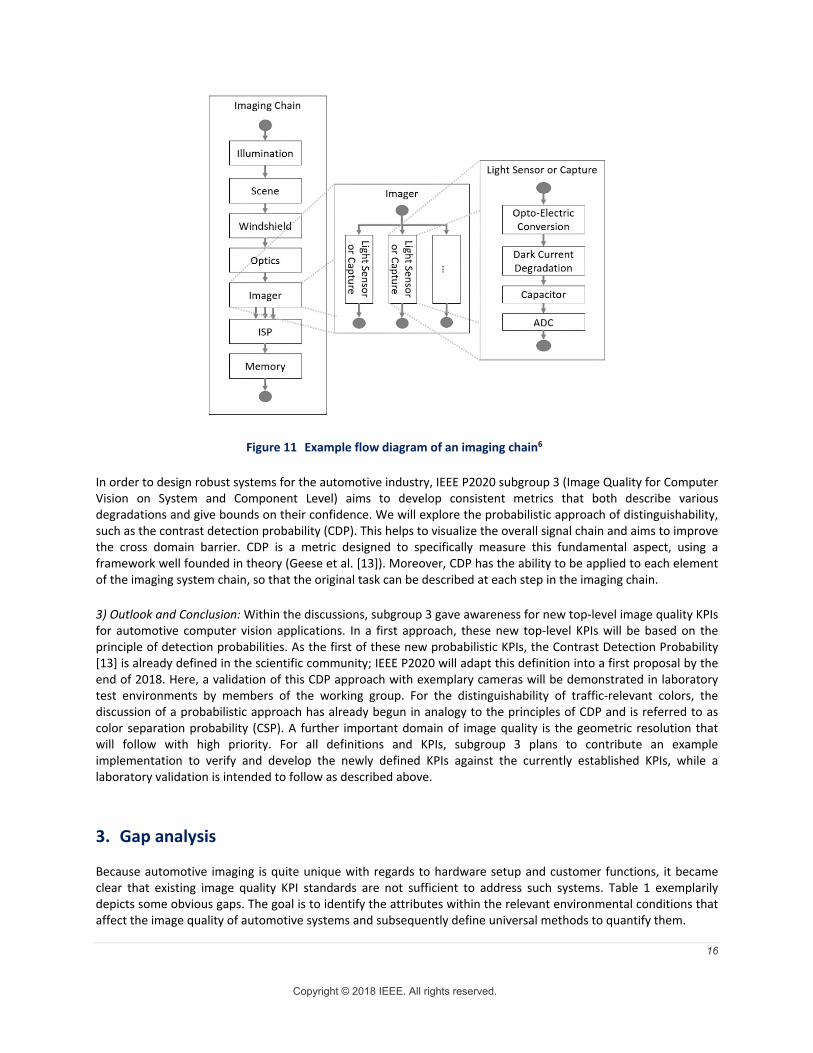
Thus, the definition of the components requirements for an ADAS system is a complex procedure. A particular effect observed in the intermediate data flow is not necessarily isolated and it requires a complex analysis of the complete information transfer flow. This means it is necessary to analyze the chain from optical level down to electronic signal level (see Figure 11), and this must be done considering the use cases in which the system is expected to operate. Therefore, it is essential that components are not just characterized as isolated elements but rather all effects in the chain are well covered under a single framework so that the total system can be appropriately characterized.
Given the example of Figure 10, the reduced contrast after the windshield could still be detected by an image sensor with sufficient contrast detection ability and consequently the ISP may reconstruct an image that allows detecting the car even in the left hand side image with a still sufficient detection probability.
6 Figure from [13] reprinted with permission of IS&T: The Society for Imaging Science and Technology sole copyright owners of Electronic Imaging, Autonomous Vehicles and Machine 2018.
16
Copyright © 2018 IEEE. All rights reserved.
Figure 11 Example flow diagram of an imaging chain6
In order to design robust systems for the automotive industry, IEEE P2020 subgroup 3 (Image Quality for Computer Vision on System and Component Level) aims to develop consistent metrics that both describe various degradations and give bounds on their confidence. We will explore the probabilistic approach of distinguishability, such as the contrast detection probability (CDP). This helps to visualize the overall signal chain and aims to improve the cross domain barrier. CDP is a metric designed to specifically measure this fundamental aspect, using a framework well founded in theory (Geese et al. [13]). Moreover, CDP has the ability to be applied to each element of the imaging system chain, so that the original task can be described at each step in the imaging chain.
3) Outlook and Conclusion: Within the discussions, subgroup 3 gave awareness for new top-level image quality KPIs for automotive computer vision applications. In a first approach, these new top-level KPIs will be based on the principle of detection probabilities. As the first of these new probabilistic KPIs, the Contrast Detection Probability [13] is already defined in the scientific community; IEEE P2020 will adapt this definition into a first proposal by the end of 2018. Here, a validation of this CDP approach with exemplary cameras will be demonstrated in laboratory test environments by members of the working group. For the distinguishability of traffic-relevant colors, the discussion of a probabilistic approach has already begun in analogy to the principles of CDP and is referred to as color separation probability (CSP). A further important domain of image quality is the geometric resolution that will follow with high priority. For all definitions and KPIs, subgroup 3 plans to contribute an example implementation to verify and develop the newly defined KPIs against the currently established KPIs, while a laboratory validation is intended to follow as described above.
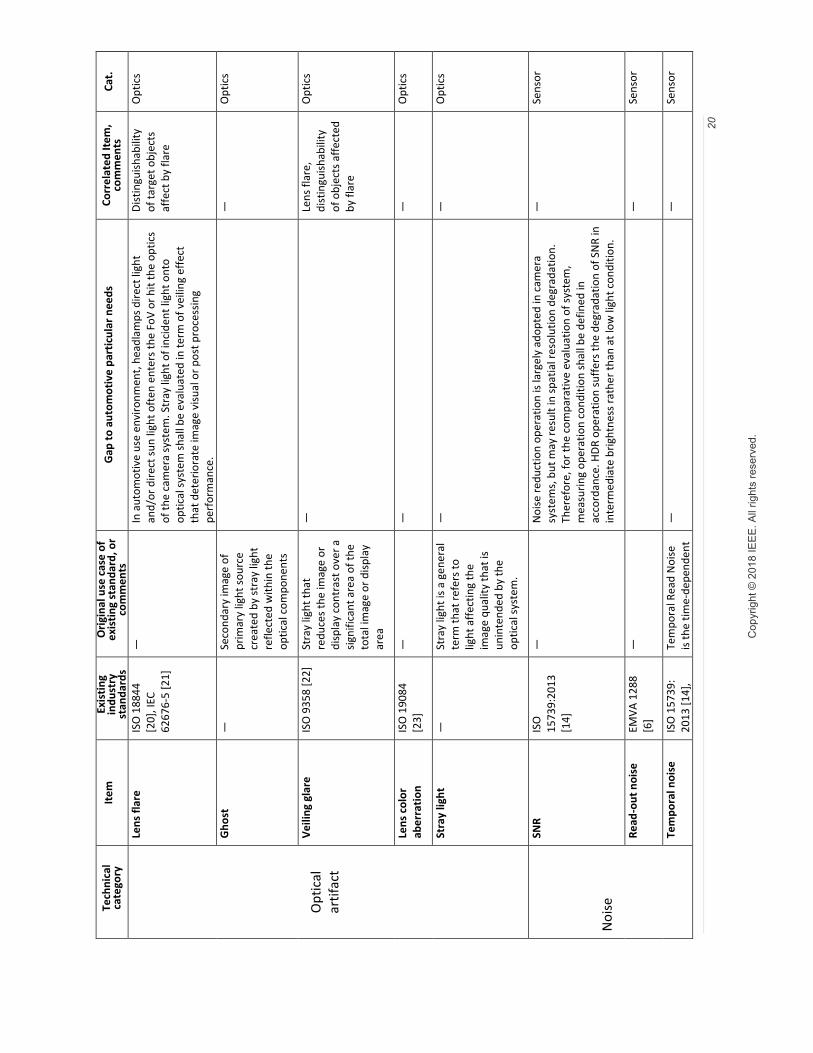
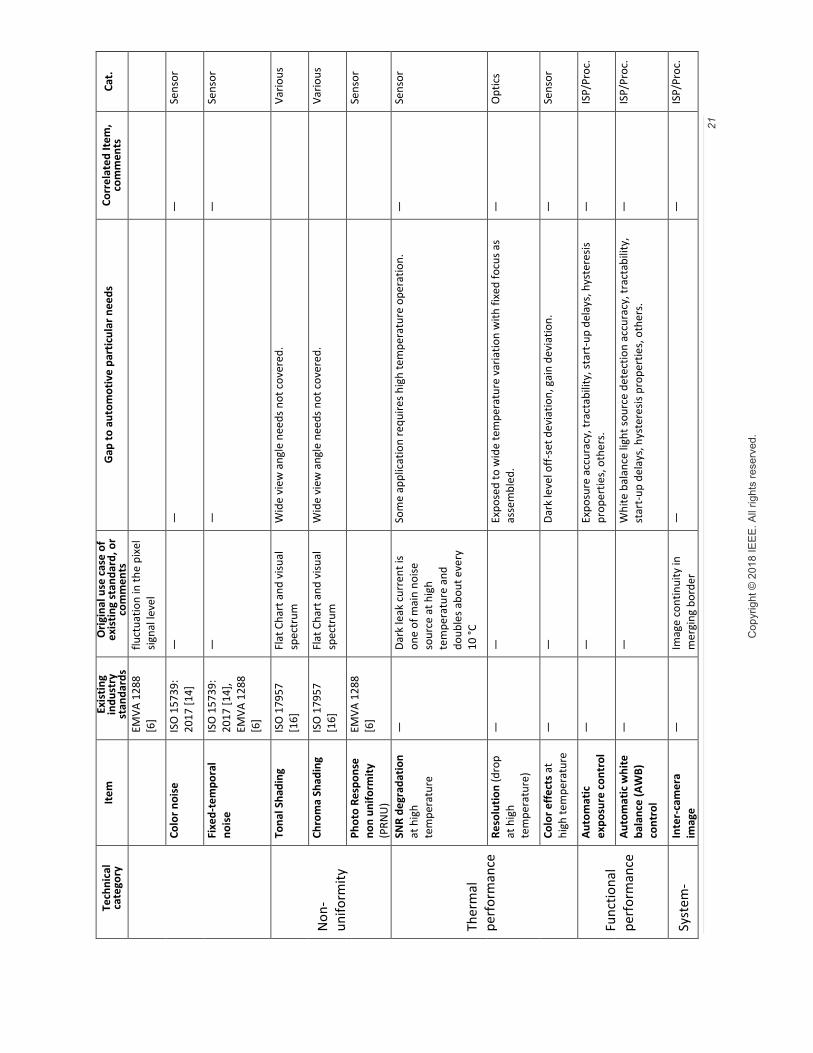
3. Gap analysis
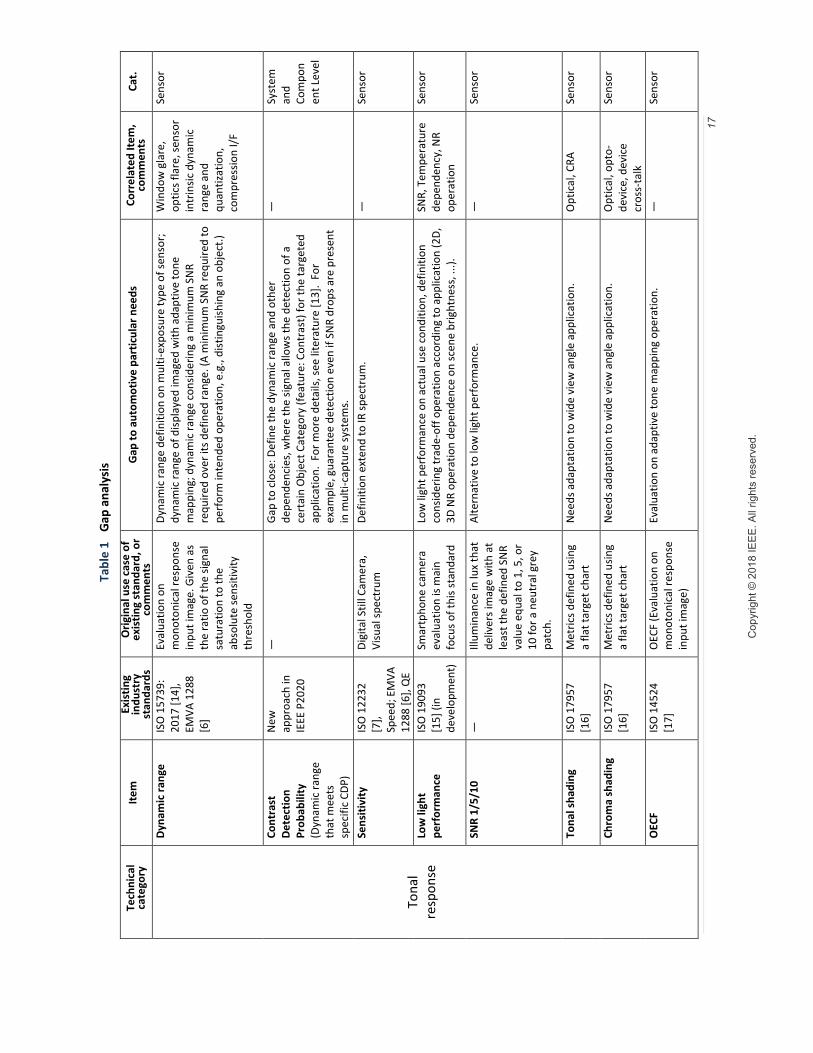
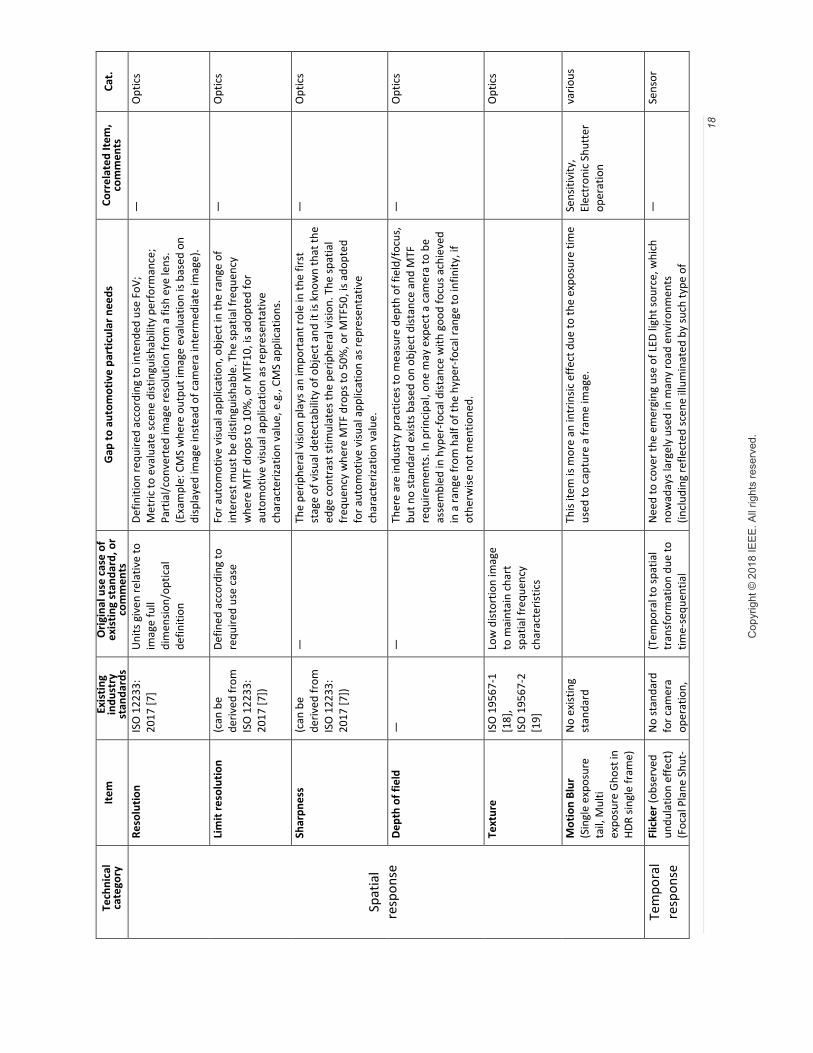
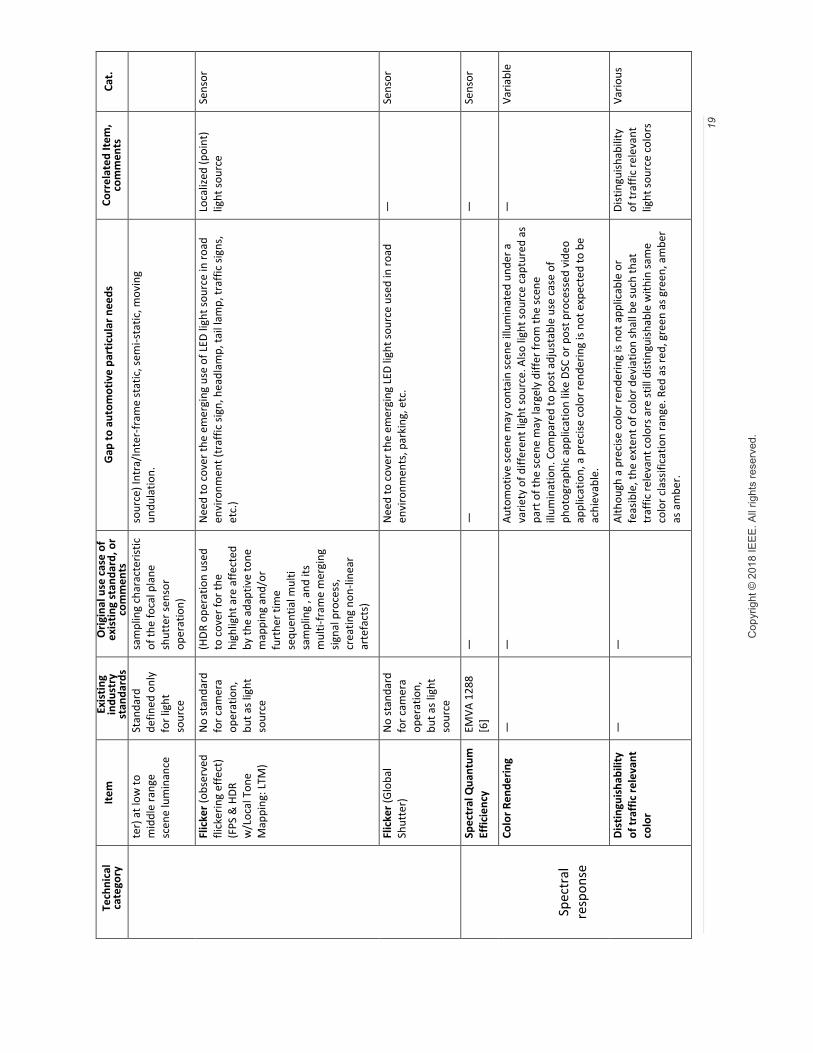
Because automotive imaging is quite unique with regards to hardware setup and customer functions, it became clear that existing image quality KPI standards are not sufficient to address such systems. Table 1 exemplarily depicts some obvious gaps. The goal is to identify the attributes within the relevant environmental conditions that affect the image quality of automotive systems and subsequently define universal methods to quantify them.
17
Cop
yrig
ht ©
201
8 IE
EE. A
ll rig
hts
rese
rved
.
Tabl
e 1
Gap
ana
lysi
s
Tech
nica
l ca
tego
ry
Item
Ex
istin
g in
dust
ry
stan
dard
s
Orig
inal
use
cas
e of
ex
istin
g st
anda
rd, o
r co
mm
ents
G
ap to
aut
omot
ive
part
icul
ar n
eeds
Co
rrel
ated
Item
, co
mm
ents
Ca
t.
Tona
l re
spon
se
Dyn
amic
rang
e IS
O 1
5739
: 20
17 [1
4],
EMVA
128
8 [6
]
Eval
uatio
n on
m
onot
onic
al re
spon
se
inpu
t im
age.
Giv
en a
s th
e ra
tio o
f the
sign
al
satu
ratio
n to
the
abso
lute
sens
itivi
ty
thre
shol
d
Dyna
mic
rang
e de
finiti
on o
n m
ulti-
expo
sure
type
of s
enso
r; dy
nam
ic ra
nge
of d
ispla
yed
imag
ed w
ith a
dapt
ive
tone
m
appi
ng; d
ynam
ic ra
nge
cons
ider
ing
a m
inim
um S
NR
requ
ired
over
its d
efin
ed ra
nge.
(A m
inim
um S
NR
requ
ired
to
perf
orm
inte
nded
ope
ratio
n, e
.g.,
dist
ingu
ishin
g an
obj
ect.)
Win
dow
gla
re,
optic
s fla
re, s
enso
r in
trin
sic d
ynam
ic
rang
e an
d qu
antiz
atio
n,
com
pres
sion
I/F
Sens
or
Cont
rast
D
etec
tion
Prob
abili
ty
(Dyn
amic
rang
e th
at m
eets
sp
ecifi
c CD
P)
New
ap
proa
ch in
IE
EE P
2020
—
Gap
to c
lose
: Def
ine
the
dyna
mic
rang
e an
d ot
her
depe
nden
cies
, whe
re th
e sig
nal a
llow
s the
det
ectio
n of
a
cert
ain
Obj
ect C
ateg
ory
(feat
ure:
Con
tras
t) fo
r the
targ
eted
ap
plic
atio
n. F
or m
ore
deta
ils, s
ee li
tera
ture
[13]
. Fo
r ex
ampl
e, g
uara
ntee
det
ectio
n ev
en if
SN
R dr
ops a
re p
rese
nt
in m
ulti-
capt
ure
syst
ems.
—
Syst
em
and
Com
pon
ent L
evel
Sens
itivi
ty
ISO
122
32
[7],
Spee
d; E
MVA
12
88 [6
], Q
E
Digi
tal S
till C
amer
a,
Visu
al sp
ectr
um
Defin
ition
ext
end
to IR
spec
trum
. —
Se
nsor
Low
ligh
t pe
rfor
man
ce
ISO
190
93
[15]
(in
deve
lopm
ent)
Smar
tpho
ne c
amer
a ev
alua
tion
is m
ain
focu
s of t
his s
tand
ard
Low
ligh
t per
form
ance
on
actu
al u
se c
ondi
tion,
def
initi
on
cons
ider
ing
trad
e-of
f ope
ratio
n ac
cord
ing
to a
pplic
atio
n (2
D,
3D N
R op
erat
ion
depe
nden
ce o
n sc
ene
brig
htne
ss, .
..).
SNR,
Tem
pera
ture
de
pend
ency
, NR
oper
atio
n
Sens
or
SNR
1/5/
10
—
Illum
inan
ce in
lux
that
de
liver
s im
age
with
at
leas
t the
def
ined
SN
R va
lue
equa
l to
1, 5
, or
10 fo
r a n
eutr
al g
rey
patc
h.
Alte
rnat
ive
to lo
w li
ght p
erfo
rman
ce.
—
Sens
or
Tona
l sha
ding
IS
O 1
7957
[1
6]
Met
rics d
efin
ed u
sing
a fla
t tar
get c
hart
N
eeds
ada
ptat
ion
to w
ide
view
ang
le a
pplic
atio
n.
Opt
ical
, CRA
Se
nsor
Chro
ma
shad
ing
ISO
179
57
[16]
M
etric
s def
ined
usin
g a
flat t
arge
t cha
rt
Nee
ds a
dapt
atio
n to
wid
e vi
ew a
ngle
app
licat
ion.
O
ptic
al, o
pto-
devi
ce, d
evic
e cr
oss-
talk
Sens
or
OEC
F IS
O 1
4524
[1
7]
OEC
F (E
valu
atio
n on
m
onot
onic
al re
spon
se
inpu
t im
age)
Eval
uatio
n on
ada
ptiv
e to
ne m
appi
ng o
pera
tion.
—
Se
nsor
18
Cop
yrig
ht ©
201
8 IE
EE. A
ll rig
hts
rese
rved
.
Tech
nica
l ca
tego
ry
Item
Ex
istin
g in
dust
ry
stan
dard
s
Orig
inal
use
cas
e of
ex
istin
g st
anda
rd, o
r co
mm
ents
G
ap to
aut
omot
ive
part
icul
ar n
eeds
Co
rrel
ated
Item
, co
mm
ents
Ca
t.
Spat
ial
resp
onse
Reso
lutio
n IS
O 1
2233
: 20
17 [7
] U
nits
giv
en re
lativ
e to
im
age
full
dim
ensio
n/op
tical
de
finiti
on
Defin
ition
requ
ired
acco
rdin
g to
inte
nded
use
FoV
; M
etric
to e
valu
ate
scen
e di
stin
guish
abili
ty p
erfo
rman
ce;
Part
ial/c
onve
rted
imag
e re
solu
tion
from
a fi
sh e
ye le
ns.
(Exa
mpl
e: C
MS
whe
re o
utpu
t im
age
eval
uatio
n is
base
d on
di
spla
yed
imag
e in
stea
d of
cam
era
inte
rmed
iate
imag
e).
—
Opt
ics
Lim
it re
solu
tion
(can
be
deriv
ed fr
om
ISO
122
33:
2017
[7])
Defin
ed a
ccor
ding
to
requ
ired
use
case
Fo
r aut
omot
ive
visu
al a
pplic
atio
n, o
bjec
t in
the
rang
e of
in
tere
st m
ust b
e di
stin
guish
able
. The
spat
ial f
requ
ency
w
here
MTF
dro
ps to
10%
, or M
TF10
, is a
dopt
ed fo
r au
tom
otiv
e vi
sual
app
licat
ion
as re
pres
enta
tive
char
acte
rizat
ion
valu
e, e
.g.,
CMS
appl
icat
ions
.
—
Opt
ics
Shar
pnes
s (c
an b
e de
rived
from
IS
O 1
2233
: 20
17 [7
])
—
The
perip
hera
l visi
on p
lays
an
impo
rtan
t rol
e in
the
first
st
age
of v
isual
det
ecta
bilit
y of
obj
ect a
nd it
is k
now
n th
at th
e ed
ge c
ontr
ast s
timul
ates
the
perip
hera
l visi
on. T
he sp
atia
l fr
eque
ncy
whe
re M
TF d
rops
to 5
0%, o
r MTF
50, i
s ado
pted
fo
r aut
omot
ive
visu
al a
pplic
atio
n as
repr
esen
tativ
e ch
arac
teriz
atio
n va
lue.
—
Opt
ics
Dep
th o
f fie
ld
—
—
Ther
e ar
e in
dust
ry p
ract
ices
to m
easu
re d
epth
of f
ield
/foc
us,
but n
o st
anda
rd e
xist
s bas
ed o
n ob
ject
dist
ance
and
MTF
re
quire
men
ts. I
n pr
inci
pal,
one
may
exp
ect a
cam
era
to b
e as
sem
bled
in h
yper
-foca
l dist
ance
with
goo
d fo
cus a
chie
ved
in a
rang
e fr
om h
alf o
f the
hyp
er-fo
cal r
ange
to in
finity
, if
othe
rwise
not
men
tione
d.
—
Opt
ics
Text
ure
ISO
195
67-1
[1
8],
ISO
195
67-2
[1
9]
Low
dist
ortio
n im
age
to m
aint
ain
char
t sp
atia
l fre
quen
cy
char
acte
ristic
s
Opt
ics
Mot
ion
Blur
(S
ingl
e ex
posu
re
tail,
Mul
ti ex
posu
re G
host
in
HDR
singl
e fr
ame)
No
exist
ing
stan
dard
This
item
is m
ore
an in
trin
sic e
ffect
due
to th
e ex
posu
re ti
me
used
to c
aptu
re a
fram
e im
age.
Se
nsiti
vity
, El
ectr
onic
Shu
tter
op
erat
ion
vario
us
Tem
pora
l re
spon
se
Flic
ker (
obse
rved
un
dula
tion
effe
ct)
(Foc
al P
lane
Shu
t-
No
stan
dard
fo
r cam
era
oper
atio
n,
(Tem
pora
l to
spat
ial
tran
sfor
mat
ion
due
to
time-
sequ
entia
l
Nee
d to
cov
er th
e em
ergi
ng u
se o
f LED
ligh
t sou
rce,
whi
ch
now
aday
s lar
gely
use
d in
man
y ro
ad e
nviro
nmen
ts
(incl
udin
g re
flect
ed sc
ene
illum
inat
ed b
y su
ch ty
pe o
f
—
Sens
or
19
Cop
yrig
ht ©
201
8 IE
EE. A
ll rig
hts
rese
rved
.
Tech
nica
l ca
tego
ry
Item
Ex
istin
g in
dust
ry
stan
dard
s
Orig
inal
use
cas
e of
ex
istin
g st
anda
rd, o
r co
mm
ents
G
ap to
aut
omot
ive
part
icul
ar n
eeds
Co
rrel
ated
Item
, co
mm
ents
Ca
t.
ter)
at l
ow to
m
iddl
e ra
nge
scen
e lu
min
ance
Stan
dard
de
fined
onl
y fo
r lig
ht
sour
ce
sam
plin
g ch
arac
teris
tic
of th
e fo
cal p
lane
sh
utte
r sen
sor
oper
atio
n)
sour
ce) I
ntra
/Int
er-fr
ame
stat
ic, s
emi-s
tatic
, mov
ing
undu
latio
n.
Flic
ker (
obse
rved
fli
cker
ing
effe
ct)
(FPS
& H
DR
w/L
ocal
Ton
e M
appi
ng: L
TM)
No
stan
dard
fo
r cam
era
oper
atio
n,
but a
s lig
ht
sour
ce
(HDR
ope
ratio
n us
ed
to c
over
for t
he
high
light
are
affe
cted
by
the
adap
tive
tone
m
appi
ng a
nd/o
r fu
rthe
r tim
e se
quen
tial m
ulti
sam
plin
g , a
nd it
s m
ulti-
fram
e m
ergi
ng
signa
l pro
cess
, cr
eatin
g no
n-lin
ear
arte
fact
s)
Nee
d to
cov
er th
e em
ergi
ng u
se o
f LED
ligh
t sou
rce
in ro
ad
envi
ronm
ent (
traf
fic si
gn, h
eadl
amp,
tail
lam
p, tr
affic
sign
s,
etc.
)
Loca
lized
(poi
nt)
light
sour
ce
Sens
or
Flic
ker (
Glo
bal
Shut
ter)
N
o st
anda
rd
for c
amer
a op
erat
ion,
bu
t as l
ight
so
urce
N
eed
to c
over
the
emer
ging
LED
ligh
t sou
rce
used
in ro
ad
envi
ronm
ents
, par
king
, etc
. —
Se
nsor
Spec
tral
re
spon
se
Spec
tral
Qua
ntum
Ef
ficie
ncy
EMVA
128
8 [6
] —
—
—
Se
nsor
Colo
r Ren
derin
g —
—
Au
tom
otiv
e sc
ene
may
con
tain
scen
e ill
umin
ated
und
er a
va
riety
of d
iffer
ent l
ight
sour
ce. A
lso li
ght s
ourc
e ca
ptur
ed a
s pa
rt o
f the
scen
e m
ay la
rgel
y di
ffer f
rom
the
scen
e ill
umin
atio
n. C
ompa
red
to p
ost a
djus
tabl
e us
e ca
se o
f ph
otog
raph
ic a
pplic
atio
n lik
e DS
C or
pos
t pro
cess
ed v
ideo
ap
plic
atio
n, a
pre
cise
col
or re
nder
ing
is no
t exp
ecte
d to
be
achi
evab
le.
—
Varia
ble
Dis
tingu
isha
bilit
y of
traf
fic re
leva
nt
colo
r
—
—
Alth
ough
a p
reci
se c
olor
rend
erin
g is
not a
pplic
able
or
feas
ible
, the
ext
ent o
f col
or d
evia
tion
shal
l be
such
that
tr
affic
rele
vant
col
ors a
re st
ill d
istin
guish
able
with
in sa
me
colo
r cla
ssifi
catio
n ra
nge.
Red
as r
ed, g
reen
as g
reen
, am
ber
as a
mbe
r.
Dist
ingu
ishab
ility
of
traf
fic re
leva
nt
light
sour
ce c
olor
s
Vario
us
20
Cop
yrig
ht ©
201
8 IE
EE. A
ll rig
hts
rese
rved
.
Tech
nica
l ca
tego
ry
Item
Ex
istin
g in
dust
ry
stan
dard
s
Orig
inal
use
cas
e of
ex
istin
g st
anda
rd, o
r co
mm
ents
G
ap to
aut
omot
ive
part
icul
ar n
eeds
Co
rrel
ated
Item
, co
mm
ents
Ca
t.
Opt
ical
ar
tifac
t
Lens
flar
e IS
O 1
8844
[2
0], I
EC
6267
6-5
[21]
—
In a
utom
otiv
e us
e en
viro
nmen
t, he
adla
mps
dire
ct li
ght
and/
or d
irect
sun
light
oft
en e
nter
s the
FoV
or h
it th
e op
tics
of th
e ca
mer
a sy
stem
. Str
ay li
ght o
f inc
iden
t lig
ht o
nto
optic
al sy
stem
shal
l be
eval
uate
d in
term
of v
eilin
g ef
fect
th
at d
eter
iora
te im
age
visu
al o
r pos
t pro
cess
ing
perf
orm
ance
.
Dist
ingu
ishab
ility
of
targ
et o
bjec
ts
affe
ct b
y fla
re
Opt
ics
Gho
st
—
Seco
ndar
y im
age
of
prim
ary
light
sour
ce
crea
ted
by st
ray
light
re
flect
ed w
ithin
the
optic
al c
ompo
nent
s
—
O
ptic
s
Veili
ng g
lare
IS
O 9
358
[22]
St
ray
light
that
re
duce
s the
imag
e or
di
spla
y co
ntra
st o
ver a
sig
nific
ant a
rea
of th
e to
tal i
mag
e or
disp
lay
area
—
Lens
flar
e,
dist
ingu
ishab
ility
of
obj
ects
affe
cted
by
flar
e
Opt
ics
Lens
col
or
aber
ratio
n IS
O 1
9084
[2
3]
—
—
—
Opt
ics
Stra
y lig
ht
—
Stra
y lig
ht is
a g
ener
al
term
that
refe
rs to
lig
ht a
ffect
ing
the
imag
e qu
ality
that
is
unin
tend
ed b
y th
e op
tical
syst
em.
—
—
Opt
ics
Noi
se
SNR
ISO
15
739:
2013
[1
4]
—
Noi
se re
duct
ion
oper
atio
n is
larg
ely
adop
ted
in c
amer
a sy
stem
s, b
ut m
ay re
sult
in sp
atia
l res
olut
ion
degr
adat
ion.
Th
eref
ore,
for t
he c
ompa
rativ
e ev
alua
tion
of sy
stem
, m
easu
ring
oper
atio
n co
nditi
on sh
all b
e de
fined
in
acco
rdan
ce. H
DR o
pera
tion
suffe
rs th
e de
grad
atio
n of
SN
R in
in
term
edia
te b
right
ness
rath
er th
an a
t low
ligh
t con
ditio
n.
—
Sens
or
Read
-out
noi
se
EMVA
128
8 [6
] —
—
Sens
or
Tem
pora
l noi
se
ISO
157
39:
2013
[14]
, Te
mpo
ral R
ead
Noi
se
is th
e tim
e-de
pend
ent
—
—
Sens
or
21
Cop
yrig
ht ©
201
8 IE
EE. A
ll rig
hts
rese
rved
.
Tech
nica
l ca
tego
ry
Item
Ex
istin
g in
dust
ry
stan
dard
s
Orig
inal
use
cas
e of
ex
istin
g st
anda
rd, o
r co
mm
ents
G
ap to
aut
omot
ive
part
icul
ar n
eeds
Co
rrel
ated
Item
, co
mm
ents
Ca
t.
EMVA
128
8 [6
] flu
ctua
tion
in th
e pi
xel
signa
l lev
el
Colo
r noi
se
ISO
157
39:
2017
[14]
—
—
—
Se
nsor
Fixe
d-te
mpo
ral
nois
e IS
O 1
5739
: 20
17 [1
4],
EMVA
128
8 [6
]
—
—
—
Sens
or
Non
-un
iform
ity
Tona
l Sha
ding
IS
O 1
7957
[1
6]
Flat
Cha
rt a
nd v
isual
sp
ectr
um
Wid
e vi
ew a
ngle
nee
ds n
ot c
over
ed.
Va
rious
Chro
ma
Shad
ing
ISO
179
57
[16]
Fl
at C
hart
and
visu
al
spec
trum
W
ide
view
ang
le n
eeds
not
cov
ered
.
Vario
us
Phot
o Re
spon
se
non
unifo
rmity
(P
RNU
)
EMVA
128
8 [6
]
Sens
or
Ther
mal
pe
rfor
man
ce
SNR
degr
adat
ion
at h
igh
tem
pera
ture
—
Dark
leak
cur
rent
is
one
of m
ain
noise
so
urce
at h
igh
tem
pera
ture
and
do
uble
s abo
ut e
very
10
°C
Som
e ap
plic
atio
n re
quire
s hig
h te
mpe
ratu
re o
pera
tion.
—
Se
nsor
Reso
lutio
n (d
rop
at h
igh
tem
pera
ture
)
—
—
Expo
sed
to w
ide
tem
pera
ture
var
iatio
n w
ith fi
xed
focu
s as
asse
mbl
ed.
—
Opt
ics
Colo
r effe
cts a
t hi
gh te
mpe
ratu
re
—
—
Dark
leve
l off-
set d
evia
tion,
gai
n de
viat
ion.
—
Se
nsor
Func
tiona
l pe
rfor
man
ce
Auto
mat
ic
expo
sure
con
trol
—
—
Ex
posu
re a
ccur
acy,
trac
tabi
lity,
star
t-up
del
ays,
hys
tere
sis
prop
ertie
s, o
ther
s.
—
ISP/
Proc
.
Auto
mat
ic w
hite
ba
lanc
e (A
WB)
co
ntro
l
—
—
Whi
te b
alan
ce li
ght s
ourc
e de
tect
ion
accu
racy
, tra
ctab
ility
, st
art-
up d
elay
s, h
yste
resis
pro
pert
ies,
oth
ers.
—
IS
P/Pr
oc.
Syst
em-
Inte
r-ca
mer
a im
age
—
Imag
e co
ntin
uity
in
mer
ging
bor
der
—
—
ISP/
Proc
.

22
Cop
yrig
ht ©
201
8 IE
EE. A
ll rig
hts
rese
rved
.
Tech
nica
l ca
tego
ry
Item
Ex
istin
g in
dust
ry
stan
dard
s
Orig
inal
use
cas
e of
ex
istin
g st
anda
rd, o
r co
mm
ents
G
ap to
aut
omot
ive
part
icul
ar n
eeds
Co
rrel
ated
Item
, co
mm
ents
Ca
t.
base
d re
quire
men
t (M
ulti-
cam
era
syst
em li
ke
SVS)
(geo
met
rical
and
tim
ing
mis
mat
ch)
betw
een
diffe
rent
ca
mer
a im
ages
. (A
djus
tmen
t ca
pabi
lity,
rang
e of
ad
just
men
t, co
unte
rmea
sure
s,
etc.
) In
ter-
cam
era
imag
e (e
xpos
ure
mis
mat
ch)
—
Imag
e co
ntin
uity
in
mer
ging
bor
der
betw
een
diffe
rent
ca
mer
a im
ages
. (A
djus
tmen
t ca
pabi
lity,
rang
e of
ad
just
men
t, co
unte
rmea
sure
s,
etc.
)
—
—
—
Inte
r-ca
mer
a im
age
(Whi
te
Bala
nce
mis
mat
ch)
—
Imag
e co
ntin
uity
in
mer
ging
bor
der
betw
een
diffe
rent
ca
mer
a im
ages
. (A
djus
tmen
t ca
pabi
lity,
rang
e of
ad
just
men
t, co
unte
rmea
sure
s,
etc.
)
—
—
—
Oth
ers
Lens
dis
tort
ion
ISO
178
50
[24]
Ev
alua
tion
as c
amer
a ca
ptur
e im
age
Dist
ortio
n on
inte
nded
vie
win
g or
ient
atio
n (c
ropp
ed im
age
from
fish
eye
lens
with
inte
nded
vie
w p
roje
ctio
n co
rrec
tion)
. —
—
HD
R m
ulti-
ex
posu
re
arte
fact
s
—
—
Colo
red
or e
dged
gho
st o
n m
ovin
g ob
ject
edg
es d
ue to
se
quen
tial e
xpos
ure
dela
y.
—
ISP/
Proc
.
HD
R m
ulti-
expo
sure
tona
l re
prod
uctio
n
—
—
The
tona
l rep
rodu
ctio
n of
HDR
imag
e is
neith
er
mon
oton
ical
ly in
crea
sing
nor l
inea
r to
inci
dent
ligh
t, an
d it
is al
so la
rgel
y af
fect
ed b
y sc
ene
cont
ent.
—
ISP/
Proc
.
23
Copyright © 2018 IEEE. All rights reserved.
4. References
[1] World Health Organization (WHO), Road Traffic Injuries, 19 February 2018, http://www.who.int/mediacentre/factsheets/fs358/en/.
[2] American Planning Association, KNOWLEDGEBASE COLLECTION, Autonomous Vehicles, https://www.planning.org/knowledgebase/autonomousvehicles.
[3] Gao, P., Kaas H., Mohr D., and Wee D., Disruptive trends that will transform the auto industry, McKinsey&Company (Automotive and Assembly), Report, January 2016. https://www.mckinsey.com/industries/automotive‐and‐assembly/our‐insights/disruptive‐trends‐that‐will‐transform‐the‐auto‐industry.
[4] Business Wire, “Google Leads Technology, Testing, Software Development for Autonomous Driving; Additional Strategies Also under Way for Implementation, IHS Says,” November 12, 2015. https://www.businesswire.com/news/home/20151112005451/en/google‐leads‐technology‐testing‐software‐development‐autonomous.
[5] IEEE Std 1858™, IEEE Standard for Camera Phone Image Quality.
[6] EMVA 1288, Standard for Measurement and Presentation of Specifications for Machine Vision Sensors and Cameras.
[7] ISO 12233:2017, Photography—Electronic still picture imaging—Resolution and spatial frequency responses.
[8] IEEE P2020, Draft Standard for Automotive System Image Quality. https://standards.ieee.org/develop/project/2020.html.
[9] SAE J3016, Taxonomy and Definitions for Terms Related to Driving Automation Systems for On‐Road Motor Vehicles.
[10] de Ridder, H., and Endrikhovski, S., “Image Quality is FUN: Reflections on Fidelity, Usefulness and Naturalness”, SID Symposium Digest of Technical Papers, 33:1, p.986‐989, 2002.
[11] Denny, P., “P2020 – Establishing Image Quality Standards for Automotive,” AutoSens Detroit 2017.
[12] Deegan, B., “LED flicker: root cause, impact and measurement for automotive imaging applications,” IS&T Electronic Imaging, Autonomous Vehicles and Machines 2018, pg. 146‐1—146‐6 (2018).
[13] Geese, M., Serger U., and Paolillo A., “Detection probabilities: Performance prediction for sensors of autonomous vehicles,” IS&T Electronic Imaging, Autonomous Vehicles and Machines 2018, pg. 148‐1−148‐14 (2018).
[14] ISO 15739:2017, Photography—Electronic still‐picture imaging—Noise measurements.
[15] ISO 19093 [under development], Photography—Digital cameras—Measuring low light performance.
[16] ISO 17957:2015, Photography—Digital cameras—Shading measurements.
[17] ISO 14524:2009, Photography—Electronic still‐picture cameras—Methods for measuring opto‐electronic conversion functions (OECFs).
[18] ISO/TS 19567‐1:2016, Photography—Digital cameras—Texture reproduction measurements—Part 1: Frequency characteristics measurements using cyclic pattern.
[19] ISO 19567‐2 [under development], Photography—Digital cameras—Part 2: Texture analysis on non cyclic pattern.
[20] ISO 18844:2017, Photography—Digital cameras—Image flare measurement.
24
Copyright © 2018 IEEE. All rights reserved.
[21] IEC 62676‐5 [under development], Video surveillance systems for use in security applications—Part 5: Data specifications and image quality performance for camera devices.
[22] ISO 9358:1994, Optics and optical instruments—Veiling glare of image forming systems—Definitions and methods of measurement.
[23] ISO 19084:2015, Photography—Digital cameras—Chromatic displacement measurements.
[24] ISO 17850, Photography—Digital cameras—Geometric distortion (GD) measurements.
5. Contributors
The following table lists the contributors to this white paper.
Full Name Company
Philip Gordon 20|10 Labs Jose Herrera‐Alonso 3M Bonnie Rohde Albright College Allan Benchetrit Algolux Dave Tokic Algolux Felix Heide Algolux Benjamin May AMX13 Alberto Magnani BAE Systems Bastian Baumgart Continental Nicolas Touchard DxOMark Image Labs Arnaud Darmont EMVA / Aphesa Werner Brockherde Fraunhofer IMS Wende Zhang General Motors Andre Rieder Gentex Corporation Manjunath Somayaji GEO Semiconductor John Casey GEO Semiconductor Alexander Braun Hochschule Dusseldorf Myongwoo Kim Hyundai Motor Company Miriam Schiffermann Image Engineering Uwe Artmann Image Engineering Robert Sumner Imatest Henry Koren Imatest Norman Koren Imatest Avi Kalderon Intel Promila Agarwal Intel Cheng Lu Intel Marat Zakirov Kamaz Soenke Klinkhammer Kostal Nadine Cariou Labsphere
25
Copyright © 2018 IEEE. All rights reserved.
Full Name Company
Greg McKee Labsphere Maha Sabra Magna Electronics Xiyuan Liu Magna Electronics Martin Solar Magna Electronics Ian Wallhead Navitar Industries LLC Christian Bouvier New Imaging Technologies Elaine Jin NVIDIA Robin Jenkin NVIDIA Mario Heid OmniVision Technologies Michael Liubakka OmniVision Technologies Bahman Hadji ON Semiconductor Christian Mauer ON Semiconductor Chuck Kingston ON Semiconductor Daniel Pates ON Semiconductor Darryl Perks ON Semiconductor Gulwinder Randhawa ON Semiconductor Orit Skorka ON Semiconductor Paul Kane ON Semiconductor Robert Black ON Semiconductor Shaheen Amanullah ON Semiconductor Naoto Shimada Panasonic Petros Kapsalas Panasonic Automotive Europe Duong‐Van NGUYEN Panasonic Automotive Europe Radhesh Bhat PathPartner Technology Ron Tussy Pinnacle Imaging Systems Peter Nicke PiRo Systems Engineering Lark Kwon Choi Qualcomm Bo Mu Quanergy Systems Federico Martellini Renesas Electronics Europe Dr. Marc Geese Robert Bosch Jens Preiss Robert Bosch Samir Patel Robert Bosch Evgeny Soloveichik Samsung Gal Bitan Samsung Charles Barest Self Robert Stead Sense Media Group Brian Rodricks SensorSpace Sven Fleck SmartSurv Vision Systems Dr. Thorsten Steder SMR
26
Copyright © 2018 IEEE. All rights reserved.
Full Name Company
Arnaud Bourge STMicroelectronics Tarek Lule STMicroelectronics Gregory Roffet STMicroelectronics Corey Zehfus Sunex Peter Hark Sunex Vamsi Krishna Sistla TATA Elxsi Shashank Dabral Texas Instruments Peter Labaziewicz Texas Instruments Sophie Triantaphillidou University of Westminster Anburaj V Valeo Brian Deegan Valeo Jonathan Horgan Valeo Lucie Yahiaoui Valeo Micheal Garvey Valeo Patrick Denny Valeo Vladimir Zlokolica Valeo Wisweh Henning Volkwagen AG Yvonne Malmsten Volvo Juan Li Xiaopeng Motors Mehmet Fatih Yilmaz ZF Michael Junglas ZF

3 Park Avenue, New York, NY 10016-5997 USA http://standards.ieee.org
Tel.+1732-981-0060 Fax+1732-562-1571


![IEEE 383 White Paper (002).pptx [Read-Only]sites.ieee.org/.../06/SC2Mtg15-2_Att6_IEEE-383-White-Paper-Konnik.pdf · IEEE 383‐2015 Published in October Have Compare Document to Word](https://static.fdocuments.net/doc/165x107/5afd313d7f8b9a68498c838e/ieee-383-white-paper-002pptx-read-onlysitesieeeorg06sc2mtg15-2att6ieee-383-white-paper-.jpg)


![Synchronous Ethernet and IEEE 1588v2 Technology White Paper[1]](https://static.fdocuments.net/doc/165x107/577cc6ec1a28aba7119f86ea/synchronous-ethernet-and-ieee-1588v2-technology-white-paper1.jpg)

