IEEE Guide for Direct Lightning Stroke Shielding of...
173
IEEE Std 998-1996 IEEE Guide for Direct Lightning Stroke Shielding of Substations Sponsor Substations Committee of the IEEE Power Engineering Society Approved 19 April 1996 IEEE Standards Board Approved 11 September 1996 American National Standards Institute Abstract: Design information for the methods historically and typically applied by substation designers to minimize direct lightning strokes to equipment and buswork within substations is provided. Two approaches, the classical empirical method and the electrogeometric model, are presented in detail. A third approach involving the use of active lightning terminals is also briefly reviewed. Keywords: direct stroke shielding, lightning stroke protection, substations The Institute of Electrical and Electronics Engineers, Inc. 345 East 47th Street, New York, NY 10017-2394 Copyright ' 1996 by the Institute of Electrical and Electronics Engineers, Inc. All rights reserved. Published 1996. Printed in the United States of America. ISBN 1-55937-768-2 No part of this publication may be reproduced in any form, in an electronic retrieval or otherwise, without the prior written permission of the publisher. Authorized licensed use limited to: UNIVERSIDADE DO PORTO. Downloaded on October 13, 2009 at 10:22 from IEEE Xplore. Restrictions apply.
Transcript of IEEE Guide for Direct Lightning Stroke Shielding of...

A
IEEE Std 998-1996
IEEE Guide for Direct Lightning Stroke Shielding of Substations
SponsorSubstations Committeeof theIEEE Power Engineering Society
Approved 19 April 1996
IEEE Standards Board
Approved 11 September 1996
American National Standards Institute
Abstract: Design information for the methods historically and typically applied by substation designers tominimize direct lightning strokes to equipment and buswork within substations is provided. Twoapproaches, the classical empirical method and the electrogeometric model, are presented in detail. A thirdapproach involving the use of active lightning terminals is also briefly reviewed.Keywords: direct stroke shielding, lightning stroke protection, substations
The Institute of Electrical and Electronics Engineers, Inc.
345 East 47th Street, New York, NY 10017-2394
Copyright © 1996 by the Institute of Electrical and Electronics Engineers, Inc.
All rights reserved. Published 1996. Printed in the United States of America.
ISBN 1-55937-768-2
No part of this publication may be reproduced in any form, in an electronic retrieval or otherwise, without the priorwritten permission of the publisher.
uthorized licensed use limited to: UNIVERSIDADE DO PORTO. Downloaded on October 13, 2009 at 10:22 from IEEE Xplore. Restrictions apply.

A
IEEE Standards documents are developed within the IEEE Societies and the Standards Coordinating Committees ofthe IEEE Standards Board. Members of the committees serve voluntarily and without compensation. They are notnecessarily members of the Institute. The standards developed within IEEE represent a consensus of the broadexpertise on the subject within the Institute as well as those activities outside of IEEE that have expressed an interestin participating in the development of the standard.
Use of an IEEE Standard is wholly voluntary. The existence of an IEEE Standard does not imply that there are no otherways to produce, test, measure, purchase, market, or provide other goods and services related to the scope of the IEEEStandard. Furthermore, the viewpoint expressed at the time a standard is approved and issued is subject to changebrought about through developments in the state of the art and comments received from users of the standard. EveryIEEE Standard is subjected to review at least every Þve years for revision or reafÞrmation. When a document is morethan Þve years old and has not been reafÞrmed, it is reasonable to conclude that its contents, although still of somevalue, do not wholly reßect the present state of the art. Users are cautioned to check to determine that they have thelatest edition of any IEEE Standard.
Comments for revision of IEEE Standards are welcome from any interested party, regardless of membership afÞliationwith IEEE. Suggestions for changes in documents should be in the form of a proposed change of text, together withappropriate supporting comments.
Interpretations: Occasionally questions may arise regarding the meaning of portions of standards as they relate tospeciÞc applications. When the need for interpretations is brought to the attention of IEEE, the Institute will initiateaction to prepare appropriate responses. Since IEEE Standards represent a consensus of all concerned interests, it isimportant to ensure that any interpretation has also received the concurrence of a balance of interests. For this reason,IEEE and the members of its societies and Standards Coordinating Committees are not able to provide an instantresponse to interpretation requests except in those cases where the matter has previously received formalconsideration.
Comments on standards and requests for interpretations should be addressed to:
Secretary, IEEE Standards Board445 Hoes LaneP.O. Box 1331Piscataway, NJ 08855-1331USA
Authorization to photocopy portions of any individual standard for internal or personal use is granted by the Instituteof Electrical and Electronics Engineers, Inc., provided that the appropriate fee is paid to Copyright Clearance Center.To arrange for payment of licensing fee, please contact Copyright Clearance Center, Customer Service, 222 RosewoodDrive, Danvers, MA 01923 USA; (508) 750-8400. Permission to photocopy portions of any individual standard foreducational classroom use can also be obtained through the Copyright Clearance Center.
NOTE Ñ Attention is called to the possibility that implementation of this standard may require use of subject matter coveredby patent rights. By publication of this standard, no position is taken with respect to the existence or validity of anypatent rights in connection therewith. The IEEE shall not be responsible for identifying all patents for which alicense may be required by an IEEE standard or for conducting inquiries into the legal validity or scope of thosepatents that are brought to its attention,
uthorized licensed use limited to: UNIVERSIDADE DO PORTO. Downloaded on October 13, 2009 at 10:22 from IEEE Xplore. Restrictions apply.

A
Introduction
[This introduction is not part of IEEE Std 998-1996, IEEE Guide for Direct Lightning Stroke Shielding of Substations (ANSI).]
This guide was prepared by the Direct Stroke Shielding of Substations Working Group of the Substations Committee,Transmission Substations Subcommittee. Work on this guide began in 1973 and many former members madecontributions towards its completion. The membership of the working group during the preparation of this draft was asfollows:
R. J. Wehling, Chair Nelson Barbeito, Vice Chair John R. Clayton, Secretary
Hanna E. AbdallahP. ChowdhuriSteve L. DuongDennis R. FalkenheimGeorge FlaigDave L. Goetz
William A. GriegoRichard J. HellwegAbdul M. MousaRobert S. NowellJ. Ted OrrellJan PanekR. J. Perina
Don RogersPankaj K. SenFrank C. ShainauskasW. Keith SwitzerEdgar R. TaylorAung Thaik
Former working group members who made signiÞcant contributions towards development of the guide were asfollows:
Gary D. BehrensIvan B. ClevengerGeorge W. Crouch
William H. DainwoodFrank J. Jaskowiak
A. P. (Paul) JohnsonZlatko KapelinaFrank F. Kluge
iii
uthorized licensed use limited to: UNIVERSIDADE DO PORTO. Downloaded on October 13, 2009 at 10:22 from IEEE Xplore. Restrictions apply.

A
The following persons were on the balloting committee:
William J. AckermanS. J. ArnotA. C. BakerNelson BarbeitoG.J. BartokBurhan BecerKevin M. BevinsMichael J. BioKenneth L. BlackCharles BlattnerW.R. BlockSteven A. BoggsPhilip C. BolinSteven D. BrownJames C. BurkeJohn B. CannonDaniel CharbonnetFrank Y. ChuD.Mason ClarkJ. R. ClaytonRobert CorlewRichard CottrellEugene F. CounselWilliam DailyFrank A. DenbrockClifford C. DiemondW. Bruce DietzmanTerry DoernClaude Durand
Gary R. EngmannJames W. EvansRon J. FarquharsonLenard N. FergusonDavid Lane GarrettFloyd W. GreenwayJohn GrzanDavid L. HarrisR.J. HellwegJohn E. HolladayMike L. HolmKenneth JacksonZlatko KapelinaRichard P. KeilAlan E. KollarT. L. KrummreyLuther W. KurtzDonald N. LairdLawrence M. LaskowskiAlfred A. LeiboldC.T. LindebergH. Peter LipsRusko MatulicJohn D. McDonaldThomas S. McLenahanA. P. Sakis MeliopoulosAbdul M. MousaPhilip R. Nannery
R. S. NowellEdward V. OlavarriaJ. Ted OrrellJames S. OswaldShashi G. PatelRaymond J. PerinaK. PetterssonWalter PrystajeckyJ. F. QuinataB. Don RussellJakob SabathSamuel C. SciaccaF. C. ShainauskasJune SingletaryLee H. SmithRobert C. SodergrenBodo SojkaRobert C. St. ClairRobert P. StewartW. Keith SwitzerStanley R. SykesJohn T. TengdinHemchand ThakarCharles F. ToddDuane R. TorgersonL. F. VolfR. J. WehlingW. M. WernerBahman Yamin-Afshar
iv
uthorized licensed use limited to: UNIVERSIDADE DO PORTO. Downloaded on October 13, 2009 at 10:22 from IEEE Xplore. Restrictions apply.

A
The Þnal conditions for approval of this standard were met on 19 April 1996. This standard was conditionally approvedby the IEEE Standards Board on 14 March 1996, with the following membership:
Donald C. Loughry, Chair Richard J. Holleman, Vice Chair
Andrew G. Salem, Secretary
Gilles A. BarilClyde R. CampJoseph A. CannatelliStephen L. DiamondHarold E. EpsteinDonald C. FleckensteinJay Forster*Donald N. HeirmanBen C. Johnson
E. G. ÒAlÓ KienerJoseph L. Koepfinger*Stephen R. LambertLawrence V. McCallL. Bruce McClungMarco W. MigliaroMary Lou PadgettJohn W. PopeJose R. Ramos
Arthur K. ReillyRonald H. ReimerGary S. RobinsonIngo R�schJohn S. RyanChee Kiow TanLeonard L. TrippHoward L. Wolfman
*Member Emeritus
Also included are the following nonvoting IEEE Standards Board liaisons:
Satish K. Aggarwal Alan H. Cookson Chester C. Taylor
Kristin M. DittmannIEEE Standards Project Editor
v
uthorized licensed use limited to: UNIVERSIDADE DO PORTO. Downloaded on October 13, 2009 at 10:22 from IEEE Xplore. Restrictions apply.

CLAUSE PAGE
A
1. Overview.............................................................................................................................................................1
1.1 Scope.......................................................................................................................................................... 11.2 Purpose....................................................................................................................................................... 11.3 Definitions.................................................................................................................................................. 2
2. Lightning stroke phenomena...............................................................................................................................3
2.1 Charge formation in clouds........................................................................................................................ 32.2 Stroke formation ........................................................................................................................................ 42.3 Strike distance ............................................................................................................................................ 52.4 Stroke current magnitude ........................................................................................................................... 82.5 Keraunic level ............................................................................................................................................ 92.6 Ground flash density .................................................................................................................................. 92.7 Lightning detection networks................................................................................................................... 11
3. The design problem...........................................................................................................................................12
4. Empirical design methods .................................................................................................................................13
4.1 Fixed angles ............................................................................................................................................. 144.2 Origin of empirical curves ....................................................................................................................... 154.3 Application of empirical curves ............................................................................................................... 18
5. The electrogeometric model (EGM) .................................................................................................................21
5.1 History...................................................................................................................................................... 215.2 A revised EGM ........................................................................................................................................ 235.3 Application of the EGM4 by the rolling sphere method.......................................................................... 315.4 Application of revised EGM by Mousa and Srivastava method.............................................................. 395.5 Calculation of failure probability ............................................................................................................. 42
6. Active lightning terminals.................................................................................................................................42
7. Bibliography......................................................................................................................................................43
Annex A (Informative) Empirical shielding curves......................................................................................................49
Annex B (Informative) Sample calculations ................................................................................................................53
Annex C (Informative) Calculation of corona radius and surge impedance under corona ........................................125
Annex D (Informative) Calculation of failure probability .........................................................................................128
Annex E (Informative) IEEE questionnaireÑ1991 ...................................................................................................130
Annex F (Informative) The Dainwood method .........................................................................................................147
Annex G (Informative) Direct lightning stroke protection ........................................................................................148
vi
uthorized licensed use limited to: UNIVERSIDADE DO PORTO. Downloaded on October 13, 2009 at 10:22 from IEEE Xplore. Restrictions apply.

A
IEEE Guide for Direct Lightning Stroke Shielding of Substations
1. Overview
1.1 Scope
The scope of this guide is the identiÞcation and discussion of design procedures to provide direct stroke shielding ofoutdoor distribution, transmission, and generating plant substations. All known methods of shielding from directstrokes were investigated during the preparation of this guide, and information is provided on two methods found to bewidely used:
a) The classical empirical methodb) The electrogeometric model
A third approach, which involves the use of active lightning terminals, is brießy reviewed in clause 6.
This guide does not purport to include all shielding methods that may have been developed. The guide also does notaddress protection from surges entering a substation over power or communication lines or the personnel safety issues.
Users of this guide should thoroughly acquaint themselves with all factors that relate to the design of a particularinstallation and use good engineering judgment in the application of the methods given here, particularly with respectto the importance and value of the equipment being protected.
1.2 Purpose
The intent of this guide is to provide design information for the methods historically and typically applied bysubstation designers to minimize direct lightning strokes to equipment and buswork within substations. The generalnature of lightning is discussed in clause 2 and the problems associated with providing protection from direct strikesare described in clause 3. The methods reviewed in this guide for designing a system of protection are explained inclauses 4 and 5, and sample calculations are given in annex B to illustrate use of the methods. Clause 7 contains anextensive bibliography for further study of the subject.
1
uthorized licensed use limited to: UNIVERSIDADE DO PORTO. Downloaded on October 13, 2009 at 10:22 from IEEE Xplore. Restrictions apply.

IEEE Std 998-1996 IEEE GUIDE FOR DIRECT LIGHTNING STROKE
A
1.3 Definitions
The deÞnitions of terms contained in this document are not intended to embrace all legitimate meanings of the terms.They may only be applicable to the subject treated in this document. For additional deÞnitions refer to IEEE Std 100-1992 1.
1.3.1 critical stroke amplitude: The amplitude of the current of the lightning stroke that, upon terminating on thephase conductor, would raise the voltage of the conductor to a level at which ßashover is likely.
1.3.2 dart leader: The downward leader of a subsequent stroke of a multiple-stroke lightning ßash.
1.3.3 effective shielding: That which permits lightning strokes no greater than those of critical amplitude (less designmargin) to reach phase conductors.
1.3.4 electrogeometric model (EGM): A geometrical representation of a facility, that, together with suitableanalytical expressions correlating its dimensions to the current of the lightning stroke, is capable of predicting if alightning stroke will terminate on the shielding system, the earth, or the element of the facility being protected.
1.3.5 electrogeometric model theory: The theory describing the electrogeometric model together with the relatedquantitative analyses including the correlation between the striking distances to the different elements of the modeland the amplitude of the Þrst return stroke.
1.3.6 ground ßash density (GFD): The average number of lightning strokes per unit area per unit time at a particularlocation.
1.3.7 isokeraunic lines: Lines on a map connecting points having the same keraunic level.
1.3.8 keraunic level: The average annual number of thunderstorm days or hours for a given locality. (1) A dailykeraunic level is called a thunderstorm-day and is the average number of days per year in which thunder is heardduring a 24 h period. (2) An hourly keraunic level is called a thunderstorm-hour and is the average number of hours peryear that thunder is heard during a 60 min period.
1.3.9 lightning ßash: The complete lightning discharge, most often composed of leaders from a cloud followed by oneor more return strokes.
1.3.10 lightning mast: A column or narrow-base structure containing a vertical conductor from its tip to earth, or thatis itself a suitable conductor to earth. Its purpose is to intercept lightning strokes so that they do not terminate onobjects located within its zone of protection.
1.3.11 negative shielding angle: The shielding angle formed when the shield wire is located beyond the area occupiedby the outermost conductors. See also: shielding angle, positive shielding angle.
1.3.12 positive shielding angle: The shielding angle formed when the shield wire is located above and inside of thearea occupied by the outermost conductors. See also: shielding angle, negative shielding angle.
1.3.13 rolling sphere method: A simpliÞed technique for applying the electrogeometric theory to the shielding ofsubstations. The technique involves rolling an imaginary sphere of prescribed radius over the surface of a substation.The sphere rolls up and over (and is supported by) lightning masts, shield wires, fences, and other grounded metalobjects intended for lightning shielding. A piece of equipment is protected from a direct stroke if it remains below thecurved surface of the sphere by virtue of the sphere being elevated by shield wires or other devices. Equipment thattouches the sphere or penetrates its surface is not protected.
1.3.14 shielding angle (1) (of shield wires with respect to conductors): The angle formed by the intersection of avertical line drawn through a shield wire and a line drawn from the shield wire to a protected conductor. The angle ischosen to provide a zone of protection for the conductor so that most lightning strokes will terminate on the shield wirerather than on the conductor.
(2) (of a lightning mast): The angle formed by the intersection of a vertical line drawn through the tip of the mast andanother line drawn through the tip to earth at some selected angle with the vertical. Rotation of this angle around the
1The numbers in brackets correspond to those of the bibliography in clause 7.
2 Copyright © 1996 IEEE All Rights Reserved
uthorized licensed use limited to: UNIVERSIDADE DO PORTO. Downloaded on October 13, 2009 at 10:22 from IEEE Xplore. Restrictions apply.

SHIELDING OF SUBSTATIONS IEEE Std 998-1996
A
structure forms a cone-shaped zone of protection for objects located within the cone. The angle is chosen so thatlightning strokes will terminate on the mast rather than on an object contained within the protective zone so formed.See also: positive and negative shielding angle.
1.3.15 shield wire (overhead power line or substation): A wire suspended above the phase conductors positionedwith the intention of having lightning strike it instead of the phase conductor(s). Synonyms: overhead ground wire(OHGW), static wire and sky wire.
1.3.16 stepped leader: Static discharge that propagates from a cloud into the air. Current magnitudes that areassociated with stepped leaders are small (on the order of 100 A) in comparison with the Þnal stroke current. Thestepped leaders progress in a random direction in discrete steps from 10 to 80 m in length. Their most frequent velocityof propagation is about 0.05% of the speed of light, or approximately 500 000 ft/s (150 000 m/s). It is not until thestepped leader is within striking distance of the point to be struck that the stepped leader is positively directed towardthis point.
1.3.17 striking distance: The length of the Þnal jump of the stepped leader as its potential exceeds the breakdownresistance of this last gap; found to be related to the amplitude of the Þrst return stroke.
1.3.18 surge impedance: The ratio between voltage and current of a wave that travels on a conductor.
1.3.19 thunder: The sound that follows a ßash of lightning and is caused by the sudden expansion of the air in the pathof electrical discharge.
1.3.20 thunderstorm day: A day on which thunder can be heard, and hence when lightning occurs.
1.3.21 thunderstorm hour: An hour during which thunder can be heard, and hence when lightning occurs.
2. Lightning stroke phenomena
2.1 Charge formation in clouds
Numerous theories have been advanced regarding the formation of charge centers, charge separation within a cloud,and the ultimate development of lightning strokes. One theory attributes charge separation to the existence of bothpositive and negative ions in the air and the existence of a normal electric Þeld directed toward the earth. Large dropsof water in the electric Þeld are polarized, the upper sides acquiring a negative charge and the lower sides a positivecharge. As the polarized drops of water fall due to gravity, the undersides (positive sides) attract negative ions, whileno such action occurs at the upper surfaces. As a result of this action, the drops accumulate negative charge. Thus, theoriginal charges, which were distributed at random and produced an essentially neutral space charge, becomeseparated. The large drops of water carry the negative charges to the lower portion of the cloud, causing the lowerportion to be negatively charged and the upper portion to be positively charged. Another theory is that the interactionof ascending wind currents in the leading head of a cloud breaks up the water droplets causing the resulting dropletsto be positively charged and the air to be negatively charged. The positively charged water droplets are unable to fallthrough the ascending wind currents at the head of the cloud, which causes this portion of the cloud to be positivelycharged while the remaining larger portion becomes negatively charged. Yet another theory suggests that there areregions of subzero temperature within a cloud and the subsequent formation of ice crystals is an essential factor in theexplanation of the charge centers within clouds. (These three theories are presented in [B95].)
It has even been suggested that perhaps all of the physical phenomena postulated in the various theories may occur, Atbest, the processes occurring within a cloud formation that cause charge separation are complicated. The importantfact to the designing engineer is that a charge separation does occur in thunderstorm clouds. Experiments usingballoons equipped with electric gradient measuring equipment have been performed to investigate typical chargedistribution in thunderclouds, and these experiments have shown that, in general, the main body of a thundercloud isnegatively charged and the upper part positively charged [B95]. A concentration of positive charge also frequentlyexists in the base of the cloud. Such charge distribution in a cloud causes an accumulation of charge of the oppositepolarity on the earthÕs surface and on objects (e.g., trees, buildings, electric power lines, structures, etc.) beneath the
Copyright © 1996 IEEE All Rights Reserved 3
uthorized licensed use limited to: UNIVERSIDADE DO PORTO. Downloaded on October 13, 2009 at 10:22 from IEEE Xplore. Restrictions apply.

IEEE Std 998-1996 IEEE GUIDE FOR DIRECT LIGHTNING STROKE
A
cloud. A typical charged cloud and the resulting electric Þelds are shown in Þgure 2-1. (Note that the plot in Þgure 2-1 is of the electric gradient as the cloud moves over the ground, not the amount of charge below the cloud.) The electricÞelds shown in Þgure 2-1 have been veriÞed by data obtained from ground gradient measuring equipment during thepassage of storm clouds [B30].
Figure 2-1 ÑCharged cloud and resulting electric fields
The electrical charge concentrations within a cloud are constrained to the size of the cloud. The cloud size, in relationto the earth, is small. Therefore, the electrical gradient that exists in the cloud is much greater than at the earth. Becauseof this, an electrical discharge tends to be initiated at the cloud rather than at the ground.
2.2 Stroke formation
2.2.1 Types of strokes
There are a number of different types of lightning strokes. These include strokes within clouds, strokes betweenseparate clouds, strokes to tall structures, and strokes that terminate on the ground. The positive and negative strokesterminating on the ground are the types of most interest in designing shielding systems and the following discussionwill be conÞned to those types.
4 Copyright © 1996 IEEE All Rights Reserved
uthorized licensed use limited to: UNIVERSIDADE DO PORTO. Downloaded on October 13, 2009 at 10:22 from IEEE Xplore. Restrictions apply.

SHIELDING OF SUBSTATIONS IEEE Std 998-1996
A
2.2.2 Stepped leaders
The actual stroke development occurs in a two-step process. The Þrst step is ionization of the air surrounding thecharge center and the development of stepped leaders, which propagate charge from the cloud into the air. Currentmagnitudes associated with stepped leaders are small (in the order of 100 A) in comparison with the Þnal strokecurrent [B95]. The stepped leaders progress in a random direction in discrete steps from 10 to 80 m in length. Theirmost frequent velocity of propagation is about 0.05% the speed of light, or approximately 500 000 ft/s (150 000 m/s)[B4]. It is not until the stepped leader is within striking distance of the point to be struck that the leader is positivelydiverted toward this point. Striking distance is the length of the last step of leader under the inßuence of attractiontoward the point of opposite polarity to be struck.
2.2.3 Return stroke
The second step in the development of a lightning stroke is the return stroke. The return stroke is the extremely brightstreamer that propagates upward from the earth to the cloud following the same path as the main channel of thedownward stepped leader. This return stroke is the actual ßow of stroke current that has a median value of about 24 000A and is actually the ßow of charge from earth to cloud to neutralize the charge center [B70]. The velocity of the returnstroke propagation is about 10% the speed of light, or approximately 100á106 ft/s (30á106 m/s) [B95].
The amount of charge (usually negative)descending to the earth from the cloud is equal to the charge (usually positive)that ßows upward from the earth. Since the propagation velocity of the return stroke is so much greater than thepropagation velocity of the stepped leader, the return stroke exhibits a much larger current ßow (rate of chargemovement). The various stages of a stroke development are shown in Þgure 2-2, Approximately 55% of all lightningßashes consist of multiple strokes that traverse the same path formed by the initial stroke. The leaders of subsequentstrokes have a propagation velocity much greater than that of the initial stroke (approximately 3% the speed of light)and is referenced as a dart leader [B95].
2.3 Strike distance
Return stroke current magnitude and strike distance (length of the last stepped leader) are interrelated. A number ofequations have been proposed for determining the striking distance. The principal ones are as follows:
(2-1A)
(2-1B)
(2-1C)
S 2 I= 30 1 eIÐ 6.8¤
Ð( ) Darveniza [B26]+
S 10 I0.65
= Love [B4, 46a]
S 9.4 I2 3¤
= Whitehead [B98]
Copyright © 1996 IEEE All Rights Reserved 5
uthorized licensed use limited to: UNIVERSIDADE DO PORTO. Downloaded on October 13, 2009 at 10:22 from IEEE Xplore. Restrictions apply.

IEEE Std 998-1996 IEEE GUIDE FOR DIRECT LIGHTNING STROKE
A
Figure 2-2 ÑCharge distribution at various stages of lightning discharge
6 Copyright © 1996 IEEE All Rights Reserved
uthorized licensed use limited to: UNIVERSIDADE DO PORTO. Downloaded on October 13, 2009 at 10:22 from IEEE Xplore. Restrictions apply.

SHIELDING OF SUBSTATIONS IEEE Std 998-1996
A
(2-1D)
(2-1E)
where
S
is the strike distance in meters
I
is the return stroke current in kiloamperes
It may be disconcerting to note that the above equations vary by as much as a factor of 2:1. However, lightninginvestigators now tend to favor the shorter strike distances given by Eq 2-1D. J. G. Anderson, for example, whoadopted Eq 2-1B in the 1975 edition of the
Transmission Line Reference Book
[B4], now feels that Eq 2-1D is moreaccurate. Mousa [B67] also supports this form of the equation.
Equation 2-1D has been adopted for this guide. The equation may also be stated as follows:
(2-1F)
This relationship is shown graphically in Þgure 2-3. From this point on, the return stroke current will be referenced inthis guide as the
stroke current
.
Figure 2-3 ÑStrike distance vs. stroke current
S 8 I0.65
= IEEE [B46]
S 3.3 I0.78
= Suzuki [B89]
I 0.041 S1.54
=
Copyright © 1996 IEEE All Rights Reserved 7
uthorized licensed use limited to: UNIVERSIDADE DO PORTO. Downloaded on October 13, 2009 at 10:22 from IEEE Xplore. Restrictions apply.

IEEE Std 998-1996 IEEE GUIDE FOR DIRECT LIGHTNING STROKE
A
2.4 Stroke current magnitude
Since the stroke current and striking distance are related, it is of interest to know the distribution of stroke currentmagnitudes. The median value of strokes to OHGW, conductors, structures, and masts is usually taken to be 31 kA[B4]. Anderson [B4] gave the probability that a certain peak current will be exceeded in any stroke as follows:
(2-2A)
where
P(I)
is the probability that the peak current in any stroke will exceed
II
is the speciÞed crest current of the stroke in kiloamperes
Mousa [B70] has shown that a median stroke current of 24 kA for strokes to ßat ground produces the best correlationwith available Þeld observations to date. Using this median value of stroke current, the probability that a certain peakcurrent will be exceeded in any stroke is given by the following equation:
(2-2B)
where the symbols have the same meaning as above.
Figure 2-4 is a plot of Eq 2-2B, and Þgure 2-5 is a plot of the probability that a stroke will be within the ranges shownon the abscissa.
Figure 2-4 ÑProbability of stroke current exceeding abscissa for strokes to flat ground
P I( ) 1
1I
31------è ø
æ ö2.6
+
---------------------------=
P I( ) 1
1I
24------è ø
æ ö2.6
+
---------------------------=
8 Copyright © 1996 IEEE All Rights Reserved
uthorized licensed use limited to: UNIVERSIDADE DO PORTO. Downloaded on October 13, 2009 at 10:22 from IEEE Xplore. Restrictions apply.

SHIELDING OF SUBSTATIONS IEEE Std 998-1996
A
Figure 2-5 ÑStroke current range probability for strokes to flat ground
2.5 Keraunic level
Keraunic level
is deÞned as the average annual number of thunderstorm days or hours for a given locality. A dailykeraunic level is called a thunderstorm-day and is the average number of days per year on which thunder will be heardduring a 24 h period. By this deÞnition, it makes no difference how many times thunder is heard during a 24 h period.In other words, if thunder is heard on any one day more than one time, the day is still classiÞed as one thunder-day (orthunderstorm day).
The National Oceanic and Atmospheric Administration (NOAA) now keeps hourly thunderstorm records. An hourlykeraunic level is called a thunderstorm-hour and is the average number of hours per year on which thunder will beheard during a 60 rain period. In other words, if thunder is heard on any one hour more than one time, the hour is stillclassiÞed as one thunder-hour (or thunderstorm hour). This provides a more accurate picture of the lightning densityin a given area.
The average annual keraunic level for locations in the United States can be determined by referring to isokeraunicmaps on which lines of equal keraunic level are plotted on a map of the country. Figures 2-6, 2-7, and 2-8 give themean annual thunderstorm days for the U.S., Canada, and the world based on thunderstorm days. Figure 2-9 gives thekeraunic level for the U.S. based on thunderstorm-hours. This latter data was prepared by MacGorman, Maier, andRust for the Nuclear Regulatory Commission (NRC) under the auspices of NOAA [B54]. Combined thunderstorm-hour data for the U.S. and Canada can also be found in Figure II of [B46a].
2.6 Ground flash density
Ground ßash density
(GFD) is deÞned as the average number of strokes per unit area per unit time at a particularlocation. It is usually assumed that the GFD to earth, a substation, or a transmission or distribution line is roughlyproportional to the keraunic level at the locality. Table 2-1, taken from [B4], gives various equations for GFD asdeveloped by various researchers around the world. These researchers arrived at a proportional relationship rangingfrom 0.1
T
to 0.19
T
ground ßashes per square kilometer per year, where
T
is the average annual keraunic level. Ifthunderstorm days are to be used as a basis, it is suggested that the following equation be used [B4]:
(2-3A)Nk 0.12 T d=
Copyright © 1996 IEEE All Rights Reserved 9
uthorized licensed use limited to: UNIVERSIDADE DO PORTO. Downloaded on October 13, 2009 at 10:22 from IEEE Xplore. Restrictions apply.

IEEE Std 998-1996 IEEE GUIDE FOR DIRECT LIGHTNING STROKE
A
Figure 2-6 ÑMean annual thunderstorm daysÑU.S.
or
(2-3B)
where
N
k
is the number of ßashes to earth per square kilometer per year
N
m
is the number of ßashes to earth per square mile per year
T
d
is the average annual keraunic level, thunderstorm days
If thunderstorm hours is to be used as a basis, the following formula by MacGorman, et al. [B54] is recommended.
(2-4A)
or
(2-4B)
Nm 0.31 T d=
Nk 0.054 T h1.1
=
Nm 0.14 T h1.1
=
10 Copyright © 1996 IEEE All Rights Reserved
uthorized licensed use limited to: UNIVERSIDADE DO PORTO. Downloaded on October 13, 2009 at 10:22 from IEEE Xplore. Restrictions apply.

SHIELDING OF SUBSTATIONS IEEE Std 998-1996
A
Figure 2-7 ÑMean annual thunderstorm daysÑCanada
where
T
h
is the average annual keraunic level, thunderstorm hours
The resulting ground ßash density using Eq 2-4A is shown in Þgure 2-10.
2.7 Lightning detection networks
A new technology is now being deployed in Canada and the U.S. that promises to provide more accurate informationabout ground ßash density and lightning stroke characteristics. Mapping of lightning ßashes to the earth has been inprogress for over a decade in Europe, Africa, Australia, and Asia. Now a network of direction Þnding receiving stationshas been installed across Canada and the U.S. By means of triangulation among the stations, and with computerprocessing of signals, it is possible to pinpoint the location of each lightning discharge. Hundreds of millions of strokeshave been detected and plotted to date.
Ground ßash density maps have already been prepared from this data, but with the variability in frequency and pathstaken by thunderstorms from year to year, it will take a number of years to develop data that is statistically signiÞcant.Some electric utilities are, however, taking advantage of this technology to detect the approach of thunderstorms andto plot the location of strikes on their system. This information is very useful for dispatching crews to trouble spots andcan result in shorter outages that result from lightning strikes.
Copyright © 1996 IEEE All Rights Reserved 11
uthorized licensed use limited to: UNIVERSIDADE DO PORTO. Downloaded on October 13, 2009 at 10:22 from IEEE Xplore. Restrictions apply.

IEEE Std 998-1996 IEEE GUIDE FOR DIRECT LIGHTNING STROKE
A
Figure 2-8 ÑMean annual thunderstorm daysÑthe world
3. The design problem
The engineer who seeks to design a direct stroke shielding system for a substation or facility must contend with severalelusive factors inherent with lightning phenomena, namely:
¾
The unpredictable, probabilistic nature of lightning
¾
The lack of data due to the infrequency of lightning strokes in substations
¾
The complexity and economics involved in analyzing a system in detail
There is known method of providing 100% shielding short of enclosing the equipment in a solid metallic enclosure.The uncertainty, complexity, and cost of performing a detailed analysis of a shielding system has historically resultedin simple rules of thumb being utilized in the design of lower voltage facilities. Extra high voltage (EHV) facilities,with their critical and more costly equipment components, usually justify a more sophisticated study to establish therisk vs. cost beneÞt.
Because of the above factors, it is suggested that a four-step approach be utilized in the design of a protection system:
a) Evaluate the importance and value of the facility being protected.
b) Investigate the severity and frequency of thunderstorms in the area of the substation facility and the exposureof the substation.
12 Copyright © 1996 IEEE All Rights Reserved
uthorized licensed use limited to: UNIVERSIDADE DO PORTO. Downloaded on October 13, 2009 at 10:22 from IEEE Xplore. Restrictions apply.

SHIELDING OF SUBSTATIONS IEEE Std 998-1996
A
Figure 2-9 ÑMean annual thunderstorm duration (hours), U.S.
c) Select an appropriate design method consistent with the above evaluation and then lay out an appropriatesystem of protection.
d) Evaluate the effectiveness and cost of the resulting design.
The following clauses and the bibliography listed in clause 7. will assist the engineer in performing these steps.
4. Empirical design methods
Two classical design methods have historically been employed to protect substations from direct lightning strokes:
a) Fixed angles
b) Empirical curves
The two methods have generally provided acceptable protection.
Copyright © 1996 IEEE All Rights Reserved 13
uthorized licensed use limited to: UNIVERSIDADE DO PORTO. Downloaded on October 13, 2009 at 10:22 from IEEE Xplore. Restrictions apply.

IEEE Std 998-1996 IEEE GUIDE FOR DIRECT LIGHTNING STROKE
A
Table 2-1 ÑEmpirical relationships between lightning ground flash density and annual thunder-days (T)
4.1 Fixed angles
It is not known when the use of Þxed angles Þrst began. F. W. Peek, Jr., and other investigators recognized as early as1924 [B78] that the area protected by a rod was bounded by a curved surface rather than a plane surface. It is likely,therefore, that Þxed angles were originally used by designers as a convenient approximation of the boundary ofprotection against lightning strokes. Wagner, McCann, and MacLane, Jr., formalized the use of Þxed angles in 1941[B93]. Fixed angles continue in use today as a design tool.
The Þxed-angle design method uses vertical angles to determine the number, position, and height of shielding wires ormasts. Figure 4-1 illustrates the method for shielding wires, and Þgure 4-2 illustrates the method for shielding masts.
The angles used are determined by the degree of lightning exposure, the importance of the substation being protected,and the physical area occupied by the substation. The value of the angle alpha that is commonly used is 45°. Both 30°and 45° are widely used for angle beta. (See annex E.)
Designers using the Þxed angle method may want to reduce the shielding angles as the height of the structuresincreases in order to maintain a low failure rate. Horvath [B42], using the EGM, calculated shielding failures as afunction of the height of the conductor above ground and the protective angle for transmission lines. As can be seenfrom table 4-1, the protective angle must be decreased as the conductor is raised in order to maintain a uniform failurerate.
LocationGround flash density
km-2 yr -1Reference
India 0.1T Aiya (1968)
Rhodesia 0.14T Anderson and Jenner (1954)
South Africa 0.04T1.25 Eriksson (1987)
Sweden 0.004T2 (approx.) Muller-Hillebrand (1964)
U.K. aTb Stringfellow (1974) [a= 2.6±0.2 ´ 10-3; b = 1.9 ± 0.1]
U.S.A. (North) 0.11T Horn and Ramsey (1951)
U.S.A. (South) 0.17T Horn and Ramsey (1951)
U.S.A. 0.1T Anderson and others (1968)
U.S.A. 0.15T Brown and Whitehead (1969)
U.S.S.R. 0.036T1.3 Kolokolov and Pavlova (1972)
World (temperate climate) 0.19T Brooks (1950)
World (temperate climate) 0.15T Golde (1966)
World (tropical climate) 0.13T Brooks (1950)
Reprinted from [B82] with permission of Academic Press Ltd.
14 Copyright © 1996 IEEE All Rights Reserved
uthorized licensed use limited to: UNIVERSIDADE DO PORTO. Downloaded on October 13, 2009 at 10:22 from IEEE Xplore. Restrictions apply.

SHIELDING OF SUBSTATIONS IEEE Std 998-1996
A
Figure 2-10 ÑMean annual ground flash densityÑU.S.
Horvath suggests a protective angle of 40°Ð45° for heights up to 15 m (49 ft), 30° for heights between 15Ð25 m (49Ð82 ft) and less than 20° for heights on up to 50 m (164 ft). A failure rate of 0.1Ð0.2 shielding failures/100 km/year wasassumed in these recommendations. (Horvath did not state the ground ßash density used in his example.) Thisapproach could also be used for selecting shielding angles for ground wires in substations.
A similar approach could be used for applying lightning masts in substations. Horvath suggested using the rollingsphere method (see clause 5.) to compile a table of shielding angles vs. conductor heights.
4.2 Origin of empirical curves
The use of empirical curves Þnds its origin in a paper published in 1941 by Wagner, McCann, and MacLane [B93].Scale model tests were conducted employing a 1-1/2 ´ 40 ms positive impulse to initiate a discharge from a rod(representing the charged cloud) to a ground plane or a horizontal shield wire and conductor located near the electrode.The relative spacing of the electrode, shield wire, and conductor was varied with each discharge so as to produce anadequate data base for analysis. Plots were then made from this data base showing the percent of discharges strikingthe shield wire, conductor, or ground plane. The authors also studied the lightning performance of many existing linesand the shielding system used and correlated the Þndings with their scale model work. The resulting recommendationshave been used for Þfty years and continue to be used.
Copyright © 1996 IEEE All Rights Reserved 15
uthorized licensed use limited to: UNIVERSIDADE DO PORTO. Downloaded on October 13, 2009 at 10:22 from IEEE Xplore. Restrictions apply.

IEEE Std 998-1996 IEEE GUIDE FOR DIRECT LIGHTNING STROKE
A
Figure 4-1 ÑFixed angles for shielding wires
16 Copyright © 1996 IEEE All Rights Reserved
uthorized licensed use limited to: UNIVERSIDADE DO PORTO. Downloaded on October 13, 2009 at 10:22 from IEEE Xplore. Restrictions apply.

SHIELDING OF SUBSTATIONS IEEE Std 998-1996
A
Figure 4-2 ÑFixed angles for masts
Copyright © 1996 IEEE All Rights Reserved 17
uthorized licensed use limited to: UNIVERSIDADE DO PORTO. Downloaded on October 13, 2009 at 10:22 from IEEE Xplore. Restrictions apply.

IEEE Std 998-1996 IEEE GUIDE FOR DIRECT LIGHTNING STROKE
A
Table 4-1 ÑCalculated frequency of shielding failures as a function of the height and the protective angle
The following year, 1942, Wagner, McCann, and Lear published a paper on shielding of substations [B94]. Theseinvestigations were based on additional scale model tests, and a series of curves were developed relating height andspacing of shield wires and masts to various failure rates. These curves produce a more accurate design than straightline approximations. This design method also continues to Þnd wide use today.
4.3 Application of empirical curves
From Þeld studies of lightning and laboratory model tests, empirical curves have been developed to determine thenumber, position, and height of shielding wires and masts [B93], [B94], [B96].
The curves were developed for shielding failure rates of 0.1, 1.0, 5.0, 10, and 15%. Curves for different conÞgurationsof shielding wires and masts are shown in Þgures A.1 through A.6 of annex A for failure rates of 0.1 and 1.0%. Afailure rate of 0.1% is commonly used in design.
Figures A.1 through A.6 use ratios of d/h, x/h, and s/h, which were used in the original study [B94]. Figures 4-3through 4-14 have been developed using Þgures A.1 through A.6 for a variety of protected object heights, d, toeliminate the necessity of using ratios. For a given x/h (s/h) ratio along the abscissa in Þgures A.1 through A.6, theordinate value yields a d/h ratio for a desired failure rate. For each selected value of d, a value of h for each discretevalue of x/h can be calculated as h = d/(d/h). Now, for these discrete values of h for a selected d, values of the horizontalseparation, x (s), can be calculated from x = x/h á h (s = s/h á h). The difference between the protected object height, d,and the shielding mast, or wire, height, h, can be calculated as y = h - d. These values of y can be plotted as acontinuous curve f(x, y) for a constant value d as shown in Þgures 4-3 through 4-14. For example, in Þgure A.2, datapoints from the original study appear to be plotted at x/h values of 0.25, 0.6, and 1.0. At the value of x/h equal to 0.6,d/h is estimated to be 0.46 for a 0.1% failure rate.
For d = 20 ft:
h = 20/0.46 = 43.48 ftx = 0.6 ´ 43.48 = 26.09 fty = 43.48 - 20 = 23.48 ft
Height of earth wire
in m Shielding failure/100 km per year with protective angle:
15° 20° 25° 30° 35° 40° 45°
10 0 0 1.1E-4 0.0087 0.0383 0.1032 0.2286
15 0 6.4E-5 0.0068 0.0351 0.0 982 0.2182 0.4483
20 8.3E-6 0.0026 0.0214 0.0711 0.1695 0.3466 0.6903
25 0.0011 0.0087 0.0404 0.1123 0.2468 0.4819 0.9429
30 0.0035 0.0170 0.0620 0.1565 0.3275 0.6208 1.2008
35 0.0069 0.0269 0.0853 0.2024 0.4100 0.7616 1.4608
40 0.0109 0.0378 0.1096 0.2494 0.4936 0.9035 1.7214
45 0.0155 0.0493 0.1345 0.2969 0.5776 1.0462 1.9820
50 0.0204 0.0612 0.1598 0.3447 0.6619 1.1892 2.2423
Source: [B42]. Reprinted with permission of Research Studies Press Ltd.
18 Copyright © 1996 IEEE All Rights Reserved
uthorized licensed use limited to: UNIVERSIDADE DO PORTO. Downloaded on October 13, 2009 at 10:22 from IEEE Xplore. Restrictions apply.

SHIELDING OF SUBSTATIONS IEEE Std 998-1996
A
Similarly, values of d/h can be estimated for other values of x/h and the resulting x and y values plotted for eachselected value of d for each failure rate. These particular values are illustrated in Þgure 4-5.
Figure 4-3 ÑSingle lightning mast protecting single objectÑ1% exposure. Height of lightning mast above protected object, y, as a function of
horizontal separation, x, and height of protected object, d
To evaluate the expected shielding performance of a substation site, proceedas follows:
a) Determine the ground ßash density using Eq 2-3 or Eq 2-4.
b) Calculate the number of ßashes to the substation area, Ns.
Ns = GFD ´ A / (1000)2
where
GFD is the ground ßash density in strokes per square kilometer per yearA is the substation area in square meters
c) Calculate number of strokes per year penetrating the shield, SP.
SP = Ns ´ exposure rate (1)
Choose acceptable exposure rate (Example 0.1% or 0.001)
WARNINGThe user is warned not to extrapolate the curves of figure 4-3 through figure 4-14 beyondtheir limits as plotted. Such extrapolations can result in exposures beyond the listed values.
Copyright © 1996 IEEE All Rights Reserved 19
uthorized licensed use limited to: UNIVERSIDADE DO PORTO. Downloaded on October 13, 2009 at 10:22 from IEEE Xplore. Restrictions apply.

IEEE Std 998-1996 IEEE GUIDE FOR DIRECT LIGHTNING STROKE
A
Figure 4-4 ÑSingle lightning mast protecting single objectÑl% exposure.Height of lightning mast above protected object, y, as a function of
horizontal separation, x, and height of protected object, d
4.3.1 Areas protected by lightning masts
Figures 4-15 and 4-16 illustrate the areas that can be protected by two or more shielding masts [B94]. If two masts areused to protect an area, the data derived from the empirical curves give shielding information only for the point B,midway between the two masts, and for points on the semicircles drawn about the masts, with radius x, as shown inÞgure 4-15(a). The locus shown in Þgure 4-15(a), drawn by the semicircles around the masts, with radius x, andconnecting the point B, represents an approximate limit for a selected exposure rate. For given values of d and y, a valueof s from Þgure 4-7 and x from Þgure 4-5 can be determined for an exposure rate of 0.1%. Any single point fallingwithin the cross-hatched area should have < 0.1% exposure. Points outside the cross-hatched area will have > 0,1%exposure. Figure 4-15(b) illustrates this phenomenon for four masts spaced at the distance s as in Þgure 4-15(a).
The protected area can be improved by moving the masts closer together, as illustrated in Þgure 4-16. In Þgure 4-16(a),the protected areas are, at least, as good as the combined areas obtained by superimposing those of Þgure 4-15(a). InÞgure 4-16(a), the distance s¢ is one-half the distance s in Þgure 4-15(a). To estimate the width of the overlap, x¢, Þrstobtain a value of y from Þgure 4-7 corresponding to twice the distance, s¢, between the masts. (Figure 4-9 has beenprepared to facilitate this estimate directly.) Then use Þgure 4-5 to determine x¢ for this value of y. This value of x isused as an estimate of the width of overlap x¢ in Þgure 4-16. As illustrated in Þgure 4-16(b), the size of the areas withan exposure greater than 0.1% has been signiÞcantly reduced.
20 Copyright © 1996 IEEE All Rights Reserved
uthorized licensed use limited to: UNIVERSIDADE DO PORTO. Downloaded on October 13, 2009 at 10:22 from IEEE Xplore. Restrictions apply.

SHIELDING OF SUBSTATIONS IEEE Std 998-1996
A
Figure 4-5 ÑSingle lightning mast protecting single ring of objectsÑ0.1% exposure.Height of lightning mast above protected object, y, as a function of
horizontal separation, x, and height of protected object, d
4.3.2 Effect of hillsides
For the application of the data presented here to stations located on hillsides, the dimensions h (the shielding conductorheight) and d (the height of the protected object) should be measured perpendicular to the earthÕs surface as illustratedin Þgure 4-17 [B94].
5. The electrogeometric model (EGM)
5.1 History
A rudimentary version of the electrogeometric model was developed by Golde in 1945 [B35], but the method wasnever adapted to shielding systems. In the mid-1950s, the Þrst North American 345 kV transmission lines were placedin service. The shielding design of the lines was based primarily on the methods found in [B1]. The outage rate fromlightning strokes subsequently proved to be much higher than expected, and this set in motion a thorough investigationof the problem. The modern EGM emerged as a result of this research.
Copyright © 1996 IEEE All Rights Reserved 21
uthorized licensed use limited to: UNIVERSIDADE DO PORTO. Downloaded on October 13, 2009 at 10:22 from IEEE Xplore. Restrictions apply.

IEEE Std 998-1996 IEEE GUIDE FOR DIRECT LIGHTNING STROKE
A
Figure 4-6 ÑSingle lightning mast protecting single ring of objectsÑ1% exposure.Height of lightning mast above protected object, y, as a function of
horizontal separation, x, and height of protected object, d
5.1.1 WhiteheadÕs EGM
In 1960, J. G. Anderson developed a computer program for calculation of transmission line lightning performance thatuses the Monte Carlo Method [B3]. This method showed good correlation with actual line performance. An earlyversion of the EGM was developed in 1963 by Young et al. [B101], but continuing research soon led to new models.
One extremely signiÞcant research project was performed by E. R. Whitehead [B97]. WhiteheadÕs work included atheoretical model of a transmission system subject to direct strokes, development of analytical expressions pertainingto performance of the line, and supporting Þeld data which veriÞed the theoretical model and analyses. The Þnalversion of this model was published by Gilman and Whitehead in 1973 [B33].
5.1.2 Recent improvements in the EGM
Sargent made an important contribution with the Monte Carlo Simulation of lightning performance [B85] and hiswork on lightning strokes to tall structures [B84]. Sargent showed that the frequency distribution of the amplitudes ofstrokes collected by a structure depends on the structure height as well as on its type (mast vs. wire). Figure 5-1 showsthe effect of the height of the structure, according to Sargent. In 1976 Mousa [B60] extended the application of theEGM (which was developed for transmission lines) to substation facilities.
22 Copyright © 1996 IEEE All Rights Reserved
uthorized licensed use limited to: UNIVERSIDADE DO PORTO. Downloaded on October 13, 2009 at 10:22 from IEEE Xplore. Restrictions apply.

SHIELDING OF SUBSTATIONS IEEE Std 998-1996
A
Figure 4-7 ÑTwo lightning masts protecting single object, no overlapÑ0.1% exposure. Height of mast above protected object, y, as a function of horizontal separation, s, and height of protected object, d
5.1.3 Criticism of the EGM
Work by Eriksson reported in 1978 [B27] and later work by Anderson and Eriksson reported in 1980 [B5] revealedapparent discrepancies in the EGM that tended to discredit it. Mousa [B67] has shown, however, that explanations doexist for the apparent discrepancies, and that many of them can be eliminated by adopting a revised electrogeometricmodel. Most investigators now accept the EGM as a valid approach for designing lightning shielding systems.
5.2 A revised EGM
This guide uses the revised EGM as developed by Mousa and Srivastava [B63], [B67]. Two methods of applying theEGM are the modiÞed version of the rolling sphere method [B49], [B50], [B74] described in 5.3, and the method givenby Mousa and Srivastava [B67], [B71] described in 5.4.
Copyright © 1996 IEEE All Rights Reserved 23
uthorized licensed use limited to: UNIVERSIDADE DO PORTO. Downloaded on October 13, 2009 at 10:22 from IEEE Xplore. Restrictions apply.

IEEE Std 998-1996 IEEE GUIDE FOR DIRECT LIGHTNING STROKE
A
Figure 4-8 ÑTwo lightning masts protecting single object, no overlapÑ1% exposure. Height of mast above protected object, y as a function of horizontal separation, s, and height of protected object, d
The revised EGM model differs from WhiteheadÕs model in the following respects:
a) The stroke is assumed to arrive in a vertical direction. (It has been found that WhiteheadÕs assumption of thestroke arriving at random angles is an unnecessary complication.) [B67]
b) The differing striking distances to masts, wires, and the ground plane are taken into consideration.
c) A value of 24 kA is used as the median stroke current [B70]. This selection is based on the frequencydistribution of the Þrst negative stroke to ßat ground. This value best reconciles the EGM with Þeldobservations.
d) The model is not tied to a speciÞc form of the striking distance equations Eq 2-1. Continued research is likelyto result in further modiÞcation of this equation as it has in the past. The best available estimate of thisparameter may be used.
5.2.1 Description of the revised EGM
In clause 2. of this guide the process of stroke formation was discussed. The concept that the Þnal striking distance isrelated to the magnitude of the stroke current was introduced and Eq 2-1D was selected as the best approximation ofthis relationship. A coefÞcient k accounts for the different striking distances to a mast, a shield wire, and to the ground.Eq 2-1D is repeated here with this modiÞcation:
24 Copyright © 1996 IEEE All Rights Reserved
uthorized licensed use limited to: UNIVERSIDADE DO PORTO. Downloaded on October 13, 2009 at 10:22 from IEEE Xplore. Restrictions apply.

SHIELDING OF SUBSTATIONS IEEE Std 998-1996
A
Figure 4-9 ÑTwo lightning masts protecting single object, with overlap 0.1% exposure. Height of mast above protected object, y, as a function of horizontal separation, s, and height of protected object, d
(5-1A)
or
(5-1B)
where
Sm is the strike distance in metersSf is the strike distance in feetI is the return stroke current in kiloamperesk is a coefÞcient to account for different striking distances to a mast, a shield wire, or the ground plane.
Mousa [B67] gives a value of k = 1 for strokes to wires or the ground plane and a value of k = 1.2 for strokes to alightning mast.
Sm 8 k I0.65
=
S f 26.25 k I0.65=
Copyright © 1996 IEEE All Rights Reserved 25
uthorized licensed use limited to: UNIVERSIDADE DO PORTO. Downloaded on October 13, 2009 at 10:22 from IEEE Xplore. Restrictions apply.

IEEE Std 998-1996 IEEE GUIDE FOR DIRECT LIGHTNING STROKE
A
Figure 4-10 ÑTwo lightning masts protecting single object, with overlapÑ1% exposure. Height of mast above protected object, y, as a function of horizontal separation, s, and height of protected object, d
Lightning strokes have a wide distribution of current magnitudes, as shown in Þgure 2-4. The EGM theory shows thatthe protective area of a shield wire or mast depends on the amplitude ofÕ the stroke current. If a shield wire protects aconductor for a stroke current Is, it may not shield the conductor for a stroke current less than Is that has a shorterstriking distance. Conversely, the same shielding arrangement will provide greater protection against stroke. currentsgreater than Is that have greater striking distances. This principle is discussed in more detail in 5.3.
Since strokes less than some critical value Is can penetrate the shield system and terminate on the protected conductor,the insulation system must be able to withstand the resulting voltages without ßashover. Stated another way, the shieldsystem should intercept all strokes of magnitude Is and greater so that ßashover of the insulation will not occur.
5.2.2 Allowable stroke current
Some additional relationships need to be introduced before showing how the EGM is used to design a zone ofprotection for substation equipment. Bus insulators are usually selected to withstand a basic lightning impulse level(BIL). Insulators may also be chosen according to other electrical characteristics including negative polarity impulsecritical ßashover (C.F.O.) voltage. Flashover occurs if the voltage produced by the lightning stroke current ßowingthrough the surge impedance of the station bus exceeds the withstand value. This may be expressed by the Gilman &Whitehead equation [B33]:
(5-2A)IS
BIL 1.1´ZS 2¤( )
----------------------- 2.2 BIL( )ZS
------------------------= =
26 Copyright © 1996 IEEE All Rights Reserved
uthorized licensed use limited to: UNIVERSIDADE DO PORTO. Downloaded on October 13, 2009 at 10:22 from IEEE Xplore. Restrictions apply.

SHIELDING OF SUBSTATIONS IEEE Std 998-1996
A
or
(5-2B)
where
IS is the allowable stroke current in kiloamperesBIL is the basic lightning impulse level in kilovoltsC.F.O is the negative polarity critical ßashover voltage of the insulation being considered in kilovoltsZS is the surge impedance of the conductor through which the surge is passing in ohms1.1 is the factor to account for the reduction of stroke current terminating on a conductor as compared to zero
impedance earth [B33]
A method of computing the surge impedance under corona is given in annex C.
In Equation 5-2B, the C.F.O. has been reduced by 6% to produce a withstand level roughly equivalent to the BIL ratingfor post insulators.
Figure 4-11 ÑSingle shield wire protecting horizontal conductorsÑ0.1% exposure. Height of shield wires above conductors, y, as a function of
horizontal separation, x, and height of protected conductors, d
IS0.94 C.F.O.´ 1.1´
ZS 2¤( )---------------------------------------------- 2.068 C.F.O.( )
ZS------------------------------------= =
Copyright © 1996 IEEE All Rights Reserved 27
uthorized licensed use limited to: UNIVERSIDADE DO PORTO. Downloaded on October 13, 2009 at 10:22 from IEEE Xplore. Restrictions apply.

IEEE Std 998-1996 IEEE GUIDE FOR DIRECT LIGHTNING STROKE
A
Figure 4-12 ÑSingle shield wire protecting horizontal conductorsÑ1% exposure. Height of shield wires above conductors, y, as a function of
horizontal separation, x, and height of protected conductors, d
5.2.2.1 Adjustment for end of bus situation
Equations 5-2A and 5-2B address the typical situation in which a direct lightning stroke to a conductor would have atleast two directions to ßow. The equations assume the surge impedances are the same in both directions, and thereforethe total surge impedance is the parallel combination of the two, or 1/2 ZS. Occasionally a designer may be concernedwith a situation in which the entire direct stroke current produces a surge voltage across the equipment. An examplewould be a direct stroke to the end of a radial bus. The surge can only ßow in one direction, and the surge voltageimpressed across the insulators of the bus would be the product of the total direct stroke current multiplied by the bussurge impedance. For such situations, the allowable: stroke current IS can be determined by dividing the results ofcalculations using equations 5-2A and 5-2B by 2.
28 Copyright © 1996 IEEE All Rights Reserved
uthorized licensed use limited to: UNIVERSIDADE DO PORTO. Downloaded on October 13, 2009 at 10:22 from IEEE Xplore. Restrictions apply.

SHIELDING OF SUBSTATIONS IEEE Std 998-1996
A
Figure 4-13 ÑTwo shield wires protecting horizontal conductorsÑ0.1% exposure. Height of shield wires above conductors, y, as a function of
horizontal separation, s, and height of protected conductors, d
5.2.2.2 Adjustment for transformer, open switch or open breaker
Another situation where a designer may have concern is at open points in the conductor (such as open switches andopen breakers), or points along, the conductor where the surge impedance changes to a large value such as attransformer windings. At such locations, the voltage wave will reverse its direction of ßow and return along theconductor. The voltage stress at these points will be up to two times the incoming value. This is referred to as thevoltage doubling effect. If the design has incorporated surge arresters at the point of high surge impedance change,such as at the bushings of transformers, the concern for voltage doubling is minimized. The arresters should operateand maintain the voltage at the discharge voltage level of the arresters. However, if arresters have not been applied atsuch points, the designer may wish to determine the allowable stroke currents for these locations considering voltagedoubling. The allowable stroke current IS can again be determined by dividing the results of calculations usingEquations 5-2A and 5-2B by 2.
The designer should keep in mind that reduced BIL equipment is not protected by a design based on stroke current Is.Such equipment should be protected by surge arresters in accordance with IEEE Std C62.22-1991 [B45].
Copyright © 1996 IEEE All Rights Reserved 29
uthorized licensed use limited to: UNIVERSIDADE DO PORTO. Downloaded on October 13, 2009 at 10:22 from IEEE Xplore. Restrictions apply.

IEEE Std 998-1996 IEEE GUIDE FOR DIRECT LIGHTNING STROKE
A
Figure 4-14 ÑTwo shield wires protecting horizontal conductorsÑ1% exposure. Height of shield wires above conductors, y, as a function of
horizontal separation, s, and height of protected conductors, d
5.2.3 Withstand voltage of insulator strings
BIL values of station post insulators can be found in vendor catalogs. A method is given below for calculating thewithstand voltage of insulator strings. Figure 5-2 gives the critical ßashover voltage of insulator strings. These werecompiled by Darveniza, et al. [B26] based on the experimental work of Paris, et al. [B76] and Fujitaka, et al. [B31],and were adopted by Anderson [B4]. The withstand voltage in kV at 2 ms and 6 ms can be obtained from Þgure 5-2 orcalculated as follows:
(5-3)
(5-4)
where
w is the length of insulator string (or air gap) in meters0.94 is the ratio of withstand voltage to C.F.O. voltageVI2 is the withstand voltage in kilovolts at 2 msVI6 is the withstand voltage in kilovolts at 6 ms
Equation 5-4 is recomended for use with the EGM.
Note that Þgure 5-2 is based on the application of pure lightning impulses. However, it can also be applied to the casewhere the stress on the insulators includes a power frequency component (ac or dc) as follows: A combined voltagesurge stress consisting of an ac component equal to a (kV) and a lightning surge component equal to b (kV) can beconsidered equivalent to a pure lightning surge having an amplitude equal to (a + b). This is the approach used byAnderson [B4] and by Clayton and Young [B23]. The paper by
V I 2 0.94 820 w´=
V I 6 0.94 585 w´=
30 Copyright © 1996 IEEE All Rights Reserved
uthorized licensed use limited to: UNIVERSIDADE DO PORTO. Downloaded on October 13, 2009 at 10:22 from IEEE Xplore. Restrictions apply.

SHIELDING OF SUBSTATIONS IEEE Std 998-1996
A
Figure 4-15 ÑAreas protected by multiple masts for point exposures shown in figures 4-5 end 4-7 or 4-6 end 4-8
(a) With two lightning masts (b)With four lightning masts
Hepworth,. et al. [B41] and its discussion by K, Feser support the above approach, while an IEEE Working Group[B43] suggests that a dc bias may have a conditioning effect that would increase the switching surge strength of the gapunder the combined stress beyond the value for a pure switching surge.
5.3 Application of the EGM by the rolling sphere method
The previous clauses introduced the concept of the electrogeometric model and gave the tools necessary to calculatethe unknown parameters. The concept will now be further developed and applied to substation situations.
Copyright © 1996 IEEE All Rights Reserved 31
uthorized licensed use limited to: UNIVERSIDADE DO PORTO. Downloaded on October 13, 2009 at 10:22 from IEEE Xplore. Restrictions apply.

IEEE Std 998-1996 IEEE GUIDE FOR DIRECT LIGHTNING STROKE
A
Figure 4-16 ÑAreas protected by multiple masts for point exposures shown in figures 4-5 and 4-9 or 4-6 and 4-10 (S'=0.5S in figure 4-15)
(a)With two lightning masts (b)With four lightning masts
It was previously stated that it is only necessary to provide shielding for the equipment from all lightning strokesgreater than Is that would result in a ßashover of the buswork. Strokes less than Is are permitted to enter the protectedzone since the equipment can withstand voltages below its BIL design level.
This will be illustrated by considering three levels of stroke current; Is, stoke currents greater than Is, and stroke currentless than Is. First, let us consider the stroke current Is.
5.3.1 Protection against stroke current Is
Is is calculated from Eq 5-2 as the current producing a voltage the insulation will just withstand. Substituting this resultin Eq 5-1 gives the striking distance S for this stroke current.
In 1977, Ralph H. Lee developed a simpliÞed technique for applying the electromagnetic theory to the shielding ofbuildings and industrial plants [B48], [B49], [B50]. J.T. Orrell extended the technique to speciÞcally cover theprotection of electric substations [B74]. The technique developed by Lee has come to be known as the rolling spheremethod. For the following illustration, the rolling sphere method will be used. This method employs the simplifying
32 Copyright © 1996 IEEE All Rights Reserved
uthorized licensed use limited to: UNIVERSIDADE DO PORTO. Downloaded on October 13, 2009 at 10:22 from IEEE Xplore. Restrictions apply.

SHIELDING OF SUBSTATIONS IEEE Std 998-1996
A
assumption that the striking distances to the ground, a mast, or a wire are the same. With this exception, the rollingsphere method has been updated in accordance with the revised EGM described in 5.2.
Figure 4-17 ÑEffect of hillsides
Use of the rolling sphere method involves rolling an imaginary sphere of radius S over the surface of a substation. Thesphere rolls up and over (and is supported by) lightning masts, shield wires, substation fences, and other groundedmetallic objects that can provide lightning shielding. A piece of equipment is said to be protected from a direct strokeif it remains below the curved surface of the sphere by virtue of the sphere being elevated by shield wires or otherdevices. Equipment that touches the sphere or penetrates its surface is not protected. The basic concept is illustrated inÞgure 5-3.
Continuing the discussion of protection against stroke current Is, consider Þrst a single mast. The geometrical modelof a single substation shield mast, the ground plane, the striking distance, and the zone of protection are shown inÞgure 5-4. An arc of radius S that touches the shield mast and the ground plane is shown in Þgure 5-4. All points belowthis arc are protected against the stroke current Is. This is the protected zone.
The arc is constructed as follows (see Þgure 5-4). A dashed line is drawn parallel to the ground at a distance S (thestriking distance as obtained from Eq 5-1) above the ground plane. An arc of radius S, with its center located on thedashed line, is drawn so the radius of the arc just touches the mast. Stepped leaders that result in stroke current Is andthat descend outside of the point where the arc is tangent to the ground will strike the ground. Stepped leaders thatresult in stroke current Is and that descend inside the point where the arc is tangent to the ground will strike the shieldmast, provided all other objects are within the protected zone. The height of the shield mast that will provide themaximum zone of protection for stroke currents equal to Is is S. If the mast height is less than S, the zone of protectionwill be reduced. Increasing the shield mast height greater than S will provide additional protection in the case of asingle mast. This is not necessarily true in the case of multiple masts and shield wires.
Copyright © 1996 IEEE All Rights Reserved 33
uthorized licensed use limited to: UNIVERSIDADE DO PORTO. Downloaded on October 13, 2009 at 10:22 from IEEE Xplore. Restrictions apply.

IEEE Std 998-1996 IEEE GUIDE FOR DIRECT LIGHTNING STROKE
A
Figure 5-1 ÑEffect of height of structure on frequency distribution of lightning current amplitudes according to Sargent
The protection zone can be visualized as the surface of a sphere with radius S that is rolled toward the mast untiltouching the mast. As the sphere is rolled around the mast, a three-dimensional surface of protection is deÞned. It isthis concept that has led to the name rolling sphere for simpliÞed applications of the electrogeometric model.
5.3.2 Protection against stroke currents greater than Is
Subclause 5.3.1 demonstrated the protection provided for a stroke current Is. A lightning stroke current has an inÞnitenumber of possible magnitudes, however, and the substation designer will want to know if the system providesprotection at other levels of stroke current magnitude.
34 Copyright © 1996 IEEE All Rights Reserved
uthorized licensed use limited to: UNIVERSIDADE DO PORTO. Downloaded on October 13, 2009 at 10:22 from IEEE Xplore. Restrictions apply.

SHIELDING OF SUBSTATIONS IEEE Std 998-1996
A
Figure 5-2 ÑVolt-time curves for insulator strings
Consider a stroke current Is1 with magnitude greater than Is. Strike distance, determined from Eq 5-1, is S1. Thegeometrical model for this condition is shown in Þgure 5-5. Arcs of protection for stroke current Is1 and for thepreviously discussed Is are both shown. The Þgure shows that the zone of protection provided by the mast for strokecurrent Is1 is greater than the zone of protection provided by the mast for stroke current Is.
Stepped leaders that result in stroke current Is1 and that descend outside of the point where the arc is tangent to theground will strike the ground. Stepped leaders that result in stroke current Is1 and that descend inside the point wherethe arc is tangent to the ground will strike the shield mast, provided all other objects are within the S1 protected zone.Again, the protective zone can be visualized as the surface of a sphere touching the mast. In this case, the sphere hasa radius S1.
5.3.3 Protection against stroke currents less than Is
It has been shown that a shielding system that provides protection at the stroke current level Is provides even betterprotection for larger stroke currents. The remaining scenario to examine is the protection afforded when strokecurrents are less than Is.
Consider a stroke current Iso with magnitude less than Is. The striking distance, determined from Eq 5-1, is So. Thegeometrical model for this condition is shown in Þgure 5-6. Arcs of protection for stroke current Iso and Is are bothshown. The Þgure shows that the zone of protection provided by the mast for stroke current Iso is less than the zone ofprotection provided by the mast for stroke current Is. It is noted that a portion of the equipment protrudes above thedashed arc or zone of protection for stroke current Iso. Stepped leaders that result in stroke current Iso and that descendoutside of the point where the arc is tangent to the ground will strike the ground. However, some stepped leaders that
Copyright © 1996 IEEE All Rights Reserved 35
uthorized licensed use limited to: UNIVERSIDADE DO PORTO. Downloaded on October 13, 2009 at 10:22 from IEEE Xplore. Restrictions apply.

IEEE Std 998-1996 IEEE GUIDE FOR DIRECT LIGHTNING STROKE
A
result in stroke current Iso and that descend inside the point where the arc is tangent to the ground could strike theequipment. This is best shown by observing the plan view of protective zones shown in Þgure 5-6. Stepped leaders forstroke current Iso that descend inside the inner protective zone will strike the mast and protect equipment that is h inheight. Stepped leaders for stroke current Iso that descend in the shaded unprotected zone will strike equipment ofheight h in the area. If, however, the value of Is was selected based on the withstand insulation level of equipment usedin the substation, stroke current Iso should cause no damage to equipment.
Figure 5-3 ÑPrinciple of rolling sphere
5.3.4 Multiple shielding electrodes
The electrogeometric modeling concept of direct stroke protection has been demonstrated for a single shield mast. Atypical substation, however, is much more complex. It may contain several voltage levels and may utilize acombination of shield wires and lightning masts in a three-dimensional arrangement.
The above concept can be applied to multiple shielding masts, horizontal shield wires, or a combination of the two.Figure 5-7 shows this application considering four shield masts in a multiple shield mast arrangement. The arc ofprotection for stroke current Is is shown for each set of masts. The dashed arcs represent those points at which adescending stepped leader for stroke current Is will be attracted to one of the four masts. The protected zone betweenthe masts is deÞned by an arc of radius S with the center at the intersection of the two dashed arcs. The protective zonecan again be visualized as the surface of a sphere with radius S, which is rolled toward a mast until touching the mast,then rolled up and over the mast such that it would be supported by the masts. The dashed lines would be the locus ofthe center of the sphere as it is rolled across the substation surface. Using the concept of rolling sphere of the properradius, the protected area of an entire substation can. be determined. This can be applied to any group of differentheight shield masts, shield wires, or a combination of the two. Figure 5-8 shows an application to a combination ofmasts and shield wires.
36 Copyright © 1996 IEEE All Rights Reserved
uthorized licensed use limited to: UNIVERSIDADE DO PORTO. Downloaded on October 13, 2009 at 10:22 from IEEE Xplore. Restrictions apply.

SHIELDING OF SUBSTATIONS IEEE Std 998-1996
A
Figure 5-4 ÑShield mast protection for stroke current Is
Copyright © 1996 IEEE All Rights Reserved 37
uthorized licensed use limited to: UNIVERSIDADE DO PORTO. Downloaded on October 13, 2009 at 10:22 from IEEE Xplore. Restrictions apply.

IEEE Std 998-1996 IEEE GUIDE FOR DIRECT LIGHTNING STROKE
A
Figure 5-5 ÑShield mast protection for stroke current Is1
38 Copyright © 1996 IEEE All Rights Reserved
uthorized licensed use limited to: UNIVERSIDADE DO PORTO. Downloaded on October 13, 2009 at 10:22 from IEEE Xplore. Restrictions apply.

SHIELDING OF SUBSTATIONS IEEE Std 998-1996
A
Figure 5-6 ÑShield mast protection for stroke current Iso
5.3.5 Changes in voltage level
Protection has been illustrated with the assumption of a single voltage level. Substations, however, have two or morevoltage levels. The rolling sphere method is applied in the same manner in such cases, except that the sphere radiuswould increase or decrease appropriate to the change in voltage at a transformer. (Example calculations for asubstation with two voltage levels are given in annex B.)
5.3.6 Minimum stroke current
The designer will Þnd that shield spacing becomes quite close at voltages of 69 kV and below. It may be appropriateto select some minimum stroke current, perhaps 2 kA for shielding stations below 115 kV. Such an approach isjustiÞed by an examination of Þgures 2-4 and 2-5. It will be found that 99.8% of all strokes will exceed 2 kA.Therefore, this limit will result in very little exposure, but will make the shielding system more economical.
5.4 Application of revised EGM by Mousa and Srivastava method
The rolling sphere method has been used in the preceding subclauses to illustrate application of the EGM. Mousadescribes the application of the revised EGM [B60.] Figure 5-9 depicts two shield wires, Gl, and G2, providingshielding for three conductors, W1, W2, and W3. Sc is the critical striking distance as determined by Eq 5-1A, but
Source: Adapted from [B74]
Copyright © 1996 IEEE All Rights Reserved 39
uthorized licensed use limited to: UNIVERSIDADE DO PORTO. Downloaded on October 13, 2009 at 10:22 from IEEE Xplore. Restrictions apply.

IEEE Std 998-1996 IEEE GUIDE FOR DIRECT LIGHTNING STROKE
A
reduced by 10% to allow for the statistical distribution of strokes so as to preclude any failures. Arcs of radius Sc aredrawn with centers at G1, G2, and W2 to determine if the shield wires are positioned to properly shield the conductors.The factor y is the horizontal separation of the outer conductor and shield wire, and b is the distance of the shield wiresabove the conductors. Figure 5-10 illustrates the shielding provided by four masts. The height hmid at the center of thearea is the point of minimum shielding height for the arrangement. For further details in the application of the method,see [B60].
At least two computer programs have been developed that assist in the design of a shielding system. One of theseprograms [B71] uses the revised EGM to compute the surge impedance, stroke current, and striking distance for agiven arrangement of conductors and shield systems, then advises the user whether or not effective shielding isprovided. Sample calculations are provided in annex B to further illustrate the application.
Figure 5-7 ÑMultiple shield mast protection for stroke current Is
Source: Adapted from [B74]
40 Copyright © 1996 IEEE All Rights Reserved
uthorized licensed use limited to: UNIVERSIDADE DO PORTO. Downloaded on October 13, 2009 at 10:22 from IEEE Xplore. Restrictions apply.
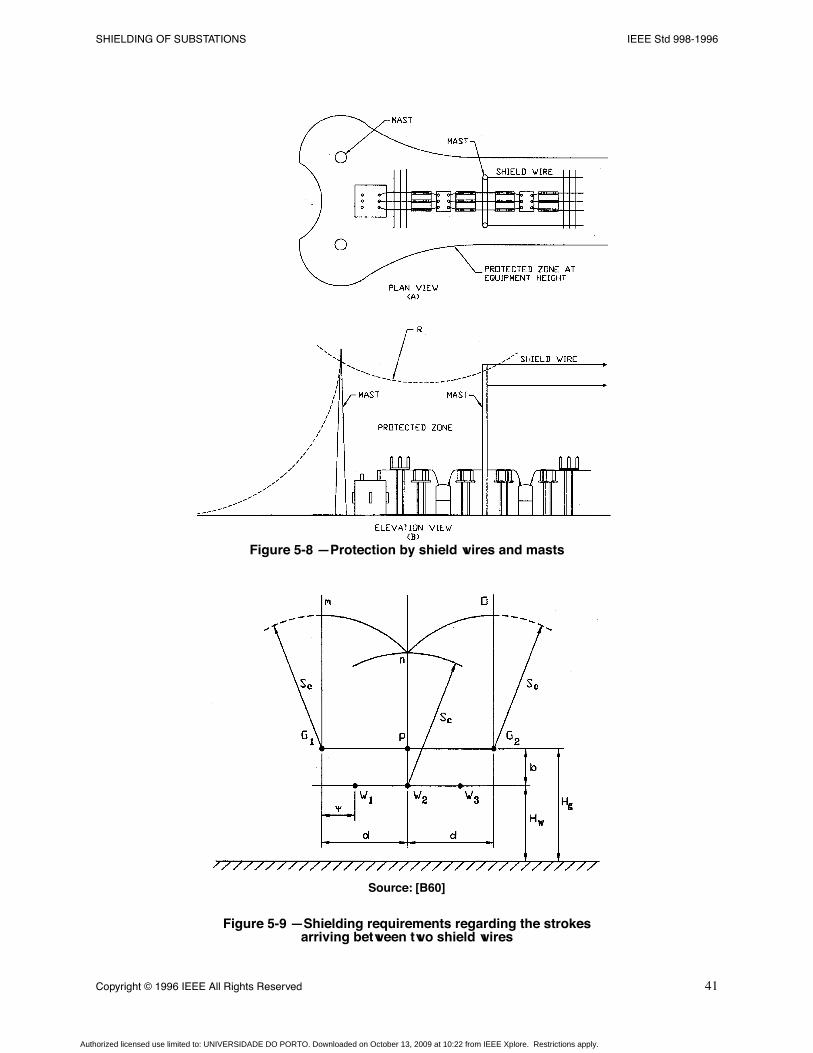
SHIELDING OF SUBSTATIONS IEEE Std 998-1996
A
Figure 5-8 ÑProtection by shield wires and masts
Figure 5-9 ÑShielding requirements regarding the strokes arriving between two shield wires
Source: [B60]
Copyright © 1996 IEEE All Rights Reserved 41
uthorized licensed use limited to: UNIVERSIDADE DO PORTO. Downloaded on October 13, 2009 at 10:22 from IEEE Xplore. Restrictions apply.

IEEE Std 998-1996 IEEE GUIDE FOR DIRECT LIGHTNING STROKE
A
Figure 5-10 ÑShielding of an area bounded by four masts
5.5 Calculation of failure probability
In the revised EGM just presented, striking distance is reduced by a factor of 10% so as to exclude all strokes from theprotected area that could cause damage. In the Empirical design approach of clause 4., on the other hand a small failurerate is permitted Linck [B53] also developed a method to provide partial shielding using statistical methods.
It should be pointed out that for the statistical approach to be valid, the size of the sample needs to be large. For powerlines that extend over large distances, the total exposure: area is large and the above criterion is met It is questionable,therefore, whether the statistical approach is as meaningful for substations that have very small exposure areas bycomparison.
Engineers do, however, design substation shielding that permits a small statistical failure rate. Orrell [B74] hasdeveloped a method of calculating failure rates for the EGM rolling sphere method. This can be found in annexes Dand G.
6. Active lightning terminals
In the preceding methods described in clauses 4. and 5, the lightning terminal is considered to be a passive element thatintercepts the stroke merely by virtue of its position with respect to the live bus or equipment. Suggestions have been
42 Copyright © 1996 IEEE All Rights Reserved
uthorized licensed use limited to: UNIVERSIDADE DO PORTO. Downloaded on October 13, 2009 at 10:22 from IEEE Xplore. Restrictions apply.

SHIELDING OF SUBSTATIONS IEEE Std 998-1996
A
made that lightning protection can be improved by using what may be called active lightning terminals. Three types ofsuch devices have been proposed over the years:
a) Lightning rods with radioactive tips [B36]. These devices are said to extend the attractive range of the tipthrough ionization of the air.
b) Early Streamer Emission (ESM) lightning rods [B11]. These devices contain a triggering mechanism thatsends high-voltage pulses to the tip of the rod whenever charged clouds appear over the site. This process issaid to generate an upward streamer that extends the attractive range of the rod.
c) Lightning prevention devices. These devices enhance the point discharge phenomenon by using an array ofneedles instead of the single tip of the standard lightning rod. It is said that the space charge generated by themany needles of the array neutralize part of the charge in an approaching cloud and prevent a return stroke tothe device, effectively extending the protected area [B18].
Some of the latter devices have been installed on facilities (usually communications towers) that have experiencedsevere lightning problems. The owners of these facilities have reported no further lightning problems in many cases.
There has not been sufÞcient scientiÞc investigation to demonstrate that the above devices are effective, and sincethese systems are proprietary, detailed design information is not available. It is left to the design engineer to determinethe validity of the claimed performance for such systems. It should be noted that IEEE does not recommend or endorsecommercial offerings.
7. Bibliography
[B1] AIEE Committee, ÒA method of estimating lightning performance of transmission lines,Ó AIEE Transactions,vol. 69, pt. 2, pp. 1187Ð1196, 1950.
[B2] Alizade, A. A., Muslimov, M. M., and Khydyrov, E L., ÒStudy of Electric Field Strength Due to Lightning StrokeCurrents,Ó Electric Technology USSR, 1976, no. 4, pp. 51Ð56.
[B3] Anderson, J. G., ÒMonte Carlo computer calculation of transmission-line lightning performance,Ó AIEETransactions, vol. 80, pp. 414Ð420, Aug. 1961.
[B4] Anderson, J. G., Chapter 12 of Transmission Line Reference Book 345 kV and Above, 2nd Ed. Rev. Palo Alto,Calif.: Electric Power Research Institute, 1987.
[B5] Anderson, R. B., and Eriksson, A. J., ÒLightning Parameters for Engineering Application,Ó Electra, no. 69, pp.65Ð102, Mar. 1980.
[B6] Berger, K, ÒNovel Observations on Lightning Discharges: Results of Research on Mount San Salvatore,Ó Journalof the Franklin Institute, vol. 283, no. 6, pp. 478Ð525, June 1967.
[B7] Berger, K., ÒDiscussion of Group 33 on Lightning and Surges,Ó CIGRE Proceedings, vol. 2, pp. 2, 10Ð11, 1968.
[B8] Berger, K, ÒThe Earth Flash,Ó Chapter 5 in Golde, R. H. (Ed.), Lightning, vol. 1, London: Academic Press, 1977.
[B9] Berger, K, and Vogelsanger, E., ÒNew Results of Lightning Observations,Ó CIGRE Paper no. 33Ð03, 11 pages (invol. 2), 1968.
[B10] Berger, K., Anderson, R. B., and Kroninger, H., ÒParameters of Lightning Flashes,Ó ELECTRA, no. 41, pp. 23Ð37, July 1975.
Copyright © 1996 IEEE All Rights Reserved 43
uthorized licensed use limited to: UNIVERSIDADE DO PORTO. Downloaded on October 13, 2009 at 10:22 from IEEE Xplore. Restrictions apply.

IEEE Std 998-1996 IEEE GUIDE FOR DIRECT LIGHTNING STROKE
A
[B11] Berger, G., and Floret, N., ÒCollaboration Produces a New Generation of Lightning Rods,Ó Power TechnologyInternational, pp. 185Ð190, London: Sterling Publications, 1991.
[B12] Bibliography of Publications Pertaining to Lightning Protection, IEEE Transmission Substation Sub-committee, IEEE Transactions on Power Apparatus and Systems, vol. PAS-94, no. 4, pp. 1241Ð1247, July/Aug. 1975.
[B13] Braunstein, A., ÒLightning strokes to power transmission lines and the shielding effect of ground wires,Ó IEEETransactions on Power Apparatus Systems, vol. PAS-89, pp. 1900Ð1910, Nov./Dec. 1970.
[B14] Brook, M., and Ogawa, T, ÒThe Cloud Discharge,Ó Chapter 6 in Golde, R. H. (Ed.), Lightning, vol. 1, London:Academic Press, 1977.
[B15] Brown, G. W., ÒLightning performance IIÑUpdating backflash calculations,Ó IEEE Transactions on PowerApparatus and Systems, vol. PAS-97, no. 1, pp. 39Ð52, 1978.
[B16] Brown, G. W. and Whitehead, E. R., ÒField and analytical studies of transmission line shielding: Part II,Ó IEEETransactions on Power Apparatus and Systems, vol. PAS-88, no. 5, pp. 617Ð626, 1969.
[B17] Burgsdorf, V. V., ÒLightning Protection of Overhead Transmission Lines and Operating Experience in theUSSR,Ó CIGRE Paper 326, 29 pages, 1958.
[B18] Carpenter, R. B., Jr., ÒLightning Elimination.Ó Paper PCI-76-16 given at the 23rd Annual Petroleum andChemical Industry Conference 76CH1109-8-IA.
[B19] Changery, M. J., ÒNational Thunderstorm Frequencies for the Contiguous United States,Ó Report no. NUREG/CR-2252, National Oceanic and Atmospheric Administration, Ashville, NC, Nov. 1981.
[B20] ÒCharge Dissipation Gives, For the First Time, Lightning Prevention.Ó Broadcast Management Engineering,Sept. 1972.
[B21] Cianos, N., Pierce, E. T., ÒA Ground-Lightning Environment for Engineering Usage.Ó Stanford ResearchInstitute, Technical Report 1, Aug. 1972.
[B22] ÒCIGRE Sums up Lightning Research.Ó Electrical World, vol. 194(2), pp. 72Ð75, July 15, 1980.
[B23] Clayton, J. M. and Young, F. S., ÒEstimating lightning performance of transmission lines,Ó IEEE Transactionson Power Apparatus and Systems, vol. PAS-83, pp. 1102Ð1110, 1964.
[B24] Cobine, J. D., ÒGaseous Conductors, Theory and Engineering Application.Ó New York: Dove, 1952.
[B25] Dainwood, W. H. and Kercel, S. W., ÒAn analytical approach to the design of a three-dimensional array ofoverhead shield wires,Ó IEEE Conference Paper no. C75 044-3, 1975.
[B26] Darveniza, M., Popolansky, F., and Whitehead, E. R., ÒLightning Protection of UHV Transmission Lines,ÓElectra, no. 41, pp. 39Ð69, July 1975.
[B27] Eriksson, A. J., ÒLightning and Tall Structures,Ó Trans. South African IEE, vol. 69, no. 8, pp. 238Ð252, Aug.1978. Discussion and Closure published May 1979, vol. 70, no. 5, 12 pages.
[B28] Eriksson, A. J., ÒThe incidence of lightning strikes to power lines,Ó IEEE Transactions on Power Delivery, vol.PWRD-2, no. 3, pp. 859Ð870, 1987.
[B29] Eriksson, A.J., ÒAn improved electrogeometric model for transmission line shielding analysis,Ó IEEETransactions on Power Delivery, vol. PWRD-2, no,3, pp. 871Ð886.
[B30] Fink, D. B., Beaty H.W., Standard Handbook for Electrical Engineers, 11th ed. New York: McGraw-Hill,1978.
44 Copyright © 1996 IEEE All Rights Reserved
uthorized licensed use limited to: UNIVERSIDADE DO PORTO. Downloaded on October 13, 2009 at 10:22 from IEEE Xplore. Restrictions apply.

SHIELDING OF SUBSTATIONS IEEE Std 998-1996
A
[B31] Fujitaka, S., Tomiyama, J., Hirose, Y., and Issiki, T., ÒInvestigation on Lightning Protection for Electric PowerSystem in Japan,Ó CIGRE Paper no. 323, 1958, 21 pages.
[B32] Giffard, W. F. and Owens, J.J., ÒOptimizing Substation Shielding,Ó Presented at Sixth Annual Transmission andSubstation Design and Operating Symposium, University of Texas at Arlington, Sept. 1973.
[B33] Gilman D. W. and Whitehead, E. R., ÒThe Mechanism of Lightning Flashover on High Voltage and Extra-HighVoltage Transmission Lines,Ó Electra, no. 27, pp. 65Ð96, Mar. 1973.
[B34] Golde, R. H., ÒThe Validity of Lightning Tests with Scale Models,Ó Journal IEE vol. 88, pt. 2, no. 2, pp. 67Ð68,1941.
[B35] Golde, R. H., ÒThe Frequency of Occurrence and the Distribution of Lightning Flashes to Transmission Lines.ÓAIEE Transactions, vol. 64, pp. 902Ð910, 982Ð984, 1945.
[B36] Golde, R.H., ÒRadio-ActiveÓ Lightning Conductors, Lightning Protection, London: Edward Arnold PublishingCo., pp. 37Ð40, 196Ð197, 1973.
[B37] Golde, R. H., ÒLightning Protection of Tall Structures, Review of Lightning, Protection Technology for TallStructures, Office of Naval Research, Arlington, Virginia, Publication no. AD-A075 449, pp. 243Ð249 of Hughes, J.(Ed.), 1977.
[B38] Golde, R. H., ÒLightning Conductor,Ó Chapter 17 in Golde, R. H. (Ed.), Lightning, vol. 2, Academic Press:London, 1977.
[B39] Gorin, B. N., Levitov, V. I., and Shkilev, A. V., ÒLightning Strokes on Ostankino TV Tower in Moscow,ÓElectric Technology USSR, no. 3, pp. 45Ð55, 1977.
[B40] Heary, K. P. et al., ÒAn experimental study of ionizing air terminal performance,Ó IEEE Transactions on PowerDelivery, vol. PWRD-4, no. 2, pp. 1175Ð1184, 1989.
[B41] Hepworth, J. K., Klewe, R. C., Lobley, E. H., and Tozer, B. A., ÒThe effect of A.C. bias fields on the impulsestrength of point-plane and sphere-plane gaps,Ó IEEE Transactions on Power Apparatus and Systems, vol. PAS-92,no. 6, pp. 1898Ð1903, 1973. Discussion by Freser, K.
[B42] Horvath, Tibor, Computation of Lightning Protection, Taunton, Somerset, England: Research Studies PressLtd, pp. 22, 23, 76, 77, 92, 93, 144Ð147, 1991.
[B43] IEEE Working Group, ÒGuide for application of insulators to withstand switching surges,Ó IEEE Transactionson Power Apparatus and Systems, vol. PAS-94, no. 1, pp. 58Ð67, 1975.
[B44] IEEE Std 100-1992 The New IEEE Standard Dictionary of Electrical and Electronics Terms (ANSI).
[B45] IEEE Std C62.22-1991 IEEE Guide for the Application of Metal-Oxide Surge Arresters for Alternating-CurrentSystems (ANSI).
[B46] IEEE Working Group, ÒA simplified method for estimating lightning performance of transmission lines,Ó IEEETransactions on Power Apparatus and Systems, vol. PAS-104, no. 4, pp. 919Ð932, 1985.CAUTION CAUTIONCAUTION CAUTION NEW BIB "46a" IEEE Working Group, ÒEstimating lightning performance of transmissionlines IIÑUpdates to analytic models,Ó IEEE Transactions on Power Delivery, vol. 8, No. 3, pp. 1254Ð1267, July1993.
[B47] IEEE Std 4-1995 IEEE Standard Techniques for High-Voltage Testing (ANSI).
[B48] Lee R. H., ÒProtect Your Plant Against Lightning,Ó Instruments and Control Systems, vol. 55, no. 2, pp. 31Ð34,Feb. 1982.
Copyright © 1996 IEEE All Rights Reserved 45
uthorized licensed use limited to: UNIVERSIDADE DO PORTO. Downloaded on October 13, 2009 at 10:22 from IEEE Xplore. Restrictions apply.

IEEE Std 998-1996 IEEE GUIDE FOR DIRECT LIGHTNING STROKE
A
[B49] Lee, R. H., ÒLightning Protection of Buildings.Ó IEEE Transactions on Industry Applications, vol. IA-15, no. 3,pp. 236Ð240, May/June 1979.
[B50] Lee, R. H., ÒProtection zone for buildings against lightning strokes using transmission line protection practice.ÓIEEE Transactions on Industry Applications, vol. 1A-14, no. 6, pp. 465Ð470, 1978.
[B51] ÒLightning protection in multi-line stations,Ó IEEE Committee Report, IEEE Transactions on Power Apparatusand Systems, vol. PAS-87, no. 6, pp. 1514Ð1521, June 1968.
[B52] Linck, H., ÒDiscussion of the frequency distribution of current magnitudes of lightning strokes to tallstructures,Ó IEEE Transactions on Power Apparatus and Systems, vol. PAS-91, no. 5, pp. 2228Ð2229, 1972.
[B53] Linck, H., ÒShielding of modern substations against direct lightning strokes,Ó IEEE Transactions on PowerApparatus and Systems, vol. PAS-90, no. 5, pp. 1674Ð1679, Sept./Oct. 1975.
[B54] MacGorman, D. R., et al., ÒLightning Strike Density for the Contiguous United States from ThunderstormDuration Record,Ó Report no. NUREG/CR-3759, National Oceanic and Atmospheric Administration, Norman, OK,May 1984.
[B55] MacGorman, D. R., and Rust, W. D., ÓAn Evaluation of the LLP and LPATS Lightning Ground Strike MappingSystems,Ó pp. 235Ð240 of Addendum of Proceedings of International Aerospace and Ground Conference onLightning and Static Electricity, Oklahoma City, OK, Apr. 1988.
[B56] McEachron, K. B, ÒLightning to the Empire State Building,Ó Journal of the Franklin Institute, vol. 227, no. 2,pp. 149Ð217, Feb. 1939.
[B57] Melander, B. G, ÒAtmospheric Electricity Threat Definition for Aircraft Lightning Protection,Ó Proceedings ofInternational Aerospace and Ground Conference on Lightning and Static Electricity, Forth Worth, TX, Paper no. 36,1983, 37 pages.
[B58] Melander, B. G., ÒEffects of Tower Characteristics on Lightning Arc Measurements,Ó Proceedings ofInternational Aerospace and Ground Conference on Lightning and Static Electricity, Orlando, FL, Paper no. 34, 1984,12 pages.
[B59] Moore, C. B. and Vonnegut, B., ÒThe Thundercloud,Ó Chapter 3 in Golde, R. H. (Ed.), Lightning, vol. 1,London: Academic Press, 1977.
[B60] Mousa, A.M., ÒShielding of high-voltage and extra-high-voltage substations,Ó IEEE Transactions on PowerApparatus and Systems, vol. PAS-95, no. 4, pp. 1303Ð1310, 1976.
[B61] Mousa, A. M., ÒEffect of height of structure on the striking distance of a downward lightning flash,ÓProceedings of International Communications and Energy Conference, Montreal, Quebec, IEEE Publication no.84CH20412, pp. 9Ð14, Oct. 1984.
[B62] Mousa, A. M, ÒDiscussion of a simplified method for estimating lightning performance of transmission lines,ÓIEEE Transactions on Power Apparatus and Systems, vol. PAS- 104, no. 4, p. 930, 1985.
[B63] Mousa, A.M., ÒA Study of the Engineering Model of Lightning Strokes and its Application to UnshieldedTransmission Lines,Ó Ph.D. Thesis, University of British Columbia, Vancouver, Canada, Aug. 1986.
[B64] Mousa, A.M., and Srivastava, K. D, ÒDiscussion of an improved electrogeometric model for transmission lineshielding analysis,Ó IEEE Transactions on Power Delivery, vol. PWRD-2, no. 3, pp. 880Ð881, 1987.
[B65] Mousa, A.M., and Srivastava, K. D., ÒDiscussion of the East Coast lightning detection network,Ó IEEETransactions on Power Delivery, vol. PWRD-2, no. 3, pp. 904Ð905, 1987.
46 Copyright © 1996 IEEE All Rights Reserved
uthorized licensed use limited to: UNIVERSIDADE DO PORTO. Downloaded on October 13, 2009 at 10:22 from IEEE Xplore. Restrictions apply.

SHIELDING OF SUBSTATIONS IEEE Std 998-1996
A
[B66] Mousa, A.M., and Srivastava, K. D, ÒShielding Tall Structures Against Direct Lightning Strokes,Ó Proceedingsof Canadian Conference on Electrical and Computer Engineering, Vancouver, British Columbia, ISSN 0840-7789,pp. 28Ð33, Nov. 1988.
[B67] Mousa, A.M., and Srivastava, K. D., ÒA Revised Electrogeometric Model for the Termination of LightningStrokes on Ground Objects,Ó Proceedings of International Aerospace and Ground Conference on Lightning and StaticElectricity, Oklahoma City, OK, pp. 342Ð352, Apr. 1988.
[B68] Mousa, A.M., and Srivastava, K. D., ÒEffect of shielding by trees on the frequency of lightning strokes to powerlines,Ó IEEE Transactions on Power Delivery, vol. 3, no. 2, pp. 724Ð732, 1988.
[B69] Mousa, A.M., and Srivastava, K. D., ÒThe lightning performance of unshielded steel-structure transmissionlines,Ó IEEE Transactions on Power Delivery vol 4, no. 1, pp. 4.37Ð445, 1989.
[B70] Mousa, A.M., and Srivastava, K. D., ÒThe implications of the electrogeometric model regarding effect of heightof structure on the median amplitudes of collected lightning strokes,Ó IEEE Transactions on Power Delivery, vol. 4,no. 2, pp. 1450Ð1460, 1989.
[B71] Mousa, A.M., ÒA computer program for designing the lightning shielding systems of substations,Ó IEEETransactions on Power Delivery, vol. 6, no. 1, pp. 143Ð152, 1991.
[B72] Mousa, A.M., and Wehling, R. J., ÒA survey of industry practices regarding shielding of substations againstdirect lightning strokes,Ó IEEE Transactions on Power Delivery, vol. 8, no. 1, pp. 38Ð47, 1993 (reproduced inannex E).
[B73] Muller-Hillebrand, D., ÒOn the Frequency of Lightning Flashes to High Objects, A Study on the Gulf ofBothnia,Ó Tellus, vol. 12, no. 4, pp. 444Ð449, 1960.
[B74] Orrell, J. T., ÒDirect Stroke Lightning Protection,Ó Paper Presented at EEI Electrical System and EquipmentCommittee Meeting, Washington, D.C., 1988 (reproduced in annex G).
[B75] Orville, R., and Songster, H., ÒThe East Coast lightning detection network,Ó IEEE Transactions on PowerDelivery, vol. PWRD-2, no. 3, pp. 899ndash;907, 1987.
[B76] Paris, 1., and Cortina, R., ÒSwitching and lightning impulse discharge characteristics of large air gaps and longinsulator strings,Ó IEEE Transactions on Power Apparatus and Systems, vol. PAS-87, no. 4, pp. 947Ð957, 1968.
[B77] Paris, L., Taschini, A., Schneider, K. H., and Weck, K. H., ÒPhase-to-Ground and Phase-to-Phase AirClearances in Substations,Ó Electra, no. 29, pp. 29Ð44, July 1973.
[B78] Peek, F. W., Jr., Dielectric Phenomena in High Voltage Engineering. New York: McGraw-Hill, 1929.
[B79] Popolansky, F., ÒMeasurement of Lightning Currents in Czechoslovakia and the Application of ObtainedParameters in the Prediction of Lightning Outages of EHV Transmission Lines,Ó CIGRE Paper no. 33-03, 1970, 12pages.
[B80] Powell, K. B., ÒChart Simplifies Shielding Low Profile Substations,Ó Electrical World, pp. 36Ð37, Apr. 1977.
[B81] Prentice, S. A., ÒCIGRE Lightning Flash Counter,Ó Electra, no. 22, pp. 149Ð171, May 1972.
[B82] Prentice, S. A., ÒFrequency of Lightning Discharges,Ó Chapter 14 in Golde, R. H. (Ed.), Lightning, vol. 1,London: Academic Press, 1977.
[B83] ÒPresent Practice Regarding Direct Stroke Shielding in the Lightning Protection of Stations and Substations,ÓAIEE Subcommittee on Lightning Protective Devices, AIEE Conference Paper, Jan. 1953.
Copyright © 1996 IEEE All Rights Reserved 47
uthorized licensed use limited to: UNIVERSIDADE DO PORTO. Downloaded on October 13, 2009 at 10:22 from IEEE Xplore. Restrictions apply.

IEEE Std 998-1996 IEEE GUIDE FOR DIRECT LIGHTNING STROKE
A
[B84] Sargent, M. A, ÒThe frequency distribution of current magnitudes of lightning strokes to tall structures,Ó IEEETransactions on Power Apparatus and Systems, vol. PAS-91, no. 5, pp. 2224Ð2229, 1972.
[B85] Sargent, M. A., ÒMonte Carlo simulation of the lightning performance of overhead shielding networks of highvoltage stations,Ó IEEE Transactions on Power Apparatus and Systems, vol. PAS-91, no. 4, pp. 1651Ð1656, 1972.
[B86] Schonland, B. F. J., and Malan, D. J., ÒUpward Stepped Leaders from the Empire State Building,Ó Journal of theFranklin Institute, vol. 258, no. 4, pp. 271Ð275, Oct. 1954.
[B87] Snyder, Robert E., ÒNew Protection System May Eliminate Lightning Damage,Ó World Oil., Jan. 1973.
[B88] Sorensen, R. W., and McMaster, R. C., ÒThe influence of towers and conductor sag on transmission lineshielding,Ó AIEE Transactions, vol. 61, pp. 159Ð165, 448Ð450, 1942.
[B89] Suzuki, T, Miyake, K., and Shindo, T, ÒDischarge path model in model test of lightning strokes to tall mast,ÓIEEE Transactions on Power Apparatus and Systems, vol. PAS- 100, no. 7, pp. 3553Ð3562, 1981.
[B90] Uman, M. A., Lightning, Chapter 1. New York: McGraw-Hill, 13 pages, 1969.
[B91] Uman, M. A., Mclain, D. K., Fisher.. R. J., and Krider, E. P., ÒCurrents in Florida Lightning Return Strokes,ÓJournal Geophysical Research, vol. 78, no. 18, pp. 3530Ð3537, 1973.
[B92] Vendall, G. R., and Petrie A. G., ÒThe Frequency of Thunderstorm Days in Canada,Ó Meteorological Division,Department of Transportation, Ottawa, Canada, 1962.
[B93] Wagner, C. E, McCann, G. D. and MacLane, G. L., ÒShielding of Transmission Lines,Ó AIEE Transactions, vol.60, pp. 313Ð328, 612Ð614, 1941.
[B94] Wagner C.F., McCann, G. D., Lear, C. M., ÒShielding of Substations,Ó AIEE Transactions, vol. 61, pp. 96Ð100,313,448, Feb. 1942.
[B95] Wagner, C. F., Electrical Transmission and Distribution Reference Book, 4th ed. Westinghouse Electric Corp,pp. 542Ð577, 1964.
[B96] Wagner, C.F., McCann, G. D., and Beck, Edward, ÒField investigations of lightning.Ó AIEE Transactions, vol.60, pp. 1222Ð1230, 1941.
[B97] Whitehead, E. R., ÒMechanism of Lightning Flashover.Ó EEI Research Project RP 50, Illinois Institute ofTechnology, Pub 72-900, Feb. 1971.
[B98] Whitehead, E. R., ÒCIGRE Survey of the Lightning Performance of Extra-High-Voltage Transmission Lines,ÓElectra, no. 33, pp. 63Ð89, Mar. 1974.
[B99] Whitehead, E. R., ÒProtection of Transmission Lines,Ó Chapter 22 (49 pages) of Golde, R. H. (Ed.), Lightning,vol. 2, London: Academic Press, 1977.
[B100] World Distribution of Thunderstorm Days, Part II, World Meteorological Organization, Geneva, Switzerland,1956.
[B101] Young, E S., Clayton, J. M., and Hileman, A. R., ÒShielding of transmission lines,Ó IEEE Transactions onPower Apparatus and Systems, vol. S82, pp. 132Ð154, 1963.
48 Copyright © 1996 IEEE All Rights Reserved
uthorized licensed use limited to: UNIVERSIDADE DO PORTO. Downloaded on October 13, 2009 at 10:22 from IEEE Xplore. Restrictions apply.

SHIELDING OF SUBSTATIONS IEEE Std 998-1996
A
Annex A Empirical shielding curves(Informative)
The following pages contain empirical shielding curves referenced in the guide.
Figure A.1 ÑProtection of an exposed object by a single lightning mast
Copyright © 1996 IEEE All Rights Reserved 49
uthorized licensed use limited to: UNIVERSIDADE DO PORTO. Downloaded on October 13, 2009 at 10:22 from IEEE Xplore. Restrictions apply.

IEEE Std 998-1996 IEEE GUIDE FOR DIRECT LIGHTNING STROKE
A
Figure A.2 ÑProtection of a ring of exposed objects by a single lightning mast
50 Copyright © 1996 IEEE All Rights Reserved
uthorized licensed use limited to: UNIVERSIDADE DO PORTO. Downloaded on October 13, 2009 at 10:22 from IEEE Xplore. Restrictions apply.

SHIELDING OF SUBSTATIONS IEEE Std 998-1996
A
Figure A.3 ÑProtection of an exposed object by two lightning masts
Figure A.4 ÑProtection of an exposed object by two lightning masts
Copyright © 1996 IEEE All Rights Reserved 51
uthorized licensed use limited to: UNIVERSIDADE DO PORTO. Downloaded on October 13, 2009 at 10:22 from IEEE Xplore. Restrictions apply.

IEEE Std 998-1996 IEEE GUIDE FOR DIRECT LIGHTNING STROKE
A
Figure A.5 ÑProtection of exposed horizontal conductors by a single shield wire
Figure A.6 ÑProtection of exposed horizontal conductors by two shield wires
52 Copyright © 1996 IEEE All Rights Reserved
uthorized licensed use limited to: UNIVERSIDADE DO PORTO. Downloaded on October 13, 2009 at 10:22 from IEEE Xplore. Restrictions apply.

SHIELDING OF SUBSTATIONS IEEE Std 998-1996
A
Annex B Sample calculations(Informative)
B.1 Introduction
This annex will illustrate the application of lightning shielding to actual substations. The methods presented in theguide will be illustrated for two substations, a 69 kV station and a kV to 230 kV step-down station. The 69 kVsubstation will be assumed to be single voltage station with the secondary bus in a protected enclosure. The 500/230kV station will illustrate how to handle multiple voltage levels when using the electrogeometric model.
Clause B.2 Illustrates the use of the Þxed angle for the two stations. Clause B.3 illustrates the use of empirical curves(WagnerÕs method). Clause B.4 illustrates the application of the electrogeometric theory by a computer program, andclause B.5 illustrates the application of the electrogeometric theory by the rolling sphere method. Data on bus heights,diameters, and basic impulse design levels are given in tables B.1-1 and B.1-2 in order to allow the user to follow thecalculations. The layouts of the substations to be protected are given in Þg Þgures B.1-1 and B.1-2. Following samplecalculations is a discussion comparing the results of the methods.
Table B.1-1 ÑData for 69 kV substation
Table B.1-2 ÑData for 500/230 kV substation
Electrical data Bus data Height, ft (m) Diameter in (mm)
Nom. volt., 69 kV Bus A: 14 (4.27) 4.5 (114.30)
Bus BIL, 350 kV Bus B: 19 (5.79) 4.5 (114.30)
Equip. BIL, 350 kV Bus C: 33 (10.06) 1.0 (25.40)
Electrical data
500 kV section 230 kV section
Nom. volt. 500 kV Nom. volt. 230 kV
Bus BIL 1800 kV Bus BIL 900 kV
Equip. BIL 1800 kV Equip. BIL 900 kV
Ph-Gnd C1 15 ft (4572 mm) Ph-Gnd Cl.5.92 ft (1803 mm)
Bus data
500 kV section 230 kV section
Bus Ht. ft (m) Dia., in. (mm) Bus Ht. ft (m) Dia., in. (mm)
A 5.5 (16.76) 4.5 (114.30) A 28 (8.53) 5.5 (135.00)
B 30 (9.14) 4.5 (114.30) B 20 (6.10) 5.5 (135.00)
C 39 (11.89) 5.5 (135.00)
Copyright © 1996 IEEE All Rights Reserved 53
uthorized licensed use limited to: UNIVERSIDADE DO PORTO. Downloaded on October 13, 2009 at 10:22 from IEEE Xplore. Restrictions apply.

IEEE Std 998-1996 IEEE GUIDE FOR DIRECT LIGHTNING STROKE
A
Figure B.1-1 ÑTypical 69 kV substation layout for sample calculations
To ensure comparability of the results of the different shielding design methods, the following criteria were adopted:
a) Maximum height of mast or shield wire support point = 100 ft (30.48 m)b) Maximum span of shield wires = 600 ft (182.9 m)c) No more than four shield wires are to be connected to a support structure
B.2 Fixed angle method
B.2.1 Application to 69 kV substation
a) Assume a mast height and location in Þgure B.2-1.
b) Determine coverage at different bus or equipment heights using 60° and 45° protective angles for theprotective masts and deadend structures. Table B.2-1(b) gives the coverage (protected area) at bus height Afor each mast height.
54 Copyright © 1996 IEEE All Rights Reserved
uthorized licensed use limited to: UNIVERSIDADE DO PORTO. Downloaded on October 13, 2009 at 10:22 from IEEE Xplore. Restrictions apply.

SHIELDING OF SUBSTATIONS IEEE Std 998-1996
A
c) Draw arcs of coverage for buses on plan view of station as shown in Þgure B.2-3.
NOTE Ñ 60° angle can only be used if two arcs overlap. Otherwise, the 45° angle coverage must be used.
d) Increase mast heights, relocate masts, and/or add masts as required to obtain complete coverage.
NOTE Ñ The solution for this example remains the same whether masts are being used alone or with shield wires, i.e., no shieldwires are necessary.
Figure B.1-2 ÑTypical 500/230 kV substation layout for sample calculations
Figure B.2-1 ÑShielding angle for single mast
Copyright © 1996 IEEE All Rights Reserved 55
uthorized licensed use limited to: UNIVERSIDADE DO PORTO. Downloaded on October 13, 2009 at 10:22 from IEEE Xplore. Restrictions apply.

IEEE Std 998-1996 IEEE GUIDE FOR DIRECT LIGHTNING STROKE
A
Figure B.2-2 ÑCoverage at height A, two masts
Table B.2-1(a) ÑCoverage at height A (ft)
Table B.2-1(b) ÑCoverage at height A (m)
Ht. (ft) Coverage X (ft)
Bus or equip.
75 ft mast 50 ft twr. 40 ft twr.
60° Ð 45° Ð 60° Ð 45° Ð 60° Ð 45° Ð
33.0 72.7 42 29.4 17 12.1 7
19 97 56 53.7 31 36.4 21
14 105.7 61 62.4 36 45 26
Ht. (m) Coverage X (m)
Bus or equip.22.9 m mast 15.2 m twr. 12.2 m twr.
60° Ð 45° Ð 60° Ð 45° Ð 60° Ð 45° Ð
10.1 22.2 12.8 9.0 5.2 3.7 2.1
5.8 29.6 17.1 16.4 9.4 11.1 6.4
4.3 32.2 18.6 19.0 11.0 13.7 7.9
56 Copyright © 1996 IEEE All Rights Reserved
uthorized licensed use limited to: UNIVERSIDADE DO PORTO. Downloaded on October 13, 2009 at 10:22 from IEEE Xplore. Restrictions apply.

SHIELDING OF SUBSTATIONS IEEE Std 998-1996
A
Figure B.2-3 ÑShielding substation with masts using fixed angle method
B.2.2 Fixed angle methodÑ500/230 kV substation
Applying the same method as used in the previous clause for the 69 kV substation produces the results, shown inÞgures B.2-4 through B.2-7(b). A shield angle of 45/60 degrees was used for the 230 kV section, and an angle of45/45 degrees was used for the 500 kV section.
Copyright © 1996 IEEE All Rights Reserved 57
uthorized licensed use limited to: UNIVERSIDADE DO PORTO. Downloaded on October 13, 2009 at 10:22 from IEEE Xplore. Restrictions apply.

IEEE Std 998-1996 IEEE GUIDE FOR DIRECT LIGHTNING STROKE
A
Figure B.2-4 ÑShielding a 230 kV substation with masts using fixed angle method
58 Copyright © 1996 IEEE All Rights Reserved
uthorized licensed use limited to: UNIVERSIDADE DO PORTO. Downloaded on October 13, 2009 at 10:22 from IEEE Xplore. Restrictions apply.

SHIELDING OF SUBSTATIONS IEEE Std 998-1996
A
Figure B.2-5(a) ÑShielding a 500 kV substation with masts using fixed angle method
Copyright © 1996 IEEE All Rights Reserved 59
uthorized licensed use limited to: UNIVERSIDADE DO PORTO. Downloaded on October 13, 2009 at 10:22 from IEEE Xplore. Restrictions apply.

IEEE Std 998-1996 IEEE GUIDE FOR DIRECT LIGHTNING STROKE
A
Figure B.2-5(b) ÑShielding a 500 kV substation with masts using fixed angle method
60 Copyright © 1996 IEEE All Rights Reserved
uthorized licensed use limited to: UNIVERSIDADE DO PORTO. Downloaded on October 13, 2009 at 10:22 from IEEE Xplore. Restrictions apply.

SHIELDING OF SUBSTATIONS IEEE Std 998-1996
A
Figure B.2-6 ÑShielding a 230 kV substation with shield wires using fixed angle method
Copyright © 1996 IEEE All Rights Reserved 61
uthorized licensed use limited to: UNIVERSIDADE DO PORTO. Downloaded on October 13, 2009 at 10:22 from IEEE Xplore. Restrictions apply.

IEEE Std 998-1996 IEEE GUIDE FOR DIRECT LIGHTNING STROKE
A
Figure B.2-7(a) ÑShielding a 500 kV substation with shield wires using fixed angle method
62 Copyright © 1996 IEEE All Rights Reserved
uthorized licensed use limited to: UNIVERSIDADE DO PORTO. Downloaded on October 13, 2009 at 10:22 from IEEE Xplore. Restrictions apply.

SHIELDING OF SUBSTATIONS IEEE Std 998-1996
A
Figure B.2-7(b) ÑShielding a 500 kV substation with shield wires using fixed angle method
B.3 Empirical methodÑApplication design procedure
B.3.1 Application to 69 kV substation
a) Determine bus and/or equipment heights to be shielded from Þgure B.1-1.
e.g., 69 kV switch = 33 ft (10.1 m)
69 kV bus = 19 ft (5.8 m)
b) Determine existing mast and/or shield wire heights from Þgure B.1-1.
e.g., 69 kV deadend structure = 50 ft (15.2 m)
Free-standing mast = 58 ft (17.7 m)
Copyright © 1996 IEEE All Rights Reserved 63
uthorized licensed use limited to: UNIVERSIDADE DO PORTO. Downloaded on October 13, 2009 at 10:22 from IEEE Xplore. Restrictions apply.

IEEE Std 998-1996 IEEE GUIDE FOR DIRECT LIGHTNING STROKE
A
NOTE Ñ It can be seen from Þgure B.3-2 (derived from Þgure 4-3) that for d = 19 ft (using the d = 20 ft curve), themaximum effective mast height for a single point object is estimated to be y + d = h or 39 ft + 19 ft = 58 ft(17.7 m). The designer should not extrapolate beyond the limits of the empirical data. Alternatively, for a ringof objects at a speciÞed height of 19 ft, the maximum effective mast height would be 79 ft (24.1 m)(determined using Þgure 4-5). This apparent contradiction can be attributed to the original paperÕs hypothesisthat the probability of a stroke to any one object in the ring of objects is less than the probability of a stroke toone protected point. A conservative approach would be to shield a ring of protected objects as a singleprotected point.
c) Using the empirical data, determine the coverage provided by the masts and/or shield wires for the speciÞedheights.
To shield the 33 ft high bus in Þgure B.1-1 with the two 50 ft deadend structure masts separated by 24 ft, enterÞgure B.3-3 (derived from Þgure 4-7) using a y value of 17 ft (h - d = 50 - 33). Move horizontally to a valuefor d = 33 ft by interpolating. Project vertically to determine the maximum value for s = 140 ft (42.7 m) (seeÞgure B.3-1.) Next enter Þgure B.3-2 with value of y = 17 ft (h - d = 50 - 33). Move horizontally to a valuefor d = 33 ft by interpolating. Project vertically to determine the maximum radius x = 16 ft (4.9 m).
To shield the 19 ft high bus with a 58 ft mast (or masts), enter Þgure B.3-2 using a value of y = 39 ft (h - d =58 - 19). Move horizontally to a value for d = 19 ft by interpolating. Project vertically to determine themaximum radius x = 58 ft (17.7 m). Should multiple 58 ft masts be required, enter Þgure B.3-3 (derived fromÞgure 4-7) using a value of y = 39 ft (h - d = 58 - 19). Move horizontally to a value for d = 19 ft byinterpolating. Project vertically to determine the maximum value for s = 249 ft (75.9 m) (see Þgure B.3-1).
Figure B.3-1 ÑArea protected by two masts
d) Plot shielded areas on the substation plan as in Þgure B.3-4 to determine if shielding is adequate, or ifadditional masts and/or shield wires are required. The two 50 ft (15.2 m) structure masts separated at 24 ft(7.3 m) are clearly adequate for the 33 ft (10 m) high bus, and a single 58 ft (17.7 m) mast is adequate for the19 ft (5.8 m) high bus.
64 Copyright © 1996 IEEE All Rights Reserved
uthorized licensed use limited to: UNIVERSIDADE DO PORTO. Downloaded on October 13, 2009 at 10:22 from IEEE Xplore. Restrictions apply.

SHIELDING OF SUBSTATIONS IEEE Std 998-1996
A
Figure B.3-2 ÑSingle lightning mast protecting single object Ñ 0.1% exposure. Height of mast above protected object, y, as a function of horizontal separation, x, and height of protected object, d
B.3.2 Empirical methodÑ500/230 kV substation
a) Determine bus and/or equipment heights to be shielded.b) Determine existing mast and/or shield wire heights.c) Using the empirical data, determine the coverage provided by the masts and/or shield wires for the speciÞed
heights.
B.3.2.1 Example of protection by mast
To shield the 55 ft (16.8 m) high bus with 100 ft (30.5 m) masts, enter Þgure B.3-5 (derived from Þgure 4-7) using a yvalue of 45 ft (h - d = 100 - 55). Move horizontally to a value for d = 55 ft by interpolating. Project vertically todetermine the maximum value for s = 338 ft (103 m). Next enter Þgure B.3-6 with value of y = 45 ft (h - d = 100 - 55).Move horizontally to a value for d = 55 ft by interpolating. Project vertically to determine the maximum radius x = 54ft (16.5 m). Thus two 100 ft (30.5 m) masts separated by no more than 338 ft (103 m) will provide protection for anarea as described in Þgure 4-15, and a single mast will protect an area about. the mast with a 54 ft (16.5 m) radius at a55 ft (16.8 m) bus height.
To shield the 28 ft (8.5 m) high bus with 60 ft (18.3 m) masts, enter Þgure B.3-5 using a y value of 32 ft (h - d = 60 -28). Move horizontally to a value for d = 28 ft by interpolating. Project vertically to determine the maximum value fors = 225 ft (68.6 m). Next enter Þgure B.3-6 with value of y = 32 ft (h - d = 60 - 28).
Copyright © 1996 IEEE All Rights Reserved 65
uthorized licensed use limited to: UNIVERSIDADE DO PORTO. Downloaded on October 13, 2009 at 10:22 from IEEE Xplore. Restrictions apply.

IEEE Std 998-1996 IEEE GUIDE FOR DIRECT LIGHTNING STROKE
A
Figure B.3-3 ÑTwo lightning masts protecting single object, no overlapÑ0.1% exposure. Height of mast above protected object, y, as a function of horizontal separation, a, and height of protected object, d
Move horizontally to a value for d = 28 ft by interpolating. Project vertically to determine the maximum radius x =44 ft (13.4 m).
As described in 3.4.1 and shown in Þgures 4-15 and 4-16, the maximum values for mast separation S should bereduced to provide constant exposure design (0.1%) to the area between the masts. For this example, reduce themaximum S by half. The value of S for the 55 ft (16.8 m) bus would be approximately 170 ft (51.8 m), and for the 28 ft(8.5 m) bus S would be approximately 113 ft (34.4 m). The resulting layout using these mast separations for shieldingis shown in Þgures B.3-7 and B.3-8(b).
B.3.2.2 Example of mast and shield wire
First, determine the maximum effective shield wire height. In Þgure B.3-9, sketch in (by interpolation) a line torepresent a 55 ft (16.8 m) bus height. Select the highest integer value of y on this line without leaving the right-handboundary of the Þgure (y = 23 ft). Therefore, the maximum effective height of the shield wires is 55 + 23 = 78 ft(23.8 m). A higher shield wire height is not selected because the designer would be extrapolating beyond the availabledata in Þgure B.3-9.
66 Copyright © 1996 IEEE All Rights Reserved
uthorized licensed use limited to: UNIVERSIDADE DO PORTO. Downloaded on October 13, 2009 at 10:22 from IEEE Xplore. Restrictions apply.

SHIELDING OF SUBSTATIONS IEEE Std 998-1996
A
Figure B.3-4 ÑShielding substation with masts using empirical method
To shield the 55 ft (16.8 m) high bus with 78 ft (23.8 m) high shield wire, enter Þgure B.3-9 (derived from Þgure 4-13)using a y value of 23 ft (h - d = 78 - 55). Move horizontally to a value for d = 55 ft by interpolating. Project verticallyto determine the maximum value for s = 157 ft (47.9 m). Next enter Þgure B.3-10 with value of y equals; 23 ft (h - dequals; 78- 55). Move horizontally to a value for d = 55 ft by interpolating. Project vertically to determine themaximum x = 15 ft (4.6 m). Thus, two shield wires elevated 23 ft (7 m) above the bus may be separated by no morethan 157 ft (47.9 m) to provide protection for the 55 ft (16.8 m)bus. Asingle wire at the same elevation may be offsethorizontally by no more than 15 ft (4.6 m) from the outer conductors.
To shield the 28 ft (8.5 m) high bus with 78 ft (23.8 m) high shield wire, enter Þgure B.3-10 with value of y = 50 ft(h - d = 78 - 28). Move horizontally to a value for d = 28 ft by interpolating. Project vertically to determine themaximum x = 52 ft (15.8 m). An inspection of Þgure B.3-9 reveals that an attempt to enter the curve at y = 50 ft fallsoff the curve, but it is evident that the shield wires may be separated by at least 160 ft (48.8 m). Place masts andshield wires to obtain complete coverage. The resulting layout using shield wires for shielding is shown in ÞguresB.3-11 and B.3-12(b).
Copyright © 1996 IEEE All Rights Reserved 67
uthorized licensed use limited to: UNIVERSIDADE DO PORTO. Downloaded on October 13, 2009 at 10:22 from IEEE Xplore. Restrictions apply.

A
IEEE Std 998-1996 IEEE GUIDE FOR DIRECT LIGHTNING STROKE
Figure B.3-5 ÑTwo lightning masts protecting single object, no overlapÑ0.1% exposure.Height of mast above protected object, y, as a function of horizontal separation, a, and height of protected object, d
Figure B.3-6 ÑSingle lightning mast protecting single objectÑ0.1%exposure. Height of mast above protected object, y,as a function of horizontal separation, x, and height of protected object, d
68 Copyright © 1996 IEEE All Rights Reserved
uthorized licensed use limited to: UNIVERSIDADE DO PORTO. Downloaded on October 13, 2009 at 10:22 from IEEE Xplore. Restrictions apply.

SHIELDING OF SUBSTATIONS IEEE Std 998-1996
A
Figure B.3-7 ÑShielding a 230 kV substation with masts using empirical method
Copyright © 1996 IEEE All Rights Reserved 69
uthorized licensed use limited to: UNIVERSIDADE DO PORTO. Downloaded on October 13, 2009 at 10:22 from IEEE Xplore. Restrictions apply.

IEEE Std 998-1996 IEEE GUIDE FOR DIRECT LIGHTNING STROKE
A
Figure B.3-8(a) ÑShielding a 500 kV substation with masts using empirical method
70 Copyright © 1996 IEEE All Rights Reserved
uthorized licensed use limited to: UNIVERSIDADE DO PORTO. Downloaded on October 13, 2009 at 10:22 from IEEE Xplore. Restrictions apply.

SHIELDING OF SUBSTATIONS IEEE Std 998-1996
A
Figure B.3-8(b) ÑShielding a 500 kV substation with masts using empirical method
Copyright © 1996 IEEE All Rights Reserved 71
uthorized licensed use limited to: UNIVERSIDADE DO PORTO. Downloaded on October 13, 2009 at 10:22 from IEEE Xplore. Restrictions apply.

IEEE Std 998-1996 IEEE GUIDE FOR DIRECT LIGHTNING STROKE
A
Figure B.3-9 ÑTwo shield wires protecting horizontal conductorsÑ0.1% exposure. Height of shield wires above conductors, y, as a function of
horizontal separation, s, and height of protected conductors, d
Figure B.3-10 ÑSingle shield wire protecting horizontal conductorsÑ0.1% exposure. Height of shield wires above conductors, y, as a function of
horizontal separation, x, and height of protected conductors, d
72 Copyright © 1996 IEEE All Rights Reserved
uthorized licensed use limited to: UNIVERSIDADE DO PORTO. Downloaded on October 13, 2009 at 10:22 from IEEE Xplore. Restrictions apply.

SHIELDING OF SUBSTATIONS IEEE Std 998-1996
A
Figure B.3-11 ÑShielding a 230 kV substation with shield wires using empirical method
Copyright © 1996 IEEE All Rights Reserved 73
uthorized licensed use limited to: UNIVERSIDADE DO PORTO. Downloaded on October 13, 2009 at 10:22 from IEEE Xplore. Restrictions apply.

IEEE Std 998-1996 IEEE GUIDE FOR DIRECT LIGHTNING STROKE
A
Figure B.3-12(a) ÑShielding a 500 kV substation with shield wires using empirical method
74 Copyright © 1996 IEEE All Rights Reserved
uthorized licensed use limited to: UNIVERSIDADE DO PORTO. Downloaded on October 13, 2009 at 10:22 from IEEE Xplore. Restrictions apply.

SHIELDING OF SUBSTATIONS IEEE Std 998-1996
A
Figure B.3-12(b) ÑShielding a 500 kV substation with shield wires using empirical method
B.4 EGM computer program SBSHLD
B.4.1 Application design procedure for 69 kV example
a) Program SBSHLD (pronounced ÒsubshieldÓ) applies to both shield wires and masts. For the case of masts, itbasically deals with a module consisting of four masts forming a rectangle. However, it can also analyze othermast arrangements (e.g., case of three masts forming a triangle or case of four masts forming a generalquadrangle) by adapting the input data. Hence the Þrst step is to choose the mast locations so that they dividethe area into reasonably uniform shapes. The selected locations are shown in Þgure B.4-1. These divide theprotected area into two squares: abed and bcfe plus two identical general quadrangles abhg and bcqp. Aseparate computer run is needed for each of these two conÞgurations.
Copyright © 1996 IEEE All Rights Reserved 75
uthorized licensed use limited to: UNIVERSIDADE DO PORTO. Downloaded on October 13, 2009 at 10:22 from IEEE Xplore. Restrictions apply.

IEEE Std 998-1996 IEEE GUIDE FOR DIRECT LIGHTNING STROKE
A
b) Next, select mast heights. Considering that the height of the shield wires to the left of points g, h, p, and q is12.2 m (40 ft), adding 3 m (10 ft) spikes gives 15.24 m (50 ft) high masts. As a starting point, we will assumethat the self-supporting masts at points a, b, c, d, e, and f are also 15.24 m (50 ft) high.
c) For the module abed, the four masts are self-supporting and they form a 15.24 m ´ 15.24 m (50 ft ´ 50 ft)square. Bus heights within this module are 5.79 m (19 ft) and 4.27 m (14 ft), and the diameter of the bus is114.3 mm (4 in nominal size). The BIL is 350 kV. Entering the above data in program SBSHLD gives theoutput shown in Exhibit B.4-1. This shows that the 15.24 m (50 ft) masts provide effective shielding but italso shows that a reduction in mast height for this module down to 11.05 m (36.2 ft) is possible.
d) For the module abhg, two of the four masts are not self-supporting and the diagonal ah of the quadrangle isshorter than the side ab. According to the rules for irregular conÞgurations given in the manual of SBSHLD,this module is equivalent to a rectangle having dimensions of 15.24 m and zero. The bus heights within thismodule are 10.06 m (33 ft) and 4.27 m (14 ft). The higher level bus uses a ßexible wire of unspeciÞeddiameter and a 25.4 mm (1.0 in) value has been assumed. Exhibit B.4-2 gives the computer output for thiscase. This shows that adequate shielding is provided. It also shows that masts 13.02 m (42.7 ft) high wouldalso be adequate for this case.
e) The minimum mast height 13 m (42.7 ft) needed for module abhg exceeds 12.2 m (40 ft) Hence use of15.24 m (50 ft) high masts at points a, b, c, g, h, p, and q is a good choice. On the other hand, the minimummast height 11 m (36.2 ft) needed for module abed is less than 12.2 m (40 ft). Hence a reduction in mastheight at points d, e, and f is in order. This gives a four mast module consisting of two 15.24 m (50 ft) highmasts plus two 12.2 m (40 ft) high masts. According to the rules for irregular conÞgurations given in themanual of SBSHLD, this can be analyzed as four 12.2 m (40 ft) high masts. The computer printout for thiscase is given in Exhibit B.4-3 and it shows that effective shielding is provided.
76 Copyright © 1996 IEEE All Rights Reserved
uthorized licensed use limited to: UNIVERSIDADE DO PORTO. Downloaded on October 13, 2009 at 10:22 from IEEE Xplore. Restrictions apply.

SHIELDING OF SUBSTATIONS IEEE Std 998-1996
A
Figure B.4-1 ÑDesign of mast shielding system using program SBSHLD
Copyright © 1996 IEEE All Rights Reserved 77
uthorized licensed use limited to: UNIVERSIDADE DO PORTO. Downloaded on October 13, 2009 at 10:22 from IEEE Xplore. Restrictions apply.

IEEE Std 998-1996 IEEE GUIDE FOR DIRECT LIGHTNING STROKE
A
Exhibit B.4-1 ÑOutput of program SBSHLD for module abed; mast height equals 50 ft
78 Copyright © 1996 IEEE All Rights Reserved
uthorized licensed use limited to: UNIVERSIDADE DO PORTO. Downloaded on October 13, 2009 at 10:22 from IEEE Xplore. Restrictions apply.

SHIELDING OF SUBSTATIONS IEEE Std 998-1996
A
Exhibit B.4-2 ÑOutput of program SBSHLD for module abhg
Copyright © 1996 IEEE All Rights Reserved 79
uthorized licensed use limited to: UNIVERSIDADE DO PORTO. Downloaded on October 13, 2009 at 10:22 from IEEE Xplore. Restrictions apply.

IEEE Std 998-1996 IEEE GUIDE FOR DIRECT LIGHTNING STROKE
A
Exhibit B.4-3 ÑOutput of program SBSHLD for module abed; mast height equals 40 ft
80 Copyright © 1996 IEEE All Rights Reserved
uthorized licensed use limited to: UNIVERSIDADE DO PORTO. Downloaded on October 13, 2009 at 10:22 from IEEE Xplore. Restrictions apply.

SHIELDING OF SUBSTATIONS IEEE Std 998-1996
A
B.4.2 Sample calculations for a 500/230 kV switchyard
The data used in this case are those of the McIntosh 500/230 kV Substation of Georgia Power Company. This exampleillustrates the design procedure when more than one voltage level is present in a switchyard. Figures B.4-2 and B.4-3give the plans of the 500 kV and 230 kV switchyards, respectively. The thick lines show the Þrst phase of thedevelopment, while the thin lines indicate future expansion.
Figure B.4.2(a) ÑPlan of the McIntosh 500 kV switchyard
Copyright © 1996 IEEE All Rights Reserved 81
uthorized licensed use limited to: UNIVERSIDADE DO PORTO. Downloaded on October 13, 2009 at 10:22 from IEEE Xplore. Restrictions apply.

IEEE Std 998-1996 IEEE GUIDE FOR DIRECT LIGHTNING STROKE
A
Figure B.4-2(b) ÑPlan of the McIntosh 500 kV switchyard
82 Copyright © 1996 IEEE All Rights Reserved
uthorized licensed use limited to: UNIVERSIDADE DO PORTO. Downloaded on October 13, 2009 at 10:22 from IEEE Xplore. Restrictions apply.

SHIELDING OF SUBSTATIONS IEEE Std 998-1996
A
Figure B.4-3 ÑPlan of McIntosh 230 kV switchyard
B.4.2.1 The 500 kV switchyardÑShield wire option
It is preferable that the design of the shielding system takes the ultimate development of the station into consideration.Examining Þgure B.4-2(b) reveals that the system is approximately symmetrical around line AB. Hence one of theshield wires will be built along that line. A preliminary computer run using the given bus data revealed that a 45.7 m(150 ft) separation between adjacent shield wires would be reasonable. This determines the locations of two moreshield wires, one on each side of line AB (see Þgure B.4-4(b)). To limit the span of the shield wires to 282.9 m (600 ft)or less, intermediate points of support (B, C, and D) will be used. The location of line EF on the right-hand-side wasselected taking the details of the layout of the equipment into consideration. The locations of structures Q, A, and Pwere similarly determined. Note that structure A could have been eliminated if both attachment points K and L wereavailable. In that case, two wires BK and BL would have been used instead of wire BA.
Copyright © 1996 IEEE All Rights Reserved 83
uthorized licensed use limited to: UNIVERSIDADE DO PORTO. Downloaded on October 13, 2009 at 10:22 from IEEE Xplore. Restrictions apply.

IEEE Std 998-1996 IEEE GUIDE FOR DIRECT LIGHTNING STROKE
A
Figure B.4-4(a) ÑShielding of the Mcintosh 500 kV switchyard using shield wires
84 Copyright © 1996 IEEE All Rights Reserved
uthorized licensed use limited to: UNIVERSIDADE DO PORTO. Downloaded on October 13, 2009 at 10:22 from IEEE Xplore. Restrictions apply.

SHIELDING OF SUBSTATIONS IEEE Std 998-1996
A
Figure B.4-4(b) ÑShielding of the McIntosh 500 kV switchyard shield wires
Four rather than three support points were used on line EF to accommodate the need to decrease the separationbetween adjacent shield wires on the 230 kV side. The resulting 30.48 m (100 ft) separation was found to be suitablefor the 230 kV side based on a preliminary computer run using the parameters of the 230 kV bus.
Shielding the bus below line PF requires a shield wire system that is approximately perpendicular to the above system.Points M and N are already available for attaching shield wires. Point D was selected taking into consideration theshielding requirement of the future bus to the left of line MD. Point J was determined by the need to provide thenecessary electrical clearance.
The points supporting the shield wires of the incoming 500 kV lines (points K and M for example) are 30 m (98.5 ft)high. Hence a 30.48 m (100 ft) height was selected. for the shield wire support points within the 500 kV switchyard(including the points E, G, H, and F). Using a maximum bus height of 16.8 m (55 ft), it was determined from Subshield
Copyright © 1996 IEEE All Rights Reserved 85
uthorized licensed use limited to: UNIVERSIDADE DO PORTO. Downloaded on October 13, 2009 at 10:22 from IEEE Xplore. Restrictions apply.

IEEE Std 998-1996 IEEE GUIDE FOR DIRECT LIGHTNING STROKE
A
that the 30.48 m (100 ft) high structures were adequate (see Exhibit B.4-4). For strokes arriving outside the shield wiresystem, shielding is adequate for points located outside the shield wire system by up to 3.2 m (10.5 ft). The 500 kV busconnection to the transformer is outside the protected zone. The bus layout at that point was done without regard to theshielding requirements, but it appears that it can be easily modiÞed to achieve compatibility.
B.4.2.2 The 230 kV switchyardÑShield wire option
Figure B.4-5 shows the proposed shield wire system. This takes the future development of the station intoconsideration but prebuilds only the shield wires needed for the initial bus development. The points supporting theshield wires of the incoming 230 kV lines are 18.3 m (60 ft) high. Hence this value was also selected for the 230 kVswitchyard. The plan in Þgure B.4-5 involves only three additional structures beyond those needed for the 500 kV side:
a) A 18.3 m (60 ft) high support structure at point Zb) Prebuilding the 18.3 m (60 ft) high station structures at points X and W
The maximum separation between adjacent shield wires in Þgure B.4-5 is 32.6 m (107 ft). The computer run ExhibitB.4-5 indicates that a 8.5 m (28 ft) high bus is adequately protected. Note that a short section of the bus near points Hand F is 11.9 m (39 ft) high. The computer run Exhibit B.4-6 shows that the is 11.9 m (39 ft) high bus is adequatelyprotected against strokes arriving between the shield wires. Shielding, however, is not provided for strokes arrivingoutside the shield wire system. It appears that this problem can be solved by revising the layout of the 230 kVconnection to the 500/230 kV transformer near point F.
B.4.2.3 The mast option
The mast heights were taken equal to 30.48 m (100 ft) and 18.3 m (60 ft) for the 500 kV and 230 kV switchyards,respectively. These are the same values used for the shield wire support points. In the 500 kV switchyard, theadopted approach was to replace each of the shield wires selected earlier by a row of masts. In the direction CD inÞgure B.4-2(b), the separation is Þxed by the width of the bay, which is 45.7 m (150 ft). In direction AB, thecomputer run Exhibit B.4-7 indicates that a maximum separation of about 33.5 m (110 ft) would be reasonable. Thecorresponding radial distance between the masts at opposite corners of the rectangle is 56.7 m (186 ft). This is thelimiting distance in locating the masts in the transformer area where it was not possible to use rectangular shapes.Figure B.4-6(b) gives the mast arrangement for the 500 kV switchyard.
Regarding the 230 kV switchyard, distance OY in Þgure B.4-7 is 25.8 m (84.5 ft). In the perpendicular direction XY,a value equal to 29.3 m (96 ft), which is twice the bay width, was selected. Exhibit B.4-8 gives the associated computerprintout. The corresponding radial distance between masts at opposite corners of the rectangle is 39 m (128 ft). Thisvalue was used as the criterion at other points of the 230 kV switchyard where rectangular shapes could not be used.Figure B.4-7 shows the proposed layout. This has a maximum radial separation between masts equal to about 33.5 m(110 ft).
86 Copyright © 1996 IEEE All Rights Reserved
uthorized licensed use limited to: UNIVERSIDADE DO PORTO. Downloaded on October 13, 2009 at 10:22 from IEEE Xplore. Restrictions apply.

SHIELDING OF SUBSTATIONS IEEE Std 998-1996
A
Exhibit B.4-4 ÑOutput of SBSHLD for the 500 kV switchyard; case of shield wires
Copyright © 1996 IEEE All Rights Reserved 87
uthorized licensed use limited to: UNIVERSIDADE DO PORTO. Downloaded on October 13, 2009 at 10:22 from IEEE Xplore. Restrictions apply.

IEEE Std 998-1996 IEEE GUIDE FOR DIRECT LIGHTNING STROKE
A
Figure B.4-5 ÑShielding of the Mcintosh 230 kV switchyard using shield wires
88 Copyright © 1996 IEEE All Rights Reserved
uthorized licensed use limited to: UNIVERSIDADE DO PORTO. Downloaded on October 13, 2009 at 10:22 from IEEE Xplore. Restrictions apply.

SHIELDING OF SUBSTATIONS IEEE Std 998-1996
A
Exhibit B.4-5 ÑOutput of SBSHLD for the 28 ft (8.5 m) high 230 kV bus; case of shield wires
Copyright © 1996 IEEE All Rights Reserved 89
uthorized licensed use limited to: UNIVERSIDADE DO PORTO. Downloaded on October 13, 2009 at 10:22 from IEEE Xplore. Restrictions apply.

IEEE Std 998-1996 IEEE GUIDE FOR DIRECT LIGHTNING STROKE
A
Exhibit B.4-6 ÑOutput of SBSHLD for the 39 ft (11.9 m) high bus; case of shield wires
90 Copyright © 1996 IEEE All Rights Reserved
uthorized licensed use limited to: UNIVERSIDADE DO PORTO. Downloaded on October 13, 2009 at 10:22 from IEEE Xplore. Restrictions apply.

SHIELDING OF SUBSTATIONS IEEE Std 998-1996
A
Exhibit B.4-7 ÑOutput of SBSHLD for the 500 kV switchyard; case of masts
Copyright © 1996 IEEE All Rights Reserved 91
uthorized licensed use limited to: UNIVERSIDADE DO PORTO. Downloaded on October 13, 2009 at 10:22 from IEEE Xplore. Restrictions apply.

IEEE Std 998-1996 IEEE GUIDE FOR DIRECT LIGHTNING STROKE
A
Figure B.4-6(a) ÑShielding of the 500 kV switchyard using masts
92 Copyright © 1996 IEEE All Rights Reserved
uthorized licensed use limited to: UNIVERSIDADE DO PORTO. Downloaded on October 13, 2009 at 10:22 from IEEE Xplore. Restrictions apply.

SHIELDING OF SUBSTATIONS IEEE Std 998-1996
A
Figure B.4-6(b) ÑShielding of the 500 kV switchyard using masts
Copyright © 1996 IEEE All Rights Reserved 93
uthorized licensed use limited to: UNIVERSIDADE DO PORTO. Downloaded on October 13, 2009 at 10:22 from IEEE Xplore. Restrictions apply.

IEEE Std 998-1996 IEEE GUIDE FOR DIRECT LIGHTNING STROKE
A
Exhibit B.4-8 ÑOutput of SBSHLD for the 230 kV switchyard; case of masts
94 Copyright © 1996 IEEE All Rights Reserved
uthorized licensed use limited to: UNIVERSIDADE DO PORTO. Downloaded on October 13, 2009 at 10:22 from IEEE Xplore. Restrictions apply.

SHIELDING OF SUBSTATIONS IEEE Std 998-1996
A
Figure B.4-7 ÑShielding of the 230 kV switchyard using masts
B.5 Electrogeometric modelÑRolling sphere method
B.5.1 Application design procedure for masts
Application of the electrogeometric theory by the rolling sphere method involves rolling an imaginary sphere of radiusS over substation lightning terminals such as lightning masts, shield wires, and metal support structures as describedin 5.3 of the guide. Therefore, to apply the method to the example substations requires the computation of the radiusS, and this will Þrst require the calculation of Zs, the surge impedance, and Is, the allowable stroke current for thevarious buses within the substation.
Annex C gives a method of calculating surge impedance under corona. Corona radius can be taken from Þgure C. 1 orcalculated from Eq C.1 or C.2. The engineer who designs protection systems on a regular basis may want to write asimple PC program to perform these calculations. Once the corona radius is determined, it is an easy matter tocalculate the surge impedance from Eq C.7. The surge impedance will be required for each bus of a different heightand conductor type.
Copyright © 1996 IEEE All Rights Reserved 95
uthorized licensed use limited to: UNIVERSIDADE DO PORTO. Downloaded on October 13, 2009 at 10:22 from IEEE Xplore. Restrictions apply.

IEEE Std 998-1996 IEEE GUIDE FOR DIRECT LIGHTNING STROKE
A
Next, the designer will calculate the allowable stroke current from Eq 5-2A using the above values. The strikingdistance then can be calculated from Eq 5-1A. In the examples, k = 1.2 has been used for the mast example, and k = 1has been used for the shield wire example. For a combination of masts and wires, the designer can use k = 1, which willgive a conservative result. (Subclause 5.3.1 of this standard states that the usual practice is to assume that the strikingdistance to a mast, a shield wire or the ground is the same, which would infer the use of only one k-value. The examplecalculations demonstrate that a different k can be used for masts resulting in a more economical design.)
The designer is now ready to roll the imaginary sphere over the example substation. If the sphere remains above theequipment and busses to be protected as in Þgure 5-3, the design is satisfactory. If the equipment touches or enters thesphere as in Þgure 5-6, the equipment is not protected and the design must be revised.
The designer can determine if some areas of the station are protected by simply striking arcs on a scale drawing of thesubstation. Further calculation is necessary, however, to determine the maximum separation of wires and masts toprevent the sphere from sinking between them and touching the equipment to be protected. The following examplesillustrate how to calculate these quantities.
B.5.2 Nomenclature used in the calculations
The nomenclature listed below are used in the following calculations:
For calculations when using masts:
S Sphere radiusH Mast height (calculations use an assumed height; designer should pick a mast height suitable for the
design)A Bus heightW & C Horizontal distance from origin of sphere (OOS) to busT Maximum separation from mast to bus for protectionY Minimum phase to steel clearanceZ Horizontal distance between OOS and line drawn between two mastsL Half the separation between two mastsX Maximum separation between two mastsD Elevation difference between mast and busE Elevation difference between mast and OOSJ Horizontal distance between OOS and mastK Diagonal distance between masts when four masts support the sphereP Distance between masts when four masts support the sphereQ Distance between masts when three masts support the sphere
For calculations using shield wires:
S Sphere radiusH Wire height (calculations use assumed heights; designer should pick mast height suitable for his/her
design)A Bus heightL Half the separation between two wiresX Maximum separation between two wiresD Elevation difference between wire and busE Elevation difference between wire and OOSR Horizontal distance between OOS and wireT Horizontal distance between OOS and busC Horizontal distance between shield wire and bus
96 Copyright © 1996 IEEE All Rights Reserved
uthorized licensed use limited to: UNIVERSIDADE DO PORTO. Downloaded on October 13, 2009 at 10:22 from IEEE Xplore. Restrictions apply.

SHIELDING OF SUBSTATIONS IEEE Std 998-1996
A
B.5.3 The 69 kV switchyardÑMast option
A design using lightning masts for protection will be considered Þrst. The procedure for masts is as follows:
a) Calculate the surge impedance, Zs (see annex C).
b) Calculate the critical stroke current, Is from Eq 5-2A.
c) Calculate the striking distance, S (which will become the sphere radius) from Eq 5-1B.
d) Calculate T as shown by the calculations that follow. T is the maximum horizontal distance from the mast thatan object at a height, A, is protected from a direct stroke. A circle with radius, T, is the area of protectionafforded by a single mast for an object at height, A.
e) Calculate X, the maximum separation of two masts to prevent a side stroke. (It may help to visualize a sphereresting on the ground that is then rolled over to just touch the two masts. The bus is arranged so that it also justtouches the surface of the sphere. By studying the various views of the Þgure, it can be seen that thisdetermines the maximum separation to prevent side strokes.)
f) Calculate P, the maximum separation of masts to prevent a vertical stroke.
g) Calculate Q, the maximum separation of three masts to prevent a vertical stroke.
h) With this information masts can be spotted in the substation; arcs can be drawn around them and adjustmentscan be made for an optimal layout.
The resulting layout is found in Þgure B.5-1.
Figure B.5-1 ÑMast protection for 69 kV substation
Copyright © 1996 IEEE All Rights Reserved 97
uthorized licensed use limited to: UNIVERSIDADE DO PORTO. Downloaded on October 13, 2009 at 10:22 from IEEE Xplore. Restrictions apply.

IEEE Std 998-1996 IEEE GUIDE FOR DIRECT LIGHTNING STROKE
A
Figure B.5-1 ÑMast protection for 69 kV substation (Continued)
98 Copyright © 1996 IEEE All Rights Reserved
uthorized licensed use limited to: UNIVERSIDADE DO PORTO. Downloaded on October 13, 2009 at 10:22 from IEEE Xplore. Restrictions apply.

SHIELDING OF SUBSTATIONS IEEE Std 998-1996
A
Exhibit B.5-1 ÑCalculations for mast protection of 69 kV substation
Copyright © 1996 IEEE All Rights Reserved 99
uthorized licensed use limited to: UNIVERSIDADE DO PORTO. Downloaded on October 13, 2009 at 10:22 from IEEE Xplore. Restrictions apply.

IEEE Std 998-1996 IEEE GUIDE FOR DIRECT LIGHTNING STROKE
A
Exhibit B.5-1 ÑCalculations for mast protection of 69 kV substation (Continued)
100 Copyright © 1996 IEEE All Rights Reserved
uthorized licensed use limited to: UNIVERSIDADE DO PORTO. Downloaded on October 13, 2009 at 10:22 from IEEE Xplore. Restrictions apply.

SHIELDING OF SUBSTATIONS IEEE Std 998-1996
A
Exhibit B.5-1 ÑCalculations for mast protection of 69 kV substation (Continued)
Copyright © 1996 IEEE All Rights Reserved 101
uthorized licensed use limited to: UNIVERSIDADE DO PORTO. Downloaded on October 13, 2009 at 10:22 from IEEE Xplore. Restrictions apply.

IEEE Std 998-1996 IEEE GUIDE FOR DIRECT LIGHTNING STROKE
A
Exhibit B.5-1 ÑCalculations for mast protection of 69 kV substation (Continued)
B.5.4 The 69 kV switchyardÑShield wire option
The procedure for designing a shield wire system follows a similar routine. For parallel wires, only two calculationsare required; the horizontal distance, C, to prevent side strokes and the distance, X, the maximum separation to preventvertical strokes.
The calculation results are shown in Exhibit B.5-2. The 14 ft bus (or the transformer that is at the same height) mayextend 13 ft beyond the shield wire and still be protected from side stroke Since the transformer does not extendbeyond the shield wire it is protected. The high bus may extend 9 ft beyond the shield wire and be protected. Since itextends only 6 ft beyond, it is protected.
Calculations are also included for a. 60 ft shield wire height. Notice that the values for C are slightly less than for a40 ft wire height. This illustrates that a 60 ft wire height would give less protection from side stroke. A study of SectionÒB-BÓ of Þgure B.5-2 will show why this is true.
The calculations for maximum shield wire separation for the 14 ft bus yield a value of 86 ft. Since the actual separationis 84 ft, the bus is protected. A maximum separation of 80 ft is permitted for the 19 ft bus and it is protected since theseparation is 79 ft This set of shield wires actually protects the low bus as well and the other set is needed only for sidestroke protection. The incoming line conductors are fully shielded by the existing shield wires. This completes theprotection of the substation.
The resulting layout is found in Þgure B.5-2.
102 Copyright © 1996 IEEE All Rights Reserved
uthorized licensed use limited to: UNIVERSIDADE DO PORTO. Downloaded on October 13, 2009 at 10:22 from IEEE Xplore. Restrictions apply.

SHIELDING OF SUBSTATIONS IEEE Std 998-1996
A
Exhibit B.5-2 ÑCalculations for shield wire protection of 69 kV substation
Copyright © 1996 IEEE All Rights Reserved 103
uthorized licensed use limited to: UNIVERSIDADE DO PORTO. Downloaded on October 13, 2009 at 10:22 from IEEE Xplore. Restrictions apply.

IEEE Std 998-1996 IEEE GUIDE FOR DIRECT LIGHTNING STROKE
A
Exhibit B.5-2 ÑCalculations for shield wire protection of 69 kV substation (Continued)
104 Copyright © 1996 IEEE All Rights Reserved
uthorized licensed use limited to: UNIVERSIDADE DO PORTO. Downloaded on October 13, 2009 at 10:22 from IEEE Xplore. Restrictions apply.

SHIELDING OF SUBSTATIONS IEEE Std 998-1996
A
Exhibit B.5-2 ÑCalculations for shield wire protection of 69 kV substation (Continued)
Copyright © 1996 IEEE All Rights Reserved 105
uthorized licensed use limited to: UNIVERSIDADE DO PORTO. Downloaded on October 13, 2009 at 10:22 from IEEE Xplore. Restrictions apply.

IEEE Std 998-1996 IEEE GUIDE FOR DIRECT LIGHTNING STROKE
A
Figure B.5-2 ÑShield wire protection for 69 kV substation
Figure B.5-2 ÑShield wire protection for 69 kV substation (Continued)
106 Copyright © 1996 IEEE All Rights Reserved
uthorized licensed use limited to: UNIVERSIDADE DO PORTO. Downloaded on October 13, 2009 at 10:22 from IEEE Xplore. Restrictions apply.

SHIELDING OF SUBSTATIONS IEEE Std 998-1996
A
Figure B.5-2 ÑShield wire protection for 69 kV substation (Continued)
B.5.5 The 500/230 kV switchyardÑDealing with multiple voltages
The procedure of applying the rolling sphere method when there are multiple voltages in a substation is quite simple,as illustrated by the Mcintosh substation. The designer simply makes a separate calculation for each voltage level inthe station using the appropriate BIL and surge impedance. At the voltage interface (usually the transformer) thedesigner should ensure that the lower voltage equipment is protected by using the appropriate lower striking distance.If low voltage busses are present, it may be appropriate to use a minimum stoke current of 2 kA for the designcalculations in these areas (see 5.3.6).
The procedure for the 500 kV portion of the switchyard and for the 230 kV portion taken separately follow the sameroutine as has been previously discussed for the 69 kV example. Calculations for mast placement in the 500 kV portionof the station are found in Exhibit B.5-3 and calculations for the 230 kV portion are found in Exhibit B.5-4. Theresulting layout is shown in Þgure B.5-3(b). Likewise, calculations for shield wires are found in Exhibits B.5-5 andB.5-6 and the resulting layout is shown in Þgure B.5-4.
Copyright © 1996 IEEE All Rights Reserved 107
uthorized licensed use limited to: UNIVERSIDADE DO PORTO. Downloaded on October 13, 2009 at 10:22 from IEEE Xplore. Restrictions apply.

IEEE Std 998-1996 IEEE GUIDE FOR DIRECT LIGHTNING STROKE
A
Exhibit B.5-3 ÑCalculations for mast protection of 500 kV substation
108 Copyright © 1996 IEEE All Rights Reserved
uthorized licensed use limited to: UNIVERSIDADE DO PORTO. Downloaded on October 13, 2009 at 10:22 from IEEE Xplore. Restrictions apply.

SHIELDING OF SUBSTATIONS IEEE Std 998-1996
A
Exhibit B.5-3 ÑCalculations for mast protection of 500 kV substation (Continued)
Copyright © 1996 IEEE All Rights Reserved 109
uthorized licensed use limited to: UNIVERSIDADE DO PORTO. Downloaded on October 13, 2009 at 10:22 from IEEE Xplore. Restrictions apply.

IEEE Std 998-1996 IEEE GUIDE FOR DIRECT LIGHTNING STROKE
A
Exhibit B.5-3 ÑCalculations for mast protection of 500 kV substation (Continued)
110 Copyright © 1996 IEEE All Rights Reserved
uthorized licensed use limited to: UNIVERSIDADE DO PORTO. Downloaded on October 13, 2009 at 10:22 from IEEE Xplore. Restrictions apply.

SHIELDING OF SUBSTATIONS IEEE Std 998-1996
A
Exhibit B.5-3 ÑCalculations for mast protection of 500 kV substation (Continued)
Copyright © 1996 IEEE All Rights Reserved 111
uthorized licensed use limited to: UNIVERSIDADE DO PORTO. Downloaded on October 13, 2009 at 10:22 from IEEE Xplore. Restrictions apply.

IEEE Std 998-1996 IEEE GUIDE FOR DIRECT LIGHTNING STROKE
A
Exhibit B.5-4 ÑCalculations for mast protection of 230 kV substation
112 Copyright © 1996 IEEE All Rights Reserved
uthorized licensed use limited to: UNIVERSIDADE DO PORTO. Downloaded on October 13, 2009 at 10:22 from IEEE Xplore. Restrictions apply.

SHIELDING OF SUBSTATIONS IEEE Std 998-1996
A
Exhibit B.5-4 ÑCalculations for mast protection of 230 kV substation (Continued)
Copyright © 1996 IEEE All Rights Reserved 113
uthorized licensed use limited to: UNIVERSIDADE DO PORTO. Downloaded on October 13, 2009 at 10:22 from IEEE Xplore. Restrictions apply.

IEEE Std 998-1996 IEEE GUIDE FOR DIRECT LIGHTNING STROKE
A
Exhibit B.5-4 ÑCalculations for mast protection of 230 kV substation (Continued)
114 Copyright © 1996 IEEE All Rights Reserved
uthorized licensed use limited to: UNIVERSIDADE DO PORTO. Downloaded on October 13, 2009 at 10:22 from IEEE Xplore. Restrictions apply.

SHIELDING OF SUBSTATIONS IEEE Std 998-1996
A
Exhibit B.5-4 ÑCalculations for mast protection of 230 kV substation (Continued)
Copyright © 1996 IEEE All Rights Reserved 115
uthorized licensed use limited to: UNIVERSIDADE DO PORTO. Downloaded on October 13, 2009 at 10:22 from IEEE Xplore. Restrictions apply.

IEEE Std 998-1996 IEEE GUIDE FOR DIRECT LIGHTNING STROKE
A
Fig
ure
B.5
-3(a
) Ñ
Sh
ield
ing
a 5
00/2
30 k
V s
ub
stat
ion
wit
h m
asts
usi
ng
th
e ro
llin
g s
ph
ere
met
ho
d
116 Copyright © 1996 IEEE All Rights Reserved
uthorized licensed use limited to: UNIVERSIDADE DO PORTO. Downloaded on October 13, 2009 at 10:22 from IEEE Xplore. Restrictions apply.

SHIELDING OF SUBSTATIONS IEEE Std 998-1996
A
Fig
ure
B.5
-3(b
) Ñ
Sh
ield
ing
a 5
00/2
30 k
V s
ub
stat
ion
wit
h m
asts
usi
ng
th
e ro
llin
g s
ph
ere
met
ho
d (
Co
nti
nu
ed)
Copyright © 1996 IEEE All Rights Reserved 117
uthorized licensed use limited to: UNIVERSIDADE DO PORTO. Downloaded on October 13, 2009 at 10:22 from IEEE Xplore. Restrictions apply.

IEEE Std 998-1996 IEEE GUIDE FOR DIRECT LIGHTNING STROKE
A
Exhibit B.5-5 ÑCalculations for shield wire protection of 500 kV substation
118 Copyright © 1996 IEEE All Rights Reserved
uthorized licensed use limited to: UNIVERSIDADE DO PORTO. Downloaded on October 13, 2009 at 10:22 from IEEE Xplore. Restrictions apply.

SHIELDING OF SUBSTATIONS IEEE Std 998-1996
A
Exhibit B.5-5 ÑCalculations for mast protection of 500 kV substation (Continued)
Copyright © 1996 IEEE All Rights Reserved 119
uthorized licensed use limited to: UNIVERSIDADE DO PORTO. Downloaded on October 13, 2009 at 10:22 from IEEE Xplore. Restrictions apply.

IEEE Std 998-1996 IEEE GUIDE FOR DIRECT LIGHTNING STROKE
A
Exhibit B.5-6 ÑCalculations for shield wire protection of 230 kV substation
120 Copyright © 1996 IEEE All Rights Reserved
uthorized licensed use limited to: UNIVERSIDADE DO PORTO. Downloaded on October 13, 2009 at 10:22 from IEEE Xplore. Restrictions apply.

SHIELDING OF SUBSTATIONS IEEE Std 998-1996
A
Exhibit B.5-6 ÑCalculations for mast protection of 230 kV substation (Continued)
Copyright © 1996 IEEE All Rights Reserved 121
uthorized licensed use limited to: UNIVERSIDADE DO PORTO. Downloaded on October 13, 2009 at 10:22 from IEEE Xplore. Restrictions apply.

IEEE Std 998-1996 IEEE GUIDE FOR DIRECT LIGHTNING STROKE
A
Figure B.5-4 ÑShielding a 500/230 kV substation with shield wires using the rolling sphere method
122 Copyright © 1996 IEEE All Rights Reserved
uthorized licensed use limited to: UNIVERSIDADE DO PORTO. Downloaded on October 13, 2009 at 10:22 from IEEE Xplore. Restrictions apply.

SHIELDING OF SUBSTATIONS IEEE Std 998-1996
A
Table B.5-1 ÑSummary of lightning protection calculations by the rolling sphere method
B.6 Comparison of results of sample calculations
B.6.1 Results for 69 kV substation
Table B.6-1 gives the results of the application of masts and shield wires by the four methods for the 69 kV substation.The required number of masts and/or shield wires is identical for the Þxed angle and the empirical methods, althoughthe empirical method permits a shorter mast.
Shield wiresÑ100 ft high wire
Separation of wires for protection against vertical strike
Calc SW Bus
Ht (ft) Collector (ft) High (ft) Low (ft) Type of Stroke
Exhibit B.5-3 100 Ñ 197 231 Vertical
Exhibit B.5-5 100 Ñ 20 44 Side
Exhibit B.5-6 100 160 165 166 Vertical
Exhibit B.5-6 100 11 19 27 Side
Exhibit B.5-2 60 Ñ 96 97 Vertical
Exhibit B.5-2 60 Ñ 9 13 Side
Exhibit B.5-2 40 Ñ 80 86 Vertical
Exhibit B.5-2 40 Ñ 9 14 Side
Masts
Separation of masts for protection against strikes
Calc Mast Bus
Ht (ft) Collector (ft) High (ft) Low (ft) Type of Stroke
Exhibit B.5-3 100 Ñ 184 236 Side
Exhibit B.5-3 100 Ñ 220 261 Vertical 4 Mast
Exhibit B.5-3 100 Ñ 190 226 Vertical 3 Mast
Exhibit B.5-4 100 136 154 168 Side
Exhibit B.5-4 100 184 192 196 Vertical 4 Mast
Exhibit B.5-4 100 159 166 169 Vertical 3 Mast
Exhibit B.5-1 60 Ñ 84 93 Side
Exhibit B.5-1 60 Ñ 111 114 Vertical 4 Mast
Exhibit B.5-1 60 96 98 Vertical 3 Mast
Copyright © 1996 IEEE All Rights Reserved 123
uthorized licensed use limited to: UNIVERSIDADE DO PORTO. Downloaded on October 13, 2009 at 10:22 from IEEE Xplore. Restrictions apply.

IEEE Std 998-1996 IEEE GUIDE FOR DIRECT LIGHTNING STROKE
A
Table B.6-1 ÑComparison of results for 69 kV substation
Applying the EGM, however, requires six masts to protect the station. The reason for this is twofold:
a) The EGM attempts to provide 100% ßashover protection,2 whereas the other two methods permit a smallfailure rate.
b) The EGM computer method takes into account the voltage withstand capability of the station. The lowerwithstand voltage of the 69 kV station requires the use of a shorter striking distance in the applicationmethod, which in turn requires closer spacing of masts or wires to protect all areas.
B.6.2 Results for 500/230 kV substation
Table B.6-2 gives the results for the 500/230 kV substation example. The number of masts required for protectionvaries depending on the method used. An explanation does exist for some of the variation, however:
a) Each sample calculation method was prepared by a different engineer. Thus, the results reßect the degree ofoptimization and conservatism exercised by each engineer.
b) The designer of the computer program incorporated two conservative factors not used in the rolling spheremethod. The Þrst of these was to add a 0.9 multiplier in Eq 5-1 as suggested by Gilman and Whitehead [33].The second factor that made the computer design more conservative was that the crest value of the ac busvoltage was subtracted from the withstand voltage of the insulators.3 This factor can be signiÞcant in EHVsubstations. Of course, the same factors could have been applied to the equations used to arrive at the strikingdistance for the rolling sphere method. With this modiÞcation the results by the two methods would be veryclose.
Table B.6-2 ÑComparison of results for 500/230 kV substation
No. of masts/wires required
Method
Fixed angle Empirical EGM computerEGM rolling
sphere
No. masts required 1 1 6 6
No. wires required 2 2 4 4
2This is not strictly true for the 69 kV example; see B.5.33The assumption is that the ac polarity of the bus voltage at the instant that lightning strikes is such as to increase the stress on the insulators andreduce their withstand ability.
No. of masts/wires required
Method
Fixed angle Empirical EGM computerEGM rolling
sphere
No. masts, 500 kV 53 32 46 32
No. masts, 230 kV 8 11 16 12
No. masts, total 61 43 62 44
No. wires, 500 kV 11 10 13 11
No. wires, 230 kV 2 2 5 5
No. wires, total 13 12 18 16
124 Copyright © 1996 IEEE All Rights Reserved
uthorized licensed use limited to: UNIVERSIDADE DO PORTO. Downloaded on October 13, 2009 at 10:22 from IEEE Xplore. Restrictions apply.

SHIELDING OF SUBSTATIONS IEEE Std 998-1996
A
Annex C Calculation of corona radius and surge impedance under corona(Informative)
C.1 Corona radius
In case of a single conductor, the corona radius Rc is given by Anderson [B4]:
(C.1)
where
Rc is the corona radius in metersh is the average height of the conductor in metersVc is the allowable insulator voltage for a negative polarity surge having a 6 ms front in kilovolts (Vc = the BIL
for post insulators)E0 is the limiting corona gradient, this is taken equal to 1500 kV/m
Eq C.1 can be solved by trial and error using a programmable calculator (an approximate solution is given in ÞgureC.1).
In the case of bundle conductors, the radius of the bundle under corona Rc' [B4] is taken as follows:
(C.2)
where
Rc is the value for a single conductor as given by Eq C.1R0 is the equivalent radius of the bundle.
The calculation method of R0 is given in C.2.
C.2 Equivalent radius for bundle conductor
In the case of a twin conductor bundle, the equivalent radius R0 [B4] is given by
(C.3)
where
r is the radius of subconductor in metersl is the spacing between adjacent conductors in meters
Rc ln2 h´
Rc------------è ø
æ ö V c
E0------д 0=
Rc¢ R0 Rc+=
R0 r l´=
Copyright © 1996 IEEE All Rights Reserved 125
uthorized licensed use limited to: UNIVERSIDADE DO PORTO. Downloaded on October 13, 2009 at 10:22 from IEEE Xplore. Restrictions apply.

IEEE Std 998-1996 IEEE GUIDE FOR DIRECT LIGHTNING STROKE
A
Figure C.1ÑApproximate diameter of corona sheath around a single conductor under impulse conditions
In the case of a three-conductor bundle:
(C.4)
In the case of a four-conductor bundle:
(C.5)
In the case of more than four conductors:
(C.6)
Reprinted with permission from Transmission Line Reference Book 345 kV an dAbove, Second Edition, Revised© 1982,Electric Power Research Institute, Palo Alto, CA.
R0 r l2
´3=
R0 2 r´ l3
´4=
R0 0.5 l' n2 r´
l'-----------´n´´=
126 Copyright © 1996 IEEE All Rights Reserved
uthorized licensed use limited to: UNIVERSIDADE DO PORTO. Downloaded on October 13, 2009 at 10:22 from IEEE Xplore. Restrictions apply.

SHIELDING OF SUBSTATIONS IEEE Std 998-1996
A
where
l¢ is the diameter of the circle on which the subconductors lien is the number of subconductors
C.3 Surge impedance under corona
The surge impedance of conductors under corona in ohms is given by Brown [B15]:
(C.7)
where
h is the average height of the conductorRc is the corona radius (use Eq C.2 as appropriate)r is the metallic radius of the conductor, or equivalent radius in the case of bundled conductors
Zs 60 ln 2 h´
Rc------------è ø
æ ö ln 2 h´
r------------è ø
æ ö´´=
Copyright © 1996 IEEE All Rights Reserved 127
uthorized licensed use limited to: UNIVERSIDADE DO PORTO. Downloaded on October 13, 2009 at 10:22 from IEEE Xplore. Restrictions apply.

IEEE Std 998-1996 IEEE GUIDE FOR DIRECT LIGHTNING STROKE
A
Annex D Calculation of failure probability(Informative)
D.1 Failure probability
For the three conditions described in 5.3.1 through 5.3.3 of this guide, if Is is chosen according to Eq 5-2, there shouldtheoretically be no equipment failures due to direct strokes. This is because only those strokes that could produce asurge voltage wave less than the BIL of the equipment were able to penetrate the shielding system, and these strokesshould, therefore, cause no problem. Unfortunately, substation shielding that will provide such ideal protection is notalways economical. This is especially true when one is working with substation equipment BIL levels below 550 kV.The designer is then faced with the problem of Þrst determining the level of failure risk he or she is willing to base thedesign on, then developing a design that will meet this criteria. The following clauses discuss a method of determiningthe unprotected area of a design and show how to calculate expected failure rates.
D.2 Unprotected area
To visualize an unprotected area, refer again to Þgure 5-6. Assume that equipment is sized and located as shown andfurther assume that, based on equipment BIL levels, equipment can withstand stroke currents less than Iso. Theassociated strike distance is So. Based on the layout, the shield mast will provide protection for all stroke currentsgreater than Is. However, those stroke current magnitudes between Iso and Is could reach equipment and would beexpected to cause damage. The unprotected area for this condition would be the shaded area shown in Þgure 5-6.
D.3 Probability of strokes causing equipment damage
Equation 2-2B or Þgure 2-4 can be used to determine the probability that any stroke will be greater than Is, which is thelevel above which the shield masts will intercept the stroke. This probability is P(Is). The same equation or Þgure canbe used to determine the probability that the stroke will be greater than Iso, where Iso is the level of stroke current thatcan be handled by the equipment based on its BIL. This probability is P(Iso). The probability that a stroke is less thanIs is 1.0 minus P(Is) or P(<Is). The probability that a stroke is less than Iso is 1.0 minus P(Iso) or P(<Iso). For alllightning strokes that descend upon the shaded area of Þgure 5-6, the probability that equipment damage will occur isP(<Is) - P(<Iso) or P(Iso) - P(Is).
Example
These probabilities can best be demonstrated by the following example:
a) Assume that the stroke current for the striking distance So is 4.03 kA. Strokes of this magnitude may strikewithin the protected area.
b) Assume the strike distance S, above which protection is provided, is 40 m. From Eq 2-1D, the stroke currentabove which protection is provided is 11.89 kA.
c) The probability that a stroke will exceed 4.03 kA, using Eq 2-2B or Þgure 2-4, is 0.990.
d) The probability that a stroke will exceed 11.89 kA, using Eq 2-2B or Þgure 2-4, is 0.861.
e) Therefore, the probability that a stroke which descends upon the unprotected area will be of amagnitude thatcan cause equipment damage and failure is 0.990 - 0.861 = 0.129 or 12.9%.
D.4 Failure rate
The substation designer is basically concerned with the rate of failure of the shielding design or the number of yearsexpected between failures. In D.3, the methodology was presented for the designer to determine the probability that a
128 Copyright © 1996 IEEE All Rights Reserved
uthorized licensed use limited to: UNIVERSIDADE DO PORTO. Downloaded on October 13, 2009 at 10:22 from IEEE Xplore. Restrictions apply.

SHIELDING OF SUBSTATIONS IEEE Std 998-1996
A
stroke in the unprotected area would cause failure. By knowing the number of strokes expected to descend upon thearea, the failure rate can be determined.
The number of strokes per unit area expected in the vicinity of the substation is the ground ßash density (GFD). GFDis calculated using Eq 2-3 or 2-4. The number of strokes expected to descend upon the area is the GFD multiplied bythe unprotected area. The annual failure rate is the product of the number of strokes to the area times the probabilitythat the stroke in the area will cause failure.
Example
The calculation of failure rate will be demonstrated by continuing the example begun in clause D.3.
a) Assume the outside radius of the unprotected area is 35 m and the inside radius of the unprotected area is 22m. The unprotected area is p[(35)2 - (22)2] = 2328 m2 or 2.328 ´ 10-3 Km2.
b) Assume the isokeraunic level is 50 thunderstorm-days per year. (T values across the USA can be read fromÞgure 2-6). The GFD, from Eq 2-3A, is 6.0 strokes per square kilometer per year.
c) The annual number of strokes expected to descend into the unprotected area is 6.0 ´ 2.328 ´ 10-3 = 0.01397strokes/year.
d) The annual expected number of equipment failures due to direct lightning strokes, using the 0.129 probabilitydeveloped in D3, is 0.01397 ´ 0.129 = 0.00180 failures/year or 556 years between failures.
The above calculated failure rate would be for the simpliÞed single mast substation described in the example. If autility had 20 such substations of identical design scattered throughout its system, the total system substation failurerate due to direct strokes would be 556 divided by 20 = 28 years between failures.
Copyright © 1996 IEEE All Rights Reserved 129
uthorized licensed use limited to: UNIVERSIDADE DO PORTO. Downloaded on October 13, 2009 at 10:22 from IEEE Xplore. Restrictions apply.

IEEE Std 998-1996 IEEE GUIDE FOR DIRECT LIGHTNING STROKE
A
Annex E IEEE questionnaireÑ1991(Informative)
A SURVEY OF INDUSTRY PRACTICES REGARDING SHIELDING OF SUBSTATIONS AGAINST DIRECT LIGHTNING STROKES
(A Project of IEEE Working Group E5)Abdul M. Mousa. Senior Member. IEEEBritish Columbia HydroVancouver, B.C., Canada V6Z 1Y3R.J. Wehling, Senior Member, IEEEUnited Power AssociationElk River, Minnesota, U.S.A.
Abstract - A survey of industry practices regarding shielding of substations against direct lightning strokes is presentedand analyzed. The survey is based on responses from 114 companies including consultants and utilities both fromwithin and from outside North America. The survey IdentiÞes the shielding design methods in use, the factors affectingthe selection of a shielding method, the shielding design criteria and the governing factors, the performance of thedifferent shielding methods and miscellaneous related aspects. The survey revealed a large number (35) of shieldingfailure incidents; 34 of which occurred in systems designed using either the Þxed Shielding angle method or WagnerÕs1942 method.
Keywords - LIGHTNING PROTECTION, ELECTRIC SUBSTATIONS: Lightning Protection, ELECTRICSUBSTATIONS: Computer Applications, LIGHTNING: Analysis.
INTRODUCTION
This paper reports on a project of Working Group E5 of the IEEE Substations Committee which was done inconnection with the preparation of a ÒGuide for Direct Lightning Stroke Shielding of SubstationsÓ. A questionnairecovering 28 points was mailed during the closing months of 1990 to 258 consultants and utilities both from within andfrom outside North America. The analysis in this paper is based on the responses of 114 companies and most of thoseresponses were received during January 1991. The distribution of the participants among the different Segments of theindustry is as follows:
Participation from outside North America covered all continents: Europe (5), Asia (4), Australia (3), Africa (1), andSouth America (2).
The results of the survey are given in the following section. In each item, the question posed to the participants is Þrstlisted then an analysis of their responses is presented. It should be noted that some respondents did not answer allquestions. This is partly because some questions do not apply to consultants (intended only for utilities) and alsobecause some respondents did not readily have the data needed to answer all questions. Hence the percentage
Utilities from U.S.A. 74
Utilities from Canada 10
Utilities from Outside North America 15
North American Consultants 15
Total 114
130 Copyright © 1996 IEEE All Rights Reserved
uthorized licensed use limited to: UNIVERSIDADE DO PORTO. Downloaded on October 13, 2009 at 10:22 from IEEE Xplore. Restrictions apply.

SHIELDING OF SUBSTATIONS IEEE Std 998-1996
A
distributions reported in the analysis of a question are based on the number of useful responses received for thatquestion. However, the analysts for the important questions (e.g. nos. 1 and 2) is based on 114 responses since datawere available for those questions from all participating companies. It should also be noted that any opinions includedwith the analysis are those of the authors and do not necessarily represent the opinion of every member of WorkingGroup E5.
RESULTS OF THE SURVEY
Q1
For designing systems for shielding of substations against direct lightning strokes, which of the following methods (ora modiÞed version thereof) are you using at present and to what voltage classes is it being applied?
a) Fixed shielding angleb) WagnerÕs 1942 Method [1]c) LeeÕs Rolling Sphere Method [2]d) MousaÕs 1976 EGM Method [3]e) SargentÕs 1972 3-D Method [4]f) LinckÕs 1975 Method [5]g) DainwoodÕs 1974 Method [6]h) MousaÕs Software Subshield (SBSHLD) [7]i) Other; Please Specify.
Note that all shielding design methods can be divided into two main categories:
GEOMETRICAL methods: These assume that the shielding device (wire or mast) can intercept all the lightningstrokes arriving over the subject area if the shielding device maintains a certain geometrical relation (separation anddifferential height) to the protected object. Methods (a) and (b) above fall into this category.
ELECTROGEOMETRIC MODELS (EGMÕs): These recognize that the attractive effect of the Shielding device is afunction of the amplitude of the current of the lightning stroke. Thus, for a given shielding geometry, some of the lessintense strokes would not be intercepted by the shielding system and may terminate instead on the live bus or otherÒprotectedÓ object. The way to accomplish Òeffective shieldingÓ in this case is by limiting penetration of the shieldingsystem to only those strokes which would not ßashover the insulation or would not damage the protected object.Methods (c) through (h) above fall into this category.
Referring to item (i) in the above list, a total of 11 OTHER methods were reported by the respondents. These weredivided into OTHER EGMÕs [8-11] and OTHER GEOMETRICAL METHODS (12-15) (References in foreignlanguages are not listed). Also, a few respondents (mostly municipal utilities operating in areas where the kerauniclevel is low) stated that they do not shield at all and hence a separate group was created for them. None of therespondents reported using the Sargent nor the Dainwood methods and hence these methods were dropped from thelist. The number of users, both past and present, of LinckÕs method was rather negligible and hence that method waslumped with the OTHER EGMÕs. The number of those presently using MousaÕs 1976 method was found to be small.Hence it was also decided to lump the remaining users under OTHER EGMÕs. In view of the above, the Þnal listingcontained 7 groupings.
92 WM 224-6 PWRD A paper recommended and approved by the IEEE substations Committee of the IEEE PaverEngineering Society for presentation at the IEEE/PES 1992 Winter Meeting, New York, New York, January 2630,1992. Manuscript submitted May 21, 1991; made available for printing November 25, 1991.
Twenty of the respondents reported using more than one method. A typical example of this case is using the RollingSphere method for transmission voltages 138 kV and above and using the Fixed Angle method for the lower voltages.To avoid the distortion of the results by such cases, each participant was allotted one ÒvoteÓ. Thus a participant using
Copyright © 1996 IEEE All Rights Reserved 131
uthorized licensed use limited to: UNIVERSIDADE DO PORTO. Downloaded on October 13, 2009 at 10:22 from IEEE Xplore. Restrictions apply.

IEEE Std 998-1996 IEEE GUIDE FOR DIRECT LIGHTNING STROKE
A
2 methods was considered to have cast 0.5 vote for each of those 2 methods and a participant using 3 methods wasconsidered to have cast 0.33 vote for each of those 3 methods.
Based on the above, Table I shows the extent of use of the different shielding design methods. This shows thefollowing:
1) As of April 1991, only 4 design methods are widely used by the industry; the Fixed Shielding Angle method(32.5%), MousaÕs Software Subshield (21.1%), LeeÕs Rolling Sphere method (16.3%), and WagnerÕs 1942method (12.6%). None of the other methods currently has a signiÞcant number of users; 13 miscellaneousmethods have a combined number of users totalling only 12.2% of the respondents.
2) About 50% of all respondents are using the GEOMETRICAL methods.
ÒNote that EGMÕs have been around since 1963 [11] and they are widely used in designing the shielding of powerlines. On the other hand, this survey indicates that the conversion from GEOMETRICAL methods to EGMÕs has beenslow where the design of substations is concerned. However, the faster conversion rate to a recent computerized EGMversion [7] may indicate that substation designers accept the EGM approach but have tended to avoid it in the pastbecause of dislike for the complexity which used to be involved.Ó
Table II gives a comparison between North American and non-North American respondents. This stows a somewhathigher acceptance rate for EGMÕs outside North America.
Table I ÑExtent of Use of the Different Shielding Design Methods
Q2
If what you are using is a modified version of one of the above methods rather than the published version, pleasedescribe the difference.
Very few modiÞcations were reported by the respondents. These are:
1) Using rolling sphere having a Þxed radius (i.e. i value independent of the BIL of the bus).2) One utility uses a combination of the German Standard VDE 0101 and the Gilman-Whitehead EGM.3) One utility uses a combination of WagnerÕs and the rolling sphere methods.4) One utility uses the rolling sphere method but allows higher exposure at the ÒcornersÓ of the switchyard.
Q3
Which of the following substation shielding design methods did you use in the past but you are no longer using, and(approximately) when did you stop using it:
METHOD USERS, %
Do not shield 5.3
Fixed Shielding Angle 32.5
50.1WagnerÕs 1942 Method [1] 12.6
Other Geometrical Methods [12-15] 5.0
LeeÕs Rolling Sphere Method [2] 16.3
44.6Software Subshield [7] 21.1
Other EGMÕs [3, 5, 8 - 11] 7.2
Total 100.0
132 Copyright © 1996 IEEE All Rights Reserved
uthorized licensed use limited to: UNIVERSIDADE DO PORTO. Downloaded on October 13, 2009 at 10:22 from IEEE Xplore. Restrictions apply.

SHIELDING OF SUBSTATIONS IEEE Std 998-1996
A
a) Fixed Shielding Angleb) WagnerÕs 1942 Method [1]c) LeeÕs Rolling Sphere Method [2]d) MousaÕs 1978 EGM Method [3]e) SargentÕs 1972 3-D Method [4]f) LinckÕs 1975 Method [5]g) DainwoodÕs 1974 Method [6]
None of the participants ever used the Dainwood nor the Sargent methods. One company used LinckÕs method in thepast but abandoned it in 1987 in favour of the Rolling Sphere method. The number of ex-users of the other 4 methodsand the average date they stopped using them are as follows:
a) Fixed angle: 31 ex-users, 1982.b) WagnerÕs: 8 ex-users, 1978.c) Rolling Sphere: 11 ex-users, 1988.d) MousaÕs 1976 EGM: 7 ex-users, 1990.
The combined average abandonment date of the geometrical methods (Fixed Angle and WagnerÕs) was 1981. This isthe average conversion date to EGMÕs by those currently using such methods, i.e. 18 years after the Þrst EGM wasintroduced by Young et al [11] in 1963.
Table II ÑComparison Between the Participants from Within and From Outside North America
Q4
If you are at present using the Þxed shielding angle method, please specify the angle, both positive (b) and negative(a), used for each voltage class to which the method is being applied (referring to Fig. 1, the angle is considerednegative if the object is located between 2 shield wires or 2 masts and is considered positive when the object receivesshielding only from a single wire or mast):
All except one of those responding to Q4 use the same value of the shielding angle regardless of the voltage class.Regarding angle b, 45° is used 51% of the time and 30° is used 45% of the time. The remaining 4% group includes oneutility which uses a 15° angle and another utility which uses a 20° angle. The average value of 8 for all users is 37°.Regarding angle a, the majority use 45°, several use 60°, and the average for all users is 47°.
One company uses a 45° shielding angle for substations and only a 15° angle for power lines. While utilities usuallyattempt to shield their substations more completely than they do power lines, this respondent chose to give its linesbetter shielding. This could be a reßection of the fact that the swath (stroke collection area) of a power line adds up tomany square kilometers over the length of the line, and hence collects a large number of strokes every year ascompared to a substation with its small area. As a result, deÞciencies in shielding are apt to show up quicker on powerlines and corrective action will be taken sooner.
Q5
In your present practice, which is the preferred shielding device:
CATEGORY USERS, %.
USA & CANADA OTHERS
Geometrical Methods 56.2 50.0
EGMÕs 43.8 50.0
Total 100.0 100.0
Copyright © 1996 IEEE All Rights Reserved 133
uthorized licensed use limited to: UNIVERSIDADE DO PORTO. Downloaded on October 13, 2009 at 10:22 from IEEE Xplore. Restrictions apply.

IEEE Std 998-1996 IEEE GUIDE FOR DIRECT LIGHTNING STROKE
A
a) Shield wires Mastsb) Mastsc) Both are used depending on layout
Q6
If you have checked item 5(b) above (MASTS), please state the reasons for your preference.
In response to Q5, 30% of participants stated that they prefer shield wires, 17% stated that they prefer masts and theremaining 53% use whichever device is more suitable to the layout of the substation under consideration. The reasonsgiven by those who prefer masts are as follows:
1) More economical.2) Aesthetics and being more suitable to low proÞle substations.
Figure 1 ÑThe fixed shielding angle method.3) A broken shield wire can have serious consequences (two utilities experienced such incidents), and shield
wire maintenance requires an outage of the bus underneath. Some described masts as being more reliable.Presumably this refers to avoiding the risk listed above.
4) Easier to add to an existing substation while use of shield wires in such a case would impose additional stresson substation structures.
5) Ease of installation and simplicity of design.
On the other hand, two companies reported mast failures caused by vibration and one commented that masts are notdesirable because they tend to be in the way of either maintaining the equipment or driving around.
It should be noted that the total length of the shield wires installed on the power lines of each utility is probably about1000 times longer than the total length of the shield wires installed in substations. Also, the corresponding spans aresigniÞcantly longer. Nevertheless, incidents of failure of power line shield wires (except for those which are alsoaccompanied by failure of the conductors and or the tower) are rather rare. Such reliable performance is accomplishedby power line designers by use of vibration dampers [16-18] and by operating the shield wires at lower tensions(measured in percent of the ultimate tensile strength). Implementing such measures in the design of the shield wires ofsubstations would similarly guarantee reliable operation.
Regarding the cost and aesthetic aspects, it should be noted that more respondents Þnd shield wires to be both moreeconomical and better from the aesthetic point of view.
Q7
What is your present approach to designing shielding systems:
a) Aim for effective shielding.b) Intentionally allow a certain shielding failure rate to reduce cost of shielding systems.
Q8
If you have checked item 7(b) above, please state the target shielding failure rate.
134 Copyright © 1996 IEEE All Rights Reserved
uthorized licensed use limited to: UNIVERSIDADE DO PORTO. Downloaded on October 13, 2009 at 10:22 from IEEE Xplore. Restrictions apply.

SHIELDING OF SUBSTATIONS IEEE Std 998-1996
A
83% of respondents stated that they aim for effective shielding. Regarding those who intentionally allow someshielding failures: 24% of them have no speciÞc target shielding failure rate and 29% quote the 0.1% shielding failurerate which is associated with the Wagner method which they use. Another 35% quote various rates in the range of onefailure per 501000 years. The remaining 12% stated that they allow 5Ð10% of the strokes terminating on the substationto cause shielding failures.
Note that the above response regarding what designers attempt to achieve does not correlate with the failures reportedin response to Q20.
Q9
(For utilities) What is the approximate range of the keraunic levels (number of thunderstorm days/year) prevailingwithin your service area?
Q10
Do you vary the shielding design method/procedure depending on the keraunic level:
a) Nob) Yes. If so, please explain.
In response to Q10, all participants stated that they do not very the design procedure depending on the keraunic level.This result is not surprising, mainly because the keraunic level usually does not vary widely within the service territoryof any one utility. Nevertheless, the keraunic level seems to have an impact on which design method is to be adopted.When the keraunic level (TD) was correlated with the design method, the following was found:
This seems to indicate that utilities which are more severely impacted by thunderstorms prefer to use EGMÕs.
The following comments were made by the respondents in connection with Q10:
1) Two consulting engineers stated that they may consider relaxing the shielding criteria if the keraunic level isvery low. This means using a larger angle where the Þxed angle method is used.
2) The keraunic level indirectly affects the amount of shielding provided where partial shielding is allowed andthe corresponding shielding failure rate is Þxed (say at 1 failure/100 years).
Q11
(For utilities) Are there substations within your system having altitudes (height above mean sea level) exceeding 1000m:
a) No.b) Yes. If so, please state the highest altitude and the primary voltage(s) of those substations.
CATEGORYAVERAGE TD OF
USERS
Geometrical Methods 35.6
EGMÕs 41.8
Copyright © 1996 IEEE All Rights Reserved 135
uthorized licensed use limited to: UNIVERSIDADE DO PORTO. Downloaded on October 13, 2009 at 10:22 from IEEE Xplore. Restrictions apply.

IEEE Std 998-1996 IEEE GUIDE FOR DIRECT LIGHTNING STROKE
A
About 20% of participating utilities have substations located at altitudes above 1000 m. The highest altitude reportedis 3500 m and the average for those high altitude substations is about 1800 m. The corresponding voltages are up to500 kV.
Q12
Do you vary the shielding design method/procedure depending on altitude:
a) No.b) Yes. If so, please explain.
One respondent stated that he uses the derated value of the BIL (corresponding to the altitude of the substation) whenapplying the EGM. All other respondents stated that the shielding design method/procedure is independent of altitude.
Q13
In designing the grounding grid of your substations, what is the governing objective(s):
a) Limit the transient voltage rise occurring when the ground grid is discharging the lightning Currents collectedby the masts/shield wires in the substations, thus preventing backßash.
b) Limiting 60/50 Hz step end touch potentials related to a fault in the Substation.c) Other. Please specify.
The objective of this question was to determine whether the design of the grounding grid included any features relatedto lightning protection. Category (c) turned out to be meanly the controlling of the ground potential rise (GPR) toprotect telecommunication cables entering the substation. The target grounding resistance used to achieve this wasreported to be in the range 0.5Ð5.0W. Using such low values incidentally serves to prevent backßash. Seven percent ofrespondents fell into category (c), another 7% fall in category (a), and the remainder (86%) design mainly to controlstep and touch potentials. Note that the step and touch voltages can always be made safe by reducing the mesh size andby covering the surface with a layer of crushed rock. The corresponding value of the substation grounding resistance,and hence the GPR and risk of backßash, could still be high if the total area of the substation is small and/or theresistivity of the soil beneath it is high.
Some utilities stated that they install ground rods at the sites of surge arresters and at the structures carrying masts orshield wires. A typical design consists of a 4 rod system forming a 3 m ´ 3 m square and the rods are 3 m long, 19 mdiameter (0.75²). Of course, the above ground rod assemblies are also bonded to the grounding grid.
Q14
(For utilities) At present, what is the highest voltage class in your system?
Q15
(For utilities) Do you have plans for adding higher voltages to your system within the next 10Ð15 years:
a) No.b) Yes. If so, please state the planned higher voltage(s).
The part of Q1 regarding the voltage classes to which a shielding design method is being applied revealed that there isno Upper limit to the voltage class to which any method is being applied. However, correlating Q14 to the shieldingdesign method used by the respondent gave the data shown in Table III. This shows that a majority of the utilitiesowning higher voltage systems use EGMÕs while a majority of those owning lower voltage systems use geometricalmethods. Correlating Q15 to the shielding design method revealed e similar trend: 7 of the 11 utilities which areplanning to add higher voltages use EGMÕs. This gives a ratio of 7/11=63.6% as compared to the 54.3% listed in the
136 Copyright © 1996 IEEE All Rights Reserved
uthorized licensed use limited to: UNIVERSIDADE DO PORTO. Downloaded on October 13, 2009 at 10:22 from IEEE Xplore. Restrictions apply.

SHIELDING OF SUBSTATIONS IEEE Std 998-1996
A
above table for use of EGMÕs among those owning the higher voltage systems. The above Þndings are not surprising:the move into voltages of 500 kV and above or the plan to do so is usually accompanied by re-examination of allaspects of the companyÕs design practice. Such re-evaluation tends to lead to adoption of more sophisticated designmethods.
Table III ÑEffect of Voltage on the Shielding Design Method
Q16
What is the effect of voltage class on your shielding design method:
a) The same criteria are applied to all voltages.b) Better shielding is provided to the higher voltage classes.c) Other than the above. If so, please explain.
71% of respondents fall into category (a), 24% fall into category (b) and the remaining 5% fall into category (c). Thereplies of utilities which stated in Q1 that they use more than one design method is consistent with category (b) above:most of them stated that they use the Wagner or the Fixed Angle methods to design their lower voltage substations anduse an EGM method for designing their higher voltage substations. The few respondents falling into category (c) statedthat they either do not shield at all their distribution substations (69 kV and below) or provide very little shielding tothem.
Q17
(For utilities) Are the transmission lines in your system:
a) Shielded along their entire lengthb) Only short sections near the terminals are shieldedc) Depends on voltage class. If so, please explain.
77% of responding utilities shield all their power lines along their entire lengths. Of the remaining 23%, 4 utilitiesshield only short sections of the power lines near the terminals. It is interesting that one utility in Europe used thispractice before 1980 but has provided full shielding for all their power lines built since then. Several practices werereported under group (c) including the following:
1) The higher voltage lines are fully shielded and the distribution lines 69 kV and below are either not shieldedet all or only short sections near the terminals are shielded.
2) Within the same voltage class: some lines are shielded while others (the older ones) are not.3) Some distribution lines are shielded while others are equipped with surge arresters at intervals along their
lengths.4) Within the same voltage class: the single circuit lines are not shielded while double circuit lines are shielded.
Three of the utilities which do not shield their substation do shield their power lines either over the entire length or for1 km at the terminals. A comment relevant to this practice is given under Q4.
Highest VoltageShielding Method
Category
Geometrical EGMÕs
< 500 kV 63.4% 36.6%
500 kV and above 45.7% 54.3%
Copyright © 1996 IEEE All Rights Reserved 137
uthorized licensed use limited to: UNIVERSIDADE DO PORTO. Downloaded on October 13, 2009 at 10:22 from IEEE Xplore. Restrictions apply.

IEEE Std 998-1996 IEEE GUIDE FOR DIRECT LIGHTNING STROKE
A
Q18
Do you provide shielding for a vertical break disconnect switch blade in the open position?
67.3% of respondents provide shielding for a vertical break disconnect switch blade in the open position.
Q19
In the electrogeometric model method, the current of the stroke is usually assumed to be divided (upon terminating onthe bus) into 2 equal components travelling in opposite directions. However ÒdoublingÓ may take place when an openbreaker or an unprotected transformer (without surge arrester) is encountered. Do you take such doubling effect intoconsideration in your design:
a) No.b) Yes. If so, please elaborate.
Eight of the respondents stated that they take the voltage doubling effect into consideration. On closer examination oftheir Comments and their reply to other questions, the following was found:
1) Two of them are referring to protection against the travelling waves arriving over the transmission lines (theprocedure for calculating the allowable separation between the arrester and the protected equipment), ratherthan protection against direct lightning strikes to the substation.
2) Four others do not use EGMÕs, but rather use WagnerÕs or the Þxed angle method and hence their replies arenot relevant.
3) The remaining two respondents use the rolling sphere method. That method, unless modiÞed by the user,does not provide for the doubling effect. Those two respondents, as well as several others, talk about the useof surge arresters rather than a change in the shielding design calculation method.
In view of the above, there seems to be a universal agreement that the doubling effect not be taken into considerationin the shielding design procedure itself. Of course, arresters where available will protect, to the extent possible, againstovervoltages regardless of whether the source is a travelling wave arriving over a power line or a direct strike to thesubstation. Arresters are universally provided at all transformers and shunt reactors. Some respondents suggest usingthem too at power line entrances, at the main bus, at normally open breakers, and at any other breaker which hassigniÞcant exposure. Four respondents proposed using rod gaps at breakers, at line entrances and/or at bus end points.It should be noted, however, that operation of a rod gap constitutes a fault within the substation. This may cause aserious system stability problem. Also, upon recovery from the fault, the sudden re-energization of all transformers inthe substation may cause ferroresonance leading to arrester and/or transformer damage.
Q20
Have you had instances where shielding failure occurred or equipment was damaged and shielding failure is suspectedto be the cause:
a) No.b) Yes. If so, please give details.
27 participants reported occurrence of shielding failures. All of these except one use geometrical methods (FixedAngle: 20, Wagner: 4, other geometrical methods: 2). The explanation for the only case where an EGM method(Rolling Sphere) failed seems to be as follows: lightning struck the end section of a main bus and hence ÒvoltagedoublingÓ occurred; a factor which the design method ignores. Seven of the above 27 utilities did not provide details.The remaining 20 utilities reported a total of 35 speciÞc shielding failure incidents. This includes one company whichreported a total of 8 incidents. This respondent uses a 45° shielding angle (angle a in Fig. 1) and their keraunic levelis 50Ð58 days/year. The average keraunic level for the 27 utilities which reported shielding failures is 50 days/year, andthe keraunic levels for 26 of them are in the range 10Ð70. (The remaining case signiÞcantly exceeds 70 days/year.)
138 Copyright © 1996 IEEE All Rights Reserved
uthorized licensed use limited to: UNIVERSIDADE DO PORTO. Downloaded on October 13, 2009 at 10:22 from IEEE Xplore. Restrictions apply.

SHIELDING OF SUBSTATIONS IEEE Std 998-1996
A
Correlating Q20 to Q7 and Q8 revealed the following: 22 of the 27 companies which experienced failures aim foreffective shielding and another 4 companies expect to get the 0.1% shielding failure rate which is associated with theWagner method which they use. The above clearly indicates that designers are not achieving the protection they expectfrom the Geometrical methods. It is Interesting to note that EGMÕs were Þrst developed in response to reports ofexcessive outage rates for EHV lines that were designed using Þxed angles or the Wagner method. Lightningprotection codes [19, 20] also turned to the EGM to improve the protection of buildings and structures. Further, Golde[21] pointed out weaknesses in using scale model tests to investigate shielding. He concluded that the results of suchtests indicated too high a protective ratio, especially for tall structures. His observations now appear to be conÞrmed bythe theory of the EGM.
Q21
Is the control building usually
a) Included in the shielded zone provided for the bus.b) Separately shielded.c) Not shielded.
A clariÞcation of the intent of Q21 is in order: equipment inside a building cannot receive a direct lightning strike.However, a lightning strike to the building can damage this vital structure itself and/or indirectly damage the controlwiring and facilities through the side-ßash mechanism. Examples of separate shielding for buildings can be found inthe national lightning protection codes [19, 20].
39% of the respondents to Q21 fall in category (a), 6% fall in category (b), while the remaining 55% do not shield thecontrol building.
Q22
What is your preferred option for the materials of the shielding system:
a) Metallic masts (or spikes on top of metallic structures).b) Wood poles carrying lightning rods on top (plus riser wires).c) Shield wires carried on metallic supports.d) Shield wires supported on wood poles (plus riser wires).
38.9% of respondents fall into category (a), 1.4% fall in category (b), 49.3% fall in category (c), and the remaining10.4% fall in category (d). The following is noted:
1) The entries under item (d) include one utility which uses concrete poles to support the shield wires.2) The use of wood poles to support shield wires or lightning rods does not seem to be very popular. This is
unfortunate because it would be more appropriate to reduce the cost of shielding, where desired, by usingcheaper materials rather than by providing only partial shielding.
3) The relatively high ratio of mast users indicates lack of realization of the shortcomings of those devices. Thisis further discussed under Q6.
Q23
When shield wires or masts are carried on metallic supports, do you:
a) Provide copper wires running down the structures.b) Rely on conductivity of the structure.
33% of respondents stated that they provide copper wires running down the metallic structure supporting the shieldwire/lightning rod. One respondent commented that the copper wire is needed because the Conductivity of the
Copyright © 1996 IEEE All Rights Reserved 139
uthorized licensed use limited to: UNIVERSIDADE DO PORTO. Downloaded on October 13, 2009 at 10:22 from IEEE Xplore. Restrictions apply.

IEEE Std 998-1996 IEEE GUIDE FOR DIRECT LIGHTNING STROKE
A
structure is not effective, while another commented that the copper wire is not needed because the structure has a lowersurge impedance. A third respondent stated that they provide copper wires in case of masts (because the cross-sectionof the structure is small) but rely on conductivity of the structure in case of shield wires (because the cross-section ofthe structure is large).
Q24
Do you consider surrounding terrain features when designing the shielding system:
a) No.b) Yes. If so, please describe a typical situation.
Only 6% of respondents stated that they take terrain features into consideration and they gave the following as typicalsituations:
1) Case where terrain levels vary within the substation or the substation is located on a hill or surrounded byhigher terrain.
2) Case where incidental shielding is available from adjacent smoke stacks, buildings, or antennas.3) Case where storms move in mostly from one direction. Shielding would be adjusted in such a case.
One respondent interpreted the term Òterrain featuresÓ to include the last towers of the power lines connected to thesubstation. Of course, the shielding effect of such towers is an integral part of the shielding of the substation andshould be taken into consideration by all designers.
Q25
Do you have a published standard or guideline on design of substation shielding systems?
Replies to Q25 were analyzed for all respondents as one group, for the sub-group using EGM methods, and for thesub-group using geometrical methods, and the results are given in Table IV. This shows that most respondents (63%)do not have a company standard on shielding. It also shows that those who have a standard are mostly the users ofEGM methods.
Table IV ÑAvailability of a Company Shielding Standard
Q26
Does your shielding design method include use of a computer program (other than Subshield)?
a) No.b) Yes. If so, please describe brießy.
Only 7 participants (i.e. 6% of the total) reported that they have been using a computer program for designing shieldingsystems:
GROUP HAVE A STANDARD?
YES NO TOTAL
EGM Users 59% 41% 100%
Geometry Users 19% 81% 100%
All Respondents 37% 63% 100%
140 Copyright © 1996 IEEE All Rights Reserved
uthorized licensed use limited to: UNIVERSIDADE DO PORTO. Downloaded on October 13, 2009 at 10:22 from IEEE Xplore. Restrictions apply.

SHIELDING OF SUBSTATIONS IEEE Std 998-1996
A
1) Six for applying the rolling sphere method. Two of these involve the use of CAD rather than a specialprogram.
2) One for applying MousaÕs 1976 method.
Q27
(For utilities) Do you have HVDC in your system or plan to add it:
a) No.b) We already have HVDC. If so, please state the voltage.c) We are planning to add HVDC. If so, please state the voltage.
16 of the responding utilities either have HVDC in their system or are planning to add it. The ratio of those using EGMmethods among this group is basically similar to that for all respondents.
Q28
When was your substation shielding design procedure last revised and/or reapproved:
a) Within the last 3 years.b) 3 - 5 years ago.c) 5 - 10 years ago.d) More than 10 years ago.
Replies to Q28 were analyzed for all respondents as one group, for the sub-group using EGM methods, and for theSub-group using GEOMETRICAL methods, and the results are given in Table V. This shows that 42.1% of allrespondents have not examined their design procedure during the last 10 years. The results suggest that it may be timefor industry to re-examine their shielding practice after this long interval as they would with other design practices.
SUMMARY AND CONCLUSIONS
1) As of April 1991, only 4 shielding design methods are widely used by the industry: the Fixed Shielding AngleMethod (32.5%), MousaÕs Software Subshield (21.1%), LeeÕs Rolling Sphere Method (16.3%), and WagnerÕs1942 Method (12.6%). The above is based on data from 114 companies including consultants and utilitiesboth from within and from outside North America.
Table V ÑDistribution of Respondents in Terms of ÒAgeÓ of their Shielding Design Procedure (%)
2) About 50% of all respondents are still using the GEOMETRICAL methods (Fixed Angle, Wagner, etc.). Theother 50% who use electrogeometric models (EGMÕs) switched, on average, to such methods in 1981, i.e. 18years after the Þrst EGM was introduced by Young et.al. in 1963.
3) Noting that EGMÕs are widely used for designing the shielding of power lines, the conversion by stationdesigners from the GEOMETRICAL methods to EGMÕs has been rather slow. However, the faster conversionrate to a recent computerized EGM version [7] may indicate that substation designers accept the EGM
GROUP YEARS SINCE PROCEDURE LAST REVISED
<3 3-5 5-10 >10 TOTAL
EGM Users 59.0 16.4 16.7 7.9 100%
Geometry Users 6.3 7.4 16.6 69.7 100%
All Respondents 29.8 11.4 16.7 42.1 100 %
Copyright © 1996 IEEE All Rights Reserved 141
uthorized licensed use limited to: UNIVERSIDADE DO PORTO. Downloaded on October 13, 2009 at 10:22 from IEEE Xplore. Restrictions apply.

IEEE Std 998-1996 IEEE GUIDE FOR DIRECT LIGHTNING STROKE
A
approach but have tended to avoid it in the past because of dislike for the complexity which used to beinvolved.
4) The survey revealed a surprisingly large number (35) of shielding failure incidents. All of these except oneoccurred in substations designed using either the Wagner method or the Þxed shielding angle method. Also,all except one of the designers of those substations stated that they basically aim for effective shielding. Theabove clearly indicates that designers are not achieving the protection they expect from the Geometricalmethods.
5) The use of EGMÕs seems to be more widely spread among utilities having maximum system voltages of 500kV and above and also among utilities located in areas where the keraunic levels are higher. Such utilities alsotend to have better documentation (in the form of company standards) of their design practices.
6) About 42% of all respondents have not reexamined their design procedure during the last 10 years (oneparticipant submitted for the 1990 survey the same standard which was submitted for an earlier survey donein 1974). This indicates that a re-examination of shielding design procedures is overdue in many companies.
REFERENCES
[1] Wagner, C.F., McCann, G.D., and Lear, C.M. (1942). ÒShielding of SubstationsÓ, AIEE Trans., Vol. 61, pp. 96 Ð100, 448.
[2] Lee, R.H. (February 1982). ÒProtect Your Plant Against LightningÓ, Instruments and Control Systems, Vol. 55, No.2, pp. 31 Ð 34.
[3] Mousa, A.M. (1976). ÒShielding of High-Voltage and Extra-High-Voltage SubstationsÓ, IEEE Trans., Vol. PAS-95,No. 4, pp. 1303 Ð 1310.
[4] Sargent, M.A. (1972). ÒMonte Carlo Simulation of the Lightning Performance of Overhead Shielding Networks ofHigh Voltage StationsÓ, IEEE Trans., Vol. PAS-91, No. 4, pp. 1651 Ð 1656.
[5] Linck, H. (1975). ÒShielding of Modern Substations Against Direct Lightning StrokesÓ, IEEE Trans., Vol, PAS-90,No. 5, pp. 1674 Ð 1679.
[6] Dainwood, W.H. (March 1974). ÒLightning Protection of Substations and Switchyards Based on Streamer FlowTheoryÓ, M.Sc. Thesis, University of Tennessee, Knoxville, Tennessee.
[7] Mousa, A.M. (1991). ÒA Computer Program for Designing the Lightning Shielding Systems of SubstationsÓ, IEEETrans. on Power Delivery, Vol. 6, No. 1, pp. 143Ñ152.
[8] Anderson, J.G. (1982). ÒLightning Performance of Transmission LinesÓ, Chapter 12 (53 pp.) of Second Edition ofTransmission Line Reference Book 345 kV and Above, EPRI, Palo, Alto, California.
[9] Gilman, D.W., and Whitehead, E.R. (March 1973). ÒThe Mechanism of Lightning Flashovers on High-Voltage andExtra-High-Voltage Transmission LinesÓ, Electra, No. 27, pp. 65Ñ96.
[10] Standards Association of Australia (l983). Lightning Protection, Standard No. 1768, Sidney, Australia.
[11] Young, F.S., Clayton, J.M., and Hileman, A.R. (1963). ÒShielding of Transmission LinesÓ, IEEE Trans., Vol. 582,pp. 132Ñ154.
[12] Beck, E. (June 1962). ÒLightning Flashover on High TowersÓ, Transmission and Distribution, Vol. 14, No. 6, pp.34Ñ35.
[13] Bewley, L.V. (1963). Travelling Waves on Transmission Systems, Dover Publications, New York, N.Y. (Þrstpublished in 1933).
142 Copyright © 1996 IEEE All Rights Reserved
uthorized licensed use limited to: UNIVERSIDADE DO PORTO. Downloaded on October 13, 2009 at 10:22 from IEEE Xplore. Restrictions apply.

SHIELDING OF SUBSTATIONS IEEE Std 998-1996
A
[14] Brown Boveri Co. (1978). Switchgear Manual, 6th edition, pp. 378Ñ386, Mannheim, Germany.
[15]Griscom, S.B. (20 March 1961). ÒNew Lightning Flashover Theory ProposedÓ, Electrical World, Vol. 155, No. 12,pp. 64Ñ65.
[16] Doocy, E.S., Hard, A.R., Rawlins, C.B., and Ikegami, R. (1979). Transmission Line Reference Book: Wind-Induced Conductor Motion, EPRI, Palo Alto, California.
[17] CIGRE Working Group (1970). ÒAeolian Vibration on Overhead Lines*, CIGRE Paper No. 22-11, 21 pp.
[18] Canadian Electrical Association (July 1988). ÒInternal Damping of ACSR Conductors and Alumoweld andGalvanized Ground WiresÓ, CEA R&D; Report No. 144 T 307 (2 volumes).
[19] Canadian Standards Association (1987). Installation Code for Lightning Protection Systems, Standard No. B72-M87, Rexdale, Ontario, Canada.
[20] NFPA. (1986). Lightning Protection Code. (US) National Fire Protection Association, Code No. NFPA 78.
[21] Golde, R.H. (1941). ÒThe Validity of Lightning Tests and Scale ModelsÓ, Journal IEE, Vol. 88, Part II, No. 2, pp.67Ñ68.
Abdul M. Mousa (M Ô79, SM Ô82) received the B.Sc. and M.Sc. in Electrical Engineering from Cairo University,Cairo, Egypt, in 1965 and 1971, respectively, and received the Ph.D. in 1986 from the University of British Columbia,Vancouver, Canada. He is Senior Electrical Engineer with the Transmission Design Department, British ColumbiaHydro and Power Authority, Vancouver, B.C., Canada. Prior to joining B.C. Hydro in May 1978, he was a SeniorEngineer with the Department of Power Systems Planning and Research, Teshmont Consultants Inc., Winnipeg,Canada. He has published many papers and discussions on several subjects including lightning protection, electricÞelds at ground level under transmission lines, electrostatic and electromagnetic induction and the safety proceduresfor work on de-energized lines. Dr. Mousa is a member of the IEEE Power Engineering Society and is a registeredProfessional Engineer in the Province of Ontario and British Columbia, Canada.
R.J. (Jean) Wehling received his B.S.E.E. from the a in 1960. Following graduation he was employed for several yearsby a consulting Þrm in Abilene, Texas. In 1962 he joined the engineering staff of United Power Association in ElkRiver, Minnesota where he is supervisor of bulk substation and transmission engineering. Mr. Wehling is chairman ofthe PES Substations Committee working group dealing with direct stroke shielding of substations. He is registered inthe State of Minnesota as a professional engineer.
DISCUSSION
N. Barbeito (Florida Power Corporation, St. torture, Florida): The authors are to be commended for their work incollecting and presenting the results of the survey to the industry. As a member of Working Group E5, however, I felta need to respond to some of the editorial comments made throughout the paper. The editorial comments provided anegative overtone to the use of the Geometrical Methods. The following are my views based on our CompanyÕsexperience.
1) Florida Power Corporation (Keraunic level 80-100), has been a successfully using the Þxed Angle method ofprotection for over 30 years. The two shielding failures that were reported in the survey occurred in oldersubstations in areas which were unprotected. Protection was subsequently provided with no additionalproblems.
2) The authors made the stateroom that the reported shielding failures (35) of those using the GeometricMethods indicated that we were not achieving the degree of protection desired. I do not agree with theconclusion due to the fact that the exposure was not properly analyzed. For instance, assuming the followingconservative estimates of (Geometrical Methods):100 utilities responding
Copyright © 1996 IEEE All Rights Reserved 143
uthorized licensed use limited to: UNIVERSIDADE DO PORTO. Downloaded on October 13, 2009 at 10:22 from IEEE Xplore. Restrictions apply.

IEEE Std 998-1996 IEEE GUIDE FOR DIRECT LIGHTNING STROKE
A
Average of 50 substationsAverage of 10 years exposureShielding Failure Rate (SFR) 35 / 100 ´ 50 ´ 10 = 0.0007failure / substation-year
3) The explanation of the single failure of the EGM is speculative in nature. The fact remains that the bus wasstruck.
4) The statementÒ É EGMs were Þrst developed in response to rupees of excessive outages rates for the EHVlines that were designed using the Þxed angles or the Wagner methodÓ, is partially correct in that it does notaddress the following:a) Fixed Angle: The designer can always select a more conservative angle. At the time no consideration
was given to the additional height of the phases [23].b) Wagner Method: This method provides curves to protect structures of a maximum height of 100 ft. The
EHVs exceeded this height [11] [22] [23].
REFERENCES
[22] Armstrong, H.R. and Whitehead, E.R. (1964) ÒA Lightning Stroke PathÞnderÓ, IEEE Trans., Vol. PAS-83, No. 12,pp. 1223Ð1227.
[23] Horvath, T. (Ed.) Computation of Lightning Protection, England, Research Studies Press Ltd. 1991
Manuscript received March 3, 1992.
ABDUL M. MOUSA and R.J. WEHLING: The authors wish to thank Mr. Barbeito for his interest in this paper.WagnerÕs method is based on applying l.5´40ms voltage impulses to a scale model Wagner claimed that his testsphysically simulated what happens in nature whoa lightning strikes ground objects. We will brießy prove hereafter thatWagnerÕs claim is invalid and hope that this will convince the users of the GEOMETRICAL methods to switch toEGMÕs.
A lightning ßash usually starts by the development of a downward from the base of a cloud. This advances at arelatively low speed and it is only after an ionized path has been established cloud and earth that the fast return stroketakes place. The downward leader progresses under the inßuence of two forces: the general attraction of the groundplane with its zero-potential, and the attraction of the pockets of space charge which randomly exist in the spacesbetween clouds and ground. The path of the downward leader takes the form of discrete zigzag steps. Except for thelast step which is called the ÒÞnal jumpÓ, the movement is mainly governed by the distribution of the pockets of spacecharge; the details of the features of the ground plane being immaterial in that respect. The Þnal jump condition isreached when the average electric Þeld across, the gap between tip of downward leader and a grounded object becomeshigh enough to initiate an upward leader. The length of the gap at that instant is called the Òstriking distanceÓ.
To simplify the analysis assume the downward leader to be vertical. Consider the geometry shown in Fig. 2 and let Qbe the charge of the downward leader. If Q war smaller, the downward leader will have to get closer to ground beforebecoming able to induce upward leader, ie. the striking distance S becomes smaller. On other hand, S becomes largerif Q was larger because the Þeld across the gap will be reached while the tip of the leader is still further away from theground. From the above it follows that S is a function of Q:
(1)
When the return stroke takes place, its function is to neutralize the charge Q. Hence the current of the return stroke Iis also a function of Q:
(2)
S f1 (Q)=
I f2 (Q)=
144 Copyright © 1996 IEEE All Rights Reserved
uthorized licensed use limited to: UNIVERSIDADE DO PORTO. Downloaded on October 13, 2009 at 10:22 from IEEE Xplore. Restrictions apply.

SHIELDING OF SUBSTATIONS IEEE Std 998-1996
A
From (1) and (2),
(3)
Figure 2 ÑThe final jump to a ground object.
A ground object would not attract a lightning ßash to itself, and hence would not divert it away from other objects,unless the ßash arrives within striking distance of the ground object. The above shows that the attractive range of ashielding device (wire or mast) is a function of the amplitude of the return stroke. Consider the cue shown in Fig. 3 inwhich a bus W is located halfway between two shield wires G1 and G2, and a downward leader arrives directly abovethe bus. If the amplitude of the return stroke is small as indicated in Fig. 3A, then the lender will never get withinattractive range from the shield wires. Hence it will progress until it reaches point P1 then it strikes the bus. On theother hand, if the amplitude of the return stroke is large as indicated in Fig. 3B, then the shielding system intercept theleader at point P3 before it gets within striking distance of the bus at point P2. The above shows that no shieldingsystem can protect against all strokes. The EGM recognizes that physical fact by basing the design on the maximumstroke which would not cause ßashover if it penetrated the shielding system. On the otherhand, the GEOMETRICALmethods falsely claim that a given geometry can achieve 100% shielding.
WagnerÕs method failed to simulate the actual physical phenomenon because:
1) The Þeld across the gap is not produced by a long leader having a variable controllable charge but rather bythe magnitude of the voltage applied to an electrode having a Þxed height above the ground plane of the scalemodel. Wagner assumed that height to correspond to the height of the cloud above ground and found it to havesome effect on the results. This is one other failure of WagnerÕs method. The step-by-step development of thelightning leader clearly indicates that the striking distance (and hence the attractive range of a ground object)is independent of the height of the cloud.
2) WagnerÕs method did not and could not account for the effect of the pockets of space charge.
Figure 3 ÑEffect of amplitude of the return stroke on effectiveness of shielding.
S f3 (I)=
Copyright © 1996 IEEE All Rights Reserved 145
uthorized licensed use limited to: UNIVERSIDADE DO PORTO. Downloaded on October 13, 2009 at 10:22 from IEEE Xplore. Restrictions apply.

IEEE Std 998-1996 IEEE GUIDE FOR DIRECT LIGHTNING STROKE
A
3) Since the downward leader advances at a relatively low speed, the rate-of-rise of the electric Þeld across thegap to ground is slow and is actually of the order used in Òswitching surgeÓ tests. Since breakdown dependson the rate-of-rise, WagnerÕs use of fast 1.5´40ms surges was in error.
4) Most downward lightning leaders are negatively charged. On the other hand, Wagner used positive polarityimpulses.
If WagnerÕs method occasionally happens to produce usable results, this is only accidental. It is not true that WagnerÕsmethod has a valid application range in terms of bus heights. As shown in the closure of [7], there are low bus brightcases for which WagnerÕs method gives invalid results. The only excuse for continuing to use WagnerÕs and the FixedAngle methods was that the EGMÕs were complex. This difÞculty hats now been eliminated by the introduction ofSubshield [7].
The response to the other points raised by Mr. Barbeito is as follows:
1) About 50% of the 114 participating utilities used GEOMETRICAL methods, i.e. 57 rather 100 companies.Also tony of them were consultants or small utilities. Hence the average number of substations perrespondent should be about 25 rather than 50. Further, records are not always kept of shielding failures andthe incidents are often attributed to other causes because of the belief that the bus is effectively shielded. It isreasonable to assume that the actual number of shielding failures is twice the 35 reported cases, i.e. 70. Theabove gives a shielding failure rate of:70 / (57´25´10) = 0.005 failures / yr / substationWhile this may appear low, we should remember that a single incident at a major substation can lead to wide-spread blackouts. Further, providing effective shielding often involves little or no additional cost.
2) The explanation of the single reported failure of the EGM is not speculative; it was provided by therespondent.
3) Adopting lower shielding angles for the higher bus heights amounts to indirectly adopting the concepts of theEGM.
4) The two shielding failures reported by Florida Power Corp. were not included in the survey.5) One of the authors (A.M. Mousa) has Þrst hand knowledge of cases where shielding failures did occur more
than once on buses which are fully shielded in accordance with WagnerÕs method. Please see the closure of [7].
146 Copyright © 1996 IEEE All Rights Reserved
uthorized licensed use limited to: UNIVERSIDADE DO PORTO. Downloaded on October 13, 2009 at 10:22 from IEEE Xplore. Restrictions apply.

SHIELDING OF SUBSTATIONS IEEE Std 998-1996
A
Annex F The Dainwood method(Informative)
DainwoodÕs method (introduced in a 1974 M.Sc. thesis) is an application to the conÞgurations encountered insubstations of a method proposed in 1970 by Braunstein for use on power lines. In BraunsteinÕs method, the chargedensity along the length of the downward leader is assumed to be constant. The leader is assumed to progress in thevertical direction at a velocity equal to 0.1% of the speed of light, and the charge density is calculated as a function ofthe current of the return stroke. Wave equations are then used to calculate the strength of the electric Þeld in space atthe location of the object that is to be analyzed. Upward streamers are assumed to be generated from the object whenthe electric Þeld reaches the critical value. That critical value was set at 10 kV/cm for the surface of the ground, 3 kV/cm for shield wires, and 5 kV/cm for phase conductors. BraunsteinÕs method was not adopted by the industry in favorof the approach used by Young et al. and by Whitehead and his associates. Similarly, the adaptation to substationsproposed by Dainwood received very limited application.
Copyright © 1996 IEEE All Rights Reserved 147
uthorized licensed use limited to: UNIVERSIDADE DO PORTO. Downloaded on October 13, 2009 at 10:22 from IEEE Xplore. Restrictions apply.
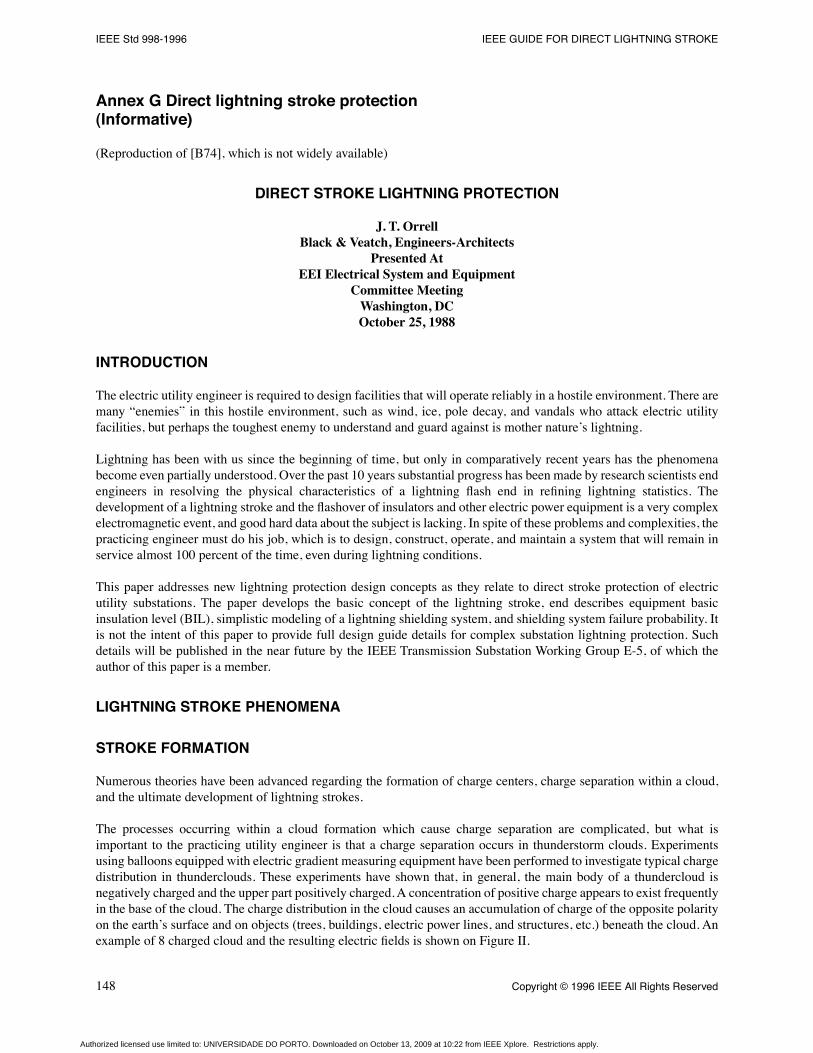
IEEE Std 998-1996 IEEE GUIDE FOR DIRECT LIGHTNING STROKE
A
Annex G Direct lightning stroke protection(Informative)
(Reproduction of [B74], which is not widely available)
DIRECT STROKE LIGHTNING PROTECTION
J. T. OrrellBlack & Veatch, Engineers-Architects
Presented AtEEI Electrical System and Equipment
Committee MeetingWashington, DCOctober 25, 1988
INTRODUCTION
The electric utility engineer is required to design facilities that will operate reliably in a hostile environment. There aremany ÒenemiesÓ in this hostile environment, such as wind, ice, pole decay, and vandals who attack electric utilityfacilities, but perhaps the toughest enemy to understand and guard against is mother natureÕs lightning.
Lightning has been with us since the beginning of time, but only in comparatively recent years has the phenomenabecome even partially understood. Over the past 10 years substantial progress has been made by research scientists endengineers in resolving the physical characteristics of a lightning ßash end in reÞning lightning statistics. Thedevelopment of a lightning stroke and the ßashover of insulators and other electric power equipment is a very complexelectromagnetic event, and good hard data about the subject is lacking. In spite of these problems and complexities, thepracticing engineer must do his job, which is to design, construct, operate, and maintain a system that will remain inservice almost 100 percent of the time, even during lightning conditions.
This paper addresses new lightning protection design concepts as they relate to direct stroke protection of electricutility substations. The paper develops the basic concept of the lightning stroke, end describes equipment basicinsulation level (BIL), simplistic modeling of a lightning shielding system, and shielding system failure probability. Itis not the intent of this paper to provide full design guide details for complex substation lightning protection. Suchdetails will be published in the near future by the IEEE Transmission Substation Working Group E-5, of which theauthor of this paper is a member.
LIGHTNING STROKE PHENOMENA
STROKE FORMATION
Numerous theories have been advanced regarding the formation of charge centers, charge separation within a cloud,and the ultimate development of lightning strokes.
The processes occurring within a cloud formation which cause charge separation are complicated, but what isimportant to the practicing utility engineer is that a charge separation occurs in thunderstorm clouds. Experimentsusing balloons equipped with electric gradient measuring equipment have been performed to investigate typical chargedistribution in thunderclouds. These experiments have shown that, in general, the main body of a thundercloud isnegatively charged and the upper part positively charged. A concentration of positive charge appears to exist frequentlyin the base of the cloud. The charge distribution in the cloud causes an accumulation of charge of the opposite polarityon the earthÕs surface and on objects (trees, buildings, electric power lines, and structures, etc.) beneath the cloud. Anexample of 8 charged cloud and the resulting electric Þelds is shown on Figure II.
148 Copyright © 1996 IEEE All Rights Reserved
uthorized licensed use limited to: UNIVERSIDADE DO PORTO. Downloaded on October 13, 2009 at 10:22 from IEEE Xplore. Restrictions apply.

SHIELDING OF SUBSTATIONS IEEE Std 998-1996
A
The electrical charge concentrations within a cloud are constrained to the size of the cloud. The cloud size, in relationto the earth, is small. Therefore, the electrical gradient in the cloud is much greater than at the earth. Because of this,an electrical discharge tends to be initiated at the cloud rather than at the ground.
The actual stroke development occurs in a two-step process. The Þrst step is ionization of the air surrounding thecharge center and the development of Òstep leadersÓ which propagate charge from the earth from the cloud is equal tothe charge (usually positive) that ßows upward from the earth. Since the propagation velocity of the return stroke is somuch greater than the propagation velocity of the step leader, the return stroke exhibits a much larger current ßow (rateof charge movement). Magnetic-link investigations on electrical transmission systems indicate that approximately 90percent of all strokes are seen as negative charge ßows to the transmission system.
The various stages of a stroke development are shown on Figure 2. Approximately 55 percent of all lightning ßashesconsist of multiple strokes which traverse the same path formed by the initial stroke. Their stepped leader has apropagation velocity much greater than that of the initial stroke (approximately 3 percent the speed of light) and isreferred as a Òdart leaderÓ
Mr. Orrell may be contacted at (913) 339-2000.
STRIKE DISTANCE
Return stroke current magnitude and strike distance (length of the last step leader) are interrelated. This follows fromthe premise that small charge centers from which low return stroke currents develop contain less energy to charge thestep leader than does a large charge center. The strike distance and the ultimate return stroke current are related by thefollowing equation from the 1982 Transmission Line Reference BookÑ345 kV and Above.
(1)
(2)
where
S = strike distance in meters, andIs = return stroke current in kiloamperes (kA).
This relationship is illustrated on Figure 3, which shows strike distance versus return stroke current, hereafter referredto as stroke current in this paper.
STROKE WAVE SHAPE AND PROBABILITIES
Neither the current magnitude nor wave shape of all lightning strokes is identical. The response of electric powerequipment to lightning surges is a function of wave shape and current magnitude. Therefore, in the design of systems,it is important to know what typical stroke wave shapes to expect, the probability of variance of these wave shapes, andthe probability of various stroke current magnitudes.
S 10 Is0.65=
Is 0.029 S1.54
=
Copyright © 1996 IEEE All Rights Reserved 149
uthorized licensed use limited to: UNIVERSIDADE DO PORTO. Downloaded on October 13, 2009 at 10:22 from IEEE Xplore. Restrictions apply.

IEEE Std 998-1996 IEEE GUIDE FOR DIRECT LIGHTNING STROKE
A
Figure 3 ÑSTRIKE DISTANCE VERSUS STROKE CURRENT
A lightning stroke is movement of electrical charge, or coulombs, from one point to another in the form of a ÒwaveÓof charge, as depicted on Figure 4. Anyone observing the passage of a lightning surge would observe a very rapidchange in the number of coulombs, followed by a much slower change in the number of coulombs as the surge passed.Observance of this event would be similar to ßoating in a calm pool of water and suddenly observing a wave of waterapproaching. As the wave passed, the observer would rise to the crest of the wave and then would drop back to hisoriginal position as the wave completely passed.
Since the deÞnition of current is the time rate of change of electrical charge, or i(t) = dq/dt, the movement of electricalcharge in a lightning stroke is current. If en observer was in a Þxed location observing the passage of a lightning wave,the time required to witness the passage of the crest of the wave would be very short. If he observed more than onestroke, he would discover that the time required to observe the passage of the crest of each wave differs. This holds trueeven among multiple strokes in any ßash. Figure 5 shows the current wave
150 Copyright © 1996 IEEE All Rights Reserved
uthorized licensed use limited to: UNIVERSIDADE DO PORTO. Downloaded on October 13, 2009 at 10:22 from IEEE Xplore. Restrictions apply.

SHIELDING OF SUBSTATIONS IEEE Std 998-1996
A
Figure 2 ÑCHARGE DISTRIBUTION AT VARIOUS STAGES OF LIGHTNING DISCHARGE
Copyright © 1996 IEEE All Rights Reserved 151
uthorized licensed use limited to: UNIVERSIDADE DO PORTO. Downloaded on October 13, 2009 at 10:22 from IEEE Xplore. Restrictions apply.

IEEE Std 998-1996 IEEE GUIDE FOR DIRECT LIGHTNING STROKE
A
Figure 4 ÑLIGHTNING WAVE CHARGE MOVEMENT
shapes of the Þrst and subsequent strokes obtained from actual measurements made by researchers at Mount SanSalvatore, Switzerland. The voltage stress created on equipment because of two different wave shapes is different foreach wave. In multiple stroke lightning strikes, there are times when the Þrst stroke creates the greatest voltage stresson electrical equipment, and there are times when the subsequent strokes create the greatest voltage stress.
Figure 5 ÑTYPICAL WAVESHAPE FOR FIRST AND SUBSEQUENT STROKES AT MOUNT SAN SALVATORE, SWITZERLAND
To compare equipment response to a lightning surge, it has been necessary for the electric power industry to developa simple expression for a lightning wave, and develop a standard wave shape. In reality, it is the strokeÕs crest currentend the rapidly rising frontal currents near crest that play the key role in determining the response of equipment tolightning surges. A realistic, but very simple approximation of a lightning current wave is a ramp current wave, asshown on Figure 6. The wave rises to crest in 1.2 microseconds, and then decays to 1/2 its crest value in 50microseconds. The wave is referenced as e 1.2 by 50 microsecond wave.
Figure 6 ÑSIMPLIFIED INDUSTRY STANDARD LIGHTNING STROKE WAVESHAPE
152 Copyright © 1996 IEEE All Rights Reserved
uthorized licensed use limited to: UNIVERSIDADE DO PORTO. Downloaded on October 13, 2009 at 10:22 from IEEE Xplore. Restrictions apply.

SHIELDING OF SUBSTATIONS IEEE Std 998-1996
A
The probabilities that a certain stroke front or rate of rise will occur are deÞned by Equations 3 and 4 from the 1982Transmission Line Reference Book.
(3)
where
P(dl/dt) = probability that a speciÞed value of dl/dt will be exceeded, anddl/dt = speciÞed current rise time in kilo-amperes per microsecond (kA/ms).
The probabilities that a certain peak current will occur in any stroke are deÞned by the following equation:
(4)
where
P(I) = probability that the peak current in anystroke will exceed I, andI = speciÞed crest current in kiloamperes(kA).
Figure 7 is e plot of Equation 4 and Figure 8 is a plot of the probability that a stroke will be within the ranges shownon the abscissa.
Figure 7 ÑPROBABILITY OF STROKE CURRENT EXCEEDING ABSCISSA
ISOKERAUNIC LEVEL
Isokeraunic level is the average number of clays per year on which thunder will be heard during a 24-hour period. Ifthunder is heard more then one time on any one day, the day is still classiÞed as one thunderÑday. The US WeatherBureau now keeps hourly weather records, and data will be available ultimately on e thunderstorm-hour basis.
The average annual isokeraunic level for locations in the United States can be determined by referring to isokeraunicmaps, on which lines of constant keraunic level are plotted similar to the altitude contour lines on s topographic map.Figure 9 is such a map of the United States showing the average annual thunderstorm activity across the USA.
P(dI/dt) 1
1dI dT¤
24---------------è ø
æ ö4
+
---------------------------------=
P(I) 1
1I
31------è ø
æ ö2.6
+
---------------------------=
Copyright © 1996 IEEE All Rights Reserved 153
uthorized licensed use limited to: UNIVERSIDADE DO PORTO. Downloaded on October 13, 2009 at 10:22 from IEEE Xplore. Restrictions apply.

IEEE Std 998-1996 IEEE GUIDE FOR DIRECT LIGHTNING STROKE
A
Figure 8 ÑSTROKE CURRRENT RANGE PROBABILITY
GROUND FLASH DENSITY
Ground ßash density (GFD) is the average number of strokes per unit area per year at any location of interest. It isusually assumed that the GFD to earth, a substation, or a transmission or distribution line is roughly proportional to theisokeraunic level at the locality. Table 1 lists equations for GFD developed by various researchers at different locationsaround the world. Most researchers have arrived at a proportional relationship ranging from 0.1 T to 0.19 T groundßashes per square kilometer per year, where T is the average annual isokeraunic level. For design of electric powerfacilities, the following equations, again from the 1982 Transmission Line Reference Book, are suggested:
(5)
or
(6)
where
N = number of ßashes to earth per square kilometer per year,Nm = number of ßashes to earth per square mile per year, andT = average annual isokeraunic level.
N 0.12 T=
Nm 0.31 T=
154 Copyright © 1996 IEEE All Rights Reserved
uthorized licensed use limited to: UNIVERSIDADE DO PORTO. Downloaded on October 13, 2009 at 10:22 from IEEE Xplore. Restrictions apply.

SHIELDING OF SUBSTATIONS IEEE Std 998-1996
A
Figure 9 ÑUSA ANNUAL ISOKERAUNIC MAP
Table 1 ÑEMPIRICAL RELATIONSHIPS BETWEEN LIGHTNING GROUND-FLASH DENSITY AND ANNUAL THUNDER-DAYS (T)
Ground FleshDensityLocation Researcher
km-2 yr-1
India 0.1T Aiya(1968)
Rhodesia 0.14T Anderson and Jenner (1954)
South Africa 0.023T1.3 Anderson/Eriksson (1981)
Sweden 0.004T2 Muller-Hillebrand (1964)
(approx)
UK aTb Stringfellow (1974)
[a=2.6±0.2x10⁻³;
b=1.9±0.1]
USA (North) 0.11T Horn and Ramsey (1961)
USA (South) 0.17T Horn and Ramsey (1961)
USA 0.1T Anderson and others (1968)
USA 0.15T Brown and Whitehead (1968)
USSR 0.036T1.3 Kolokolov and Pavlova (1972)
World (temperate climate) 0.19T Brooks (1960)
World (temperate climate) 0.15T Golds (1966)
World (tropical climate) 0.13T Brooks (1960)
Source: Anderson, J. G. et al., Transmission Line Reference Book Ñ 345 kV and Above, Palo Alto, California. Electric Power Research Institute, 1982.
Copyright © 1996 IEEE All Rights Reserved 155
uthorized licensed use limited to: UNIVERSIDADE DO PORTO. Downloaded on October 13, 2009 at 10:22 from IEEE Xplore. Restrictions apply.

IEEE Std 998-1996 IEEE GUIDE FOR DIRECT LIGHTNING STROKE
A
BASIC INSULATION LEVEL (BIL)
Basic insulation level is a term used to deÞne the ability of electrical equipment to withstand current and voltagesurges. To understand the concept of BIL ratings, it is Þrst necessary to analyze the phenomena of a traveling currentwave on an electrical line and the voltage wave that results.
TRAVELING WAVE
Earlier this paper presented a discussion of the formation of a lightning current stroke which propagates toward earth.This lightning stroke strikes the Þrst object within its strike distance (see Equation 1). When the object struck is atransmission or distribution line, the current wave propagates in two directions, as shown on Figure 10.
A line exhibits an impedance to the ßow of lightning stroke current. This impedance is called Òsurge impedance.ÓTypical values of surge impedance range from 50 ohms for underground lines to 500 ohms for a single overhead wirewith ground return. Formulas to calculate surge impedance include many factors, such as conductor bundling, corona,and distances to other conductors and shield wires. SpeciÞc formulas for line surge impedances for various line typesand conÞgurations can be found in the references.
Figure 10 ÑLIGHTNING STROKE TO POWER LINE
As a lightning current wave ßows through a line, a voltage wave is developed. This voltage wave impresses a potentialdifference between the line and ground, which is calculated as follows:
(7)
where
Es = the voltage wave, kilovolts (kV),Is = the lightning surge current, kiloamperes (kA), andZs = the line surge impedance, ohms.
The voltage wave travels along the electric power line at the velocity of light. If the ßashover capability of an insulatoris less than the magnitude of the surge voltage, the insulator will ßashover. If the insulators are able to withstand thevoltage stress without ßashover, the surge voltage wave continues to travel the line, until it reaches the end of the linewhich may be an open switch, an open underground cable elbow, or a connection to a transformer. The surgeimpedance of a transformer is very large, and therefore a transformer appears as en open circuit to traveling surgewaves. At the end of line, a surge wave has no place to go so it is reßected and travels back along the line. At the pointof reßection, the voltage stress essentially doubles as the wave returns. If transformers or insulators located at theseend-of-line locations are to remain undamaged, their insulation strength or BIL must be high enough to withstand thisdoubling of voltage wave.
Figure 11 depicts this situation in which a traveling voltage wave is reßected at an open point in the line. In QuadrantA of the Þgure, the voltage wave is shown traveling in the direction of the arrow just prior to reaching the open point.Quadrant B of the Þgure shows the leading edge of the wave reßected and the wave returning toward its original
ES 1 2 IS ZS( )¤=
156 Copyright © 1996 IEEE All Rights Reserved
uthorized licensed use limited to: UNIVERSIDADE DO PORTO. Downloaded on October 13, 2009 at 10:22 from IEEE Xplore. Restrictions apply.

SHIELDING OF SUBSTATIONS IEEE Std 998-1996
A
direction. The actual voltage wave being experienced is the sum of the forward moving end reßected wave shown bythe solid black line. In Quadrant C of the Þgure, the Peak of the wave is reßected and the voltage at the reßection pointis twice the peak value of the original wave. This is the highest voltage stress situation. Quadrant D is a Þnal depictionof the voltage wave with the major portion of the wave reßected. As before, the solid black line represents the actualwave at that point.
EQUIPMENT RATINGS
Formal equipment insulation testing was initiated during the 1930s by a Joint Committee on Insulation Coordination,composed of the American Institute of Electrical Engineers (AIEE), Edison Electric Institute (EEI), and the NationalElectrical Manufacturers Association (NEMA). TodayÕs industry standard for specifying BIL for the different voltageclassiÞcations is the result of years of equipment insulation testing within the industry. The BIL reference voltage isdeÞned as the highest surge voltage that the equipment insulation can withstand without failure or disruptivedischarge. Equipment insulation is required to satisfy industry standardized tests to demonstrate an insulation levelequal to or greater than the BIL speciÞed for each voltage insulation class.
Figure 11 ÑTRAVELING SURGE VOLTAGE WAVE
As impulse testing progressed over the years, a standard insulation testing procedure was developed. The ÒstandardÓfull-wave lightning impulse waveform speciÞed by the American National Standards Institute (ANSI) and the Instituteof Electrical and Electronic Engineers (IEEE) to be used by equipment manufacturers for insulation testing wouldsimulate traveling waves coming into the station over the transmission lines. The full-wave impulse waveform isdeÞned as a waveform that rises to the crest voltage in 1.2 microseconds and drops to 50 percent of crest voltage in 50microseconds, with both times measured from the same origin and in accordance with established standards ofimpulse testing techniques. A typical impulse wave shape is illustrated on Figure 12.
Copyright © 1996 IEEE All Rights Reserved 157
uthorized licensed use limited to: UNIVERSIDADE DO PORTO. Downloaded on October 13, 2009 at 10:22 from IEEE Xplore. Restrictions apply.

IEEE Std 998-1996 IEEE GUIDE FOR DIRECT LIGHTNING STROKE
A
Figure 12 ÑTYPICAL IMPULSE TEST WAVESHAPE
As the practice of insulation tasting has progressed, the following variations of the standard lightning impulse test haveevolved:
· Reduced Full-Wave TestÑThe reduced full wave normally has a crest voltage between 50 and 70 percent ofthe full-wave voltage.
· Chopped-Wave TestÑThe voltage impulse test is terminated after the maximum crest of the impulse waveform with a speciÞed minimum crest voltage. This test demonstrates insulation strength against a wavetraveling along the transmission line after ßashing over an insulator some distance away.
· Front-of-Wave TestÑThe voltage impulse test is terminated during the rising front of the voltage wave witha speciÞed minimum crest voltage.
A complete set of lightning impulse tests for power end distribution transformers would include the followingsequence of impulse waves:
1) One reduced full-wave test.2) Two front-of-wave tests.3) Two chopped-wave tests.4) One full-wave test.
Table 2 identiÞes the relationship between standard system voltages and the corresponding typical BILs. A naturalquestion is ÒAt what impulse current or voltage level should a lightning stroke be considered damaging or dangerous?ÓThe capabilities of electrical equipment end lines to withstand direct lightning strokes are indicated by the BILs of theparticular equipment and components. Stroke currents and voltages less than the protective insulation level arepermitted to ßow past lines or equipment. System insulation coordination considers the insulation of lines, as well asthe connected equipment insulation. The electrical equipment may have e lower BIL rating, so it would need surgearrester protection even though the line design could be considered to have essentially complete protection fromlightning.
The BIL of a piece of equipment dictates the stroke current limits of that equipment. The relationship between BIL anda prospective lightning stroke current is represented mathematically as follows:
(8)
where
Is = prospective stroke current, kA,BIL = basic lightning impulse insulation level of equipment to be protected, kV, and
IS2.0 (BIL)
ZS-----------------------=
158 Copyright © 1996 IEEE All Rights Reserved
uthorized licensed use limited to: UNIVERSIDADE DO PORTO. Downloaded on October 13, 2009 at 10:22 from IEEE Xplore. Restrictions apply.

SHIELDING OF SUBSTATIONS IEEE Std 998-1996
A
Zs = the surge impedance of a conductor which averages 300 ohms for e vertical wire remote from earth,[Selecting a Zs of 400 ohms (suitable for a phase conductor in the vicinity of ground wire) would decreasethe current values by 33 percent.]
Taking Zs as 300 ohms yields the following values of stroke currents that correspond to typical classes of BIL shownin Table 3.
Table 3 ÑSTROKE CURRENT MAGNITUDE FOR VARIOUS CLASSES OF BIL
CLASSICAL DIRECT STROKE PROTECTION
It is standard practice to attempt to shield substations and switchyards from direct lightning strokes.
BIL Class Stroke Current Magnitude Is
kV kA
110 0.73
150 1.00
200 1.33
250 1.67
350 2.33
550 3.67
650 4.33
750 5.00
900 6.00
1,050 7.00
1,300 8.67
1,400 9.33
Copyright © 1996 IEEE All Rights Reserved 159
uthorized licensed use limited to: UNIVERSIDADE DO PORTO. Downloaded on October 13, 2009 at 10:22 from IEEE Xplore. Restrictions apply.

IEEE Std 998-1996 IEEE GUIDE FOR DIRECT LIGHTNING STROKE
A
Table 2 ÑRELATIONSHIPS OF NOMINAL SYSTEM VOLTAGE TO MAXIMUM SYSTEM VOLTAGE AND BASIC LIGHTNING IMPULSE INSULATION LEVELS (BILs) FOR SYSTEM 1,100 kV AND BELOW
The method of shielding used has typically consisted of installing grounded shield wires over equipment, shieldingmasts near equipment, or a combination of the two. From studies performed by several electrical equipmentmanufacturers about 50 years ago, it was established that a grounded conductor or shielding structure casts or projectsan electrical ÒshadowÓ on the ground plane below it. Based on studies performed by Westinghouse using scale models,a relationship was developed for various heights of the shielding structures above protected objects as a function of thehorizontal separation and height of the protected objects. This method of shielding protection is commonly referred toas the ÒWagner MethodÓ and has been used by substation engineers for many years.
ApplicationNominal
SystemVoltage kV rms
Maximum SystemVoltage*
kV rms
*From ANSI C84.1-1977 and ANSI C92.2-1978
Basic Lightning Impulse Insulation
Levels in Common Use kV crest
Distribution 1.2 30
2.5 45
5.0 60
8.7 75
15.0 95
25.0 150, 125
34.5 200, 150, 125
46.0 48.3 250, 200
69.0 72.5 350, 250
Power 1.2 45, 30
2.5 60, 45
5.0 75, 60
8.7 95, 75
15.0 110, 95
25.0 150
34.5 200
46.0 48.3 250, 200
69.0 72.5 350, 250
115.0 121.0 550, 450, 350
138.0 145.0 650, 550, 450
161.0 169.0 750, 650, 650
230.0 242.0 1,050, 900, 825, 750, 650
345.0 362.0 1,175, 1,050, 900, 825
500.0 550.0 1,675, 1,550, 1,425, 1,300
765.0 800.0 2,050, 1,925, 1,800
1,100.0 1,200.0 2,425, 2,300, 2,175, 2,050
160 Copyright © 1996 IEEE All Rights Reserved
uthorized licensed use limited to: UNIVERSIDADE DO PORTO. Downloaded on October 13, 2009 at 10:22 from IEEE Xplore. Restrictions apply.

SHIELDING OF SUBSTATIONS IEEE Std 998-1996
A
Similarly, other methods of shielding protection have been based on the use of shield electrodes which provided alinear-sided circular cone of protection with speciÞc angles of the cone based on empirical data. Some 200 years ago,Benjamin Franklin observed that a 58-degree cone from a vertical air terminal would provide suitable shieldingprotection. The speciÞc angle to be used in this method has decreased over the years to the generally accepted Ò30-degree angle of protection.Ó The decrease in angle or zone of protection may be a result of recognizing the failure ofearlier criteria, according to Ralph H. Lee in the IEEE Transactions on Industrial Applications.
Both the Wagner Method and the Cone Method have notable disadvantages. Neither accurately predicts shieldingprovided by shielding structures over 90 feet high, nor account for other nearby grounded and insulated conductors. Asan example, the Empire State Building receives on the average 23 direct lightning strokes per year. The 30-degreeangle linear cone would indicate that all lower structures within the 30-degree angle of protection are shielded by thetaller building. What the method does not explain is why the lower structures well within the zone of protection havesustained direct strokes or why these tall structures also receive direct strokes below their tops (side strokes). Lee alsostates in another source that it is such reports which have reduced the credibility of the lightning protection capabilityof higher objects in terms of the linear cone principle.
ELECTROGEOMETRICAL MODEL
Shielding systems developed using classical methods of determining the necessary shielding for direct strokeprotection of substations have historically provided a fair degree of protection. However, designers were somewhat ata loss when asked to quantify their designs. They could not answer such questions as ÒWhat is the probability of failureof the designed shielding system?Ó or ÒHow many years should the substation statistically operate before a shieldingfailure occurs?Ó or ÒIs the system overdesigned? underdesigned?Ó As transmission voltages increased to the 345 kVlevels and above, and as transmission structure heights increased accordingly, transmission line designers becameincreasingly aware of two important facts:
· Classical shielding angles which had previously been used in the design of lower voltage transmission lines,and consequently lower height structures, would not provide the stroke protection expected for the highervoltage lines.
· The impact of an EHV transmission line tripout because of lightning was very severe. The severity wasmeasured both in cost and in unacceptable system performance without the transmission line.
These problems prompted new investigations and studies into the nature of a lightning stroke, and into ways ofmodeling a transmission line so that the designer could quantify the expected performance of the design. Oneextremely signiÞcant research project was Edison Electric Institute (EEI) Research Project RP 50, publication 72-900,published February 16, 1971. Performed by E. R. Whitehead, the project included a theoretical model of atransmission system subject to direct strokes, development of analytical expressions of performance of the line, andsupporting Þeld data which veriÞed the theoretical model and analyses. The model of the system is referred to as theelectrogeometrical model.
Recently, the electrogeometrical model has been carried a step further end applied to the protection of buildingstructures and electric substations. Much of the conceptual work in this area has been performed by Ralph H. Lee, whohas developed the Òrolling sphereÓ technique, a simpliÞed technique of applying the electrogeometric theory tobuildings and electric substations.
PROTECTION AGAINST STROKE CURRENT Is
The electrogeometrical model capitalizes on the fact that electric power equipment, because of its BIL rating, isdesigned to adequately handle some lightning surge current. This magnitude of stroke current, Is, can be calculatedusing Equation 8 or Table 2. The stroke distance for a stroke current Is can be determined from Equation 1 or Figure 3.
Figures 13 and 14 show the geometrical model of a substation shield mast, the ground plane, the strike distance, andthe zone of protection. The Þgures also show a line parallel to, and a distance S above, the ground plane. It also shows
Copyright © 1996 IEEE All Rights Reserved 161
uthorized licensed use limited to: UNIVERSIDADE DO PORTO. Downloaded on October 13, 2009 at 10:22 from IEEE Xplore. Restrictions apply.

IEEE Std 998-1996 IEEE GUIDE FOR DIRECT LIGHTNING STROKE
A
an arc of radius S which touches the mast and has its center on the line a distance S above the ground plane. This arcdescribes the points at which the shield mast provides protection against the stroke current Is. The zone below the arcis the protected zone for stroke current Is. Step leaders which result in stroke current Is and which descend outside thepoint where the arc is tangent to the ground will strike the ground by virtue of the stroke distance S. Step leaders whichresult in stroke current Is and which descend inside the point where the arc is tangent to the ground will strike the shieldmast, provided all other objects are within the protected zone.
Figure 13 ÑSHIELD MAST PROTECTION FOR STROKE CURRENT Is (ELEVATION VIEW)
Figure 14 ÑSHIELD MAST PROTECTION FOR STROKE CURRENT Is (ELEVATION VIEW)
The greatest height of shield mast which will provide protection for stroke currents equal to Is is S. Increasing theshield height from Hs to the maximum height provides only e small increase in the zone of protection. The protectionzone can be visualized as the surface of a sphere with radius S which is rolled toward the mast until touching the mast.As the sphere is rolled around the mast, it deÞnes e three-dimensional surface of protection. It is this concept which hasled to the name Òrolling sphereÓ for simpliÞed applications of the electrogeometrical model. This concept is discussedfurther in the last section of this paper.
PROTECTION AGAINST STROKE CURRENTS GREATER THAN Is
The previous section of this paper demonstrated the protection provided for a stroke current Is. A lightning strokecurrent, however, has an inÞnite number of possible magnitudes. Thus, will the system provide protection at otherlevels of stroke current magnitude? Consider a stroke current Is1 with magnitude greater than Is. Strike distance,determined from Equation 1, is S1. The geometrical model for this condition is shown on Figure 15. The Þgure showsboth arcs of protection for stroke current Is1 and for the previously discussed Is. The Þgure shows that the zone ofprotection provided by the mast for stroke current Is1 is GREATER than the zone of protection provided by the mastfor stroke current Is. Step leaders which result in stroke current Is1 and which descend outside the point where the arcis tangent to the ground will strike the ground. Step leaders which result in stroke current Is1 and which descend insidethe point where the arc is tangent to the ground will strike the shield mast, provided all other objects are within the S1protected zone. Again, the protective zone can be visualized as the surface of a sphere touching the mast. In this case,the sphere has a radius S1.
162 Copyright © 1996 IEEE All Rights Reserved
uthorized licensed use limited to: UNIVERSIDADE DO PORTO. Downloaded on October 13, 2009 at 10:22 from IEEE Xplore. Restrictions apply.

SHIELDING OF SUBSTATIONS IEEE Std 998-1996
A
PROTECTION AGAINST STROKE CURRENTS LESS THAN Is
It has been shown that a shielding system which provides protection at the stroke current level Is provides even betterprotection for larger stroke currents. A question which arises now is ÒWill stroke currents less than Is penetrate theshield system and strike equipment?Ó To answer this question, consider a stroke current Iso with magnitude less
Figure 15 ÑSHIELD PROTECTION MAST PROTECTION FOR STROKE CURRENT Is1 (ELEVATION VIEW)
than Is. Strike distance, determined from Equation 1, is So. Figures 16 and 17 show the geometrical model for thiscondition and shows arcs of protection for both stroke current Iso and for Is. The Þgure shows that the zone ofprotection provided by the mast for stroke current Iso is less than the zone of protection provided by the mast for strokecurrent Is. A portion of the equipment protrudes above the dashed arc or zone of protection for stroke current Iso. Stepleaders which result in stroke current Iso end which descend outside of the point where the arc is tangent to the groundwill strike the ground. However, some step leaders which result in stroke current Iso and which descend inside the pointwhere the arc is tangent to the ground could strike the equipment. This is best shown in the plan view of protectivezones shown on Figure 16. Step leaders for stroke current Iso which descend inside the indicated protective zone forequipment which is ÒhÓ in height will strike the mast. Step leaders for stroke current Iso which descend inside thecross-hatched area will strike equipment which is ÒhÓ in height in the area. If, however, the value of Is was selectedbased on the BIL level of equipment used in the substation, stroke current Iso should cause no damage to equipment.
FAILURE PROBABILITY
For the three conditions described previously in this paper, there should theoretically be no equipment failuresresulting from direct strokes. This is because only those strokes which could produce a surge voltage wave less than theBIL of the equipment were able to penetrate the shielding system and these strokes should, therefore, cause noproblem. Unfortunately, substation shielding which would provide such ideal protection is not always economicallypractical. This is especially true with substation equipment BIL levels below 550 kV, which is always the case withdistribution substations. The designer is then faced with the problem of Þrst determining the level of failure risk he iswilling to base the design on, then developing a design which will meet this criteria. The following information furtherdiscusses the unprotected area of a design, and application of calculations to determine expected failure rates.
Copyright © 1996 IEEE All Rights Reserved 163
uthorized licensed use limited to: UNIVERSIDADE DO PORTO. Downloaded on October 13, 2009 at 10:22 from IEEE Xplore. Restrictions apply.

IEEE Std 998-1996 IEEE GUIDE FOR DIRECT LIGHTNING STROKE
A
Figure 16 ÑSHIELD MAST PROTECTION FOR STROKE CURRENT Iso (PLAN VIEW)
Figure 17 ÑSHIELD MAST PROTECTION FOR STROKE CURRENT Iso (ELEVATION VIEW)
UNPROTECTED AREA
Figure 16 can be used to visualize an unprotected area, assuming that equipment is sized and located as shown, andthat, based on equipment BIL levels, equipment can withstand stroke currents less than Iso. The associated strikedistance is So. Based on the layout, the shield mast will provide protection for all stroke currents greater than Is.However, those stroke current magnitudes between Iso and Is could reach equipment and would be expected to causedamage. The unprotected area for this condition would be the cross-hatched area shown on Figure 16.
PROBABILITY OF STROKES CAUSING EQUIPMENT DAMAGE
Equation 4 of Figure 7 can be used to determine the probability that any stroke will be greater than Is, which is the levelabove which the shield masts will intercept the stroke. This probability is P(Is). The same equation and/or Þgure canbe used to determine the probability that the stroke will be greater than Iso, where Iso is the level of stroke currentwhich can be handled by the equipment based on its BIL. This probability is P(Iso). Probability that a stroke is less thanIs, is 1.0 minus P(Is) or P(< Is). Probability that a stroke is less than Is0 is 1.0 minus P(Iso) or P(< Iso). For all lightningstrokes which descend upon the cross-hatched area of Figure 16, the probability that equipment damage will occur isP(< Is) - P(< Iso).
These probabilities can best be demonstrated by the following example:
· Assuming the equipment BIL is 550 kV, the allowable stroke current is 3.87 kA, (Table 3)· Assuming the strike distance S, above which protection is provided, is 60 meters, the stroke current above
which protection is provided is 15.88 KA. (Equation 2)· Using Equation 4 or Figure 7, the probability that a stroke will exceed 3.67 kA is 0.996.· Using Equation 4 or Figure 7, the probability that a stroke will be less then 3.67 kA is 1.0-0.996 = 0.004.· Using Equation 4 or Figure 7, the probability that a stroke will exceed 15.88 kA is 0.851.· Using Equation 4 or Figure 7, the probability that a stroke will be less than 15,88 kA is 1.0-0.851 = 0.149.
164 Copyright © 1996 IEEE All Rights Reserved
uthorized licensed use limited to: UNIVERSIDADE DO PORTO. Downloaded on October 13, 2009 at 10:22 from IEEE Xplore. Restrictions apply.

SHIELDING OF SUBSTATIONS IEEE Std 998-1996
A
· Resulting in the probability that a stroke which descends upon the unprotected area will cause equipmentdamage and failure is 0.149-0.004 = 0.145 or 14.5 percent.
FAILURE RATE
The substation designer is basically concerned with the rate of failure of the shielding design, or the number of yearsexpected between failures. In the previous section of this paper, the methodology was presented for determining theprobability that a stroke in the unprotected area would cause failure. By knowing the number of strokes expected todescend upon the area, the failure rate can be easily determined.
The number of strokes expected in the general area of the substation is the ground ßash density (GFD). GFD iscalculated using Equation 5. The number of strokes expected to descend upon the area is then the GFD times theunprotected area. Finally, the annual failure rate is the product of the number of strokes to the area times the probabilitythat the stroke in the area will cause failure.
The calculation of failure rate can best be demonstrated by continuing the example begun in the previous section.
· Assuming the outside radius of the unprotected area is 35 meters and that the inside radius of the unprotectedarea is 22 meters, the unprotected area is p [(352-222)] = 2,328 square meters or 2.328 ´ 10-3 squarekilometers.
· Assuming the isokeraunic level is 50 TSD (values across the USA can be read from Figure 9), the GFD(Equation 5) is 6.0 strokes per square kilometer.
· The annual number of strokes expected to descend into the unprotected area is 6.0 ´ 2.328 ´ 10-3 = 0.01397strokes/year.
· Using the 0.145 probability developed in the previous section, the annual expected number of equipmentfailures due to direct lightning strokes is 0.01397 ´ 0.145 = 0.00203 failures/year or 494 years per failure.
The above calculated failure rate would be for the simpliÞed single mast substation described in the example. If autility had 20 such substations of identical design scattered throughout its system, the total system substation failurerate due to direct strokes would be 494 ¸ E 20 = 24.7 years per failure.
Typically, substation designers consider a total system failure rate in this order of magnitude as acceptable.
MULTIPLE SHIELDING ELECTRODES
The electrogeometric modeling concept of direct stroke protection has been demonstrated for a single shield mast. Theconcept can be applied to one, or a group, of horizontal shield wires, as well as multiple shield masts. Figure 18 showsthis application considering two masts in a multiple
Figure 18 ÑMULTIPLE SHIELD MAST PROTECTION FOR STROKE CURRENT Is
Copyright © 1996 IEEE All Rights Reserved 165
uthorized licensed use limited to: UNIVERSIDADE DO PORTO. Downloaded on October 13, 2009 at 10:22 from IEEE Xplore. Restrictions apply.

IEEE Std 998-1996 IEEE GUIDE FOR DIRECT LIGHTNING STROKE
A
shield mast system. The arc of protection for stroke current Is is shown for each mast. The dashed arcs represent thosepoints at which a descending step leader for stroke current Is will be attracted to either Mast No. 1 or Mast No. 2. Theprotected zone between the masts is deÞned by an arc of radius S with the center at the intersection of the two dashedarcs. The protective zone can again be visualized as the surface of e sphere with radius S which is rolled toward a mastuntil touching the mast, then rolled up and over the mast such that it would be supported by the two masts. The dashedlines would be the locus of the center of the sphere as it is rolled across the substation surface. Using the concept of arolling sphere of the proper radius, the protected area of an entire substation can be determined. This can be applied toany group of different height shield masts, shield wires, or combination of the two.
CONCLUSION
This paper has assimilated technical information from several sources to develop an analytical method for design ofdirect stroke protection of substation equipment. Using the information provided in this paper, a designer canÒquantityÓ the statistical failure rates of various designs, and can make design and economic decisions based on thisinformation. The information shown in this paper will, to a degree, be incorporated into the new IEEE design guide fordirect stroke protection of substations.
BIBLIOGRAPHY
Anderson, J. G., et el., Transmission Line Reference BookÑ345 kV and Above, Palo Alto, California, Electric PowerResearch Institute, 1982.
Anderson, J. G., et el., Transmission Line Reference BookÑ345 kV and Above, Palo Alto, California, Electric PowerResearch Institute, 1975.
Cianos, N., and E. T. Pierce, ÒA Ground-Lightning Environment for Engineering Usage,Ó Stanford Research Institute,Technical Report 1, August 1972.
Fink, D. B., and H. W. Beaty, Standard Handbook for Electrical Engineers, Eleventh Ed., New York, McGraw-Hill,1978.
ÒGeneral Requirements for Liquid-immersed Distribution, Power, and Regulating Transformers,Ó American NationalStandards Institute, ANSI/IEEE C57.12, New York, 1980.
Gilman, D. W., and E. R. Whitehead, ÒThe Mechanism of Lightning Flashover on High Voltage and Extra-HighVoltage Transmission LinesÓ Electra, No. 27, March 1973, pp. 65Ð96.
ÒIEEE Standard for Surge Arresters for AC Power Circuits,Ó American National Standards Institute, ANSI/IEEEC62.1, New York, 1981.
Lee, R. H., ÒLightning Protection of Buildings,Ó IEEE Transactions on Industrial Applications, Vol. 1A-15, No. 3,May/June 1979, pp. 236Ð240.
Lee, R. H., ÒProtection Zone for Buildings Against Lightning Strokes Using Transmission Line Protection Practice,ÓIEEE Industrial & Commercial Power Systems Conference, May 1977.
Lee, R. H., ÒProtect Your Plant Against Lightning,Ó Instruments and Control Systems, February 1982, pp. 31Ð34.
Linck, H., ÒShielding of Modern Substations Against Direct Lightning Strokes,Ó IEEE Transactions, Vol. PAS-94,No. 5, September/October 1975, pp. 1674Ð1679.
ÒPower SystemsÑInsulation Coordination,Ó American National Standards Institute, ANSI C92.1-1982, New York,1982.
166 Copyright © 1996 IEEE All Rights Reserved
uthorized licensed use limited to: UNIVERSIDADE DO PORTO. Downloaded on October 13, 2009 at 10:22 from IEEE Xplore. Restrictions apply.

SHIELDING OF SUBSTATIONS IEEE Std 998-1996
A
ÒTechniques for Dielectric Tests,Ó American National Standards Institute, ANSI C68.1, New York, 1968.
Wagner, C. F., et al., Electrical Transmission and Distribution Reference Book, Fourth Ed., Westinghouse ElectricCorp., 1964.
Wagner, C. F., G. D. McCann, and C. M. Lear, ÒShielding of Substations,Ó AIEE Transactions, Vol. 61, February1942, pp. 96Ð99.
Whitehead, E. R., ÒMechanism of Lightning Flashover,Ó EEI Research Project RP 50, Pub. 72-900, Illinois Institute ofTechnology, February 1971.
The technical content in this paper has resulted from research of numerous literature resources on the subject oflightning and lighting protection. The signiÞcant articles and texts used to develop this paper are listed in thebibliography of this paper. The author of this paper would like to acknowledge the research and work performed bythose individuals responsible for the literature in the bibiliography.
The author also acknowledges his follow members of the IEEE Transmission Substation Working Group E-5. Thisworking group is preSently developing a new guide for direct stroke protection of substations. Much of the workpresented in this paper is currently being adapted for use in the new guide.
Copyright © 1996 IEEE All Rights Reserved 167
uthorized licensed use limited to: UNIVERSIDADE DO PORTO. Downloaded on October 13, 2009 at 10:22 from IEEE Xplore. Restrictions apply.


![136 IEEE TRANSACTIONS ON ELECTROMAGNETIC …...tial role of lightning in the Sago disaster [2]–[5]. The coupling mechanisms that may have brought lightning energy into the sealed](https://static.fdocuments.net/doc/165x107/5fd0f608f04cca5cd83f55f0/136-ieee-transactions-on-electromagnetic-tial-role-of-lightning-in-the-sago.jpg)