IEA Workshop, San Diego October 2003 Summary of the European SERF-3 Programme David Ward, Ian Cook...
21
IEA Workshop, San Diego October 2003 IEA Workshop, San Diego October 2003 Summary of the European SERF-3 Summary of the European SERF-3 Programme Programme David Ward, Ian Cook Culham Science Centre on behalf of GianCarlo Tosato & the SERF Team This work was jointly funded by the EPSRC and by EURATOM
-
date post
21-Dec-2015 -
Category
Documents
-
view
212 -
download
0
Transcript of IEA Workshop, San Diego October 2003 Summary of the European SERF-3 Programme David Ward, Ian Cook...
IEA Workshop, San Diego October 2003IEA Workshop, San Diego October 2003
Summary of the European SERF-3 Summary of the European SERF-3 ProgrammeProgramme David Ward, Ian Cook
Culham Science Centre
on behalf of GianCarlo Tosato & the SERF Team
This work was jointly funded by the EPSRC and by EURATOM
Internal Costs of Fusion ElectricityInternal Costs of Fusion Electricity
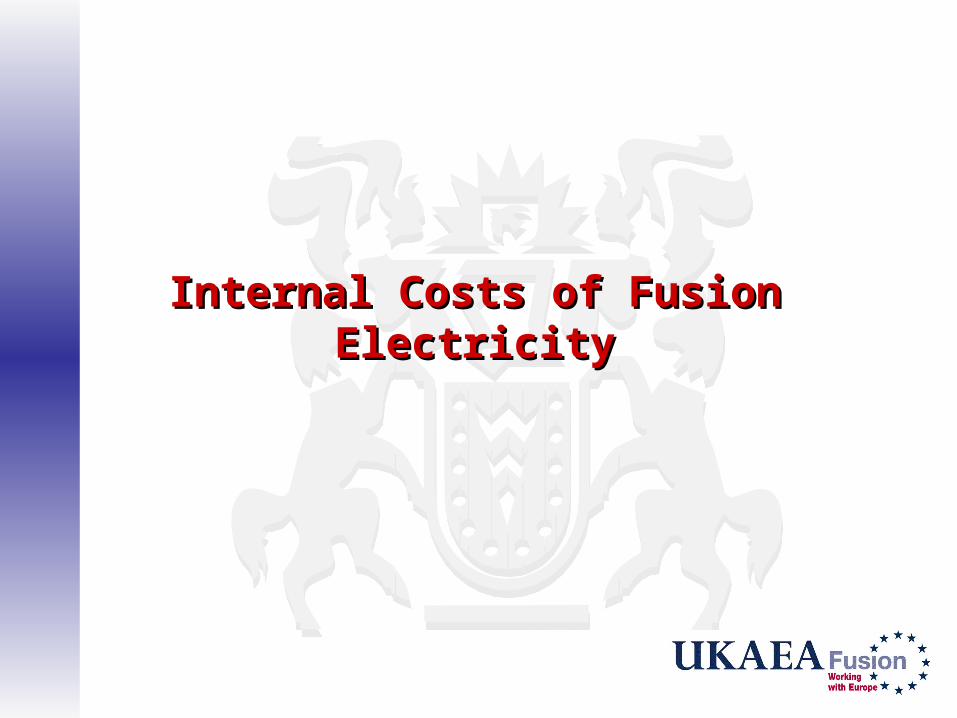
Can a fusion power plant load-follow?Can a fusion power plant load-follow?
0
10
20
30
40
0 0.5 1 1.5 2
Pnet(GW)
Q
Frecirc(%)
Yes
(Economic penalty at operating below design power)

International benchmarking studies of fusion International benchmarking studies of fusion costscosts
0
500
1000
1500
2000
2500
Ca
pit
al c
os
t (M
$) ARIES RS
PROCESS
EU and US cost assessments similar overall for the same assumptions. Some notable exceptions in detailed breakdown of components
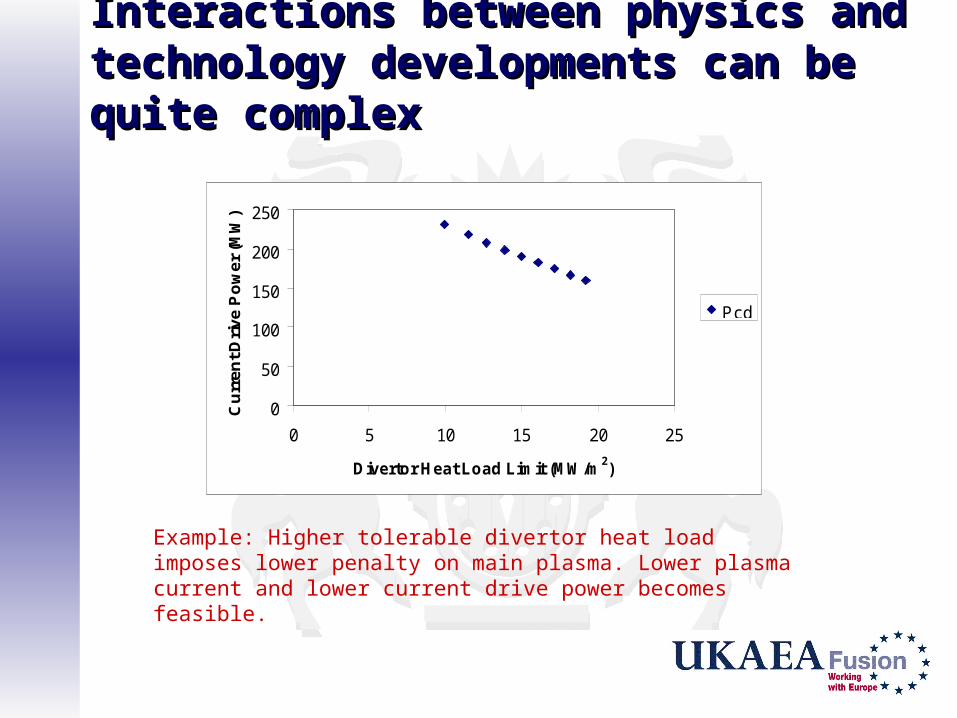
Interactions between physics and technology Interactions between physics and technology developments can be quite complexdevelopments can be quite complex
0
50
100
150
200
250
0 5 10 15 20 25
Divertor Heat Load Limit (MW/m2)
Cu
rre
nt
Dri
ve
Po
we
r (M
W)
Pcd
Example: Higher tolerable divertor heat load imposes lower penalty on main plasma. Lower plasma current and lower current drive power becomes feasible.

External Costs of Fusion ElectricityExternal Costs of Fusion Electricity
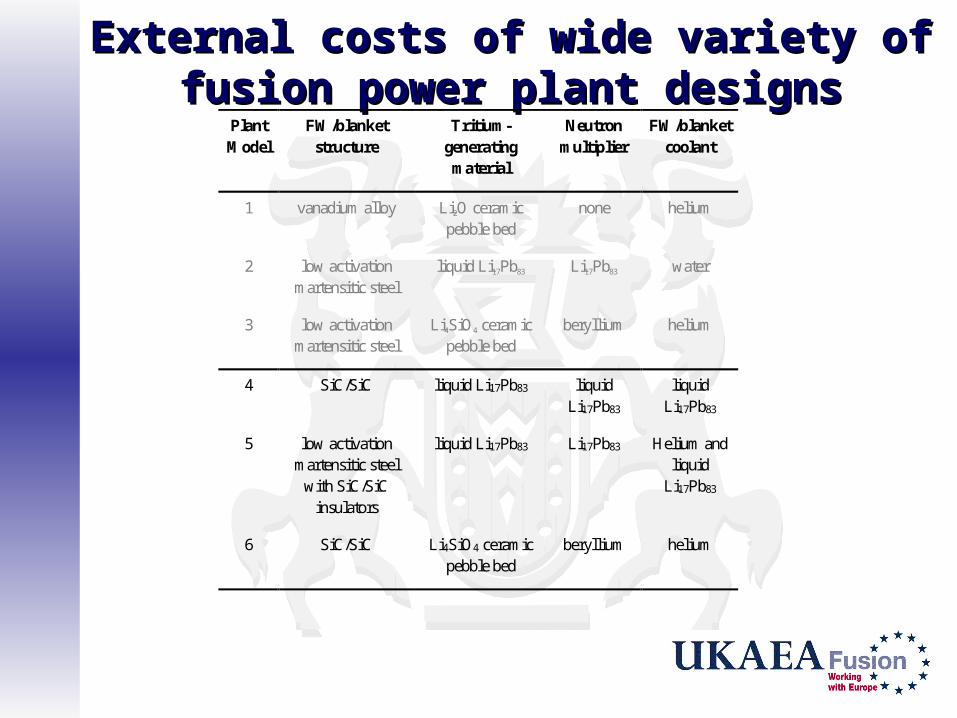
External costs of wide variety of fusion power External costs of wide variety of fusion power plant designsplant designs
PlantModel
FW/blanketstructure
Tritium-generatingmaterial
Neutronmultiplier
FW/blanketcoolant
1 vanadium alloy Li2O ceramicpebble bed
none helium
2 low activationmartensitic steel
liquid Li17Pb83 Li17Pb83 water
3 low activationmartensitic steel
Li4SiO4 ceramicpebble bed
beryllium helium
4 SiC/SiC liquid Li17Pb83 liquidLi17Pb83
liquidLi17Pb83
5 low activationmartensitic steel
with SiC/SiCinsulators
liquid Li17Pb83 Li17Pb83 Helium andliquid
Li17Pb83
6 SiC/SiC Li4SiO4 ceramicpebble bed
beryllium helium
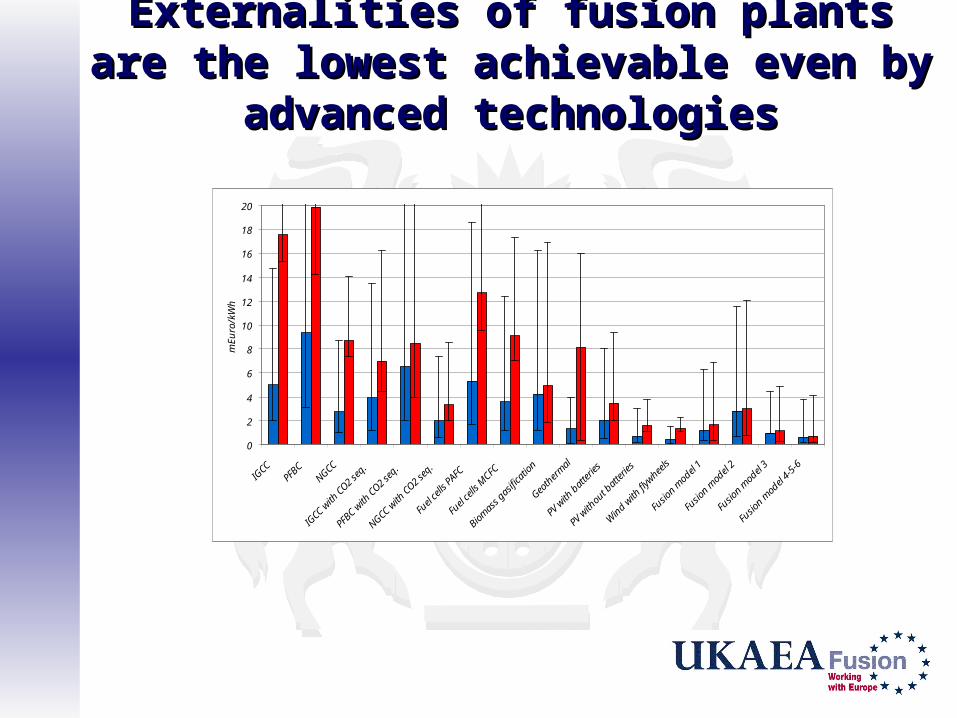
Externalities of fusion plants are the lowest Externalities of fusion plants are the lowest achievable even by advanced technologiesachievable even by advanced technologies
0
2
4
6
8
10
12
14
16
18
20
IGCC
PFBC
NGCC
IGCC w
ith C
O2 se
q.
PFBC with
CO2
seq.
NGCC with
CO2
seq.
Fuel c
ells
PAFC
Fuel c
ells
MCFC
Biomas
s ga
sifica
tion
Geoth
erm
al
PV with
bat
terie
s
PV with
out b
atte
ries
Wind
with
flyw
heels
Fusion
mod
el 1
Fusion
mod
el 2
Fusion
mod
el 3
Fusion
mod
el 4-
5-6
mE
uro/
kWh
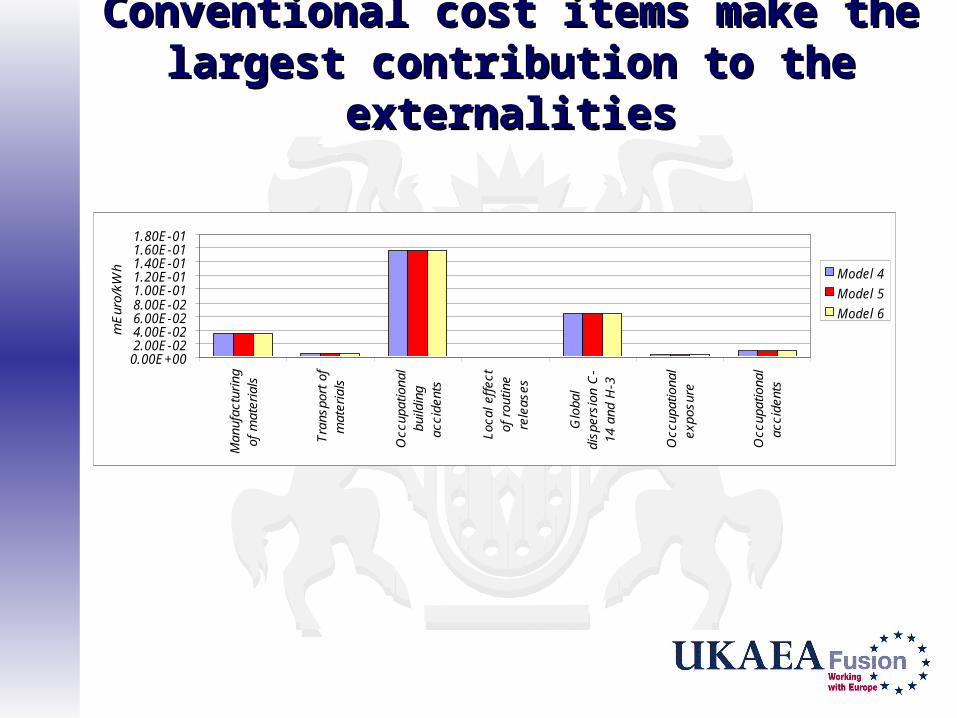
Conventional cost items make the largest Conventional cost items make the largest contribution to the externalitiescontribution to the externalities
0.00E+002.00E-024.00E-026.00E-028.00E-021.00E-011.20E-011.40E-011.60E-011.80E-01
Man
ufac
turi
ngof
mat
eria
ls
Tra
nspo
rt o
fm
ater
ials
Occ
upat
iona
lbu
ildin
gac
cide
nts
Loca
l eff
ect
of r
outin
ere
leas
es
Glo
bal
disp
ersi
on C
-14
and
H-3
Occ
upat
iona
lex
posu
re
Occ
upat
iona
lac
cide
nts
mE
uro/
kWh Model 4
Model 5
Model 6
Fusion as Part of the Energy SystemFusion as Part of the Energy System
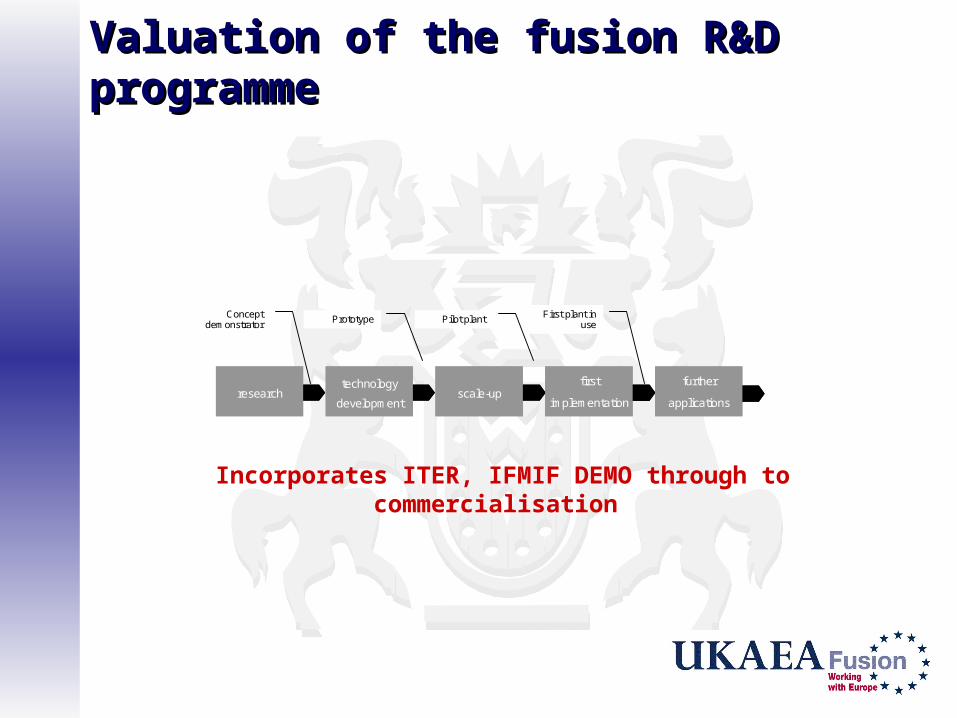
Valuation of the fusion R&D programmeValuation of the fusion R&D programme
technology
developmentscale-up
first
implementation
further
applicationsresearch
technology
developmentscale-up
first
implementation
further
applicationsresearch
Conceptdemonstrator Prototype Pilot plant First plant in
use
Incorporates ITER, IFMIF DEMO through to commercialisation
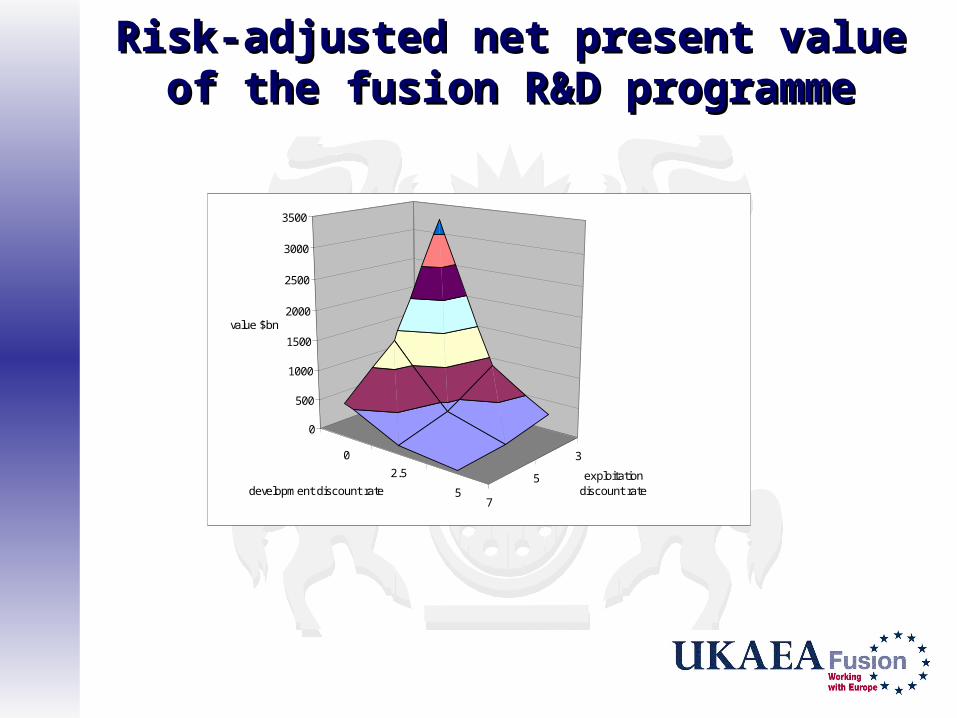
Risk-adjusted net present value of the fusion Risk-adjusted net present value of the fusion R&D programmeR&D programme
5
2.5
0 3
5
7
0
500
1000
1500
2000
2500
3000
3500
value $bn
development discount rateexploitation
discount rate
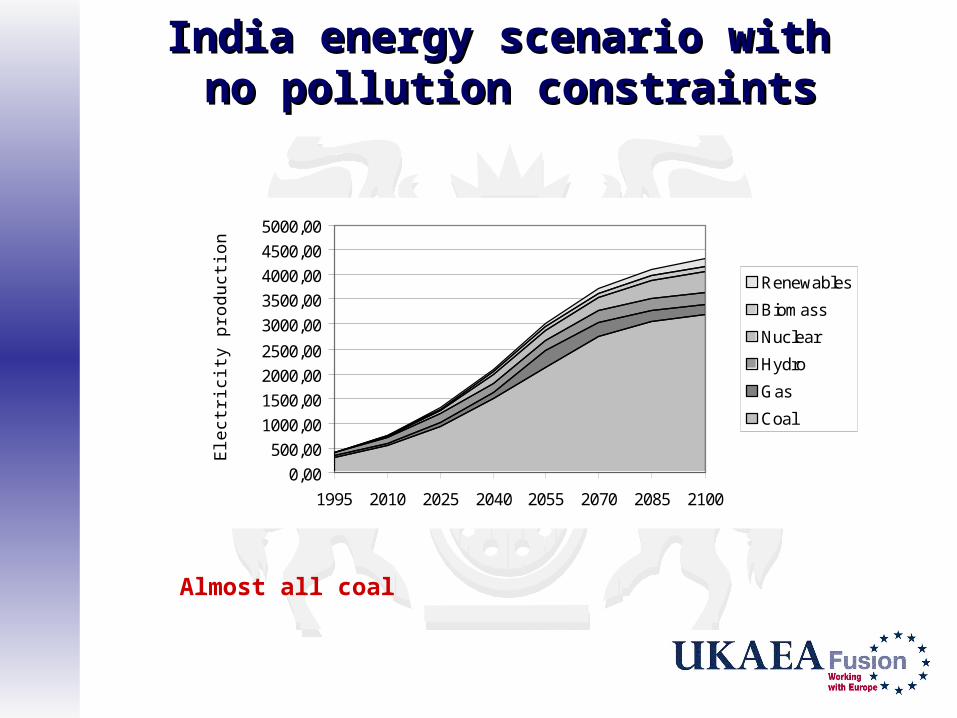
India energy scenario with India energy scenario with no pollution constraintsno pollution constraints
Almost all coal
0,00
500,00
1000,00
1500,00
2000,00
2500,00
3000,00
3500,00
4000,00
4500,00
5000,00
1995 2010 2025 2040 2055 2070 2085 2100
Ele
ctric
ity p
rodu
ctio
n [T
Wh]
.
Renewables
Biomass
Nuclear
Hydro
Gas
Coal

India energy scenario with COIndia energy scenario with CO22 restriction restriction
0,00
500,00
1000,00
1500,00
2000,00
2500,00
3000,00
3500,00
4000,00
4500,00
5000,00
1995 2010 2025 2040 2055 2070 2085 2100
Ele
ctric
ity P
rodu
ctio
n [T
Wh]
.
Renewables
Biomass
Fusion
Nuclear
Hydro
Gas
Coal
Low coal, gas takes over, others expand including fusion
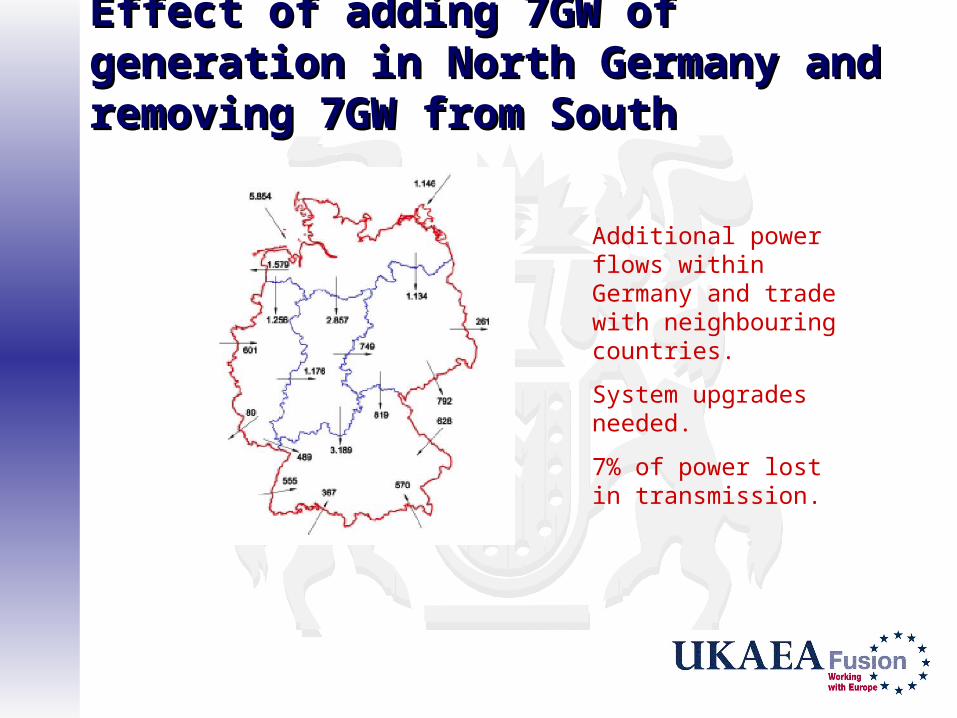
Effect of adding 7GW of generation in North Effect of adding 7GW of generation in North Germany and removing 7GW from SouthGermany and removing 7GW from South
Additional power flows within Germany and trade with neighbouring countries.
System upgrades needed.
7% of power lost in transmission.

Fusion and Public OpinionFusion and Public Opinion
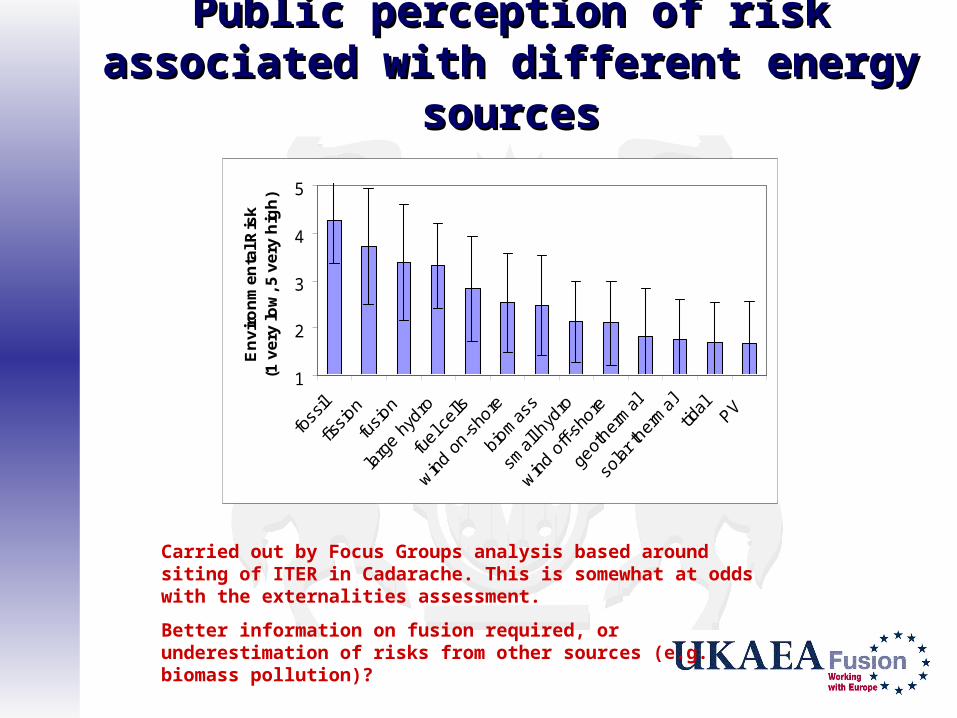
Public perception of risk associated with Public perception of risk associated with different energy sourcesdifferent energy sources
1
2
3
4
5
En
vir
on
me
nta
l Ris
k
(1 v
ery
low
, 5 v
ery
hig
h)
Carried out by Focus Groups analysis based around siting of ITER in Cadarache. This is somewhat at odds with the externalities assessment.
Better information on fusion required, or underestimation of risks from other sources (e.g. biomass pollution)?
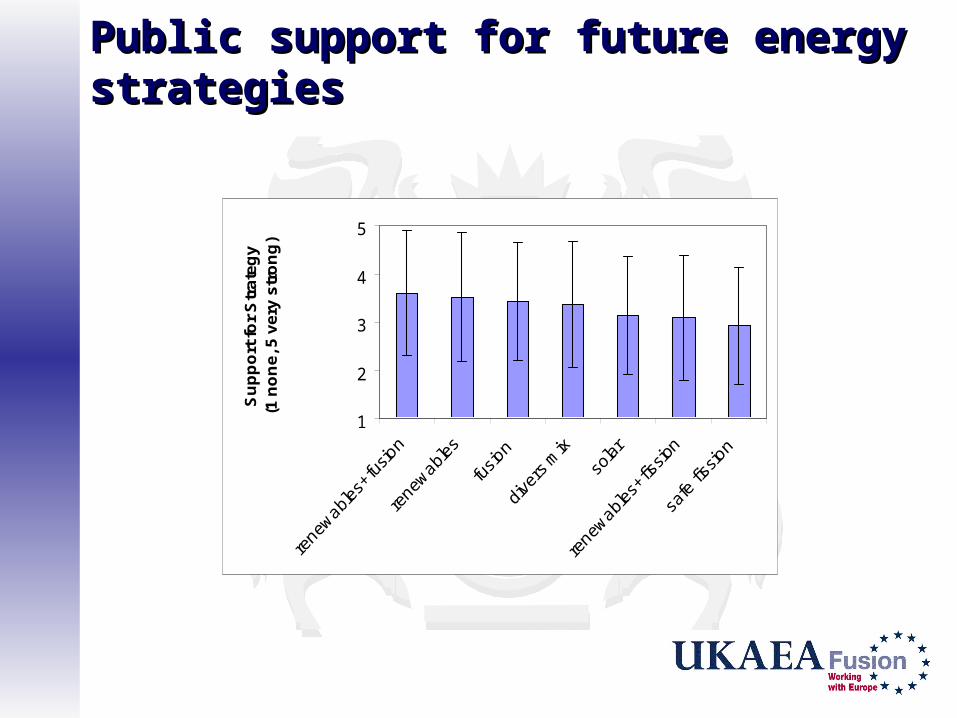
Public support for future energy strategiesPublic support for future energy strategies
1
2
3
4
5S
up
po
rt f
or
Str
ate
gy
(1
no
ne
, 5 v
ery
str
on
g)
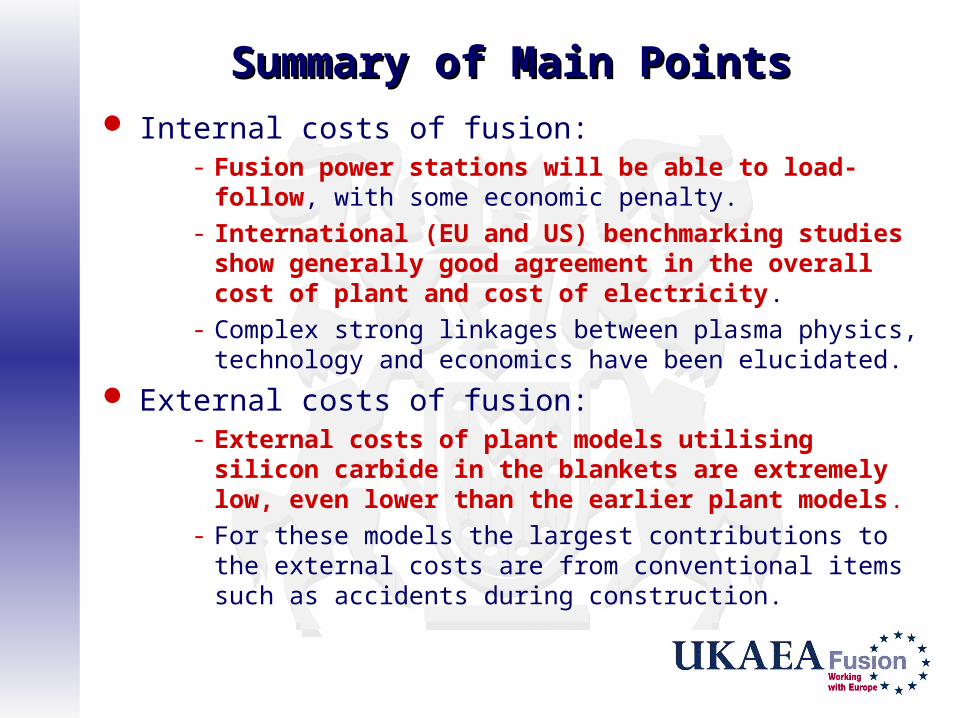
Summary of Main PointsSummary of Main Points Internal costs of fusion:
- Fusion power stations will be able to load-follow, with some economic penalty.
- International (EU and US) benchmarking studies show generally good agreement in the overall cost of plant and cost of electricity.
- Complex strong linkages between plasma physics, technology and economics have been elucidated.
External costs of fusion:- External costs of plant models utilising silicon carbide in
the blankets are extremely low, even lower than the earlier plant models.
- For these models the largest contributions to the external costs are from conventional items such as accidents during construction.
Summary of Main Points (2)Summary of Main Points (2) Fusion as part of the energy system:
- The expected net present value of fusion development, derived from a probabilistic analysis, is substantially positive, in spite of the fact that successful commercial realisation is not certain.
- Modelling of the future energy market in India, with pollution constraints, shows that the growth in coal use is suppressed, in spite of the large growth in electricity consumption, and fusion is introduced.
- Looking at a future electricity network as a whole there is additional value in low‑carbon energy sources, such as fusion, that can provide firm power in diverse geographical locations. This additional value derives from transmission and network stability considerations.
Summary of Main Points (3)Summary of Main Points (3)
Fusion and public opinion:- There is a generally favourable public view of fusion as
part of the future energy system, although there are apparent deficiencies in the information that is reaching the public.