IDFC PRESENTATION TO SMALL BUSINESS DEVELOPMENT PORTFOLIO COMMITTEE IDFC PRESENTATION TO SMALL...
23
IDFC IDFC PRESENTATION TO PRESENTATION TO SMALL BUSINESS DEVELOPMENT SMALL BUSINESS DEVELOPMENT PORTFOLIO COMMITTEE PORTFOLIO COMMITTEE
-
Upload
clara-west -
Category
Documents
-
view
218 -
download
4
Transcript of IDFC PRESENTATION TO SMALL BUSINESS DEVELOPMENT PORTFOLIO COMMITTEE IDFC PRESENTATION TO SMALL...

IDFC IDFC PRESENTATION TOPRESENTATION TO
SMALL BUSINESS DEVELOPMENTSMALL BUSINESS DEVELOPMENT
PORTFOLIO COMMITTEEPORTFOLIO COMMITTEE
IDFC IDFC PRESENTATION TOPRESENTATION TO
SMALL BUSINESS DEVELOPMENTSMALL BUSINESS DEVELOPMENT
PORTFOLIO COMMITTEEPORTFOLIO COMMITTEE

IDFC LEGISLATIVEIDFC LEGISLATIVE
Provincial Development Finance
Institution;
Established through an act of the KZN
Provincial Legislature, i.e. Ithala
Development Finance Corporation Act,
Act No. 5 of 2013;
Wholly owned by the KZN Provincial
Government and reports to the
Department of Economic
Development, Tourism and
Environmental Affairs;
Been in existence for over 50 years having assumed various names;
Headquartered in Umlazi, a township located South of Durban next to the old airport

MANDATE, MISSION & VISION MANDATE, MISSION & VISION
Mission:
“To drive economic
development and
empowerment, whilst
remaining financially
sustainable”
Mandate:
“Promote, support and
facilitate social and
economic growth in the
province of Kwazulu-
Natal”
Vision:
“To be the catalyst for
growth, economic
development and
empowerment”
IDFC STRUCTUREIDFC STRUCTURE

OBJECTIVE OF INSTITUTIONOBJECTIVE OF INSTITUTION

REPOSITIONING STRATEGY – THE BACKGROUND REPOSITIONING STRATEGY – THE BACKGROUND
IDFC REPOSITIONED THE ORGANISATION TO
ADDRESS THE FOLLOWING:
Financial sustainability
A lack of funding to drive investments
Limited number of Ithala-initiated economic
development projects
Weak business support services reflected in
the high failure rates of funded SMME’s and
Co-operatives
Lack of alignment with government
programmes, especially on rural economic
development and agricultural revolution

REPOSITIONING STRATEGY – THE BACKGROUND REPOSITIONING STRATEGY – THE BACKGROUND
OBJECTIVES OF THE
REPOSITIONING STRATEGY ARE
TO ENSURE THAT ITHALA:
Delivers effectively and
efficiently on its mandate in a
dynamic and challenging
environment
Aligns its core business
activities to the Provincial
Growth and Development
Strategy (PGDS)
Reclaims its historical relevance and position itself as the premier development agency in the Province
Becomes financially sustainable and less reliant on government funding to drive its investment programmes

REPOSITIONING STRATEGY - PHASES REPOSITIONING STRATEGY - PHASES
• The overarching corporate strategy consists of 3-phases over a 5-year time horizon.
• Phase 1 seeks to remediate the business;
• Phase 2 builds on the revised business platform;
• Phase 3 extends Ithala’s focus and widens its set of activities.
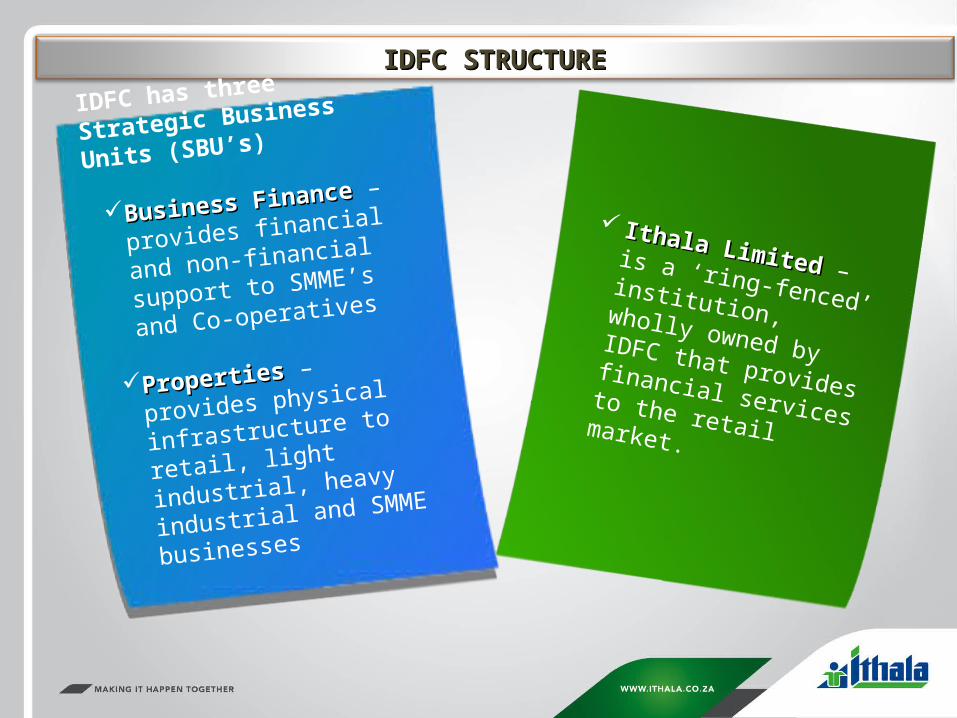
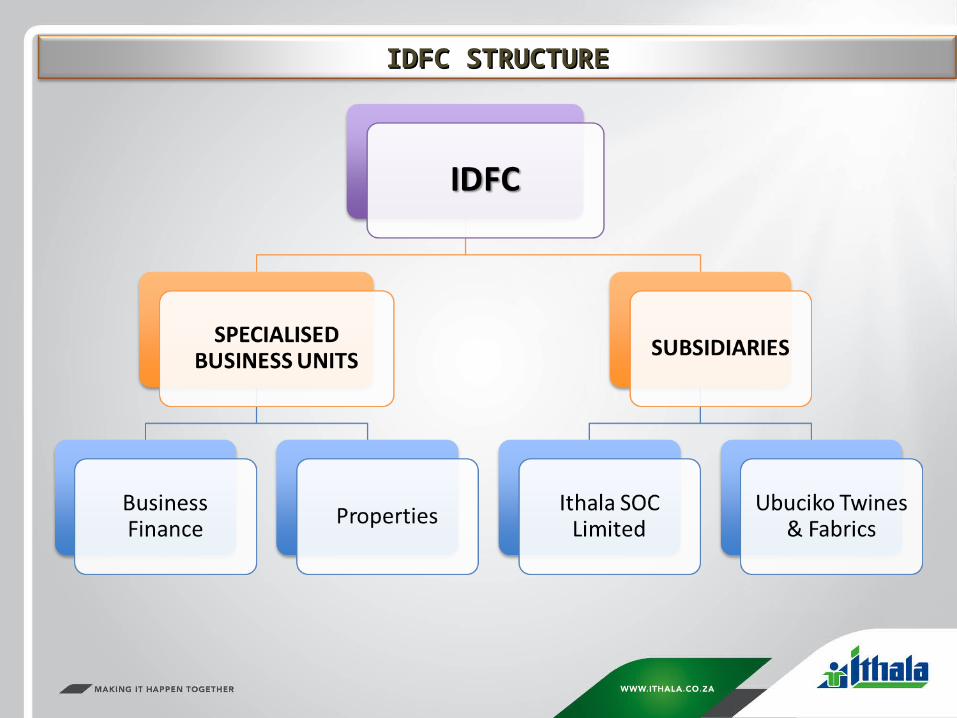
IDFC STRUCTUREIDFC STRUCTURE
IDFC has three Strategic
Business Units (SBU’s)
Business Finance Business Finance – provides
financial and non-financial
support to SMME’s and Co-
operatives
PropertiesProperties – provides
physical infrastructure to
retail, light industrial, heavy
industrial and SMME
businesses
Ithala Limited Ithala Limited – is a ‘ring-fenced’ institution, wholly owned by IDFC that provides financial services
to the retail market.
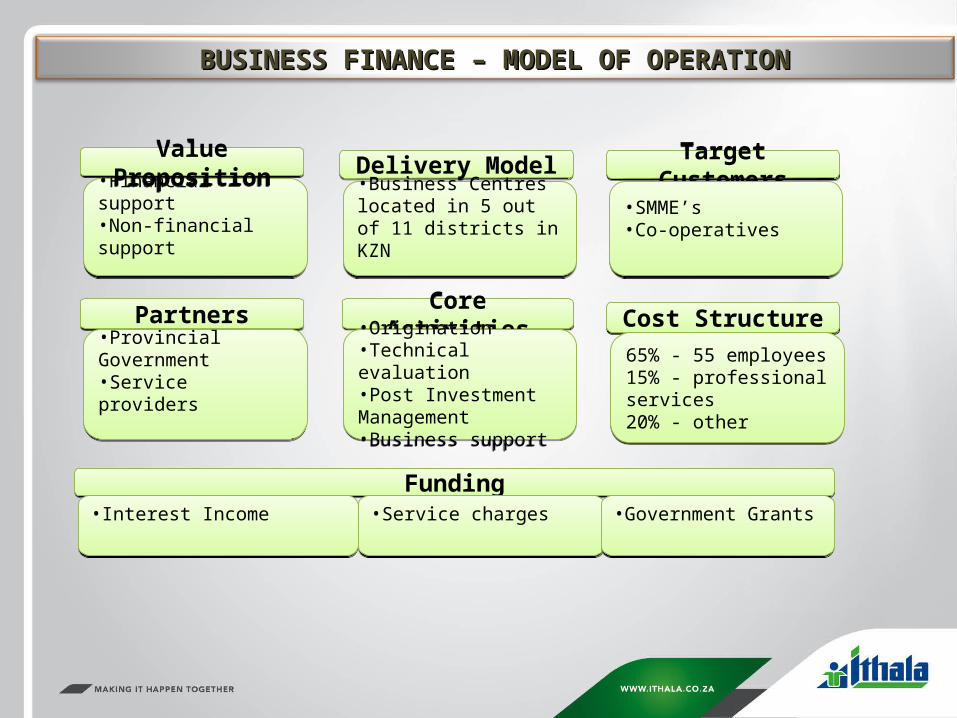
BUSINESS FINANCE – MODEL OF OPERATIONBUSINESS FINANCE – MODEL OF OPERATION
•Financial support•Non-financial support•Financial support•Non-financial support
Value PropositionValue Proposition Delivery ModelDelivery Model•Business Centres located in 5 out of 11 districts in KZN
•Business Centres located in 5 out of 11 districts in KZN
Target CustomersTarget Customers
•SMME’s•Co-operatives•SMME’s•Co-operatives
PartnersPartners
•Provincial Government•Service providers•Provincial Government•Service providers
Core ActivitiesCore Activities•Origination•Technical evaluation•Post Investment Management•Business support
•Origination•Technical evaluation•Post Investment Management•Business support
Cost StructureCost Structure
65% - 55 employees15% - professional services20% - other
65% - 55 employees15% - professional services20% - other
FundingFunding•Interest Income•Interest Income •Service charges•Service charges •Government Grants•Government Grants

BUSINESS FINANCE – KEY INFORMATIONBUSINESS FINANCE – KEY INFORMATION
Footprint:
Business centres located in Umlazi,
Durban, Pietermaritzburg,
Richards Bay, Newcastle and Port
Shepstone;
Financing Products:
• Micro-Finance
• Procurement Finance
• Agri-Finance
• Asset Finance
• Franchise Finance
• Commercial Property Finance
• Structured/Project Finance
Financial and Investment Performance• Profitability: Turnaround from R76m loss in FY 2012/13 to R16m profit in 2013/14.• Investment: Book size is +/-R900m and Non-Performing Loans have been reduced from 61% in 2012/13 to 20% in 2013/14.
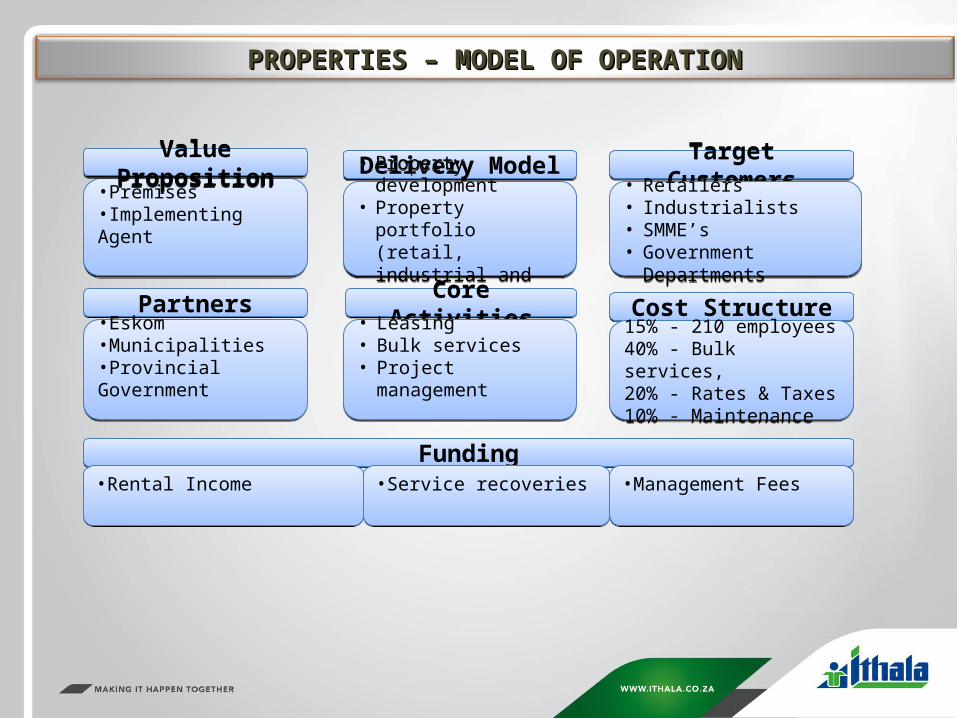
PROPERTIES – MODEL OF OPERATIONPROPERTIES – MODEL OF OPERATION
•Premises•Implementing Agent•Premises•Implementing Agent
Value PropositionValue Proposition Delivery ModelDelivery Model• Property development• Property portfolio
(retail, industrial and SMME)
• Property development• Property portfolio
(retail, industrial and SMME)
Target CustomersTarget Customers• Retailers• Industrialists• SMME’s• Government Departments
• Retailers• Industrialists• SMME’s• Government Departments
PartnersPartners•Eskom•Municipalities•Provincial Government
•Eskom•Municipalities•Provincial Government
Core ActivitiesCore Activities• Leasing• Bulk services• Project management
• Leasing• Bulk services• Project management
Cost StructureCost Structure15% - 210 employees40% - Bulk services,20% - Rates & Taxes10% - Maintenance
15% - 210 employees40% - Bulk services,20% - Rates & Taxes10% - Maintenance
FundingFunding•Rental Income•Rental Income •Service recoveries•Service recoveries •Management Fees•Management Fees

PROPERTIES – KEY INFORMATIONPROPERTIES – KEY INFORMATION
Footprint:
• Twenty one (21) shopping centres located in
rural and peri-urban towns
• Three (3) industrial estates located in
Mandeni (KZN-North), Ladysmith and
Newcastle
• Eight (8) light industrial parks seven (7)
located in Durban and one (1) in Richards
Bay;• Forty (40) SMME parks, eight (8) located in
Midlands, thirteen (13) located in Northern
region and nineteen (19) located in
Southern and Central region
Property Portfolio (Size – GLA):
• Total portfolio – 1,176,279 GLA
• Retail – 138,443k GLA
• Industrial Estates – 847,988 GLA
• Light Industrial Parks – 132,930 GLA
• SMME Parks – 56,918 GLA
Financial:• Profitability: Profit of
R126m in 2013/14.
• Investment: The property portfolio is valued at approximately R1.8 billion and yields approximately 5% on average per annum

ITHALA SOC LIMITED – MODEL OF OPERATIONITHALA SOC LIMITED – MODEL OF OPERATION
•Deposits•Personal Loans•Home Loans•Insurance
•Deposits•Personal Loans•Home Loans•Insurance
Value PropositionValue Proposition Delivery ModelDelivery Model
• Branch network• Branch network
Target CustomersTarget Customers
• Retail market• Retail market
PartnersPartners
•Service providers•Insurance Underwriters•Service providers•Insurance Underwriters
Core ActivitiesCore Activities• Deposit taking• Lending• Insurance
• Deposit taking• Lending• Insurance
Cost StructureCost Structure
• 50% - 444 employees• 30% - 49 Branches• 20% - Other
• 50% - 444 employees• 30% - 49 Branches• 20% - Other
FundingFunding•Interest Income•Interest Income •Service fees•Service fees •Deposits•Deposits
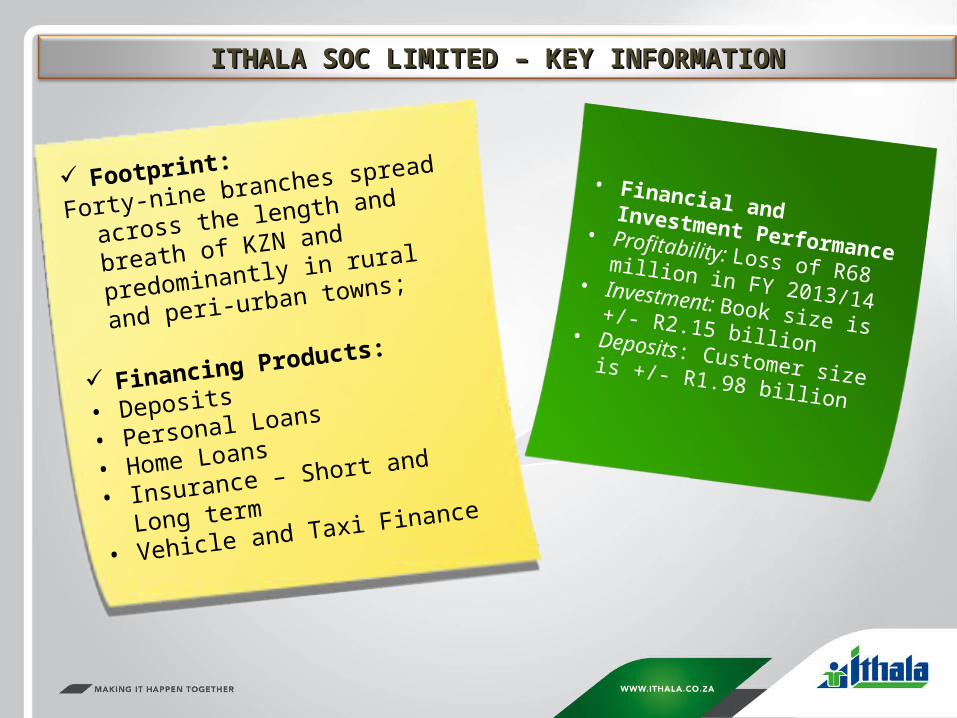
ITHALA SOC LIMITED – KEY INFORMATIONITHALA SOC LIMITED – KEY INFORMATION
Footprint:
Forty-nine branches spread across the
length and breath of KZN and
predominantly in rural and peri-
urban towns;
Financing Products:
• Deposits
• Personal Loans
• Home Loans
• Insurance – Short and Long term
• Vehicle and Taxi Finance
• Financial and Investment Performance• Profitability: Loss of R68 million in FY 2013/14 • Investment: Book size is +/- R2.15
billion• Deposits: Customer size is +/- R1.98 billion

SMME & COOPERATIVESSMME & COOPERATIVES
IMPACT ON IMPACT ON SMME & SMME &
COOPERATIVECOOPERATIVESS

2013-14 CLOSE-OUT SUMMARY2013-14 CLOSE-OUT SUMMARY
Business Type R'000 Gender R'000 Age Sector R'000
SMME 795,125 Male 587,373 Adult 614,251 Manufacturing 123,659
Co-operatives 19,525 Female 141,926 Youth 200,400 Agriculture 112,867
Both 85,261 Trade & Services 183,712
Construction & Tourism 374,887
Co-operatives 19,525
Total 814,650 814,650
Business Type R'000 Gender R'000 Age Sector R'000
SMME 428,734 Male 258,900 Adult 302,061 Manufacturing 46,466
Co-operatives 2,781 Female 129,455 Youth 129,454 Agriculture 109,328
Both 43,152 Trade & Services 95,407
Construction & Tourism 176,095
Co-operative 4,219
Total 431,515 431,515
Appr
oval
sAp
prov
als
Adva
nces
Adva
nces
Districts:Ethekwini, Ugu, Umgungundlovu, UThukela, UMzinyathi, Amajuba, Zululand, UMkhanyakude, UThungulu, ILembe, Sisonke

2013-14 CLOSE-OUT SUMMARY2013-14 CLOSE-OUT SUMMARY
Districts:Ethekwini, Ugu, Umgungundlovu, UThukela, UMzinyathi, Amajuba, Zululand, UMkhanyakude, UThungulu, ILembe, Sisonke
Business Type Gender Age Sector
SMME 209 Male 115 Adult 147 Manufacturing 12
Co-operatives 17 Female 80 Youth 79 Agriculture 31
Both 34 Trade & Services 21
Construction & Tourism 65
Total 226 226 128
Business Type Gender Age Sector
SMME 4,339 Male 2,914 Adult 3,530 Manufacturing 144
Co-operatives 73 Female 1,262 Youth 882 Agriculture 991
Both 236 Trade & Services 437
Construction & Tourism 2,767
Co-operatives 73
Total 4,412
4,412 4,412
No.
of B
usin
ess
Fina
nced
No.
of B
usin
ess
Fina
nced
No.
of J
obs
Faci
litat
ed
No.
of J
obs
Faci
litat
ed

SMME PORTFOLIO – MIDLANDS REGIONSMME PORTFOLIO – MIDLANDS REGION
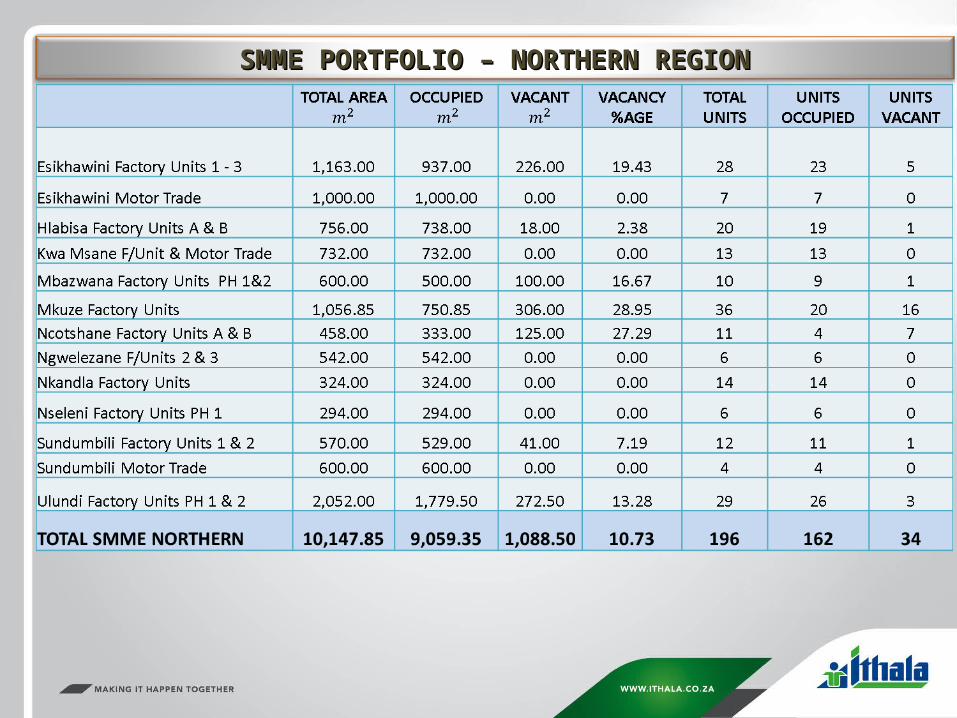
SMME PORTFOLIO – NORTHERN REGIONSMME PORTFOLIO – NORTHERN REGION

SMME PORTFOLIO – SOUTHERN & CENTRAL REGIONSMME PORTFOLIO – SOUTHERN & CENTRAL REGION

SMME PORTFOLIO – SUMMARY SMME PORTFOLIO – SUMMARY
473 of the 595 units were occupied as at the end of July 2014.

Thankyou