Identifying Strategic Protest Routes for Civil...
1
Police Stations Identifying Strategic Protest Routes for Civil Resistance Project Description A recent surge in civil resistance, or strategic non-violence, has shown the power of large- scale protests to challenge legitimacy of gov- ernments and catalyze political change. On February 11, 2011, Egyptian President Hosni Mubarak stepped down from power after three decades of rule. His resignation was a result of widespread protests which included the oc- cupation of Tahrir Square. Many previous efforts to occupy the square had failed. The Egyptian police were expert at breaking up groups of protesters. "We had to find a way to prevent security from making their cordon and stopping us," said 41-year- old Basem Kamel. Basem and approximately a dozen other protest organizers spent two weeks strategizing, planning a strategic ap- proach to Tahrir Square. This project builds upon techniques used in the Egyptian protest and examines how GIS tools can be used to identify strategic gather- ing points and protest routes based on spatial information. Walkable Road Network An Analysis of Optimal Approaches to Tahrir Square in Cairo, Egypt Road Density Junction Density Open Space Mosques 1. Gathering Points 3. Convergence Points 2. Protest Routes Many of the Egyptian protest routes met at mosques. Optimal mosques were selected based on: Far distance from police stations to re- duce likelihood of police action High road density area (as a proxy for population density) Smaller groups of protesters converge at major roads and continue to Tahrir Square on approach routes. The criteria used for convergence points in this analysis were: Between 1.5 and 3 km walking distance from Tahrir Square High density of road junctions In or buffering open space to allow for large group movement Protest route collection areas are densely populated and encourage residents to join, in- creasing participation. Protest approach routes link convergence points to Tahrir Square. Optimal protest route criteria was: Protest collection area: High road density area (as a proxy for population) Protest approach: Most direct route to Tahrir Square using major roads Project Date: May 2011 Data Sources: Opens Street Map retrieved 2011 (Roads, Police Stations, Mosques), Land Info (Roads, Open Space), Digital Map Of Egypt 2009 (Mosques) Projection Coordinate System: WGS_1984_UTM_Zone_36N Kamel quote: NYT, Feb 13, 2011 Photo Sources: The Atlantic (Translation of Protest Flyer), Washington Post, TakeEgyptBack.com, Rotatestockforfressness.com Criteria for each strategic element were overlaid on one another to determine the optimal sites. Each point was given a score based on its proximity to a de- fined criterion each worth 9 points. For instance, a mosque located in a “medium” road density area would have a score of 5. If it were located within 250 meters of a police station, it would get a score of 1. The total score would be added to give the gathering point a score of 6, falling short of the optimal gathering point score of 9 or higher. The same methodology was used to de- termine optimal convergence points Methodology This analysis starts by identifying three criti- cal strategic elements for a successful protest route: 1) gathering points where demonstrators initiate protests; 2) two types of routes — protest collection areas of high population density through which protesters walk to col- lect additional supporters and protest approach routes on major streets that accommodate large groups that are more difficult to dis- perse; and 3) convergence points where smaller groups of protester merge to increase strength in order to approach the destination. Publicly available data was used to the extent possible to simulate the resources available to protest organizers. Each of the three strategic elements were assigned criteria based on the strategy employed in Egypt. Translated protest pamphlet Results The results of this project demonstrate that GIS tools can be used for plotting strategic routes for protest using criteria that can change based on the unique geospatial envi- ronment. In Cairo, the optimal gathering points, stra- tegic routes and convergence points are not always located in an obvious path (i.e. opti- mal mosques located in areas with low road density or convergence points without gath- ering points in the close proximity). The map does, however, provide protest organ- izers with some basic instruction on where to start, what direction to head and where to converge for the final approach. Limitations Procuring data presents the biggest chal- lenge for using GIS to identify strategic protest routes for civil resistance. In this analysis, for instance, a complete listing of mosques or police stations was not avail- able. Population was not available at the desired scale — road density had to be used as a proxy. Open space and road data that could be analyzed as a network had to be acquired from private sources at cost. while the protest routes used the size, dis- tance and density of roads to determine op- timal areas and routes. Lastly, the optimal gathering points, routes and convergence points were combined on a single map to provide guidance for protest organizers.
Transcript of Identifying Strategic Protest Routes for Civil...
Police Stations
Identifying Strategic Protest Routes for Civil Resistance
Project Description
A recent surge in civil resistance, or strategic non-violence, has shown the power of large-scale protests to challenge legitimacy of gov-ernments and catalyze political change. On February 11, 2011, Egyptian President Hosni Mubarak stepped down from power after three decades of rule. His resignation was a result of widespread protests which included the oc-cupation of Tahrir Square.
Many previous efforts to occupy the square had failed. The Egyptian police were expert at breaking up groups of protesters. "We had to find a way to prevent security from making their cordon and stopping us," said 41-year-old Basem Kamel. Basem and approximately a dozen other protest organizers spent two weeks strategizing, planning a strategic ap-proach to Tahrir Square.
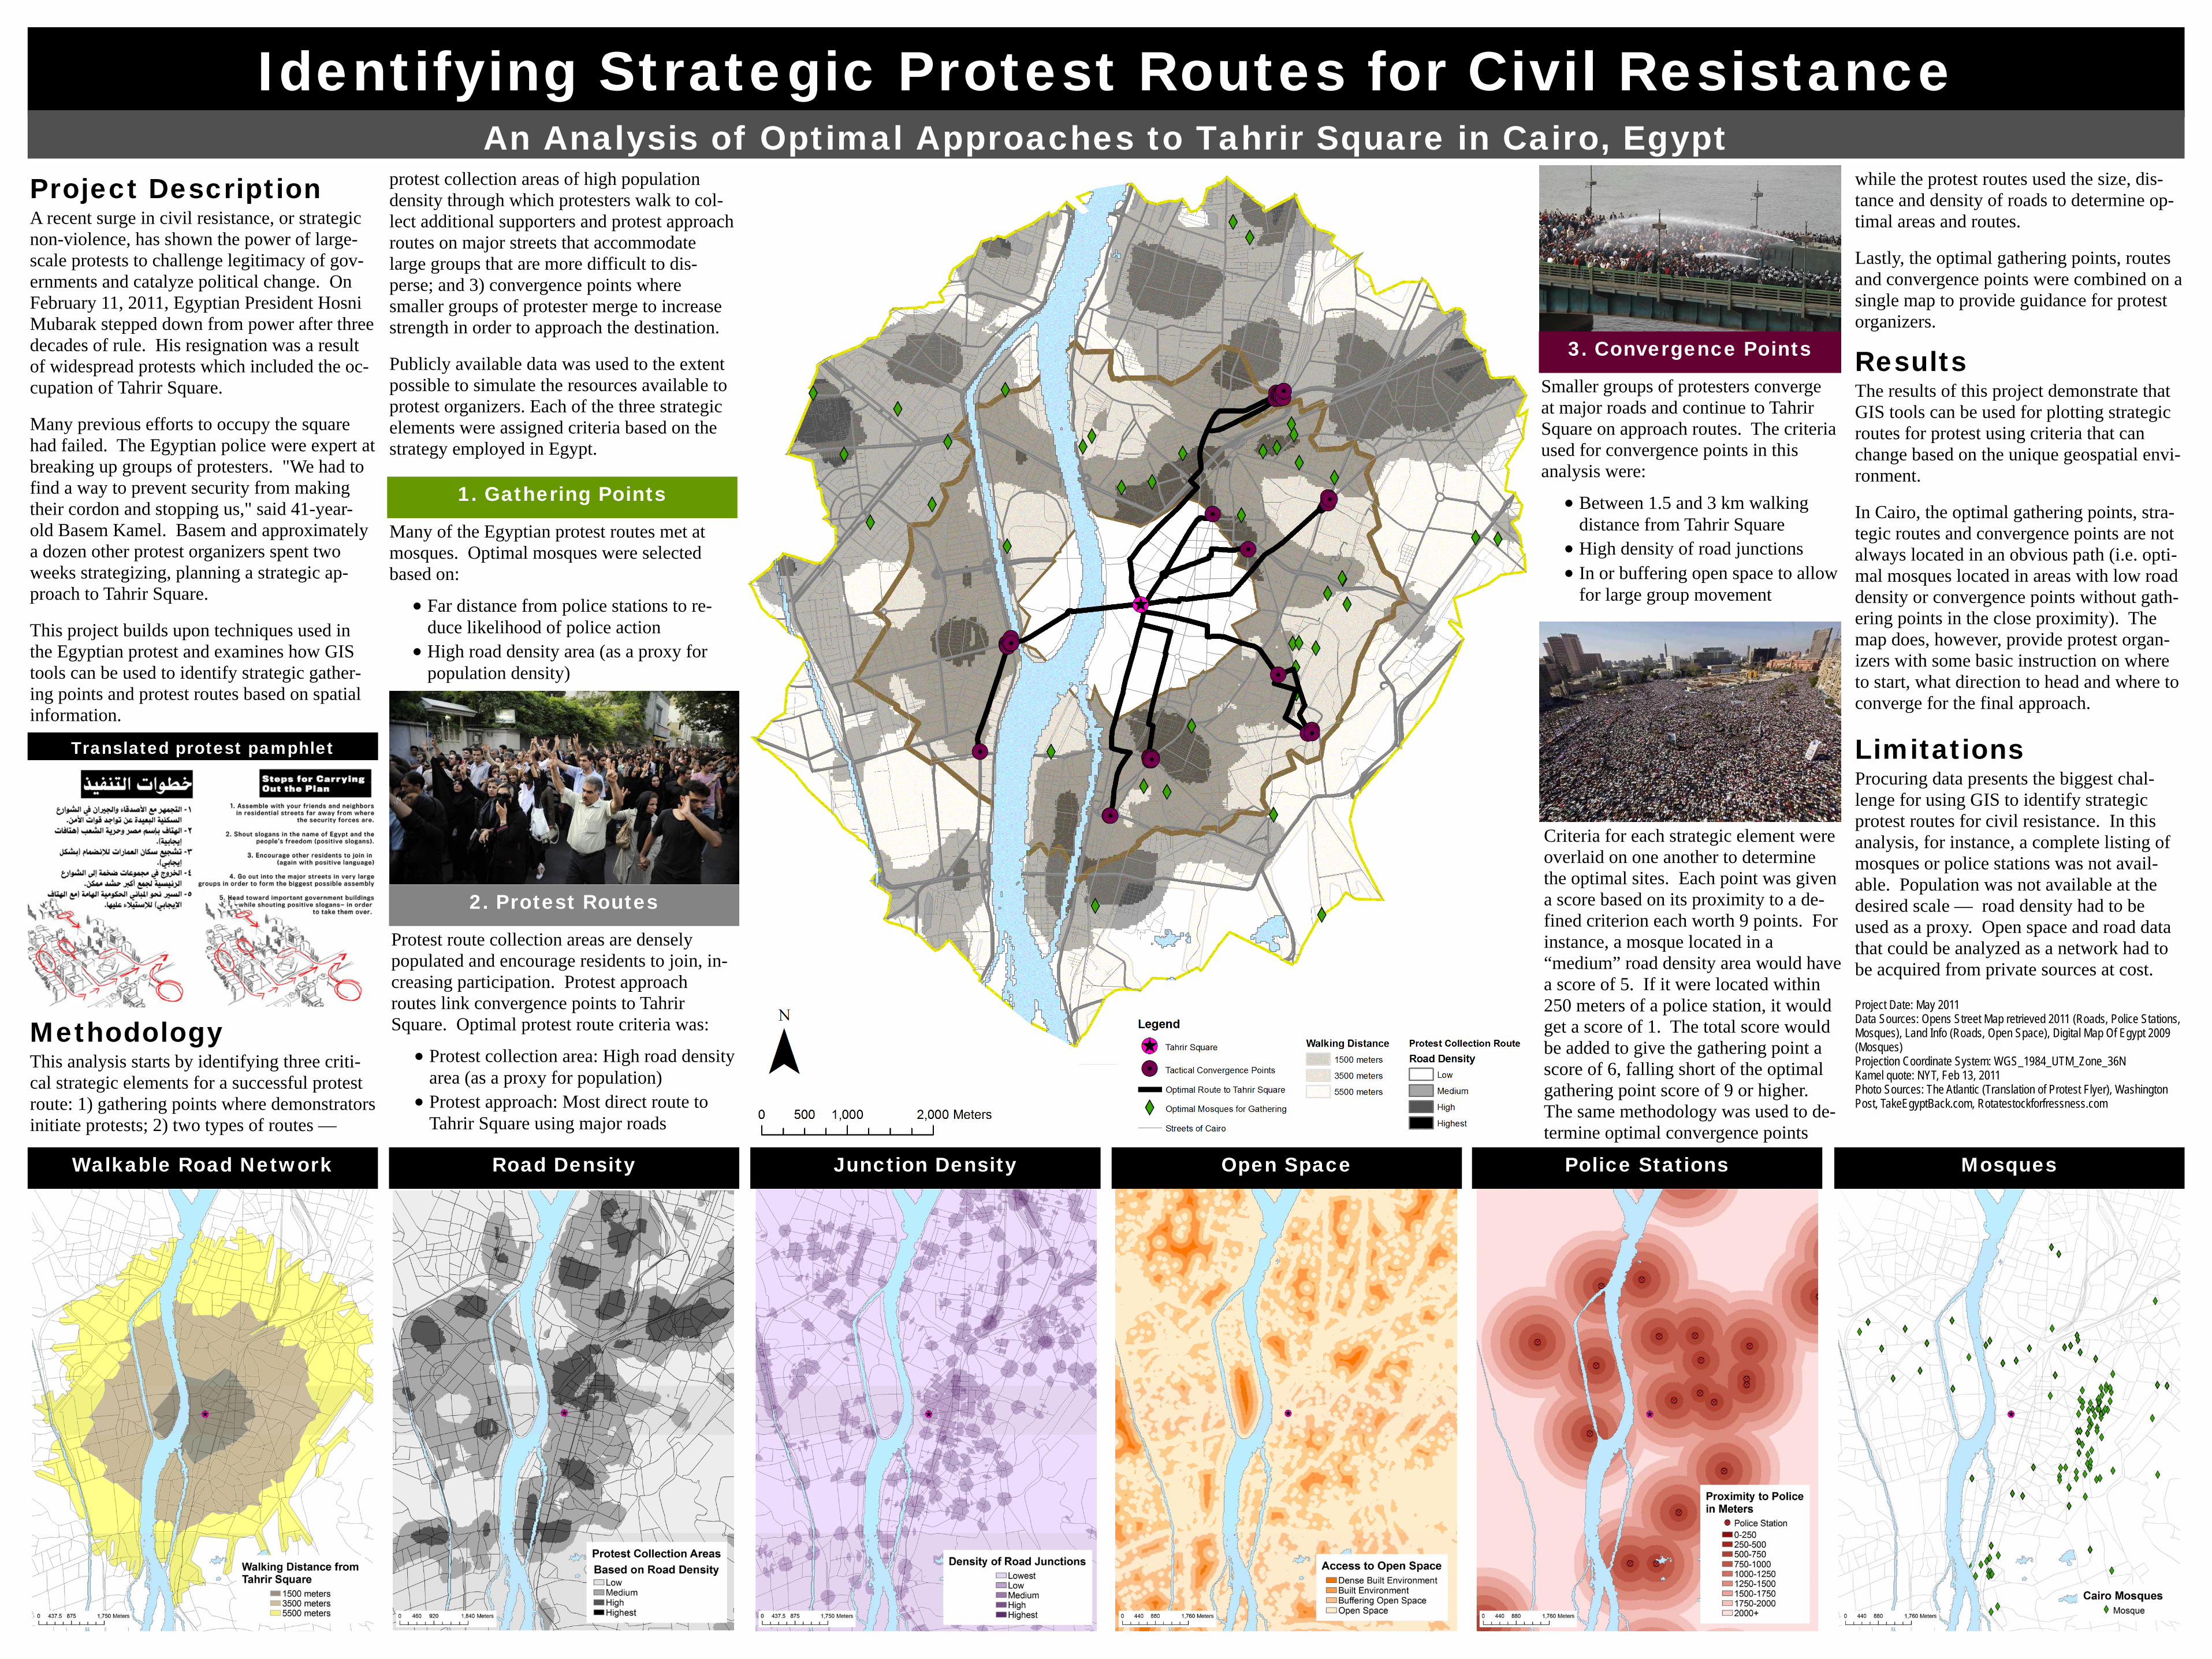
This project builds upon techniques used in the Egyptian protest and examines how GIS tools can be used to identify strategic gather-ing points and protest routes based on spatial information.
Walkable Road Network
An Analysis of Optimal Approaches to Tahrir Square in Cairo, Egypt
Road Density Junction Density Open Space Mosques
1. Gathering Points
3. Convergence Points
2. Protest Routes
Many of the Egyptian protest routes met at mosques. Optimal mosques were selected based on:
Far distance from police stations to re-duce likelihood of police action
High road density area (as a proxy for population density)
Smaller groups of protesters converge at major roads and continue to Tahrir Square on approach routes. The criteria used for convergence points in this analysis were:
Between 1.5 and 3 km walking distance from Tahrir Square
High density of road junctions In or buffering open space to allow
for large group movement
Protest route collection areas are densely populated and encourage residents to join, in-creasing participation. Protest approach routes link convergence points to Tahrir Square. Optimal protest route criteria was:
Protest collection area: High road density area (as a proxy for population)
Protest approach: Most direct route to Tahrir Square using major roads
Project Date: May 2011 Data Sources: Opens Street Map retrieved 2011 (Roads, Police Stations, Mosques), Land Info (Roads, Open Space), Digital Map Of Egypt 2009 (Mosques) Projection Coordinate System: WGS_1984_UTM_Zone_36N Kamel quote: NYT, Feb 13, 2011 Photo Sources: The Atlantic (Translation of Protest Flyer), Washington Post, TakeEgyptBack.com, Rotatestockforfressness.com
Criteria for each strategic element were overlaid on one another to determine the optimal sites. Each point was given a score based on its proximity to a de-fined criterion each worth 9 points. For instance, a mosque located in a “medium” road density area would have a score of 5. If it were located within 250 meters of a police station, it would get a score of 1. The total score would be added to give the gathering point a score of 6, falling short of the optimal gathering point score of 9 or higher. The same methodology was used to de-termine optimal convergence points
Methodology
This analysis starts by identifying three criti-cal strategic elements for a successful protest route: 1) gathering points where demonstrators initiate protests; 2) two types of routes —
protest collection areas of high population density through which protesters walk to col-lect additional supporters and protest approach routes on major streets that accommodate large groups that are more difficult to dis-perse; and 3) convergence points where smaller groups of protester merge to increase strength in order to approach the destination.
Publicly available data was used to the extent possible to simulate the resources available to protest organizers. Each of the three strategic elements were assigned criteria based on the strategy employed in Egypt.
Translated protest pamphlet
Results
The results of this project demonstrate that GIS tools can be used for plotting strategic routes for protest using criteria that can change based on the unique geospatial envi-ronment.
In Cairo, the optimal gathering points, stra-tegic routes and convergence points are not always located in an obvious path (i.e. opti-mal mosques located in areas with low road density or convergence points without gath-ering points in the close proximity). The map does, however, provide protest organ-izers with some basic instruction on where to start, what direction to head and where to converge for the final approach.
Limitations
Procuring data presents the biggest chal-lenge for using GIS to identify strategic protest routes for civil resistance. In this analysis, for instance, a complete listing of mosques or police stations was not avail-able. Population was not available at the desired scale — road density had to be used as a proxy. Open space and road data that could be analyzed as a network had to be acquired from private sources at cost.
while the protest routes used the size, dis-tance and density of roads to determine op-timal areas and routes.
Lastly, the optimal gathering points, routes and convergence points were combined on a single map to provide guidance for protest organizers.