Identifying Sensitive Aquifers in Ohio - Ohio EPA Home IDENTIFYING SENSITIVE AQUIFERS IN OHIO...
23
State of Ohio Environmental Protection Agency Division of Drinking and Ground Waters Identifying Sensitive Aquifers in Ohio May 2007 Ted Strickland, Governor Chris Korleski, Director
Transcript of Identifying Sensitive Aquifers in Ohio - Ohio EPA Home IDENTIFYING SENSITIVE AQUIFERS IN OHIO...

State of Ohio
Environmental Protection Agency
Division of Drinking and Ground Waters
Identifying Sensitive
Aquifers in Ohio
May 2007
Ted Strickland, Governor
Chris Korleski, Director

i
Acknowledgments
Ohio EPA, Division of Drinking and Ground Waters, wishes to recognize the contributions of
several groups and individuals who collected water quality samples, compiled data or maps, and
supported data analysis tools that were critical to the data analysis presented in this document.
The collection of ambient ground water samples by division district staff and compliance
samples by public water systems and the compilation of these analytical results into accessible
databases allowed the data analysis used to document water quality impacts associated with
different geologic settings and lithologies. The Source Water Assessment and Protection
Program’s significant efforts to assess the susceptibility of all PWSs provided an independent
review of water quality impacts documented in the PWS compliance data. We are grateful to the
division’s geographical information systems (GIS) staff for the availability of GIS tools and the
compilation of Drinking and Ground Waters data into GIS data sets required for this analysis.
The ODNR Glacial Aquifer Map is another critical element that we relied on to identify
associations between geology and ground water quality. Chris Kenah, Michael Slattery, Linda
Slattery, and Michael Eggert, completed the data analysis and compiled this summary document.
Questions should be directed to them. This work has been supported by Section 106 funds of the
Clean Water Act.

ii
IDENTIFYING SENSITIVE AQUIFERS IN OHIO Executive Summary
Water quality data is used to identify sensitive aquifers in Ohio by comparing locations of
impacted public water systems (PWSs) with glacial aquifer attributes in the Ohio Department of
Natural Resources (ODNR) Glacial Aquifer Map. The analysis presented here focuses on
transport of dissolved contaminants, nitrate and volatile organics, not particulates, such as
pathogenic organisms. The concept that short or rapid recharge pathways increase aquifer
sensitivity is applied to evaluate sensitive aquifers in Ohio. Applying this concept to Ohio
aquifers suggests that the sand and gravel aquifers are the most sensitive aquifers. Shallow
bedrock aquifers, particularly fractured or karst bedrock aquifers that underlie thin glacial drift
(tills or lacustrine deposits) comprise a second group of sensitive aquifers. Water quality data,
compiled by the Source Water Protection Program is used to confirm the sensitivity of these
aquifers.
OHIO SENSITIVE AQUIFERS - Aquifer sensitivity is evaluated for geologic settings and
lithologic attributes of glacial drift in order to determine correlations between aquifers, drift
thickness, and water quality impacts. Overall, the coarser lithologies or fractured material would
be expected to allow more rapid recharge and consequently, be associated with more sensitive
aquifers. The geologic settings identified as sensitive include the sand and gravel aquifers
(buried valley, alluvial, valley fill, outwash/kames, and beach ridge) and bedrock aquifers below
thin glacial drift (thin tills and lacustrine deposits less than 25 feet) as described in the ODNR
Glacial Aquifer Map (2000). In contrast, geologic settings with areas of thick till generally
retard recharge and contaminant transport through moraine deposits, thereby reducing the
sensitivity of aquifers within or below the tills. Lithologic attributes describe the primary
materials within mapped polygons in the ODNR Glacial Aquifer Map and provide further
division of some geologic settings. The lithologic parameters were divided into three groups for
this analysis: 1) coarse to fine sand and gravel units with minor fine-grained material; 2) fine
grained geologic materials with minor sand and gravel lenses; and 3) till lithologies with little
evidence of sand and gravel lenses. In thin tills, wells generally penetrate through the till into
bedrock aquifers. In thicker tills, limited production may be associated with sand and gravel
lenses, but larger production wells will generally be drilled through the till into bedrock aquifers.
PWSs WITH GROUND WATER QUALITY IMPACTS - Based on Source Water Assessment
and Protection (SWAP) procedures, a PWS in Ohio is considered to have “high susceptibility” if
it has been impacted by anthropogenic contaminants, regardless of its geologic setting or
lithology. Water quality impacts are defined as two or more nitrate concentrations greater than
2.0 mg/L, or two or more confirmed detections of related organic constituents using PWS
compliance monitoring data. The SWAP staff reviewed more than 60,000 compliance samples
including over 1,100,000 results to identify the subset of high susceptibility PWSs based on
water quality impacts. This effort identified a subset of 561 PWSs as highly susceptible out of a
total of 5,151 ground water sourced PWSs. The sensitive aquifer analysis utilized the ODNR
Glacial Aquifer Maps to determine if the highly susceptible PWSs are preferentially located in
sensitive aquifers. The 561 highly susceptible PWSs were associated by location to the attributes
of the ODNR Glacial Aquifer Maps. These attributes, including geologic setting, thickness, and

iii
lithology, were used to count the number of impacted PWSs that occur in different glacial
settings and with different glacial lithologies. These counts were compared to the number of all
ground water based PWSs associated with the same groupings of glacial settings and lithologies
in order to normalize the results for comparisons.
LITHOLOGIC ASSOCIATIONS - The correlation of PWSs identified as highly susceptible to
sensitive aquifers is stronger for the lithologic attributes than the geologic settings divisions,
suggesting the recharge processes are more dependent on the lithologic material present than on
the geologic setting. The percentage of PWSs with documented water quality impacts is highest
for the sand and gravel lithologies and lowest for till materials as illustrated in Figure 1 (Table 2
in document provides detailed data).
Figure 1. Percentage of impacted PWSs by lithology and drift thickness.
The drift thickness groups are presented along the axis going into the page with the lithology
groups on the horizontal axis. The percentage of impacted PWSs (vertical axis) decreases for all
lithology types as the drift thickness increases. The high percentage of impacted PWS associates
with coarse sand and gravel lithologies emphasizes the importance of identifying coarser sand
and gravel lithologies as more sensitive than finer grained sand and gravel lithologies. This is
consistent with aquifer sensitivity being controlled by recharge and transport rate of surface and
near surface contaminants to aquifers. Figure 1 documents a sizable difference between
impacted PWSs in thin tills and the thicker tills. Only limited protection is provided by thin
glacial drift overlying bedrock aquifers, as evidenced by the 15 percent of impacted PWSs
associated with thin tills (< 25 feet). Wells producing from fractured bedrock just below thin
glacial cover will be the most vulnerable and probably account for the bulk of the PWSs with

iv
water quality impacts in this category. The percentage of PWSs with water quality impacts
drops dramatically for thicker tills: 8 percent for tills in the 25-100 feet group, and 3 percent for
tills greater than 100 feet thick.
DISCUSSION - The mapping units on the glacial aquifer map are general groupings that were
selected to represent glacial material on a state scale based on geologic and well log data. It is
significant that analysis using empirical PWS water quality data exhibit significant correlations
with lithologies identified as sensitive. The stronger association of impacted PWSs with coarser
and more permeable sand and gravel lithologies underscores the role recharge plays in making
aquifers sensitive, and suggests the coarse sand and gravel units should be emphasized in the
identification of Ohio’s sensitive aquifers, as illustrated in Figure 2.
Figure 2. Distribution of Aquifers in Ohio sensitive to dissolved contaminants.
Figures 1and 2 are based on the sensitivity of aquifers to dissolves components. Although the
areas of thin glacial till (< 25 feet) over bedrock have been identified as sensitive, these settings
are also sensitive to pathogen contamination. It appears that microbiological contamination is
more likely in these thin till settings than in sensitive, unconsolidated sands due to the limited
filtration capacity of macropores and fractures in till and bedrock. Another element in evaluating
aquifer sensitivity that needs to be considered is the role that horizontal pathways play in
v
transporting contaminants. The previous analysis has assumed that recharge pathways are
dominantly vertical. Although this is generally true, there are geologic settings where recharge
contributions can have significant horizontal components that increase the sensitivity of aquifers,
for example wells located close to rivers.
CONCLUSIONS - This approach to identifying sensitive aquifers in Ohio demonstrates a
practical integration of geologic mapping and water quality data analysis to generate a derivative
map of sensitive aquifers. The intention of this map is to help prioritize ground water protection
activities. The current draft illustrates the core logic of using recharge pathways to determine
sensitivity and documents the validity of the approach based on water quality impacts associated
with dissolved contaminants. Future analysis needs to consider aquifer sensitivity to
microbiological/pathogen movement, to upgrade aquifer sensitivity using five or ten foot
intervals of the drift thickness for water quality impact correlations, to refine water quality
criteria for identifying water quality impacts, and to establish aquifer sensitivity in the
unglaciated portions of Ohio.
vi
IDENTIFYING SENSITIVE AQUIFERS IN OHIO
Table of Contents
INTRODUCTION .......................................................................................................................... 1
OHIO SENSITIVE AQUIFERS ..................................................................................................... 1
PWSs WITH GROUND WATER QUALITY IMPACTS ............................................................. 3
ASSOCIATION OF HIGH SUSCEPTIBILITY PWSs WITH SENSITIVE AQUIFERS ............ 5
GEOLOGIC SETTING ASSOCIATIONS..................................................................................... 6
Sand and Gravel Settings ............................................................................................................. 6
Bedrock Aquifers below Thin Uplands and Lacustrine Deposits ............................................... 6
Moraine Deposits ......................................................................................................................... 8
Unglaciated Areas ........................................................................................................................ 8
LITHOLOGIC ASSOCIATIONS .................................................................................................. 8
Sand and Gravel Lithologies ..................................................................................................... 10
Fine Grained Lithologies ........................................................................................................... 11
Till Lithologies .......................................................................................................................... 11
Unglaciated Areas ...................................................................................................................... 11
DISCUSSION ............................................................................................................................... 11
Highlighting Sand and Gravel Aquifers .................................................................................... 12
Thin Till Over Bedrock Aquifers .............................................................................................. 13
Horizontal Flow Pathways......................................................................................................... 14
CONCLUSIONS AND FUTURE ACTIVITIES ......................................................................... 15
REFERENCES CITED ................................................................................................................. 16
List of Figures
Figure 1. Distribution of major aquifers in Ohio ............................................................................2
Figure 2. Distribution of sensitive sand and gravel aquifers and thin drift over sensitive bedrock
aquifers in Ohio ...............................................................................................................................4
Figure 3. PWSs with documented water quality impacts in relation to sensitive aquifers .............5
Figure 4. Percentage of impacted PWSs by lithology and drift thickness. ...................................10
Figure 5. Impacted PWSs and sensitive aquifers in Southwest Ohio ...........................................12
Figure 6. Distribution of sensitive aquifers in Ohio .....................................................................13
Figure 7. Schematic cross section illustrating rapid pathways in areas of thin glacial drift .........14
Figure 8. Schematic cross section illustrating shortened flow paths for wells in flood plains .....15
List of Tables
Table 1. Documented Water Quality Impacts at PWSs - Hydrogeologis Setting Associations .... 7
Table 2. Documented Water Quality Impacts at PWSs - Lithology Associations ........................ 9

1
IDENTIFYING SENSITIVE AQUIFERS IN OHIO
INTRODUCTION
One of Ohio Environmental Protection Agency’s goals is to identify aquifers in Ohio that are
sensitive to ground water contamination as a result of land use activities. The primary benefit of
identifying sensitive aquifers within the state is to help prioritize limited resources in order to
maximize ground water protection efforts. This document outlines the approach Ohio has used
to identify sensitive aquifers (Ohio EPA, 2006) integrating geologic and chemical water quality
data with digital mapping to develop a derivative map product. Data utilized in this effort
includes geologic information presented in Ohio Department of Natural Resources Aquifer Maps
(ODNR, 2000), water quality information from Ohio’s Ambient Ground Water Monitoring
Program, and Ohio’s public water system (PWS) water quality compliance monitoring data.
PWSs with chemical water quality impacts (criteria outlined in Ohio’s Source Water Protection
and Assessment Program) are also used to evaluate Ohio’s sensitive aquifers. This analysis
focuses on transport of dissolved contaminants, nitrate and volatile organics, not particulates,
such as pathogenic organisms. Consequently, the aquifer sensitivity defined applies primarily to
dissolved contaminants. The complex nature of ground water contamination will always require
site-specific investigations to identify sources and pathways for impacts to ground water. These
site-specific studies help refine our hydrogeologic knowledge and will result in refinement of
sensitive aquifers. The goal here, however, is to use statewide data to identify aquifer settings
and lithologies that are most likely to be impacted by land use activities to help the agency
manage Ohio’s ground water resources.
OHIO SENSITIVE AQUIFERS
The major aquifers in Ohio include widespread, unconsolidated sand and gravel units, sandstone
bedrock in the eastern half, and carbonate bedrock in the western half of Ohio as illustrated in
Figure 1. The sand and gravel aquifers fill pre-glacial and glacial valleys cut into bedrock and
are referred to as buried valley aquifers. The sandstone and carbonate bedrock aquifers generally
provide sufficient production for water wells except where dominated by shale, as in southwest
and southeast Ohio. Glacial drift overlies most of Ohio except for the unglaciated southeastern
quarter of the state.
An understanding of ground water recharge pathways and water quality data were used to
identify those aquifers most likely to be impacted by land use activities; that is, sensitive
aquifers. The concept that short or rapid recharge pathways increase aquifer sensitivity is widely
accepted and used to identify and evaluate sensitive aquifers. Applying this concept to Ohio
aquifers suggests that the sand and gravel aquifers are the most sensitive aquifers. Shallow
bedrock aquifers, particularly fractured or karst bedrock aquifers that underlie thin glacial drift
(tills or lacustrine deposits), comprise a second group of sensitive aquifers. Elevated nitrate
concentrations from PWS compliance monitoring data confirmed that these aquifers were
sensitive based on ground water quality impacts. An underlying assumption is that the
distribution of potential contaminant sources is widespread and evenly distributed. Thus, the
results of this analysis reflect the influence of recharge pathways not potential source

Identifying Sensitive Aquifers
2
distribution. The widespread distribution of nitrate sources (agricultural, residential) in Ohio
makes this a reasonable assumption, however, high concentrations of potential sources close to a
PWS well increases the likelihood that the well will exhibit water quality impacts.
Figure 1. Distribution of major aquifers in Ohio (modified from ODNR Aquifer Maps, 2000).
The geologic information used in this analysis was derived from the Glacial Aquifer Map
(ODNR, 2000) and consequently, the analysis does not provide information about the sensitivity
of the aquifers not included within, or occurring below, glacial deposits. Geologic settings with
rapid recharge are identified as sensitive aquifers and include the following as described in the
ODNR Glacial Aquifer Map:
Sand and Gravel Aquifers: Buried Valley
Alluvial
Valley Fill Outwash/Kame
Beach Ridge
Bedrock Aquifers Below Thin Uplands and Lacustrine Deposits (<25 feet): Thin Uplands (thin till)
Lacustrine

Identifying Sensitive Aquifers
3
In contrast, areas of thick till generally retard recharge through moraine deposits, thereby
reducing the sensitivity of aquifers within or below the tills. The following geologic settings in
the ODNR Glacial Aquifer Map are not sensitive where the till is relatively thick (>25 feet): Moraine Deposits:
Ground Moraine End Moraine
Complex
These geologic settings are associated with different glacial material thicknesses across the state.
It is generally assumed that the greater the glacial thickness the greater the protection provided to
the aquifer. The longer recharge pathways and increased recharge travel time to the aquifer
reduces the overall sensitivity of the aquifer. The ODNR Aquifer Maps groups glacial drift into
three thickness categories: thin (<25 feet), moderate (25-100 feet), and thick (>100 feet). This
thickness describes either the thickness of the glacial drift that includes the aquifer or the
thickness of glacial material that overlies a bedrock aquifer. Each of the hydrogeologic settings
was separated into these thickness groups to evaluate whether water quality impacts were
influenced by the glacial overburden thickness. Even though these groupings are coarse,
differences between geologic setting and thickness groups are clear, as discussed in later
sections.
This analysis was also performed using lithologic attributes included in the Glacial Aquifer
Maps. The lithologic attributes describe the primary materials within mapped polygons in the
ODNR Aquifer Maps and provide further division of some geologic settings. The lithologic
parameters were divided into three groups for this analysis: Sand and Gravel Lithologies: Includes coarse to fine sand and gravel units with
minor fine-grained material, including thin lenses of alluvium, lacustrine deposits, or
till.
Fine Grained Lithologies: Predominantly fine grained geologic materials with minor
sand and gravel lenses. Alluvium, slack water, till, and colluvium deposits are
included in this group.
Till Lithologies: Predominantly tills with little evidence of sand and gravel lenses. In
thin tills, wells generally penetrate through the till into bedrock aquifers. In thicker
tills, limited production may be associated with sand and gravel lenses, but larger
production wells will generally be drilled through the till into bedrock aquifers.
Overall, the coarser lithologies would be expected to allow more rapid recharge and,
consequently, be associated with more sensitive aquifers. Figure 2 illustrates the distribution of
the sand and gravel aquifers that are sensitive and the areas of thin glacial drift that overlie
sensitive bedrock aquifers.
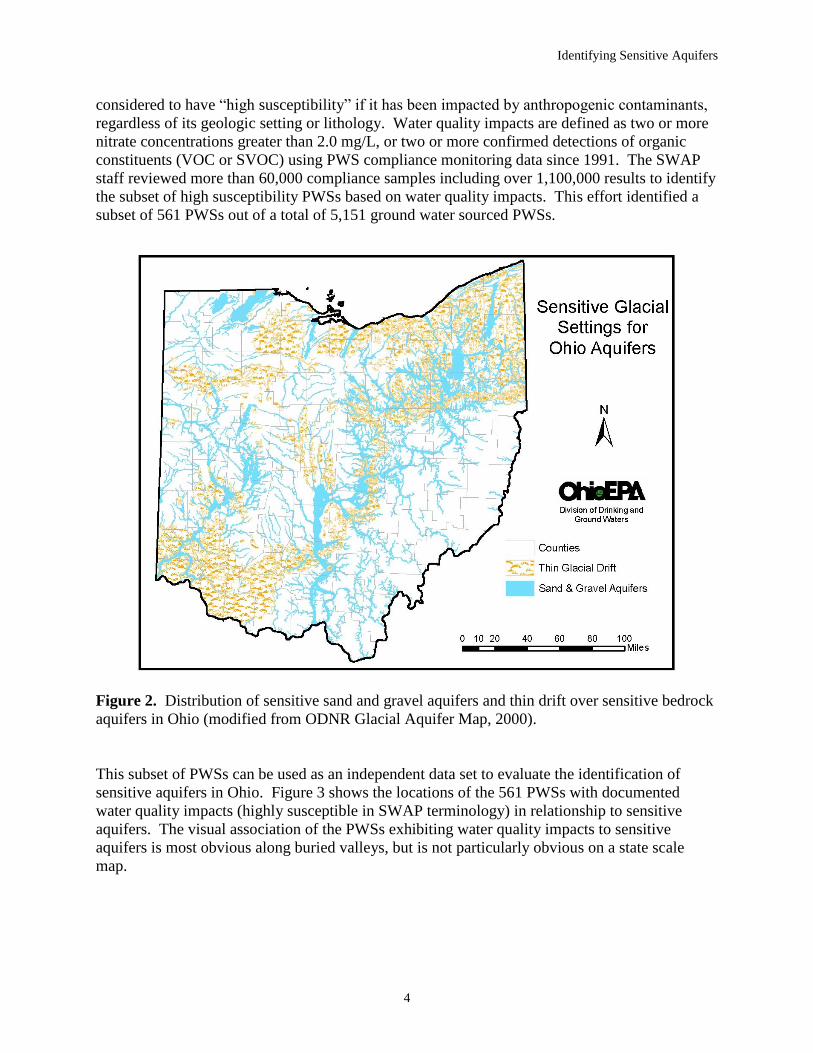
PWSs WITH GROUND WATER QUALITY IMPACTS
The 1996 Amendments to the Safe Drinking Water Act established a program for states to assess
drinking water sources for all public water systems (PWSs). The purpose was to provide PWSs
information for developing drinking water protection plans. These assessments included a
susceptibility analysis. As outlined in the Source Water Assessment and Protection (SWAP)
Program, Susceptibility Analysis Process Manual (Ohio EPA, 2003b), a PWS in Ohio is
Identifying Sensitive Aquifers
4
considered to have “high susceptibility” if it has been impacted by anthropogenic contaminants,
regardless of its geologic setting or lithology. Water quality impacts are defined as two or more
nitrate concentrations greater than 2.0 mg/L, or two or more confirmed detections of organic
constituents (VOC or SVOC) using PWS compliance monitoring data since 1991. The SWAP
staff reviewed more than 60,000 compliance samples including over 1,100,000 results to identify
the subset of high susceptibility PWSs based on water quality impacts. This effort identified a
subset of 561 PWSs out of a total of 5,151 ground water sourced PWSs.
Figure 2. Distribution of sensitive sand and gravel aquifers and thin drift over sensitive bedrock
aquifers in Ohio (modified from ODNR Glacial Aquifer Map, 2000).
This subset of PWSs can be used as an independent data set to evaluate the identification of
sensitive aquifers in Ohio. Figure 3 shows the locations of the 561 PWSs with documented
water quality impacts (highly susceptible in SWAP terminology) in relationship to sensitive
aquifers. The visual association of the PWSs exhibiting water quality impacts to sensitive
aquifers is most obvious along buried valleys, but is not particularly obvious on a state scale
map.
Identifying Sensitive Aquifers
5
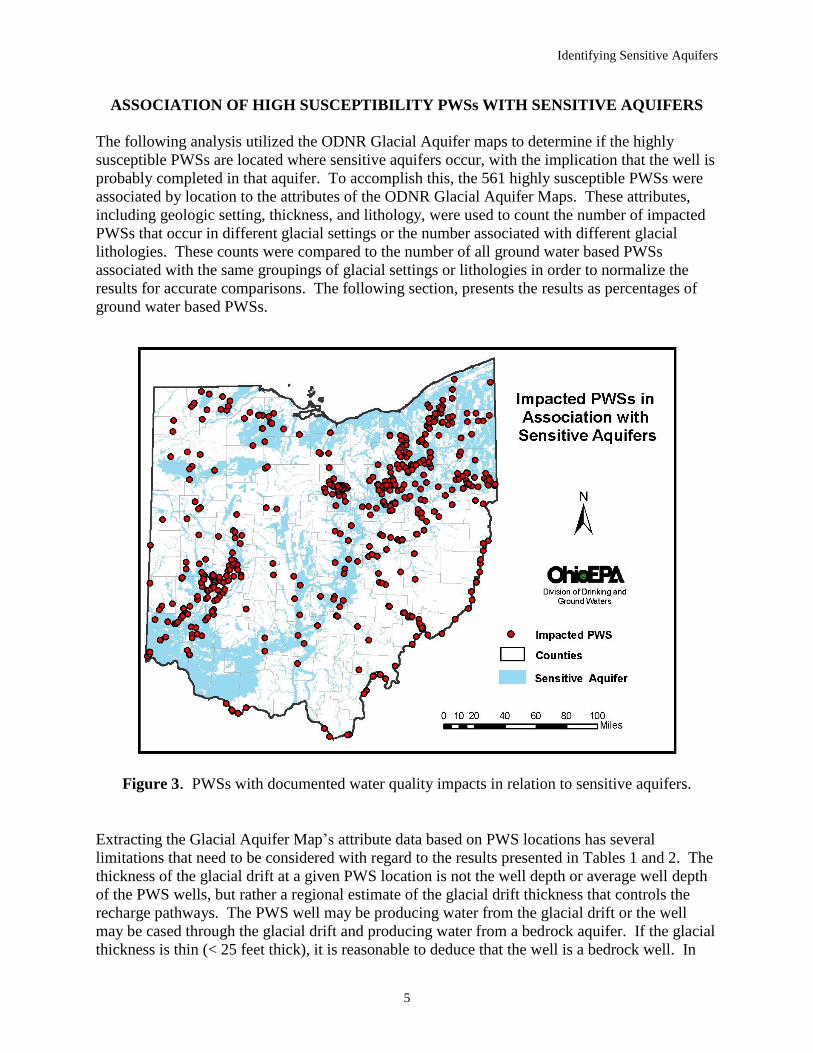
ASSOCIATION OF HIGH SUSCEPTIBILITY PWSs WITH SENSITIVE AQUIFERS
The following analysis utilized the ODNR Glacial Aquifer maps to determine if the highly
susceptible PWSs are located where sensitive aquifers occur, with the implication that the well is
probably completed in that aquifer. To accomplish this, the 561 highly susceptible PWSs were
associated by location to the attributes of the ODNR Glacial Aquifer Maps. These attributes,
including geologic setting, thickness, and lithology, were used to count the number of impacted
PWSs that occur in different glacial settings or the number associated with different glacial
lithologies. These counts were compared to the number of all ground water based PWSs
associated with the same groupings of glacial settings or lithologies in order to normalize the
results for accurate comparisons. The following section, presents the results as percentages of
ground water based PWSs.
Figure 3. PWSs with documented water quality impacts in relation to sensitive aquifers.
Extracting the Glacial Aquifer Map’s attribute data based on PWS locations has several
limitations that need to be considered with regard to the results presented in Tables 1 and 2. The
thickness of the glacial drift at a given PWS location is not the well depth or average well depth
of the PWS wells, but rather a regional estimate of the glacial drift thickness that controls the
recharge pathways. The PWS well may be producing water from the glacial drift or the well
may be cased through the glacial drift and producing water from a bedrock aquifer. If the glacial
thickness is thin (< 25 feet thick), it is reasonable to deduce that the well is a bedrock well. In
Identifying Sensitive Aquifers
6
thicker glacial drift, it is not possible to know if the well is producing water from the glacial
aquifers or bedrock aquifers without additional information, such as well depth or casing length.
If the PWS wells are located in thick glacial drift in geologic settings that are considered
sensitive (buried valley, beach ridge, outwash/kame) it is likely that the well is producing from
sand and gravel aquifers that lie within the drift. For example, a well may be 45 feet deep in an
area of drift greater than 100 feet thick. These data limitations need to be taken into account
when reviewing the data presented in Tables 1 and 2. Overall, there appears to be a strong
association between impacted PWSs and glacial attributes associated with sensitive aquifers, in
spite of these data limitations.
GEOLOGIC SETTING ASSOCIATIONS
The percentages of impacted PWSs associated with categories of geologic settings by increasing
thickness of glacial drift are listed in Table 1. Overall the highest percentages of PWSs with
impacted source water are associated with the sand and gravel aquifers. The major aquifer
groups associated with geologic settings are discussed below.
Sand and Gravel Settings The percentage of PWSs with documented water quality impacts is higher for the geologic
settings dominated by sand and gravel deposits (buried valley, alluvial, valley fill,
outwash/kame, and beach ridge) as illustrated in Table 1, column 4. The percentage of impacted
systems decreases with increasing glacial drift thickness: 26 percent for thin sand and gravel
deposits, 19 percent for intermediate sand and gravel deposits, and 14 percent for sand and
gravel deposits of more than 100 feet thick. This trend supports the concept of increased
protection as the recharge pathways lengthen. Based on the statutory requirement of 25 feet of
casing for PWS wells, wells associated with the 0-25 foot group of sand and gravels probably
represent wells drilled through the glacial sand and gravel into bedrock.
Bedrock Aquifers below Thin Uplands and Lacustrine Deposits
PWSs wells producing from bedrock aquifers below thin and intermediate-thickness upland or
lacustrine deposits (<25 and 25-100 feet thick) exhibit ground water quality impacts in 15 and 10
percent of the PWSs, respectively. These percentages suggest that thin till and lacustrine
material provides a bit more protection from land use activity than sand and gravel. The low
yield from till and lacustrine deposits requires most of these wells to be bedrock production
wells. The 29 percent of PWSs that showed ground water impacts with glacial drift greater than
100 feet thick is based on relatively few wells and appears anomalous. Two of these eight wells
include sensitive buried valley or beach ridge geologic settings within the Drinking Water
Source Protection Area inner management zone (one year time-of-travel). These settings
providing rapid recharge pathways. The other six wells are deep wells (>120 feet) and, based on
available well logs, are presumed to produce water from confined aquifers based on available
well logs. This is an unlikely set of wells to exhibit elevated nitrate since most nitrate detections
> 2.0 mg/L occur in unconfined settings. Three of these four wells were drilled in the 1950's.
One explanation is that well construction deficiencies and corrosion of the casing may allow
leakage of shallow, nitrogen rich ground water into the wells. Several of these wells are within a
few miles of each other and exhibit similar nitrogen time series patterns, suggesting a regional
rather than a local control. This example illustrates some of the problems with applying broad
interpretations of data shown in Table 1 to site-specific cases.

Identifying Sensitive Aquifers
7
Table 1. Documented Water Quality Impacts at PWSs
Associations between Impacts and Hydrogeologic Settings of Glacial Units
Thickness of Glacial
Unit (Feet)
Number of PWSs
in Glacial Unit with
Impacts
Total Number of GW
Based PWSs
in Glacial Unit
Percentage of
Impacted PWSs
Sand and Gravel Aquifer Settings (Aquifer Map settings - Buried Valley, Alluvial, Valley Fill, Outwash/Kame, Beach Ridge)
0-25 10 39 26 %
25-100 92 487 19 %
>100 153 1066 14 %
Bedrock Aquifers Below Thin Uplands and Lacustrine Deposits (Aquifer Map settings - Thin Uplands and Lacustrine)
0-25 133 904 15 %
25-100 103 1032 10 %
>100 8 28 29 %
Moraine Deposits (Aquifer Map Settings - Ground Moraine, End Moraine, Complex)
0-25 0 0 0 %
25-100 27 704 4 %
>100 13 559 2 %
Unglaciated Areas (No glacial units on Glacial Aquifer Map)
0 22 332 7 %
* Hydrogeologic settings are from ODNR Glacial Aquifer Map (ODNR, 2000)

Identifying Sensitive Aquifers
8
Moraine Deposits Protection of ground water resources by thick till cover is demonstrated in the moraine deposits
category of Table 1, where the percentage of impacted PWSs does not exceed 4 percent. In
Table 1, the thin tills are grouped with the thin upland and lacustrine deposits; 15 percent of
PWSs located in thin till settings exhibit water quality impacts. Thicker tills, however, are
associated with relatively few impacted PWSs; 4 percent for the intermediate (25-100 feet)
group, and 2 percent for the thick (>100 feet) group of the moraine deposits category. These low
percentages suggest thick till provides significantly more protection than sand and gravel or thin
tills. The role that fractures and macropores play in controlling recharge to aquifers through tills
is a current topic of discussion in Ohio (Weatherington-Rice and Christy, 2000; Weatherington-
Rice et al., 2006). Fractures and macropores certainly affect the movement of recharge through
thin tills; this is supported by the high percentage (15 percent) of impacted PWSs associated with
thin upland and lacustrine settings. Fractures and macropores appear to be significantly less
important in recharge and contaminant transport in thick tills as documented by the much lower
percentages (4 percent and 2 percent) of impacted PWSs associated with thicker moraine
deposits in Table 1. This is believed to be the result of the limited vertical extent of fractures in
till, typically 20-25 feet (Scott Brockman, personal communication, 2006) and the reduced
frequency of fractures in saturated tills.
Unglaciated Areas The last category in Table 1 includes PWSs located in the unglaciated areas of Ohio, primarily
the southeastern uplands. These areas include weathered bedrock (colluvium) that overlies late
Paleozoic sandstones and shales and in places is overlain by loess deposits. In most cases, wells
produce water from bedrock aquifers, however, yields are generally low and relatively few
PWSs use these aquifers. Consequently, we have limited data for the unglaciated areas. The
available data, however, indicates that the colluvium is better than sand and gravel and thin till in
glaciated areas, but not as good as thicker tills at protecting wells from land use impacts. From
Table 1, PWSs in unglaciated areas are impacted in 7 percent of the sites, a value that is
intermediate between sand and gravel and thicker tills. The lower population density and
reduced number of potential pollution sources in unglaciated, southeastern Ohio uplands also
tends to depress the percentage of impacted PWSs in this region.
LITHOLOGIC ASSOCIATIONS
The lithologic attributes of glacial deposits can be divided for further analysis into sand and
gravel, fine grained, and till lithologies. The percentages of impacted PWSs associated with
these lithologic groups are presented in Table 2, ordered by increasing thickness of glacial drift.
The percentage of PWSs with documented water quality impacts is highest for the sand and
gravel lithologies and lowest for the till materials. This is similar to the results presented in
Table 1 for geologic settings, but the higher percentages associated with the lithologic divisions
indicate the recharge processes are more dependent on the lithologic material present than on the
geologic setting. The major lithologic groups are discussed individually below and the relative
percentages of impacted PWSs are presented in a bar chart in Figure 4.

Identifying Sensitive Aquifers
9
Table 2. Documented Water Quality Impacts at PWSs
Associations between Impacts and Lithology of Glacial Units
Thickness of Glacial
Unit (Feet)
Number of PWSs
in Glacial Unit with
Impacts
Total Number of GW
Based PWSs
in Glacial Unit
Percentage of
Impacted PWSs
Sand and Gravel Lithologies (including: sand and gravel, minor fines, confined, thin till included within or over unit)
0-25 6 9 67 %
25-100 50 133 38 %
>100 113 495 23 %
Fine Grained Lithologies (including: fine grained sediments undifferentiated, fines with minor sand and gravel lenses)
0-25 4 36 11 %
25-100 44 405 11 %
>100 37 464 8 %
Till Lithologies (including: till, till with sand and gravel lenses)
0-25 133 898 15 %
25-100 128 1682 8 %
>100 24 697 3 %
Unglaciated Areas (areas with no glacial units on ODNR Glacial Aquifer Map)
0 22 332 7 %
* Lithology divisions are from ODNR Glacial Aquifer Map (ODNR, 2000)

Identifying Sensitive Aquifers
10
Figure 4. Percentage of impacted PWSs by lithology and drift thickness.
Sand and Gravel Lithologies For sand and gravel lithologies, the low number of wells in the < 25 feet thickness category
results from the statutory requirement that PWS wells have a minimum of 25 feet of casing
installed. Thus, the few wells in this thickness grouping are either old wells with short casing
lengths or bedrock wells cased through thin glacial sand and gravel. With 67 percent of these
wells having water quality impacts, it appears that they are highly susceptible, but because the
percentage is based on a very low number of wells, it can not be given much significance. The
percentage of impacted PWSs decreases to 38 percent and 23 percent for the 25-100 feet and
>100 feet groupings, respectively. These wells probably do not penetrate the entire glacial
thickness, but it appears that the thicker section of sand and gravel provides more filtration and
increased travel time, as expected.
Almost all of the areas of sand and gravel lithologies in Table 2 and Figure 4 are included within
the sand and gravel aquifer settings that are considered most sensitive in Table 1. The sensitive
geologic settings that include sand and gravel aquifers also include fine grained lithologies. The
higher correlation between coarser sand and gravel lithologies and PWSs with water quality
impacts (Table 2) emphasizes the importance of identifying coarser sand and gravel lithologies
as more sensitive than finer grained sand and gravel lithologies. This is consistent with the
understanding that aquifer sensitivity is controlled by recharge and transport rate of surface or
near surface contaminants to aquifers.
Identifying Sensitive Aquifers
11
Fine Grained Lithologies The fine grained portions of the glacial lithologies in the ODNR Aquifer Maps are
predominantly undifferentiated fine grained sediments with minor sand and gravel lenses.
Approximately 8 percent to 11 percent of the PWSs associated with these fine grained sand
lithologies exhibit water quality impacts, which is significantly less than coarse sand and gravel
deposits (23 percent to 38 percent for the sand and gravel lithologies). The percentage of
impacted PWSs decreases with increasing glacial drift thickness, but not appreciably, which may
result from the variability of well depths independent of the glacial deposit thickness. The low
number of samples in the 0-25 foot thickness group (36) suggests the 11 percent result should not
be given much significance, except that the 25-100 feet group exhibits the same percentage of
impacted PWSs.
Till Lithologies
Table 2 and Figure 4 document a sizable difference between impacted PWSs in thin tills and the
thicker tills. Only limited protection is provided by thin glacial drift overlying bedrock aquifers,
as evidenced by the 15 percent of impacted PWSs associated with thin tills (< 25 feet). Wells
producing from fractured bedrock below thin glacial cover will be the most vulnerable and
probably account for the bulk of the PWSs with water quality impacts in this category. The
percentage of PWSs with water quality impacts drops dramatically for thicker tills: 8 percent for
tills in the 25-100 feet group, and 3 percent for tills greater than 100 feet thick.
Unglaciated Areas The unglaciated areas include the same subset of wells in Table 2 as presented in Table 1. As
stated earlier, the limited data restrict broad conclusions, but the low percentage of impacted
PWSs suggests that colluvium provides some protection for these wells from land use activities.
The lower population density and reduced number of potential pollution sources in southeast
Ohio uplands may also help to keep this percentage low.
DISCUSSION
This analysis documents the importance of distinguishing the coarser grained lithologies in
buried valleys, alluvial, valley fill, outwash/kame, and beach ridge deposits as being more
sensitive to contaminant impact than the finer grained deposits in these same settings. Figure 5
illustrates the association of the PWSs with water quality impacts along a section of the Great
Miami buried valley aquifer in southwest Ohio. The relationship between the high
concentrations of water quality impacts and sections of the buried valley identified as sand and
gravel (dark blue) is clearly illustrated. Water quality impacts are also associated with finer
grained buried valley deposits (light blue) and thin tills (tan texture) in the uplands (where wells
penetrate the till to produce from bedrock aquifers), but with lower frequency as documented in
Tables 1 and 2. The locations of PWS treatment plants are provided to illustrate the wide
distribution of PWSs used in the analysis.

Identifying Sensitive Aquifers
12
Figure 5. Impacted PWSs and sensitive aquifers in Southwest Ohio.
Highlighting Sand and Gravel Aquifers
The divisions on the glacial aquifer map are general groupings that were selected to represent
glacial material on a state scale based on geologic and well log data. Analysis using empirical
PWS water quality data (elevated nitrate, VOC detections) exhibit significant correlations with
the identified sensitive geologic settings and lithologies. The stronger association of impacted
PWSs with coarser and more permeable sand and gravel lithologies underscores the role
recharge plays in making aquifers sensitive, and suggests the coarse sand and gravel units should
be emphasized in the identification of Ohio’s sensitive aquifers.
Figure 6 illustrates the distribution of sensitive glacial geologic settings across Ohio utilizing
attributes identified in ODNR Glacial Aquifer Map (ODNR, 2000). This figure represents the
combined analysis of sensitive aquifers and water quality impacts based on nitrate concentrations
and VOC detections. In the glacial settings where sand and gravel deposits are common, the
lithology is divided into fine and coarse grained units. The analysis presented in this paper
documents that the coarser grained units are more sensitive. The classification processes used in
developing the glacial aquifer maps required a great deal of simplification and consequently
these generalizations need to be considered in any application of Figure 6. Nevertheless, the
correlation of the empirical PWS water quality data to the lithologic and geologic setting
descriptors supports the simplifications made in developing the ODNR Glacial Aquifer Map and
the validity of using recharge controls in determining sensitive aquifers.
Identifying Sensitive Aquifers
13
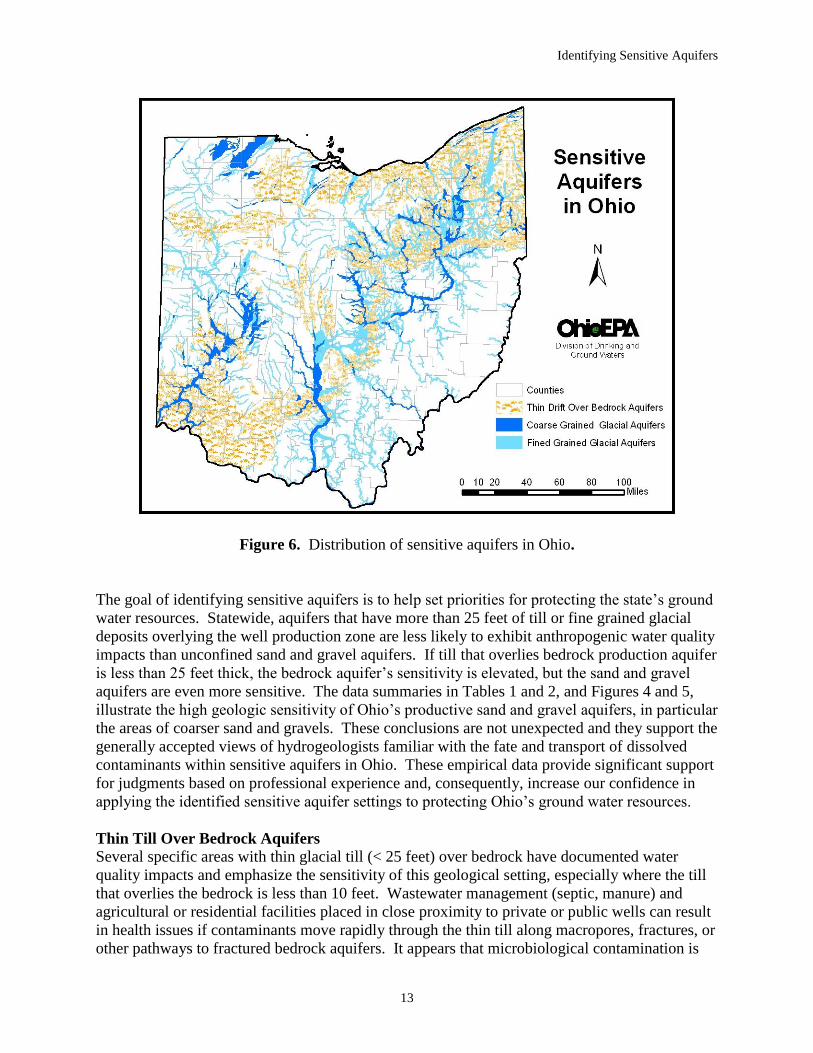
Figure 6. Distribution of sensitive aquifers in Ohio.
The goal of identifying sensitive aquifers is to help set priorities for protecting the state’s ground
water resources. Statewide, aquifers that have more than 25 feet of till or fine grained glacial
deposits overlying the well production zone are less likely to exhibit anthropogenic water quality
impacts than unconfined sand and gravel aquifers. If till that overlies bedrock production aquifer
is less than 25 feet thick, the bedrock aquifer’s sensitivity is elevated, but the sand and gravel
aquifers are even more sensitive. The data summaries in Tables 1 and 2, and Figures 4 and 5,
illustrate the high geologic sensitivity of Ohio’s productive sand and gravel aquifers, in particular
the areas of coarser sand and gravels. These conclusions are not unexpected and they support the
generally accepted views of hydrogeologists familiar with the fate and transport of dissolved
contaminants within sensitive aquifers in Ohio. These empirical data provide significant support
for judgments based on professional experience and, consequently, increase our confidence in
applying the identified sensitive aquifer settings to protecting Ohio’s ground water resources.
Thin Till Over Bedrock Aquifers
Several specific areas with thin glacial till (< 25 feet) over bedrock have documented water
quality impacts and emphasize the sensitivity of this geological setting, especially where the till
that overlies the bedrock is less than 10 feet. Wastewater management (septic, manure) and
agricultural or residential facilities placed in close proximity to private or public wells can result
in health issues if contaminants move rapidly through the thin till along macropores, fractures, or
other pathways to fractured bedrock aquifers. It appears that microbiological contamination is

Identifying Sensitive Aquifers
14
more likely in aquifers below thin till settings than in sensitive, unconsolidated sand aquifers due
to the limited filtration capacity of macropores and fractures in till and bedrock. Invariably,
ground water microbiological contamination increases proportionally to increasing population
concentration in areas of closely spaced septic systems and wells. Figure 7 is a schematic
geologic cross section that illustrates the sensitive geologic setting of fractured bedrock below
thin glacial drift. Water quality impacts associated with similar geologic setting are recognized
across the state. The 2004 infectious disease outbreak at South Bass Island in Lake Erie, which
was determined to be associated with ground water contamination (Ohio Department of Health,
2005), is an example of the potential water quality impact to sensitive bedrock aquifers in areas
of thin to no glacial overburden.
Figure 7. Schematic cross section illustrating rapid pathways in areas of thin glacial drift.
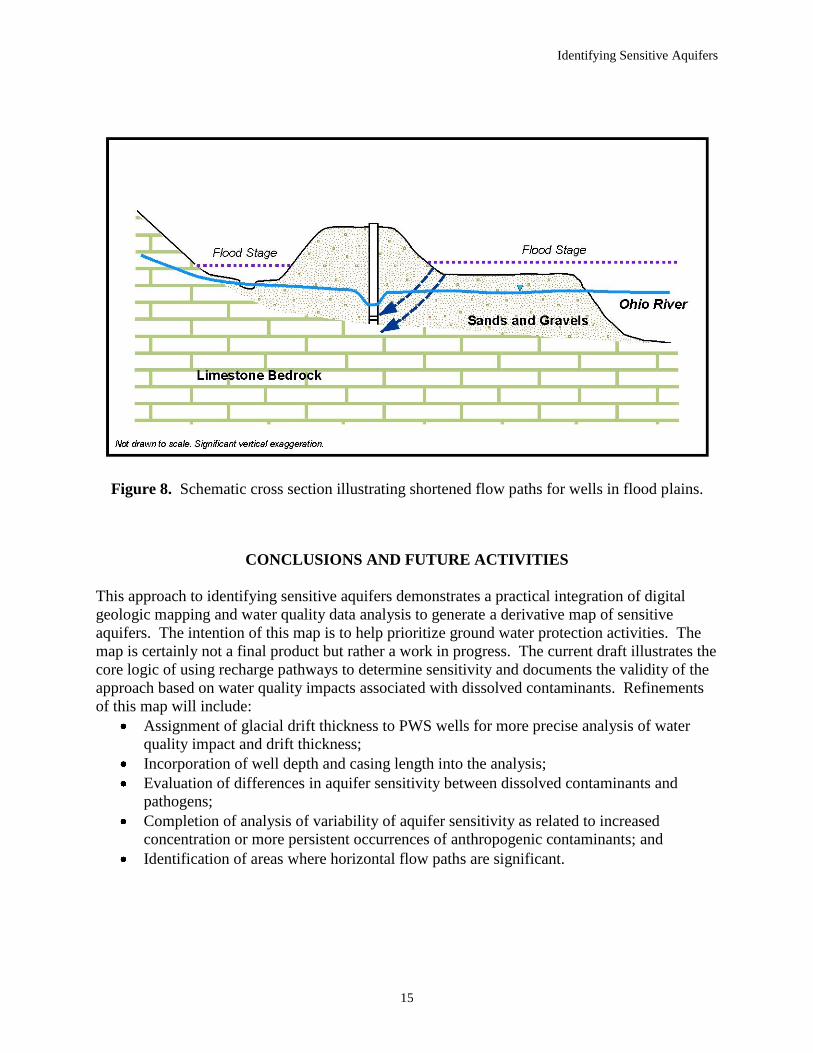
Horizontal Flow Pathways
The previous analysis has assumed that recharge pathways are dominantly vertical. Although
this is generally true, there are geologic settings where recharge contributions can have
significant horizontal components that increase the sensitivity of aquifers. The schematic cross
section in Figure 8 illustrates this situation. Wells located in flood plains close to a river are
examples of locations where horizontal flow paths can become significant contributors to
recharge. Many of these wells are located close to the river to increase production by inducing
recharge from the river. At flood stage, the elevated river level can shorten the horizontal flow
path and increase the pressure gradient to a pumping well, with the result of shortening recharge
pathways and reducing transport time. There are also areas where fractured bedrock exposed in
streams and stream banks can provide rapid recharge to bedrock aquifers, especially during
flooding events. The areas of the state where horizontal components of recharge are potentially
significant also need to be identified as areas of sensitive aquifers.
Identifying Sensitive Aquifers
15
Figure 8. Schematic cross section illustrating shortened flow paths for wells in flood plains.
CONCLUSIONS AND FUTURE ACTIVITIES
This approach to identifying sensitive aquifers demonstrates a practical integration of digital
geologic mapping and water quality data analysis to generate a derivative map of sensitive
aquifers. The intention of this map is to help prioritize ground water protection activities. The
map is certainly not a final product but rather a work in progress. The current draft illustrates the
core logic of using recharge pathways to determine sensitivity and documents the validity of the
approach based on water quality impacts associated with dissolved contaminants. Refinements
of this map will include:
Assignment of glacial drift thickness to PWS wells for more precise analysis of water
quality impact and drift thickness;
Incorporation of well depth and casing length into the analysis;
Evaluation of differences in aquifer sensitivity between dissolved contaminants and
pathogens;
Completion of analysis of variability of aquifer sensitivity as related to increased
concentration or more persistent occurrences of anthropogenic contaminants; and
Identification of areas where horizontal flow paths are significant.

Identifying Sensitive Aquifers
16
REFERENCES CITED
Brockman, C.S., Personal Communication, May 2006.
Ohio Department of Health, 2005, Director Investigation - Gastrointestinal Illness, South Bass
Island, Lake Erie, August 2004: Multiple Agency Investigation and Actions, February 22, 2005;
amended February 16, 2006, accessed at
http://www.epa.state.oh.us/ddagw/SBIweb/Reports/SBI_ODH.pdf
Ohio Department of Natural Resources, 2000, Glacial Aquifer Map and Bedrock Aquifer Maps
(digital format), accessed at http://www.dnr.state.oh.us/water/samp/
Ohio EPA, 2000, Ohio’s Ground Water Quality, 2000 305(b) Report: Division of Drinking and
Ground Waters, 38 p., accessed at http://www.epa.state.oh.us/ddagw/pdu/gw_305b.html
Ohio EPA, 2003a, Ohio’s Ground Water Quality, 2002 305(b) Report: Division of Drinking and
Ground Waters, 78 p., accessed at http://www.epa.state.oh.us/ddagw/pdu/gw_305b.html
Ohio EPA, 2003b, Susceptibility Analysis Process Manual: Division of Drinking and Ground
Waters, 64 p., accessed at http://www.epa.state.oh.us/ddagw/Documents/swap_saprocman.pdf
Ohio EPA, 2006, Ohio’s Ground Water Quality, 2006 305(b) Report: Division of Drinking and
Ground Waters, 93 p., accessed at http://www.epa.state.oh.us/ddagw/pdu/gw_305b.html
Weatherington-Rice, J., and Christy, A.D., Eds. 2000, Fractures in Ohio’s Glacial Tills: The
Ohio Journal of Science, Special Issue. Vol. 100, no.3/4, accessed at http://www.oardc.ohio-
state.edu/fractures
Weatherington-Rice, J., Christy, A. D., and Angle, M.P., Eds., 2006, Fractures in Ohio’s Glacial
Tills - Further Explorations: The Ohio Journal of Science, Special Issue, Vol. 106, no.2, assessed
at http://www.oardc.ohio-state.edu/fractures/