IDENTIFICATION OF SALT STRESS RESPONSIVE...
68
IDENTIFICATION OF SALT STRESS RESPONSIVE PROTEINS IN WILD SUGAR BEET (BETA MARITIMA) USING 2D-PAGE WITH MALDI-TOF/TOF SYSTEM A Thesis Submitted to the Graduate School of Engineering and Sciences of İzmir Institute of Technology in Partial Fulfillment of the Requirements for the Degree of MASTER OF SCIENCE in Molecular Biology and Genetics by Çiğdem ÇAKIROĞLU July 2012 İZMİR
Transcript of IDENTIFICATION OF SALT STRESS RESPONSIVE...

IDENTIFICATION OF SALT STRESS
RESPONSIVE PROTEINS IN WILD SUGAR BEET
(BETA MARITIMA) USING 2D-PAGE WITH
MALDI-TOF/TOF SYSTEM
A Thesis Submitted to
the Graduate School of Engineering and Sciences of
İzmir Institute of Technology
in Partial Fulfillment of the Requirements for the Degree of
MASTER OF SCIENCE
in Molecular Biology and Genetics
by
Çiğdem ÇAKIROĞLU
July 2012
İZMİR

We approve the thesis of Çiğdem ÇAKIROĞLU
Examining Committee Members
Assist. Prof. Dr. H. Çağlar KARAKAYA
Department of Molecular Biology and Genetics,
İzmir Institute of Technology
Assoc. Prof. Dr. Ahmet KOÇ
Department of Molecular Biology and Genetics,
İzmir Institute of Technology
Assoc. Prof. Dr. Talat YALÇIN
Department of Chemistry,
İzmir Institute of Technology
9 July 2012
Assist. Prof. Dr. H. Çağlar KARAKAYA
Supervisor, Department of Molecular Biology and
Genetics, İzmir Institute of Technology
Assoc. Prof. Dr. Ahmet KOÇ Prof. Dr. R. Tuğrul SENGER
Head of the Department of Dean of the Graduate School of
Molecular Biology and Genetics Engineering and Sciences

ACKNOWLEDGEMENTS
First of all, I would like to deeply thank my supervisor Assist. Prof. Dr. H.
Çağlar KARAKAYA for encouraging and supporting me in study of proteomics which
was completely novel for me. He was such a gentle person that never makes me feel
hesitated.
And I would like to express my gratitude to Assoc. Prof. Dr. Ahmet KOÇ and
Assoc. Prof. Dr. Talat YALÇIN for their guidance, encouragement, experimental
support and sharing their experiences.
I am also very grateful to my parents Nevin and M. Murat ÇAKIROĞLU, my
brother O. Burak ÇAKIROĞLU, his wife Bahar ÇAKIROĞLU and his lovely son Batu
ÇAKIROĞLU for their infinite patience and respect to my decisions.
Finally, I would like to specially thank Gökalp IŞIK for his fully motivating me
to write this thesis and he made me an incredible optimist. Besides I wish to thank Ayşe
Banu DEMİR, Burcu ŞENGEZ SÜNBÜL, Gönensin Ozan BOZDAĞ, Talip ZENGİN,
Işıl ESMER, İrem ULUIŞIK, Esra ŞAHİN, Ahmet Emin ATİK, Zeynep BEBEK and
Çağlayan AKKAYA for having sincerity and sense of humor, sharing my social life
and making my thesis more tolerable.
iv
ABSTRACT
IDENTIFICATION OF SALT STRESS RESPONSIVE PROTEINS IN
WILD SUGAR BEET (BETA MARITIMA) USING 2D-PAGE WITH
MALDI-TOF/TOF SYSTEM
High salinity is one of the abiotic stresses, which affects the homeostasis,
growth and productivity of plants. In plants, uptake of the non-essential salt ions
negatively affects the anatomy, physiology and metabolism, changes the osmotic
balance in cells and causes abundant dehydration. In this case, higher plants develop salt
tolerance mechanisms such as induction of related signaling pathways, effluxion of salt
ions, accumulation of these toxic ions in their vacuoles, activation of their detoxification
mechanisms and production of osmoprotectans.
In this study, identification of salt responsive proteins in moderately halophyte
wild type sugar beet Beta vulgaris ssp. maritima was aimed. In order to investigate the
protein-based natural stress tolerating mechanisms, plants were exposed to 150 mM
NaCl and total proteins were extracted. Differentially expressed proteins were identified
by proteomic approaches including MALDI-TOF/TOF mass spectrometry combined
two dimensional polyacrylamide gel electrophoresis. The results revealed that
enzymatic antioxidants and secondary members of antioxidative pathways are
responsive in salt stress. In conclusion, these detected proteins demonstrate that
antioxidative system may be the major defense mechanism in halophytic plants.

v
ÖZET
2D-PAGE İLE MALDI-TOF/TOF SİSTEMİ KULLANILARAK YABANİ
ŞEKER PANCARINDA (BETA MARİTİMA) TUZ STRESİNE DUYARLI
PROTEİNLERİN BELİRLENMESİ
Yüksek tuzluluk bitkilerde homeostaziyi, büyümeyi ve üretkenliği etkileyen
abiyotik streslerden biridir. Bitkilerde esansiyel olmayan tuz iyonlarının alımı,
hücrelerin osmotik dengesini değiştirerek ve aşırı susuzluğa neden olarak, bitkilerin
anatomisini, fizyolojisini ve metabolizmasını olumsuz yönde etkiler. Bu durumda
yüksek bitkiler ilgili sinyal yolaklarını uyarmak, tuz iyonlarını dışarı atmak, bu toksik
iyonları vakuollerinde biriktirmek, detoksifikasyon mekanizmalarını aktive etmek ya da
osmoprotektan üretmek gibi tuz tolerans mekanizmaları geliştirirler.
Bu çalışmada kısmi halofit yabani tür şeker pancarı Beta vulgaris ssp.
maritima’da tuza duyarlı proteinlerin belirlenmesi amaçlanmıştır. Protein esaslı doğal
stres tolerans mekanizmalarını keşfetmek için bitkiler 150 mM NaCl’e maruz bırakılmış
ve total proteinleri elde edilmiştir. Farklı olarak ifadelenen proteinler MALDI-
TOF/TOF ile kombine edilmiş iki boyutlu poliakrilamid jel elektroforezini kapsayan
proteomik uygulamalarıyla belirlenmiştir. Sonuçlar ortaya çıkarıyor ki enzimatik
antioksidanlar ve antioksidatif yolakların ikincil üyeleri tuz stresine duyarlılık
göstermektedir. Sonuç olarak, tespit edilen proteinler gösteriyor ki halofitik bitkilerde
antioksidatif sistem majör savunma mekanizması olabilir.

vi
TABLE OF CONTENTS
LIST OF FIGURES .......................................................................................................... viii
LIST OF TABLES .............................................................................................................. ix
LIST OF ABBREVIATIONS ............................................................................................. x
CHAPTER 1. INTRODUCTION ................................................................................ 1
1.1. A Potential Halophyte: Beta maritima ............................................... 1
1.2. Soil Salinity and Effects on Plants .................................................... 1
1.3. Effects of Salinity on Plant Anatomy, Physiology and
Metabolism ...................................................................................... 3
1.3.1. Effects on Plant Anatomy ............................................................ 3
1.3.2. Effects on Plant Physiology and Photosynthesis .......................... 3
1.3.3. Effects on Plant Metabolism ........................................................ 4
1.4. Salt Tolerance Mechanisms in Plants ................................................ 5
1.4.1. Genetic Profiles of Plants and Signaling Pathways of
Salt Tolerance .............................................................................. 6
1.4.2. Transport Mechanisms: Accumulation or Exclusion of Ions
by Ion Pumps, Antiporters and Channels ..................................... 8
1.4.2.1. Influx Mechanisms of Ions ................................................ 9
1.4.2.2. Efflux Mechanisms of Ions .............................................. 11
1.4.3. Antioxidative Response Mechanisms of Plants .......................... 12
1.4.4. Production of Osmolytes / Osmoprotectans ............................... 15
1.5. Proteomic Approaches for Salt Exposed Plants .............................. 16
1.5.1. Proteomics of Salinity Proteins in Plants ................................... 16
1.5.2. Basic Techniques in Proteomics ................................................ 17
1.5.3. Mass Spectrometry-Based Techniques ...................................... 18
CHAPTER 2. MATERIALS AND METHODS ......................................................... 21
2.1. Materials ........................................................................................ 21
2.2. Methods ......................................................................................... 21
2.2.1. Plant Growth and Salt Exposure ................................................ 21

vii
2.2.2. Total Protein Extraction with Phenol Extraction Method ........... 21
2.2.3. Protein Quantification with Bradford Assay .............................. 22
2.2.4. 2-Dimensional Polyacrylamide Gel Electrophoresis
(2D-PAGE) ................................................................................ 23
2.2.4.1. First Dimension: Isoelectric Focusing .............................. 23
2.2.4.2. Equilibration of IPG Strips .............................................. 24
2.2.4.3. Second Dimension: SDS-PAGE ...................................... 24
2.2.5. Gel Comparison and Spot Selection .......................................... 25
2.2.6. In-Gel Digestion with Trypsin ................................................... 25
2.2.7. ZipTip Assay ............................................................................ 27
2.2.8. Sample Preparation for MALDI-TOF/TOF Mass
Spectrometry ............................................................................. 27
2.2.9. Mass Spectrometric Analyzes via MALDI-TOF /TOF .............. 28
CHAPTER 3. RESULTS AND DISCUSSION .......................................................... 29
3.1. Effects of NaCl on Plant Growth .................................................... 29
3.2. Measurements of Protein Concentrations by Bradford Assay .......... 30
3.3. Determination of Salt Stress Responsive Proteins ........................... 31
3.3.1. Separation of Proteins via 2D-PAGE ......................................... 31
3.3.2. Bioinformatic Confirmation of Spot Selections ......................... 34
3.4. Identification of Salt Stress Responsive Proteins by
MALDI-TOF/TOF Mass Spectrometry .......................................... 35
CHAPTER 4. CONCLUSION ................................................................................... 40
REFERENCES .......................................................................................................... 41
APPENDICES
APPENDIX A. LIST OF CHEMICALS .................................................................... 47
APPENDIX B. CHEMICAL CONTENTS OF USED
BUFFERS / SOLUTIONS ................................................................ 48
APPENDIX C. SECOND AND THIRD SETS OF 2D-PAGE AND
BIOINFORMATIC RESULTS ......................................................... 51

viii
LIST OF FIGURES
Figure Page
Figure 1.1. Salt Overly Stress (SOS) and abscisic acid pathway in plants ....................... 7
Figure 1.2. Ion transport systems on plasma and vacuolar membrane of
plant cells ........................................................................................................ 10
Figure 1.3. ROS production and scavenging mechanisms under salt stress .................. 13
Figure 1.4. Basic steps of proteomic approaches ............................................................ 18
Figure 1.5. Schematic representation of MALDI-TOF/TOF ......................................... 19
Figure 3.1. Comparisons of plant profiles after salt exposure ........................................ 29
Figure 3.2. Standard curve for BSA ................................................................................. 30
Figure 3.3. 2D gel images of leaf proteins and selected spots which are
differentially expressed ................................................................................. 32
Figure 3.4. 2D gel images of root proteins and selected spots which are
differentially expressed ................................................................................. 33
Figure 3.5. Scattering plots of leaf and root protein spots on 2D gel images ................ 34
Figure 3.6. Graphical demonstration of calculated relative spot volumes
indicating expression profiles ....................................................................... 35

ix
LIST OF TABLES
Table Page
Table 3.1. Average concentrations of extracted proteins from
plant samples .................................................................................................... 30
Table 3.2. Salt stress responsive proteins identified by MALDI-TOF/TOF ................. 36

x
LIST OF ABBREVIATIONS
•O2- Superoxide Radical
oC Centigrade degree
1,5-DAN 1,5-diaminonaphtalene
1O2 Singlet Oxygen
2D-PAGE Two Dimensional-Polyacrylamide Gel Electrophoresis
ABA Abscisic Acid
ABC ATP Binding Cassette
ABF3/4 Abscisic Acid Responsive Elements-Binding Factor 3/4
ABI1/2 ABA Insensitive-1/2
ACTH Adrenocorticotropic hormone
AGP Arabinogalactan Protein
Al3+
Aluminum ion
ALMT Aluminum Activated Malate Channels
APX Ascorbate Peroxidase
ASC Ascorbic acid
ATP Adenosine Triphosphate
AVP1/2 Arabidopsis Vacuolar H+-Pyrophosphatase 1/2
BSA Bovine Serum Albumin
Ca2+
Calcium ion
cAMP cyclic Adenosine Monophosphate
CAT Catalase
CBB G-250 Coomassie Brilliant Blue G-250
CCC Cation-Coupled Cl-
cGMP cyclic Guanidine Monophosphate
CHAPS 3-[(3-Cholamidopropyl)dimethylammonio]-1-propanesulfonate
CHCA -cyano-4-hydroxycinnamic acid
CID Collision Induced Dissociation
Cl- Chloride ion
CLC Chloride Channel
CNGC Cyclic Nucleotide Gated Channel

xi
CO2 Carbon Dioxide
Cu Copper
Da Dalton
DHA Dehydroascorbate
DHAR DHA Reductase
DHB 2,5-dihyroxybenzoic acid
DMSP Dimethyl Sulfonium Propironate
dS/m deciSiemens per meter
DTT Dithiothreitol
EC number Enzyme Commission number
EC Electrical Conductivity
ECD Electron Capture Dissociation
EF-1 Elongation Factor-1 alpha
ESI Electrospray Ionization
ETD Electron Transfer Dissociation
Fe2+
Iron (II) ion
Fe3+
Iron (III) ion
g gram
g gravity
GB Glycinebetaine
GPX Glutathione Peroxidase
GR Glutathione Reductase
GSH Glutathione
GSSG Oxidized GSH
ha hectare
H2O2 Hydrogen Peroxide
HKT1 High Affinity K+ Transporter 1
HSP Heat Shock Protein
IEF Isoelectric Focusing
IPG Immobilized pH Gradient
K+ Potassium ion
KEA K+ Efflux Antiporter
KIRC K+ Inward Rectifying Channel

xii
KORC K+ Outward Rectifying Channel
KUP/HAK/KT K+ Uptake Permease / High Affinity K
+ Transporters
LC Liquid Chromatography
LCT1 Low Affinity Cation Transporter1
Li+
Lithium ion
m/z mass to charge ratio
MALDI Matrix-Assisted Laser Desorption / Ionization
MAP Mitogen-Activated Protein
MDA Monodehydroascorbate
MDAR MDA Reductase
Mg2+
Magnesium ion
MKK2 MAP Kinase Kinase 2
Mn2+
Manganese ion
MS Mass Spectrometry
MscS Mechanosensitive Channels of Small Conductance
MSL MscS-like
N2 Nitrogen
Na+ Sodium ion
NaCl Sodium Chloride
NADH Nicotinamide Adenine Dinucleotide
NADPH Nicotinamide Adenine Dinucleotide Phosphate
NHX1/5 Na+/H
+ Antiporter 1/5
NL Non-linear
NO3- Nitrate ion
NRT (NOD)s Nitrate and Peptide Transporter
O2 Oxygen
OH• Hydroxyl Radical
PA Picolinic Acid
P-ATPase Plasma Membrane-ATPase
PCIS Precursor Ion Selector
pI Isoelectric point
PLP Pyridoxal-5-phosphate
PMSF Phenylmethylsulfonyl fluoride

xiii
PN/PL/PM Pyridoxine / Pyridoxal / Pyridoxamine
POX Peroxidase
PP Pyrophosphate
PPI Protein Phosphatase Interaction
ppm pounds per million
RH Relative Humidity
ROS Reactive Oxygen Species
rpm revolutions per minute
RuBisCO Ribulose-1,5-bisphosphate carboxylase/oxygenase
SA Sinapinic Acid
SCX Strong Cationic Resin
SDS Sodium Dodecyl Sulfate
SID Surface Induced Dissociation
SLAC1 Slow Anion Channel Associated Protein1
SOD Superoxide Dismutase
SOS Salt Overly Sensitive
SSP Salt Shock Protein
ssp subspecies
TEMED N, N, N’, N’-Tetramethyl-ethane-1,2-diamine
TFA Trifluoro Acetic acid
THAP 2,4,6-trihydroxyacetophenone
TOF Time of Flight
Trx Thioredoxin
UP Ultrapure
UV Ultraviolet
v/v volume per volume
V-ATPase Vacuolar-ATPase
VDAC Voltage Dependent Anion Channel
Vh Voltage hour
VIC Voltage Independent Cation Channel
V-PPase Vacuolar Pyrophosphatase
w/v weight per volume

1
CHAPTER 1
INTRODUCTION
1.1. A Potential Halophyte: Beta maritima
Beta maritima, also known as sea beet, is classified as subspecies of Beta
vulgaris in taxonomy (Lange, Brandenburg, and De Bock 1999). Beta maritima is the
wild type of sugar beet and grown in coastal areas (Srivastava et al. 2000). Its ecologic
situation indicates that sea beet is resistant to several abiotic stresses such as high
salinity.
In horticultural and agricultural sciences, plants are divided into several
categories as a result of their salt stress responses: sensitive, moderately sensitive,
moderately tolerant and tolerant, respectively. According to these categories, salt-
sensitive plants are renamed as glycophytes and salt-tolerant ones are halophytes. In this
case, sugar beet (Beta vulgaris ssp. maritima and ssp. vulgaris) is a halophytic plant
related to its moderately tolerant characteristic which refers to tolerating 7 dS / m
electrical conductivity (EC) of soil salinity (Blaylock 1994; Glenn, Brown, and
Blumwald 1999; Chinnusamy, Zhu, and Zhu 2006).
1.2. Soil Salinity and Effects on Plants
Salt affects over 800 million ha soil on earth (Teakle and Tyerman 2010). All
soils have differential salt contents. Calcium (Ca2+
), magnesium (Mg2+
), iron (Fe3+
),
aluminum (Al3+
), phosphorus (P) and sodium (Na+) are the cations found in all soil
types (Bronick and Lal 2005). In several soil regions on earth, these cations are
accumulated excessively with their soluble salt forms such as sodium chloride (NaCl),
the most abundant form (Koca et al. 2007). Optimal electrical conductivity unit (EC) of
NaCl in soil is 4 dS/m which refers to 40mM approximately. Soils containing NaCl in
higher concentrations are accepted as saline soils (Munns and Tester 2008).

2
Soil salinity, excessive accumulation of salt in soil, is one of the agricultural
problems that affect the crop yield through damaging germination, growth and fruit
production. High concentrations of salt ions have three different effects on plants
basically: Water stress, salt stress and ionic imbalance stress (Mudgal, Madaan, and
Mudgal 2010).
First, in water stress; salt ions prevent the efficient uptake of water via negative
osmotic potential. In general, plants use most of their energy for growth, flowering and
fruiting. However, in salty environment, they consume their energy to take sufficient
amount of water instead of growing processes. In addition, high uptake of salt ions
increases the osmotic potential in plants. This increment affects the tension of xylem in
a parallel way and plant takes more water in order to balance the osmotic potential.
Large amounts of water in plant cells increase the turgor pressure in long-term. Thus,
high salinity causes osmotic stress in addition to water stress (Parida and Das 2005).
Second, in salt stress; some salt ions such as sodium, chloride or boron have
toxic effects on plant metabolism. NaCl, a phytotoxic salt, causes oxidative damage on
plant metabolism (i.e. inhibition of transpiration) via overproduction of reactive oxygen
species (ROS) such as superoxide radical (•O2), hydrogen peroxide (H2O2), hydroxyl
radical (OH•) and singlet oxygen (1O2). These radicals cause peroxidation of membrane
lipids, destruction of skeleton structure and dysfunction of cell (Hu et al. 2011). On the
other hand, boron forms strong complexes with metabolites such as ATP, NADH and
NADPH, which have a high number of hydroxyl groups and affect the energy
production negatively (Reid 2010).
Third, in ionic imbalance stress; non-essential ions (i.e. Na+ monovalent
cations), compete with essential ions (i.e. K+ monovalent cations) and interfere to
uptake or usage of them in biochemical reactions and cause nutritional imbalance
(Blaylock 1994; Chinnusamy, Zhu, and Zhu 2006). This competition between Na+ and
K+ ions in plant metabolism results from their physicochemical similarity (Maathuis and
Amtmann 1999).

3
1.3. Effects of Salinity on Plant Anatomy, Physiology and Metabolism
1.3.1. Effects on Plant Anatomy
Salt ions are highly effective on plant growth. Previous researches have
demonstrated that plants exposed to high concentrations of salt, have a loss in their
biomass. Dry weights of leaves, root, shoot, tubers and nodules decrease when the salt
concentration increases. Excess salt reduces the shoot growth 50%, approximately.
Flowering is delayed, number of flowers and pods, nodulation ratio and fixation
efficiency of nodules decreases (Mudgal, Madaan, and Mudgal 2010). Moreover, since
leaves cannot expand, their surface areas remain smaller than non-exposed ones
(Marcelis and Van Hooijdonk 1999; Meloni et al. 2001). Despite of deceleration in
expansion of leaf surface, there is a significant increment in both epidermal and
mesophyll thickness according to palisade and spongy layers of leaf structure
(Longstreth and Nobel 1979).
Increment in thickness is the result of chloroplast, mitochondria and
endoplasmic reticulum swelling, formation of more Golgi bodies and larger vacuoles in
plant cell (Mitsuya, Takeoka Y., and H. 2000).
In addition to intracellular organelles, plasma membrane is also reacted against
salt ions. In order to control the ion fluxes, both stability/permeability and enzyme
activities are regulated by differentiating the lipid composition. Excess concentrations
of salt ions decrease the amount of sterols, phospholipids in contrast to glycolipids.
Ratio of unsaturated fatty acids to saturated fatty acids is also slightly decreased (Wu,
Seliskar, and Gallagher 1998).
1.3.2. Effects on Plant Physiology and Photosynthesis
Physiology of a plant, including homeostasis and molecular contents, can be
differentially affected by salt ions depending on plant age, types of ions, intensity and
period of exposure (Chaves, Flexas, and Pinheiro 2009). Major physiological changes in
plants, as a result of salt stress, are osmotic imbalances, differentiations in cellular

4
rigidity, variations in ion levels, production of alternative metabolites and defensive
molecules such as antioxidants (Parida and Das 2005).
It is found that when mangrove plants were exposed to different concentrations
of NaCl, Na+ and Cl
- levels increased, Ca
2+, Mg
2+, Cu
2+ and Mn
2+ levels decreased and
Fe2+
and K+ levels stabilized (Parida, Das, and Mittra 2004).
Oxidative effect of salinity is another physiological concept which induces the
expression of antioxidative enzymes and generation of antioxidant molecules.
Superoxide dismutases containing metals such as Cu, Fe, Zn etc., ascorbate peroxidases,
monodehydroascorbate reductases and glutathione reductases are some of the enzymes
which play role in antioxidative mechanism in the presence of salt stress (Hernandez et
al. 1999).
High salinity also affects the efficiency of photosynthesis which is an essential
physiological process for plants enabling them to produce their own nutrition. In saline
environment, highly uptake of salt ions decreases the water potential in plants. This
dehydration limits the stomal opening process which is regulated by root- and shoot-
generated hormones. Therefore CO2 permeabilization of cell membranes and CO2
conductance on mesophyll are reduced. Intercellular absence of CO2 lowers the activity
of basic photosynthetic enzyme RuBisCO (Ribulose-1,5-bisphosphate carboxylase
oxygenase, EC 4.1.1.39) and other related enzymes (Chaves, Flexas, and Pinheiro
2009).
Besides, salt ions inhibit several photosynthesis responsible enzymes, decrease
the production efficiency of photosynthetic pigments such as protochlorophyll,
chlorophyll and carotenoid and cause chlorosis in further phases (Agastian, Kingsley,
and Vivekanandan 2000; Parida and Das 2005). Consequently, photosynthesis is
affected significantly as a physiological process by high concentrations of salt ions.
1.3.3. Effects on Plant Metabolism
Carbon taking place in all nutritional productions and nitrogen playing role in
nodule formation through fixation, are the cornerstones of plant metabolism.
Chloride (Cl-) is the most common ion that causes stress in nitrogen metabolism
of plants. Recent studies have indicated that Cl- found in soil decreases the uptake of

5
nitrate (NO3-) ions and inhibits the nitrate reductases. Thus, nitrogen fixation through
nodulation is deactivated in plants (Flores et al. 2000).
The linkage of carbon and nitrogen pathways requires NADP-specific isocitrate
dehydrogenase (EC 1.1.1.42). This linkage is provided by assimilation of nitrogen atom
according to carbon allocation in metabolic compounds. Long-term exposure of salt
stress in plants reduces the activity of this crucial enzyme (Popova et al. 2002).
Another metabolic crosslink enzyme, NADP-malate dehydrogenase (EC
1.1.1.82) which reduces the oxaloacetate to malate in chloroplasts is increased by salt
stress (Cushman 1993).
1.4. Salt Tolerance Mechanisms in Plants
Hypothetically, halophytes may be evolved from survived glycophytes under
salinity stress. Evidence to this idea is that highly glycophytic Arabidopsis has some
close relatives which are extremely halophytic (Zhu 2000). Taking Zhu’s hypothesis as
a theoretical framework, in this section how halophytes can survive under salt stress is
discussed in details.
Salt tolerant (halophytic) plants can develop many alternative survival pathways
against salinity stress. This tolerance can be explained by three different characteristics
of a plant: 1- Plant may export the ions or accumulate in their vacuoles by specific
transporters, 2- Their morphological features, biomass distributions, control of
transpiration rate by stomal closure may provide adaptation, 3- Metabolic and
physiological regulations may stabilize the intracellular ion levels (Winicov 1998).
In tolerance mechanisms, genetic based strategies include chromosomal changes
via epigenetic modifications such as DNA methylation and also polyploidization,
amplification of specific sequences, DNA elimination or transcriptional regulation via
induction of specific transcription factors such as ABF3 and ABF4 (Abscisic acid
responsive elements-Binding Factor 3 and 4) (Wang, Vinocur, and Altman 2003; Parida
and Das 2005).
Furthermore, halophytes use many biochemical regulation points such as ion
accumulations in specific compartments of cells, controlling the activity of plasma
membrane transporters and/or water channel proteins, generating of compatible

6
products, differentiating in photosynthetic pathway including carbon metabolism and
energy production, modification of cell wall/membrane composition, induction of
osmoprotectans, molecular chaperons or defensive molecules (i.e. antioxidants,
detoxifying enzymes, proteases or hormones) which enable plants to deal with salinity
stress. (Parida and Das 2005; Winicov 1998).
1.4.1. Genetic Profiles of Plants and Signaling Pathways of Salt
Tolerance
Salt induction in many plants may be concluded as transcriptional, translational
or post-translational regulation following the receiving of stress signals to related
receptors. Plants regulate the expression of metabolic pathway proteins and signaling
proteins as well as transcription factors. During salt exposure transcripts of ribosomal
proteins, homologous of abscisic acid responsive genes and elongation factor-1EF-
1 increase in order to control transcriptional activity (Kawasaki et al. 2001).
Regulation of signaling has also crucial roles in tolerance mechanisms in plants.
Most of the abiotic stresses trigger similar regulation pathways, though some of them
behave specifically.
One of the signaling mechanisms induced by salt stress is Salt Overly Sensitive
(SOS) mediated pathway (Figure 1.1). SOS1, SOS2 and SOS3 are the three main
components of the pathway and have an essential role in salt tolerance mechanism.
Hence, all of sos1, sos2 and sos3 mutant plants are hypersensitive to salt and they
accumulate Na+
or Li+ ions excessively (Zhu 2000; Chinnusamy, Zhu, and Zhu 2006).
When a plant is exposed to salt stress, firstly Ca2+
signals are generated in order
to serve as a secondary messenger against stress factor (Knight, Trewavas, and Knight
1997). Then, Ca2+
ions are sensed by SOS3 which includes an N-myristoylation motif
and three Ca2+
binding EF hand which is a helix-loop-helix structural domain. The
myristoylation domain of SOS3 leads to SOS2 in order to recruit on plasma membrane
(Quintero et al. 2002).
SOS2, which encodes a serine/threonine protein kinase with an N-terminal
catalytic domain and a C-terminal regulatory domain, is activated after recognition of
Ca2+
signals by SOS3. (Chinnusamy, Zhu, and Zhu 2006; Liu et al. 2000). Activation of
SOS2 kinase triggers a cascade mechanism via phosphorylation through mitogen-

7
activated (MAP) kinases, MAP kinase kinase 2 (MKK2) and the two other MAP
kinases (MPK4 and 6) (Teige et al. 2004). SOS3 and SOS2 together phosphorylate
SOS1 which is a Na+/H
+ antiporter embedded in plasma membrane in order to regulate
the expression level, (Liu et al. 2007; Chinnusamy, Zhu, and Zhu 2006). Moreover, the
SOS3-SOS2 couple inhibits the activity of low-affinity Na+ transporter (HKT1) and
activates the ion accumulators on vacuole membranes (NHX1, NHX5, AVP1 and
AVP2) under salt stress (Mahajan, Pandey, and Tuteja 2008).
SOS4 and SOS5 are the other SOS pathway members discovered during
exposing plants to higher concentrations of salt. SOS4 encodes a pyridoxine / pyridoxal
/ pyridoxamine (PN / PL / PM) kinase that catalyzes the biosynthesis reaction of
pyridoxal-5-phosphate (PLP), the active form of vitamin B6. It is proposed that PLP
may function as a regulator of ion channels or transporters included in salt tolerance
mechanisms (Mahajan, Pandey, and Tuteja 2008; Shi et al. 2002).
Figure 1.1. Salt Overly Sensitive (SOS) and abscisic acid (ABA) pathways in plants.
Salt stress triggers these signaling pathways and initiates the tolerance
mechanisms (Source: Türkan and Demiral 2009)

8
SOS5 encodes a protein which is highly similar to AtAGP8, an arabinogalactan
protein (AGP) belonging to Arabidopsis thaliana. SOS5 possibly plays role in cell
adhesion. It may aggregate on cell walls by their polysaccharide tails and form a unique
network (Shi et al. 2003).
Another regulative signaling mechanism is Abscisic acid (ABA) pathway
activated by salt stress indirectly. One of the cellular effects of salt stress is osmotic
imbalance. This situation causes biosynthesis and accumulation of phytohormone ABA
in cytosol as a conclusion of Ca2+
signals (Chinnusamy, Jagendorf, and Zhu 2005).
ABA is a well known plant hormone and it has different functions such as acting as an
osmo-regulator under drought and salt stresses (Barrero et al. 2006), taking place in
developmental phases of plants, adjusting the physiological state under stress conditions
(Chandler and Robertson 1994), depolarizing the plasma membrane potential and
regulating the redistribution of ions and solutes from tonoplast and cytoplasm to
apoplast in order to control the osmotic balance (Rock 2000; Chinnusamy, Zhu, and
Zhu 2006).
High levels of ABA, activates the ABA insensitive-1 (ABI1). ABI1 regulates the
stomata behaviors on leaves and mitotic activity of root meristems. On carboxyl
terminus, ABI1 includes a domain related to serine/threonine phosphatase 2C, however
in amino terminus, a unique Ca2+
binding EF hand domains. This specific structure may
provide the aggregation of ABA and Ca2+
signals for phosphorylation based response
pathways (Leung et al. 1994).
Another activated factor in the presence of ABA, ABA insensitive-2 (ABI2)
protein phosphatase 2C, inhibits the SOS pathway through interaction with protein
phosphatase interaction (PPI) motif of SOS2. Thus, ABA down-regulates both of the
Na+/H
+ antiporters that localize on plasma membrane (SOS1) and vacuolar membrane
(NHX1) (Chinnusamy, Jagendorf, and Zhu 2005).
1.4.2. Transport Mechanisms: Accumulation or Exclusion of Ions by
Ion Pumps, Antiporters and Channels
It is generally known that plants are defected by nutrient imbalance or ionic
toxicity of salt. Increment in several toxic ions such as Na+ or Cl
- and/or decrement in
essential ions such as K+ or Ca
2+ may be the basic reason of this defection. Therefore,

9
plant develops strategies in order to export the toxic ions and stabilize the levels of
essential ions in cells (Mansour, Salama, and Al-Mutawa 2003).
Ion transportation occurs in both plasma membrane and vacuolar membrane.
Hence, toxic ions may be either excluded through the plasma membrane or accumulated
in vacuoles. Transport systems activated in salt stress include non-selective cation
channels, anion channels for Cl- ions, plasma membrane ATPases (P-ATPases),
vacuolar ATPases (V-ATPases), vacuolar pyrophosphatases (V-PPase), plasma
membrane and vacuolar Na+/H
+ antiporters, K
+/H
+ antiporters, Cl
-/2H
+ symporters, K
+
channels and water channels (aquaporins) for osmotic adjustment (Mansour, Salama,
and Al-Mutawa 2003; Munns and Tester 2008; Maser, Gierth, and Schroeder 2002;
Bohnert, Su, and Shen 1999) (Figure 1.2.)
1.4.2.1. Influx Mechanisms of Ions
Sodium and chloride, phytotoxic ions, induce several cellular reactions and
accelerate the tolerance mechanisms. When plants absorb Na+ ions from soil, they
cannot discriminate these ion types from K+ ions due to their chemical similarity and
import Na+ ions into the cells. There are three types of channels that are responsible for
K+ transport and keep the intracellular K
+/Na
+ ratio constant. K
+ inward rectifying
channels (KIRC) such as AKT1 localize in plasma membrane and activate K+ influx via
hyperpolarization. In high concentrations of Na+ ions, they may leak through these
channels. K+ outward rectifying channels (KORC) are the second group which the
efflux K+ ions to outer side of the plasma membrane via depolarization. KORC also
import Na+ ions to balance the intracellular K
+/Na
+ ratio. The last group, voltage-
independent cation (VIC) channels also localize in plasma membrane and transport
cationic ions selectively, in contrast to voltage-dependent channels, shaker-type K+
channels such as KIRC and KORC (Blumwald 2000; Yokoi, Bressan, and Hesagawa
2002; Maser, Gierth, and Schroeder 2002).
VIC channels were first identified in wheat with their action nutrition, osmotic
adjustment and charge compensation functions (White 1997). VIC channels select the
monovalent cations according to their affinity. In addition, these channels are permeable

10
to divalent cations such as Ca2+
. In other words, Ca2+
may regulate the intracellular
homeostasis through these channels (White and Davenport 2002).
HKT, KUP/HAK/KT, LCT1 and CNGC are some of the other cation
transporters that play role in ion accumulation in cytoplasm. HKT and KUP/HAK/KT
are the two high affinity K+ transporter families. HKT family contains four P-loop
domains that are effective on ion transportations. HKT1, the first identified member of
this family, is a symporter which supports the K+ uptake via Na
+ coupling. In the
presence of excess amount Na+, K
+ accumulation through HKT1 is repressed and low-
affinity Na+ uptake occurs. Moreover, point mutations on HKT1 increase the Na
+
tolerance of plants. Thus, HKT family may be a defensive factor against salt stress
(Maser, Gierth, and Schroeder 2002; Rubio, Gassmann, and Schroeder 1995; Munns
and Tester 2008). KUP/HAK/KT, another high-affinity family imports the Na+ ions as
well as K+. However, transportation may occur competitively and K
+ transportation may
be inhibited by high amount of Na+ ions (Maser, Gierth, and Schroeder 2002).
Figure 1.2. Ion transport systems on plasma and vacuolar membrane of plant cells (The
figure was modified from Maser, Gierth et al. 2002; Mansour, Salama et al.
2003; Munns and Tester 2008; Teakle and Tyerman 2010).

11
LCT1, low affinity cation transporter, imports Na+, K
+ besides Ca
2+ and Cd
2+
(Clemens et al. 1998). It is also demonstrated that Ca2+
ions, at the above of determinant
concentrations, inhibit the N+ uptake of LCT1 (Amtmann et al. 2001).
CNGCs, cyclic nucleotide gated channels, are permeable to several cations. As it
is mentioned on its name, these gated channels are controlled by cyclic nucleotides,
cAMP and cGMP. Control of the gate is concluded as regulation of Na+
uptake
(Maathuis and
Sanders
2001).
In addition to cationic transports, there are also several anionic transportation
mechanisms. Chloride is the most common anion belongs to high amount of NaCl in
soils. In general, plants need micro levels of Cl- ions as a regulator of enzyme activity,
an essential cofactor in photosynthesis or a stabilizer of membrane potential and turgor
pressure of cell (Teakle and Tyerman 2010). In related literature, Cl-/2H
+ symporters
and several anion channels which can flux Cl- ions in cells are the only identified
transporters (White and Broadley 2001).
1.4.2.2. Efflux Mechanisms of Ions
In nature, plant cells protect themselves from cytotoxic ions by either effluxing
the ions to outer side of the membrane or accumulating in their storage organelles
vacuoles. Most of the effluxion processes occur via regulating the proton (H+) gradient
in cytoplasmic and vacuolar systems. Energy dependent H+ pumps change the
membrane potential in addition to electrochemical balance of the cell and facilitate the
transportation of phytotoxic ions on reverse directions (Hussain et al. 2010).
Plasma membrane ATPase, vacuolar ATPase and pyrophosphatases are the
basic proton pumps. They hydrolyze adenosil triphosphate (ATP) or pyrophosphate
(PP), and pump the protons either outer side of the plasma membrane or inner side of
the vacuolar membrane tonoplast (Mansour, Salama, and Al-Mutawa 2003). As these
pumps remove the protons from the cytoplasm; several antiporters such as SOS1 or
KEA are activated against electrochemical gradient. These antiporters are integral
membrane proteins which exchange the protons and Na+/K
+ ions across the plasma
membrane or tonoplast in order to accumulate ions in vacuoles (Blumwald 2000; Maser,
Gierth, and Schroeder 2002; Mansour, Salama, and Al-Mutawa 2003).

12
Since the Cl- transport mechanisms are not identified well, it is predicted that
several candidate anion transporter genes may also be permeable for Cl-. These anion
transporters include mechanosensitive channels of small conductance (MscS)-like
(MSL), voltage dependent anion channels (VDAC), porins, the CLC (chloride channel)
anion channels, anion/H+ antiporters, the NRT (NOD)s nitrate and peptide transporter
family, the ATP-binding cassette (ABC) transporter family, aluminum activated malate
channels (ALMT), cation-coupled Cl- (CCC) and recently identified slow anion
channel associated protein (SLAC1) (Teakle and Tyerman 2010). There are at least
three types of Cl- permeable channels on plasma membrane. They are rapidly activated
anion channels (R-type), slowly activated anion channels (S-type) or stretch-activated
anion channels. These channels facilitate the flux of Cl- ions outer side of the plasma
membrane (White and Broadley 2001).
1.4.3. Antioxidative Response Mechanisms of Plants
Reactive oxygen species (ROS) are the variations of oxygen (O2) which are
produced by changing electron/energy distribution of O2 molecules during aerobic
cellular processes such as chloroplast/mitochondrial electron transport or
chlororespiration (Chinnusamy, Zhu, and Zhu 2006; Apel and Hirt 2004). Hence, the
main ROS generators in cells are mitochondria, chloroplasts and peroxisomes.
In chloroplasts, electron acceptor of photosystem I reduces oxygen molecules
and produce superoxide anion (•O2-
) and hydrogen peroxide (H2O2). Also excited
chlorophyll molecule transfers its electron to oxygen molecule and produces singlet
oxygen (1O2) during photosynthesis. The main component of the photosynthesis,
ribulose 1,5-bisphosphate carboxylase-oxygenase (RuBisCO) contributes to ROS
production via oxygenase reactions. Chlororespiration, another ROS production
process, begins with the reduction of oxygen by NAD(P)H dehydrogenase on
respiratory chain and terminates with oxidases that compete with photosynthetic
electron transport chain in chloroplasts. Similarly, in mitochondria most of the ROS are
generated on electron transport chain (Jithesh et al. 2006; Apel and Hirt 2004).
When a plant is exposed to any of the abiotic stresses such as salinity, oxidative
stress occurs related to over-production of ROS (Ashraf and Harris 2004). Oxidative
13
stress affects membrane integrities, enzyme activities and photosynthesis efficiency via
damaging ROS to proteins, lipids and other cellular components (Jithesh et al. 2006;
Bohnert, Su, and Shen 1999).
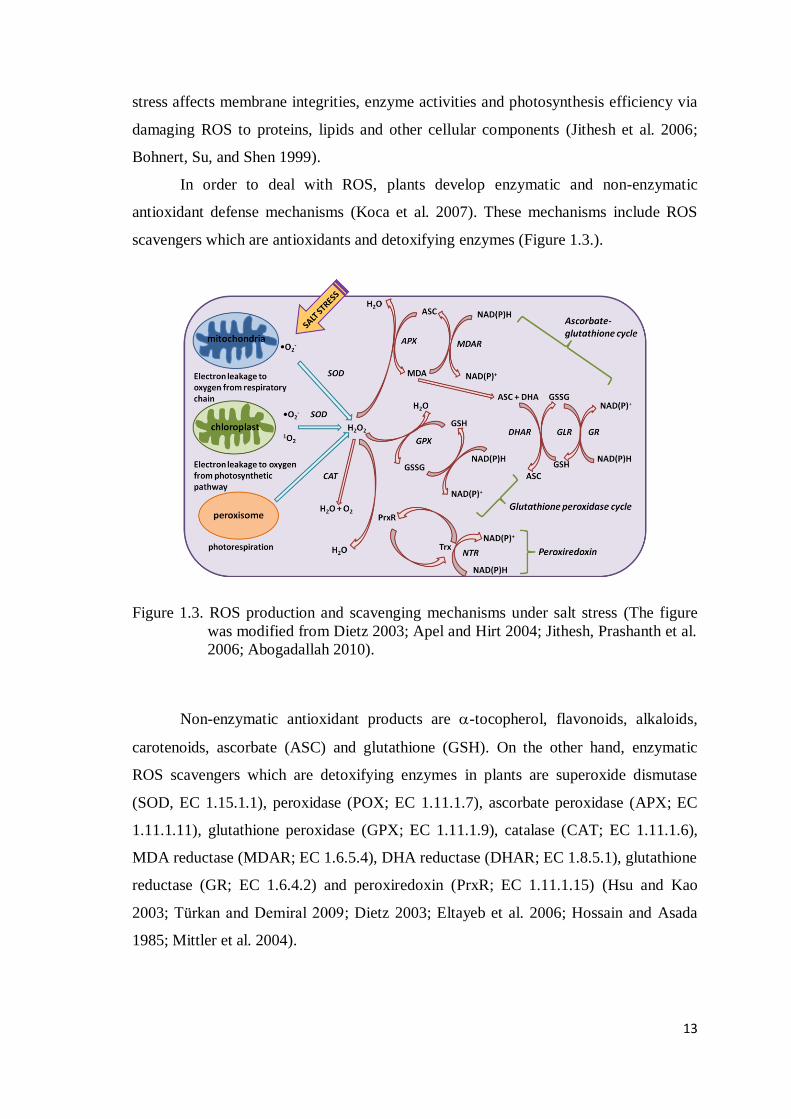
In order to deal with ROS, plants develop enzymatic and non-enzymatic
antioxidant defense mechanisms (Koca et al. 2007). These mechanisms include ROS
scavengers which are antioxidants and detoxifying enzymes (Figure 1.3.).
Figure 1.3. ROS production and scavenging mechanisms under salt stress (The figure
was modified from Dietz 2003; Apel and Hirt 2004; Jithesh, Prashanth et al.
2006; Abogadallah 2010).
Non-enzymatic antioxidant products are -tocopherol, flavonoids, alkaloids,
carotenoids, ascorbate (ASC) and glutathione (GSH). On the other hand, enzymatic
ROS scavengers which are detoxifying enzymes in plants are superoxide dismutase
(SOD, EC 1.15.1.1), peroxidase (POX; EC 1.11.1.7), ascorbate peroxidase (APX; EC
1.11.1.11), glutathione peroxidase (GPX; EC 1.11.1.9), catalase (CAT; EC 1.11.1.6),
MDA reductase (MDAR; EC 1.6.5.4), DHA reductase (DHAR; EC 1.8.5.1), glutathione
reductase (GR; EC 1.6.4.2) and peroxiredoxin (PrxR; EC 1.11.1.15) (Hsu and Kao
2003; Türkan and Demiral 2009; Dietz 2003; Eltayeb et al. 2006; Hossain and Asada
1985; Mittler et al. 2004).

14
Superoxide dismutase, initial step of detoxification, converts the superoxide
oxygen anion (•O2-
) to hydrogen peroxide (H2O2) which is then reduced to H2O via
ascorbate-glutathione and glutathione peroxidase cycles. Thus, ascorbate and
glutathione are the key points of antioxidative mechanism through the NAD(P)H
dependent ascorbate-glutathione cycle. In the presence H2O2, ascorbate is oxidized by
APX to form monodehydroascorbate (MDA) and dehydroascorbate (DHA). Then,
MDA is recycled to ascorbate via NAD(P)H oxidation by MDAR. However, DHA is
reduced to ascorbate by DHAR as glutathione is oxidized to GSSG. Similarly, GSSG
reduction depends on NAD(P)H oxidation by GR. In another antioxidative mechanism,
glutathione peroxidase cycle, H2O2 directly reacts with glutathione and oxidize to GSSG
by GPX. Conversion of GSSG to GSH again depends on NAD(P)H oxidation and GR.
Beside these multistep pathways; H2O2 can be reduced to H2O directly by CAT in cells.
(Jithesh et al. 2006; Apel and Hirt 2004).
Peroxiredoxins (PrxR) which are located in distinct cell regions such as
mitochondria and chloroplast are the other actors of antioxidant defense mechanisms.
PrxR reduces the H2O2 to H2O via water-water cycle in photosynthetic electron
transport system. This pathway aims to exterminate the excessively absorbed excitation
energy and prevents the photo-inhibition as a result of heating. Regeneration of PrxR is
provided by thioredoxin (Trx) or glutaredoxin electron donors (Dietz 2003).
For many years, antioxidative enzyme activities have been phenomena related to
salinity stress and tolerance of plants. In many independent studies it has been
demonstrated that salinity increases the ROS production and, both of ascorbate and
glutathione concentrations decrease as a conclusion of ROS increment under salt stress
(Hernandez et al. 2000). Besides, ROS increase the activity of detoxifying enzymes
such as CAT, GPX or PrxR whereas decreases the SOD (Vaidyanathan et al. 2003;
Dionisio-Sese and Tobita 1998; Dietz 2003). Interestingly, overexpression of
mitochondrial Mn-SOD or chloroplastic Cu/Zn-SOD has a role in salt tolerance of
different plants (Wang, Reyes, et al. 2004; Badawi et al. 2004).

15
1.4.4. Production of Osmolytes / Osmoprotectans
Plants lose their intracellular water in salty environments as a result of osmotic
imbalance (Türkan and Demiral 2009). A general strategy developed by halophytes is
overproduction of osmolytes or osmoprotectans in contrast to glycophytes. Some
essential ions such as K+ can also act as an osmolyte in addition to common organic
metabolites (Hussain et al. 2010). Accumulation of organic compounds provides the
adjustment of cellular homeostasis and osmotic balance.
Some major groups of organic osmoprotectans include simple sugars (majorly
fructose, sucrose and glucose), sugar alcohols/polyols (glycerol, mannitol, methylated
inositol, sorbitol, cyclic forms (cyclitols), ononitol and pinitol), complex sugars (starch,
trehalose, raffinose and fructans), quaternary amino acid derivatives (basically proline
and also arginine, glycine, leucine, valine, glutamine, asparagine, ectoine, citrulline and
ornithine), quaternary ammonium compounds (glycinebetaine (GB), osmotin,
trigonelline, hydroxyprolinebetaine, pipecolatebetaine, -alaninebetaine and
prolinebetaine), tertiary amines (1,4,5,6-tetrahydro-2-methyl-4-carboxyl pyrimidine),
sulfonim compounds (choline o-sulfate and dimethyl sulfonium propironate (DMSP) )
and polyamines (putrescine, spermidine, spermine and diamine, diaminopropane,
cadaverine less commonly) (Türkan and Demiral 2009; Ashraf and Harris 2004; Yokoi,
Bressan, and Hesagawa 2002; Hussain et al. 2010; Parida and Das 2005). Out of these
osmoprotectans, the most common and effective osmolytic regulators are proline and
glycinebetaine (GB).
In higher plants, proline derivates from ornithine or glutamate. Salinity stress
may induce either one or both of glutamate and ornithine pathways to produce proline.
This production depends on plant development and/or aging (Türkan and Demiral
2009). Regulative roles of proline are adjustment of vacuolar and cytoplasmic water
balances, accumulation of other amine groups which are also osmotically active,
supporting ROS scavenging, buffering redox potential, providing the macromolecular
and structural stability of membrane, equilibrating the electronic distribution, pH
adjustment, balancing the NADP/NADPH+ ratio and prevention of disruptive salt
effects on plasma membrane (Ashraf and Harris 2004; Matysik et al. 2002; Ashraf and
Foolad 2007).

16
Increment in proline content of cells belonging to salinity induces the proline
accumulation through activation of glutamate kinase which catalyzes the first step of
proline synthesis. On the contrary, accumulated proline inhibits self-biosynthesis. In
addition, highly accumulated proline and another form of hydroxyproline in salt
exposed plant cells are used for biosynthesis of proline-rich stress proteins. Moreover,
proline and hydroxyproline participate in the production of specific molecules that are
defensive on salt stress. These defensive molecules are proline-rich glycoproteins,
lipoproteins, proteins, phosphoproteins, polypeptides, peptides and hydroxyproline-rich
glycoproteins, glycoproteins, phosphoproteins, polypeptides, peptides (Ashrafijou et al.
2010).
Second osmolytic regulator glycinebetaine (GB) is the major quaternary
ammonium compound which plays an active role in salt stress is very soluble and
mostly abundant in chloroplasts and plastids (Ashraf and Foolad 2007; Chen and
Murata 2008). GB is synthesized from serine with the pathway that includes
ethanolamine, choline and betaine aldeyhde (Ashraf and Foolad 2007). Other protecting
characteristics of GB, as well as adjusting the osmotic balance, are stabilizing proteins
(mainly RuBisCO), protecting the photosynthetic apparatus and thylakoid membrane,
acting as a ROS scavenger and regulating the activity of ion channels (Heuer 2003;
Chen and Murata 2008).
1.5. Proteomic Approaches for Salt Exposed Plants
1.5.1. Proteomics of Salinity Proteins in Plants
As mentioned in previous topics, plants response to salt stress with several
mechanisms in which many proteins are activated and/or inhibited. Photosynthesis,
photorespiration, signal transduction, metabolic regulation, oxidative stress and ionic
transportation include different salt responsive proteins (Joseph and Jini 2010).
In addition, it has been observed that salt exposed plants often express Salt
Shock Proteins (SSP) and Heat Shock Proteins (HSP). Salt shock proteins are
accumulated as a survival reflex, which affects the expression or inhibition other
responsive proteins (Joseph and Jini 2010). Heat shock proteins/chaperons, on the other

17
hand, are the most common unspecific responsive proteins in plants including
HSP60/chaperonin, HSP70, HSP90, HSP100/Clp and small HSPs are stimulated under
salt stress (Wang, Vinocur, et al. 2004).
Identification, characterization and quantification of these stress-related proteins
can be obtained by proteomic techniques.
1.5.2. Basic Techniques in Proteomics
Popularity in proteomic studies has been accelerated for last two decades due to
the novel developments in mass spectrometry (MS). Understanding the changes in
cellular processes or functions at protein levels and also post-translational modifications
as a result of several effective factors requires proteomic approaches. Identification of
proteins together with the characterization mainly consists of isolation, separation and
analysis steps.
In proteomic approaches, initial step includes preparation of proteins. Hence,
proteins are isolated specifically or totally from target cells, tissue, organ or whole
organism by performing several techniques. Specific extraction techniques may require
recombination technologies in order to insert specific tags and/or antibody production
recognizing target proteins. Total protein extractions; however, relies on cell or tissue
lysis and purification unless they are isolated from specific organelles or cellular
regions such as plasma membrane.
Proteomic technologies offer many different alternatives for protein
identification. As an exception, mass-spectrometry based techniques have peaked since
last decade. Identification of proteins can be carried out by gel-based separations or gel-
free fractionations followed by mass spectrometry (Agrawal et al. 2012).
Gel-based separations are one or multi-dimensional electrophoretic applications
that is useful for distinguishing proteins due to their specific characteristics such as
molecular weight and pI value. In contrast, gel-free fractionations are one or multi-
dimensional chromatographic methods by which protein fractions can be produced
according to their specific characteristics again such as size, hydropathy or charge. In
gel-free systems, protein fractions can be collected as well as peptide fractions after
enzymatic digestion. Though both of multi-dimensional gel-based and gel-free systems

18
reflect high technology, combination of one-dimensional gel-based and gel-free
techniques are more common as a result of easy manipulation (Figure 1.4).
Figure 1.4. Basic steps of proteomic approaches: 1-Sample preparation, 2-Gel-based
separation, 3-Enzymatic digestion, 4-Chromatographic fractionation, 5-
Mass spectrometry analysis (Source: Aebersold and Mann 2003)
1.5.3. Mass Spectrometry-Based Techniques
In proteomic studies, mass spectrometry has become a crucial analyzing
technique in which gas-phase ions of peptides/proteins are generated (Aebersold and
Mann 2003). The theory behind the MS is ionization of the sample, subsequent
separation and detection of these ions based on their mass to charge (m/z) ratios. Matrix-
assisted laser desorption/ionization (MALDI) and electrospray ionization (ESI) are two
major ionization methods which are also known as soft ionization techniques in mass
spectrometry. “Soft ionization” term represents the ionization of large and non-volatile

19
molecules such as proteins and peptides without causing any degradation during
ionization process (Aebersold 2003).
In MALDI, analyte is mixed with a synthetic matrix and irradiated with a pulsed
laser beam resulting in the vaporization of the analyte either via protonation or
deprotonation. The organic matrix molecules are capable of absorbing the energy of the
laser, generally in the UV range. MALDI has become an effective technique with the
combination of time-of-flight (TOF) mass analyzer which also enables to analyze the
fragment ions derived from parent ion in TOF/TOF systems (Aebersold 2003) (Figure
1.5).
Figure 1.5. Schematic representation of MALDI-TOF/TOF
Common proteomic based matrices used in MALDI are 2,5-dihyroxybenzoic
acid (DHB), sinapinic acid (SA), a-cyano-4-hydroxycinnamic acid (CHCA), 1,5-
diaminonaphtalene (1,5-DAN), picolinic acid (PA) (Demeure et al. 2007) and 2,4,6-
trihydroxyacetophenone (THAP) (Kussmann et al. 1997).
In proteomic studies, two-dimensional polyacrylamide gel (2D-PAGE) and two-
dimensional differential electrophoresis (2-DE) separation techniques are analyzed by
MALDI-TOF/TOF preferentially (Qureshi, Qadir, and Zolla 2007).
Another ionization technique, ESI, is based on sample ionization via electric
field. In ESI, multiply charged molecular ions are measured and detected in ion trap or

20
quadrupole instruments (Aebersold and Mann 2003; Aebersold 2003). ESI-MS can be
combined with one or multi-dimensional liquid chromatography (LC) technique since
liquid samples are required. As mentioned in part 1.5.1, sample preparation for LC can
be either peptide fractionation after enzymatic digestion or fractionation at protein level.
With the soft ionization techniques tandem mass spectrometry (MS/MS)
commonly used for protein identification is based on peptide analysis where this
application requires enzymatic digestion initially (Nesvizhskii et al. 2003). Then,
ionized peptides are detected individually and each selected peptide is allowed to
fragment by collision induced dissociation (CID), electron transfer dissociation (ETD)
(Swaney, McAlister, and Coon 2008), electron capture dissociation (ECD) or surface
induced dissociation (SID) (Sadygov, Cociorva, and Yates 2004). Each peptide may
give a unique result based on m/z ratio related to its fragments. In this respect, this
unique mass spectrum of a peptide can be identified via mass related bioinformatic tools
and protein databases (MASCOT; SEQUEST etc.).

21
CHAPTER 2
MATERIALS AND METHODS
2.1. Materials
All materials used in experimental procedures are given in Appendix A.
2.2. Methods
2.2.1. Plant Growth and Salt Exposure
Beta maritima seeds were firstly germinated in sterilized sand and then
transferred to half strength Hoagland’s medium (Appendix B). Conditions of the growth
chamber were adjusted as 12 hours dark and 12 hours light photoperiod with a 40 µmol
m-2
s-1
light intensity. The temperature was 25oC and humidity was 50.0 (as % RH).
Plants were divided into two groups. The first group was exposed to 150 mM
NaCl in half strength Hoagland’s medium for 10 days. This group was renamed as
“Stress Group”. Second group was growth in the same half strength Hoagland’s
medium as a “Control Group”. During exposure period, all mediums were refreshed
once in two days. After exposure, leaves and roots were harvested, frozen by liquid N2
and stored at −80oC.
2.2.2. Total Protein Extraction with Phenol Extraction Method
In this part Faurobert’s phenol extraction protocol was followed (Faurobert,
Pelpoir, and Chaib 2007). Protein extraction from “control leaf”, “stress leaf”, “control
root” and “stress root” samples was performed one by one. First, 1 g sample was
grinded in the presence of liquid N2 by mortar and pestle at least three times until the
whole sample was powder. 3 ml extraction buffer (Appendix B) was added onto the

22
powder in 15 ml falcon tube and then shaken on ice for 10 minutes. Sample was
centrifuged at 5000 rpm, 4oC for 15 minutes. Supernatant was removed into new tube
and Tris buffered phenol (Appendix B) was added with equal volume (1:1). Tube was
shaken at room temperature for 10 minutes in dark and centrifuged again at 5000 rpm,
4oC for 15 minutes. After centrifugation three different phases were observed. Top
phase (phenol phase) was taken into new tube avoiding to touch the medium phase
(white oily phase) and lower phase was disposed. Extraction buffer was added onto
phenol phase with equal volume (1:1) and shaken in room temperature for a few
minutes. Centrifugation was performed under the same conditions and again the top
phase was removed into new tube. Ice cold precipitation solution (Appendix B) was
added onto phenol phase with (1:2) volume. That sample was incubated overnight at -
20oC.
On the second day, proteins were observed clearly as a whitish mucous-like
structure in falcon tube. The sample was precipitated at 5000 rpm, 4oC for 25 minutes.
After that, supernatant was removed; pellet was washed with ice cold precipitation
solution and taken into 1.5 ml micro centrifuge tubes. Proteins were centrifuged at 5500
g, 4oC for 10 minutes. Supernatant was removed again and protein pellet was washed
with 90 % (v/v) ice cold acetone solution. The centrifugation step was repeated and
after supernatant was removed, pellet was dried at room temperature for few minutes.
The usage of vacuum evaporator was avoided due to the excess dry.
Finally, semi-dried pellet was resolved in 100-200 l 2D rehydration buffer
(Appendix B).
2.2.3. Protein Quantification with Bradford Assay
In Bradford assay, Coomassie Brilliant Blue G-250 (CBB G-250) dye interacts
with proteins non-specifically and blue color gives absorbance at 595 nm wavelength.
According to Lambert-Beer law, sample concentrations can be measured by comparing
with standards.
In this experiment, self-optimized Bradford Assay was performed in order to
determine the protein amounts for each sample. 25, 50, 100, 125, 200, 250, 500 g/ml
bovine serum albumin (BSA) solutions were used as standards and ultra pure (UP)

23
water as blank. Extracted proteins were diluted 20 times with UP water. 20 l from each
standard / sample / water was mixed with 180 l 1X grayish-green colored Bradford
Reagent (Appendix B).
Reactions occurred in Greiner Bio One U-bottom 96 well plate and incubated at
room temperature in dark for 10 minutes. Bright blue colors were measured at 595 nm
wavelength against blank by spectrophotometer Multiskan Spectrum, Thermo Electron
Corporation. Standard graph was created as absorbance vs. BSA concentrations and
protein amounts of samples were calculated via equation of trend line considering
dilution factor.
2.2.4. 2-Dimensional Polyacrylamide Gel Electrophoresis (2D-PAGE)
2.2.4.1. First Dimension: Isoelectric Focusing (IEF)
The total protein separation was performed by 2-dimensional gel
electrophoresis. In the first dimension, proteins were focused with BioRad PROTEAN
IEF Cell due to their isoelectric points.
400-450 g protein samples of each group were mixed with 400 l 2D
rehydration buffer including 65mM DTT and 2 % (v/v) pH 3-10 carrier ampholyte.
Protein mixture was loaded into a channel of PROTEAN IEF focusing tray and
immobilized pH gradient (IPG) strip (ReadyStripTM
IPG Strip, 3-10 non-linear (NL), 17
cm, BioRad) was replaced onto protein solution in corresponding channel by using
forceps, avoiding air bubble formation. Gel side of the strip should be at the bottom
touching to proteins and pH 3 edge should be on positive, pH 10 edge on negative
poles.
Passive rehydration occurred 1-2 hours at room temperature. 2 ml mineral oil
was added onto strips to prevent the drying of strips before active rehydration. Focusing
steps were set as Voltage-hour (Vh) and after rehydration process, by using forceps pre-
wetted electrode wicks were placed between IPG strip and wire electrode to protect the
strips from high voltage. Conditions of isoelectric focusing were; 50A per IPG strip,
20oC, 16 hours active rehydration at 50 V, 300 Vh linear at 200 V, 500 Vh linear at 500
V, 1000 Vh linear at 1000 V, 4000 Vh linear at 4000 V, 24000 Vh rapid at 8000 V and

24
30000 Vh rapid at 8000 V, respectively. During isoelectric focusing technique two of
root protein samples could be focused at the same time whereas leaf proteins were
focused one by one.
2.2.4.2. Equilibration of IPG Strips
Equilibration after IEF is an important procedure that provides saturation of IPG
strips to sodium dodecyl sulfate (SDS) and reduction of sulphydryl groups in addition to
complete denaturation of proteins.
IPG strips were removed into a new disposable tray by the help of forceps. Gel
side of the IPG strip should be on top to touch the equilibration buffers. Then, IPG
strips were shaken in equilibration buffer I (Appendix B) for 15 minutes in order to
break disulfide bridges and then equilibration buffer II (Appendix B) for 15 minutes in
dark to alkylate the reduced sulphydryl groups. Following the equilibration, strips were
washed at least two times with 1X Running Buffer (Appendix B).
2.2.4.3. Second Dimension: SDS-PAGE
In the second dimension, 12% polyacrylamide gel (pH 8.8) including sodium
dodecyl sulfate (SDS) was prepared. Strips were replaced onto the polyacrylamide
resolving gel avoiding bubble formation and covered with melted overlay agarose gel
(Appendix B). Circuit of the system was completed and gel was run at 16 mA for an
hour and then 180 V for 6-6.5 hours at room temperature in the presence of 1X Running
Buffer. System was cooled with water flow through the inside of the tank. For gel
electrophoresis BioRad PROTEAN II xi Cell system was used.
After the running process gels were separated from glass plates and treated with
staining solution (Appendix B) for overnight (~16 hours) in dark at room temperature.
The next day, the staining solution was removed. Gels were washed with
deionized water (dH2O) few times and then gels were treated with neutralization buffer
(Appendix B) for 5 minutes in order to neutralize the proteins and reduce the effect of
SDS. After the neutralization buffer is removed, gels were destained (Appendix B) for 1
minute. Next, fixation solution (Appendix B) was used to fix the proteins in

25
polyacrylamide gel. This process was carried out for 5-6 hours at least. Finally, gels
were kept in 5 % (v/v) acetic acid solution at 4oC.
2.2.5. Gel Comparison and Spot Selection
Stress and control gel images belonging to root and leaf samples were obtained
with CCD camera of BioRad Universal Hood II Gel Imager on epi-white light.
Increasing the image quality was provided by background subtraction and smoothing
application.
Intensity changes, appearance and/or disappearance of protein spots were
selected with naked eye. Each selected spot was excised with the back part of 100 l
micropipette tips and stored in 5 % (v/v) acetic acid solution in 1.5 ml micro centrifuge
tubes at 4 oC. Non-protein part of a gel was also excised and the same protocol was
followed in order to eliminate background peaks in mass spectrometry.
Confirmations of gel comparisons were obtained by gel analyzing tool Delta2D
(DECODON). For each gel comparison process, gel images were uploaded to the
program. Stress and control gels were warped by the program and the matched spots
were accepted as reference points. Then, the spot volumes were calculated
mathematically. Finally, scattering plots and expression profiles of each selected spots
were detected.
2.2.6. In-Gel Digestion with Trypsin
Tryptic in-gel digestion procedure is a common technique mainly used for
protein cleavage from excised SDS or 2D gels. Shevchenko and co-workers developed
this technique as a sample preparation for analyzers (Shevchenko et al. 2006). In this
study, the experiment was self-optimized and performed as a three-day procedure. In
the second and third days, all chemical applications were carried out in a flow cabinet to
provide sterile conditions and minimize the keratin contamination. In addition, silicon
micro centrifuge tubes were used to prevent the adhesion of peptides to tube walls.

26
On the first day, the storage solution was removed and the pre-excised spots
were treated with wash solution (Appendix B) overnight at room temperature which
provides destaining of proteins that are found in gel.
On the second day, the wash solution was discarded and the spots were divided
into small pieces in micro centrifuge tube with a micro pipette tip. Then, the steps stated
below were followed:
- 100 l acetonitrile was added onto gel pieces for dehydration and incubated at
room temperature until the pieces had white opaque color.
- Acetonitrile was removed, 30 l DTT solution (Appendix B) was added for
reduction and gel pieces were incubated at room temperature for 30 minutes
after swelling.
- DTT solution was removed and gel pieces were dehydrated with acetonitrile at
room temperature to take out the excess DTT from samples.
- Acetonitrile was removed, iodoacetamide solution (Appendix B) was added and
gel pieces were incubated at room temperature for 30 minutes in dark place.
- Iodoacetamide solution was removed and then acetonitrile was added to take out
the excess iodoacetamide from gel pieces until the gel pieces become opaque.
- Gel pieces were rehydrated with 100 l of 100 mM ammonium bicarbonate
solution.
- The pieces were dehydrated with acetonitrile one more time and dried at ambient
temperature in vacuum centrifuge few minutes.
- Finally, they were allowed to swell with 30 l Trypsin solution (Appendix B) on
ice for 10 minutes. Gel pieces were covered with 50 mM ammonium bicarbonate
to keep the enzyme in aqueous environment. Tube caps were covered with
Parafilm and stored in 37oC incubator. Heater block was not preferred since the
solutions vaporized as a result of temperature differences between top and
bottom of the tube. Thus gel pieces were dried and enzymatic reaction was
inhibited.
On the third day, applications were carried out on ice. 20 l of 50 mM
ammonium bicarbonate was added onto samples and mixed with vortex for 2-3 minutes.
Then, they were kept on ice for a few minutes and the same procedure was applied.
Tubes were centrifuged at maximum speed for 30 seconds and supernatant was

27
removed into new 0.5 ml micro centrifuge tube. 30 l of extraction buffer (Appendix B)
was added. In this protocol, extraction buffer takes out the peptides by the dehydrating
character of acetonitrile.
In the presence of extraction buffer, vortex and centrifuge processes were
repeated. Supernatant was collected in the tube containing previous supernatant.
Extraction step was also repeated and all supernatants were collected in same tube.
Extract including peptides was concentrated in DNA 120 SpeedVac® System, Thermo
Electron Corporation via evaporation of supernatant under vacuum at ambient
temperature until the total volume of each sample was 20 l. Finally, 0.5 l acetic acid
was added to the each sample for acidification of peptides.
2.2.7. ZipTip Assay
ZipTip is a specific micro-column which may be C4, C18 or strong cationic resin
(SCX) replaced in the edge of 10 l micro-pipette tips. This micro-column system is a
useful technique that provides purification, desalting and concentration of protein /
peptide samples.
In this study, ZipTip 0.6 l C18 resin of Millipore were used with 10 l micro-
pipettes. Initially, ZipTip micro-columns were treated with 10 l of wetting solution
(Appendix B) by aspirating and dispensing for a few times. Same procedure was
repeated with the equilibration solution (Appendix B). Then, 10 l of peptide sample
was aspirated and dispensed in sample tube at least 10 times. Removing salt ions and
impurities were provided via aspirating washing solution (Appendix B) and dispensing
to waste. This step was repeated for a few times. Peptide molecules were eluted from
micro-column with 5-10 l of elution solution (Appendix B) into 0.1 ml micro
centrifuge tubes.
2.2.8. Sample Preparation for MALDI-TOF/TOF Mass Spectrometry
-cyano-4-hydroxycinnamic acid (CHCA) matrix was applied as a two layer
system. Initially first layer of matrix was prepared freshly (Appendix B) and spotted as

28
1 l on gold plated aluminum target (MTP 384 massive target gold plated T: one-piece
aluminum target with transponder technology, BRUKER, DALTONICS). 1st layer was
spotted twice if the intensity of first layer was inadequate and spots were transparent.
Then, the second layer was prepared freshly (Appendix B), mixed with equal volume of
the sample and spotted as 1 l onto the 1st layer spots. In case the matrix amount was
inefficient, the samples were mixed with 2nd
layer of matrix as (1:3), (1:4) or (1:5). With
the same procedure, peptide mixture for MS calibration including leucine enkephalin,
angiotensin I, angiotensin II, bradykinin, adrenocorticotropic hormone (ACTH) and
insulin; also ACTH (18-39) peptide for MS/MS calibration were prepared. Spots on
target were dried at room temperature for 15-20 minutes.
2.2.9. Mass Spectrometric Analyzes via MALDI-TOF/TOF
MALDI-TOF/TOF analyzes were performed by BRUKER autoflex III
smartbeam with flexControl Version 3.0 program. Several parameters were set and
fixed for all analyzes as in the following; for MS, mass range: 700-3500 Da, reflector
voltage: 1725 V, laser frequency: 50.0, maximum shots: 2000 and laser power: 70-80
%. For MS/MS, CID mode: on, collision gas: Argon, mass range: 40-2020 Da, reflector
voltage: 1544 V, laser frequency: 50.0, maximum shots: 5000, laser power: 70-80 %
and PCIS window range was optimized based on parent ion. External calibrations were
applied.
Peaks were analyzed with flexAnalysis Version 3.0 and ion types were selected
as low energy CID ions (a,b,y). Database connection was provided by Biotools Version
3.1 and Mascot MS/MS Ion Search bioinformatic programs. Additionally, optimized
parameters were set as default to identify the proteins by Mascot MS/MS Ion Search
tool. These parameters were in the following as taxonomy: Viridiplantae (Green Plants),
enzyme: Trypsin, variable modifications: Carbamidomethyl (C), mass tolerance: 50
ppm, MS/MS tolerance: 0.9 Da, charge state: +1, monoisotopic.
All peptide peaks were searched in both of NCBInr and SwissProt protein
databases. Peptide recoveries, molecular weight of protein and pI values were
considered instead of ion scores.

29
CHAPTER 3
RESULTS AND DISCUSSION
3.1. Effects of NaCl on Plant Growth
Freshly growth Beta maritima plants were exposed to toxic levels of NaCl (150
mM) for 10 days. During this salt stress period several phenotypic profile changes were
observed as a conclusion of physiologic response.
Figure 3.1. Comparisons of plant profiles after salt exposure. (A) Salt exposed
“Stress group”. (B) Non-exposed “Control group”
NaCl stress, reduced plant growth significantly. High concentrations of salt
prevented the uptake of water and essential minerals from media efficiently. This
situation is concluded as suppression of leaf and root growth. In stress group, leaves
were less and smaller; roots were shorter and weaker than in control group. In addition,
as it is shown in Figure 3.1 metabolic affects of salinity increased the thickness and
fragility of leaves, decreased their elasticity. Pigments were over-produced; plants lost
their bright green color and got darker colors.

30
3.2. Measurements of Protein Concentrations by Bradford Assay
Extracted protein samples from both leaf and root tissues were measured by a
common spectrophotometric technique, Bradford assay. In the presence of Bradford
reagent, absorbances of BSA standards were obtained in 595 nm and standard curve
was plotted as absorbance vs. concentrations (Figure 3.2). Concentration of each
extracted 1 g sample was calculated based on this standard graph (Table 3.1).
Figure 3.2. Standard Curve for BSA
Table 3.1. Average concentrations of extracted proteins from plant samples
y = 0,002x + 0,0529
R² = 0,9901
0
0,1
0,2
0,3
0,4
0,5
0,6
0 50 100 150 200 250 300
Ab
sorb
an
ce(5
95 n
m)
BSA Concentration (g/ml)
Bradford Assay
Sample Name Protein Concentration (mg/ml)
Stress Group Control Group
Leaf (1 g) 14.7 ± 1 13.3 ± 1
Root (1 g)
6.9 ± 1 8.2 ± 1

31
3.3. Determination of Salt Stress Responsive Proteins
3.3.1. Separation of Proteins via 2D-PAGE
Identification of salt stress responsive proteins was the main strategy to make
sense about the tolerance mechanism of a halophyte. After extraction of total proteins
from leaf and root samples, 2D-PAGE was performed in order to separate these proteins
specifically due to their pI values and molecular weights. This experimental step was
independently repeated three times for each sample group.
In the first dimension of 2D-PAGE, isoelectric focusing (IEF) was performed. In
each set, 400-450 g protein was mixed with 2D-rehydration buffer, loaded to channels
of isoelectric tray and focused for ~ 2 days including rehydration step. For IEF; non-
linear (NL), 17 cm, pH 3-10 IPG strips were used. Leaf protein samples were focused
one by one, whereas two groups of root protein samples could be focused at once. In
this procedure, proteins were separated according to their pI values.
In the second dimension which consists of SDS-PAGE, pre-equilibrated proteins
were run in 12 % resolving gel and separated according to their molecular weights.
During this process, protein ladder could not be used. Therefore, some known proteins
were accepted as molecular reference such as larger subunit of RuBisCO.
Spot detection was carried out for overnight by staining of gels with colloidal
Coomassie Brilliant Blue G-250. Excess dye was destained with methanol after
neutralization of proteins with slightly acidic buffer. Proteins were fixed in
polyacrylamide gel for ~6 hours and gels were stored at 4 oC for 2-3 days until the color
of background became brighter and spots obtained clearly. Gel images were obtained
via epi-white illumination. Several spots were accepted as reference and differentially
expressed (completely lost, completely appeared, increased or decreased) proteins were
detected and excised from gel. Selected spots, as a result of control-stress comparisons,
are demonstrated in Figure 3.3 and 3.4. Second and third sets of gel images are given in
Appendix C.

32
pH 10 pH 3
pH10 pH 3
Figure 3.3. 2D gel images of leaf proteins and selected spots which are differentially
expressed. (A) Control group (B) Salt stress group
M
MW
M
MW

33
pH 10 pH 3
pH 10 pH 3
Figure 3.4. 2D gel images of root proteins and selected spots which are differentially
expressed. (A) Control group (B) Salt stress group
M
MW
M
MW

34
3.3.2. Bioinformatic Confirmation of Spot Selections
In this study, gel comparisons and spot selections were performed without using
a bioinformatic tool in order to eliminate background interference. Instead, protein spots
were determined with naked eye and results were approved by a proteomic gel analysis
program, Delta2D (DECODON). Gel images were uploaded to program independently.
Each set including control and stress gel images were combined together and examined
in the same frame. Significantly matching spots were selected by program automatically
and gels were warped based on these reference points. Warping feature of this
bioinformatic program provide to discriminate the unmatched spots via indicating each
gel with different color. Thus, each gel images and matched spots had individual color
that facilitates the selection of lost or appeared spots mostly, referring to down-
regulated or up-regulated proteins. In this case, pre-selected spots were compared with
results of the program and incorrect selections were eliminated. Expression levels of
selected proteins were found out via calculation of spot volumes mathematically on
warped images. Figure 3.5 demonstrates the scattering plots for leaf and root samples
indicating the relative volumes belong to control and stress groups.
Figure 3.5. Scattering plots of leaf (A) and root (B) protein spots on 2D gel images.
Pink area (y axis) refers to stress group proteins; green area (x axis) refers to
control group proteins and blue area refers to matching proteins.
A B

35
Expression profiles due to the changes in relative volumes of spots were also
calculated by the program. In this case, statistical evaluations of these changes
confirmed our results directly (Figure 3.6). Other data sets are given in Appendix C.
Figure 3.6. Graphical demonstration of calculated relative spot volumes indicating
expression profiles. (A) Leaf samples. (B) Root samples.
3.4. Identification of Salt Stress Response Proteins by MALDI-
TOF/TOF Mass Spectrometry
Preparation of samples for mass spectrometric analysis was followed with in gel
digestion procedure after selection and excision of spots. Protein samples were reduced,
alkylated and degraded into peptides by treating with trypsin in gel for an overnight.
Extracted peptides were analyzed in MALDI-TOF/TOF and therefore, proteins were
identified by searching the related peptides from proteomic databases, NCBInr and
0
0,5
1
1,5
2
2,5
L1 L2 L3 L4 L5 L6 L7 L8 L9 L10 L11
Re
lati
ve V
olu
me
(V
%)
stress group
control group
0
0,2
0,4
0,6
0,8
1
1,2
R1 R2 R3 R4 R5 R6 R7 R8 R9 R11 R13 R14 R15 R16 R17 R18 R20 R21 R22 R23 R24 R25 R26 R27
Rel
ativ
e V
olu
me
(V %
)
stress group
control group
A
B

36
SwissProt. In each analysis, molecular weights and pI values of candidates were
considered as well as peptide recovery. All of the leaf and root samples were analyzed
and only six leaf proteins could be identified.
The summary of the identified proteins were given in Table 3.2.
Table 3.2. Proteins identified by MALDI-TOF/TOF mass spectrometry
Spot
No Protein Name
Nominal
Mass
(Da)
pI
value
Protein
Sequence
Coverage
(%)
Expression
Profile
L1 Thioredoxin H-
type 11836 5.84 16 upregulated
MGGSVIVIDSKAAWDAQLAKGKEEHKPIVVDFTATWCGPCKMIAPLF
ETLSNDYAGKVIFLKVDVDAVAAVAEAAGITAMPTFHVYKDGVKADD
LVGASQDKLKALVAKHAAA
L2 Elongation factor
1-alpha 1 49471 9.19 5 downregulated
MGKEKFHINIVVIGHVDSGKSTTTGHLIYKLGGIDKRVIERFEKEAAEM
NKRSFKYAWVLDKLKAERERGITIDIALWKFETTKYYCTVIDAPGHRDF
IKNMITGTSQADCAVLIIDSTTGGFEAGISKDGQTREHALLAFTLGVKQ
MICCCNKMDATTPKYSKARYDEIIKEVSSYLKKVGYNPDKIPFVPISGFE
GDNMIERSTNLDWYKGPTLLEALDQINEPKRPSDKPLRLPLQDVYKIGG
IGTVPVGRVETGMIKPGMVVTFAPTGLTTEVKSVEMHHESLLEALPGD
NVGFNVKNVAVKDLKRGYVASNSKDDPAKGAANFTSQVIIMNHPGQI
GNGYAPVLDCHTSHIAVKFSEILTKIDRRSGKEIEKEPKFLKNGDAGMV
KMTPTKPMVVETFSEYPPLGRFAVRDMRQTVAVGVIKSVDKKDPTGA
KVTKAAVKKGAK
(cont. on next page)

37
Table 3.2. (cont.)
(cont. on next page)
L3
Peroxisomal (S)-
2-hydroxy-acid
oxidase
40260 9.16 8 downregulated
MEITNVNEYEAIAKQKLPKMVYDYYASGAEDQWTLAENRNAFSRILFR
PRILIDVTNIDMTTTILGFKISMPIMIAPTAMQKMAHPEGEYATARAASA
AGTIMTLSSWATSSVEEVASTGPGIRFFQLYVYKDRNVVAQLVRRAER
AGFKAIALTVDTPRLGRREADIKNRFVLPPFLTLKNFEGIDLGKMDKAN
DSGLSSYVAGQIDRSLSWKDVAWLQTITSLPILVKGVITAEDARLAVQ
HGAAGIIVSNHGARQLDYVPATIMALEEVVKAAQGRIPVFLDGGVRR
GTDVFKALALGAAGVFIGRPVVFSLAAEGEAGVKKVLQMMRDEFELT
MALSGCRSLKEISRSHIAADWDGPSSRAVARL
L4
Serine--
glyoxylate amino
transferase
44061 7.63 10 downregulated
MDYMYGPGRHHLFVPGPVNIPEPVIRAMNRNNEDYRSPAIPALTKTLL
EDVKKIFKTTSGTPFLFPTTGTGAWESALTNTLSPGDRIVSFLIGQFSLL
WIDQQKRLNFNVDVVESDWGQGANLQVLASKLSQDENHTIKAICIVHN
ETATGVTNDISAVRTLLDHYKHPALLLVDGVSSICALDFRMDEWGVDV
ALTGSQKALSLPTGLGIVCASPKALEATKTSKSLKVFFDWNDYLKFYK
LGTYWPYTPSIQLLYGLRAALDLIFEEGLENIIARHARLGKATRLAVE
AWGLKNCTQKEEWISNTVTAVMVPPHIDGSEIVRRAWQRYNLSLGLG
LNKVAGKVFRIGHLGNVNELQLLGCLAGVEMILKDVGYPVVMGSGVA
AASTYLQHHIPLIPSRI

38
Table 3.2. (cont.)
(cont. on next page)
L5
5-methyl
tetrahydro
Pteroyltriglutamat
—homocysteine
methyltransferase
84304 6.09 5 upregulated
MASHIVGYPRMGPKRELKFALESFWDGKSTAEDLKKVSADLRSSIWK
QMADAGIKYIPSNTFSYYDQVLDTTAMLGAVPPRYGWTGGEIEFDVY
FSMARGNASVPAMEMTKWFDTNYHFIVPELGPEVNFSYASHKAVLEY
KEAKALGVDTVPVLVGPVSYLLLSKQAKGVDKSFDLLSLLPKILPIYKE
VVAELKEAGASWIQFDEPLLVMDLESHKLQAFSAAYADLESTLSGLN
VVVETYFADVTAEAYKTLISLKGVTGYGFDLVRGTKTLDLVKAEFPSG
KYLFAGVVDGRNIWANDLAASLATLEALEGVVGKDKLVVSTSCSFLH
TAVDLINETKLDDEIKSWLAFAAQKVLEVNALAKALSGQKDEAFFSA
NAAALASRKSSPRVTNEAVQKAATALKGSDHRRATTVSSRLDAQQKK
LNLPILPTTTIGSFPQTVELRRVRREYKAKKISEEEYVKAIKEEISKVVKL
QEELDIDVLVHGEPERNDMVEYFGEQLSGFAFSANGWVQSYGSRCVK
PPIIYGDVSRPNPMTVFWSSMAQSMTARPMKGMLTGPVTILNWSFVR
NDQPRHETCYQIALAIKNEVEDLEKAGINVIQIDEAALREGLPLRKSEH
DFYLKWAVHSFRITNVGVQDTTQIHTHMCYSNFNDIIHSIIDMDADVIT
IENSRSDEKLLSVFREGVKYGAGIGPGVYDIHSPRIPPTEELADRIRKM
LAVLESNVLWVNPDCGLKTRKYGEVNPALSNMVAAAKQLRQELASA
K

39
Table 3.2. (cont.)
L8 glutamine
synthetase 47401 5.73 9 upregulated
MAQILAPNMQCQMKLSKSLTNSMIPNSWTSILLKGSQKGSIKCSTKFK
VCAALKTEHGTVNRMEQLLNLDVTPFTDKIIAEYIWIGGSGIDLRSKS
RTLSRPVEDPSELPKWNYDGSSTGQAPGEDSEVILYPQAIFKDPFRGG
NNILVICDAYTPAGEPIPTNKRHKAAEIFSNPKVASEVPWFGIEQEYTLL
QPNVQWPLGWPVGAYPGPQGPYYCGVGADKSFGRDISDAHYKACLY
AGINISGTNGEVMPGQWEFQVGPSVGIEAGDHIWCARYLLERITEQAG
VVLTLDPKPIEGDWNGAGCHTNYSTKTMREDGGFEVIKKAILNLSLRH
KEHISAYGEGNERRLTGKHETADIDTFSWGVANRGCSIRVGRDTEKE
GKGYMEDRRPASNMDPYVVTGLLAESTLLWEPTLEAEALAAQRLSLN
V

40
CHAPTER 4
CONCLUSION
In this study comprehension of the natural salt tolerance mechanism of the
moderately halophytic plant Beta maritima (sea beet) on proteomic level was aimed. In
this respect, up-regulated and down-regulated proteins were determined on two-
dimensional polyacrylamide gel and analyzed by MALDI-TOF/TOF mass spectrometry
after in gel tryptic digestion.
Results of the mass spectrometric analyses demonstrated that most of the protein
samples were digested by trypsin well and peptides were collected efficiently. Hence
the peptide peaks were quite intense referring to high signal to noise ratio in the mass
spectrum. For the MS/MS analysis each peptide peak was recorded, selected as a parent
ion and dissociated by collision induction in the presence of the inert gas argon.
According to MS/MS results it was observed that the fragmentation was homolytic and
peaks were intense. However the bioinformatic research was not succeeded as well as
mass spectrometric analyses, since Beta maritima has not a specific proteomic database.
Only some metabolic pathway enzymes, some redox proteins and a transcription
regulator, elongation factor-1- were identified from leaf samples which are similar to
leaf proteins of the other plant species. On the other hand, Beta maritima has a
characteristic root structure including specific proteins which are not similar to the ones
found in other species. Therefore solution of the puzzle and identification of the
differentially expressed root proteins may require de novo sequencing. By this way, the
unknown part of the salt tolerance mechanism may be found out.
Finally, this study may lead to produce novel agriculturally important salt
tolerant plants in the future. Moreover, if the tolerance mechanism includes vacuolar
accumulation, this mechanism may be used for the remediation of the environment.

41
REFERENCES
Aebersold, R. 2003. A mass spectrometric journey into protein and proteome research. J Am
Soc Mass Spectrom 14 (7):685-95.
Aebersold, R., and M. Mann. 2003. Mass spectrometry-based proteomics. Nature 422
(6928):198-207.
Agastian, P., S. J. Kingsley, and M. Vivekanandan. 2000. Effect of salinity on photosynthesis
and biochemical characteristics in mulberry genotypes. Photosynthetica 38 (2):287-290.
Agrawal, G. K., R. Pedreschi, B. J. Barkla, L. V. Bindschedler, R. Cramer, A. Sarkar, J. Renaut, D. Job, and R. Rakwal. 2012. Translational plant proteomics: A perspective. J
Proteomics.
Amtmann, A., M. Fischer, E. L. Marsh, A. Stefanovic, D. Sanders, and D. P. Schachtman. 2001. The wheat cDNA LCT1 generates hypersensitivity to sodium in a salt-sensitive yeast
strain. Plant Physiology 126 (3):1061-1071.
Apel, K., and H. Hirt. 2004. Reactive oxygen species: Metabolism, oxidative stress, and signal
transduction. Annual Review of Plant Biology 55:373-399.
Ashraf, M., and M. R. Foolad. 2007. Roles of glycine betaine and proline in improving plant
abiotic stress resistance. Environmental and Experimental Botany 59 (2):206-216.
Ashraf, M., and P. J. C. Harris. 2004. Potential biochemical indicators of salinity tolerance in plants. Plant Science 166 (1):3-16.
Ashrafijou, M., S. A. S. Noori, A. I. Darbandi, and S. Saghafi. 2010. Effect of salinity and
radiation on proline accumulation in seeds of canola (Brassica napus L.). Plant Soil and Environment 56 (7):312-317.
Badawi, G. H., Y. Yamauchi, E. Shimada, R. Sasaki, N. Kawano, K. Tanaka, and K. Tanaka.
2004. Enhanced tolerance to salt stress and water deficit by overexpressing superoxide
dismutase in tobacco (Nicotiana tabacum) chloroplasts. Plant Science 166 (4):919-928.
Barrero, J. M., P. L. Rodriguez, V. Quesada, P. Piqueras, M. R. Ponce, and J. L. Micol. 2006.
Both abscisic acid (ABA)-dependent and ABA-independent pathways govern the
induction of NCED3, AAO3 and ABA1 in response to salt stress. Plant Cell Environ 29 (10):2000-8.
Blaylock, A. D. 1994. Soil Salinity, Salt Tolerance, and Growth Potential of Horticultural and
Landscape Plants. Cooperative Extension Service, University of Wyoming B-988.
Blumwald, E. 2000. Sodium transport and salt tolerance in plants. Curr Opin Cell Biol 12 (4):431-4.
Bohnert, H. J., H. Su, and B. Shen. 1999. Molecular Mechanisms of Salinity Tolerance.
Molecular Responses to Cold, Drought, Heat and Salt Stress in Higher Plants Chapter 3:29-60.

42
Bronick, C. J., and R. Lal. 2005. Soil structure and management: a review. Geoderma 124 (1-
2):3-22.
Chandler, P. M., and M. Robertson. 1994. Gene-Expression Regulated by Abscisic-Acid and Its
Relation to Stress Tolerance. Annual Review of Plant Physiology and Plant Molecular Biology 45:113-141.
Chaves, M. M., J. Flexas, and C. Pinheiro. 2009. Photosynthesis under drought and salt stress:
regulation mechanisms from whole plant to cell. Annals of Botany 103 (4):551-560.
Chen, T. H. H., and N. Murata. 2008. Glycinebetaine: an effective protectant against abiotic
stress in plants. Trends in Plant Science 13 (9):499-505.
Chinnusamy, V., A. Jagendorf, and J. K. Zhu. 2005. Understanding and improving salt tolerance in plants. Crop Science 45 (2):437-448.
Chinnusamy, V., J. Zhu, and J. K. Zhu. 2006. Salt stress signaling and mechanisms of plant salt
tolerance. Genet Eng (N Y) 27:141-77.
Clemens, S., D. M. Antosiewicz, J. M. Ward, D. P. Schachtman, and J. I. Schroeder. 1998. The plant cDNA LCT1 mediates the uptake of calcium and cadmium in yeast. Proceedings
of the National Academy of Sciences of the United States of America 95 (20):12043-
12048.
Cushman, J. C. 1993. Molecular-Cloning and Expression of Chloroplast Nadp-Malate
Dehydrogenase during Crassulacean Acid Metabolism Induction by Salt Stress.
Photosynthesis Research 35 (1):15-27.
Demeure, K., L. Quinton, V. Gabelica, and E. De Pauw. 2007. Rational selection of the
optimum MALDI matrix for top-down proteomics by in-source decay. Anal Chem 79
(22):8678-85.
Dietz, K. J. 2003. Plant peroxiredoxins. Annual Review of Plant Biology 54:93-107.
Dionisio-Sese, M. L., and S. Tobita. 1998. Antioxidant responses of rice seedlings to salinity
stress. Plant Science 135 (1):1-9.
Eltayeb, A. E., N. Kawano, G. H. Badawi, H. Kaminaka, T. Sanekata, I. Morishima, T. Shibahara, S. Inanaga, and K. Tanaka. 2006. Enhanced tolerance to ozone and drought
stresses in transgenic tobacco overexpressing dehydroascorbate reductase in cytosol.
Physiologia Plantarum 127 (1):57-65.
Faurobert, M., E. Pelpoir, and J. Chaib. 2007. Phenol extraction of proteins for proteomic studies of recalcitrant plant tissues. Methods Mol Biol 355:9-14.
Flores, P., M. A. Botella, V. Martinez, and A. Cerda. 2000. Ionic and osmotic effects on nitrate
reductase activity in tomato seedlings. Journal of Plant Physiology 156 (4):552-557.
Glenn, E. P., J. J. Brown, and E. Blumwald. 1999. Salt tolerance and crop potential of
halophytes. Critical Reviews in Plant Sciences 18 (2):227-255.
Hernandez, J. A., A. Jimenez, P. Mullineaux, and F. Sevilla. 2000. Tolerance of pea (Pisum sativum L.) to long-term salt stress is associated with induction of antioxidant defences.
Plant Cell and Environment 23 (8):853-862.

43
Hernandez, J.A., A. Campillo, A. Jimenez, J.J. Alarcon, and F. Sevilla. 1999. Response of
antioxidant systems and leaf water relations to NaCl stress in pea plants. New
Phytologist 141 (2):241-251.
Heuer, B. 2003. Influence of exogenous application of proline and glycinebetaine on growth of salt-stressed tomato plants. Plant Science 165 (4):693-699.
Hossain, M. A., and K. Asada. 1985. Monodehydroascorbate Reductase from Cucumber Is a
Flavin Adenine-Dinucleotide Enzyme. Journal of Biological Chemistry 260 (24):2920-2926.
Hsu, S. Y., and C. H. Kao. 2003. Differential effect of sorbitol and polyethylene glycol on
antioxidant enzymes in rice leaves. Plant Growth Regulation 39 (1):83-90.
Hu, T., H. Y. Li, X. Z. Zhang, H. J. Luo, and J. M. Fu. 2011. Toxic effect of NaCl on ion
metabolism, antioxidative enzymes and gene expression of perennial ryegrass.
Ecotoxicol Environ Saf 74 (7):2050-6.
Hussain, K., M. F. Nisar, A. Majeed, K. Nawaz, K. H. Bhatti, S. Afghan, A. Shahazad, and S. Zia-ul-Hussnian. 2010. What molecular mechanism is adapted by plants during salt
stress tolerance? African Journal of Biotechnology 9 (4):416-422.
Jithesh, M. N., S. R. Prashanth, K. R. Sivaprakash, and A. K. Parida. 2006. Antioxidative response mechanisms in halophytes: their role in stress defence. Journal of Genetics 85
(3):237-254.
Joseph, B., and D. Jini. 2010. Proteomic Analysis of Salinity Stress-responsive Proteins in Plants. Asian Journal of Plant Sciences 9 (6):307-313.
Kawasaki, S., C. Borchert, M. Deyholos, H. Wang, S. Brazille, K. Kawai, D. Galbraith, and H.
J. Bohnert. 2001. Gene expression profiles during the initial phase of salt stress in rice.
Plant Cell 13 (4):889-905.
Knight, H., A. J. Trewavas, and M. R. Knight. 1997. Calcium signalling in Arabidopsis thaliana
responding to drought and salinity. Plant J 12 (5):1067-78.
Koca, H., M. Bor, F. Ozdemir, and I. Turkan. 2007. The effect of salt stress on lipid peroxidation, antioxidative enzymes and proline content of sesame cultivars.
Environmental and Experimental Botany 60 (3):344-351.
Kussmann, M., E. Nordhoff, H. RahbekNielsen, S. Haebel, M. RosselLarsen, L. Jakobsen, J.
Gobom, E. Mirgorodskaya, A. KrollKristensen, L. Palm, and P. Roepstorff. 1997. Matrix-assisted laser desorption/ionization mass spectrometry sample preparation
techniques designed for various peptide and protein analytes. Journal of Mass
Spectrometry 32 (6):593-601.
Lange, W., W. A. Brandenburg, and T. S. M. De Bock. 1999. Taxonomy and cultonomy of beet
(Beta vulgaris L.). Botanical Journal of the Linnean Society 130 (1):81-96.
Leung, J., M. Bouvierdurand, P. C. Morris, D. Guerrier, F. Chefdor, and J. Giraudat. 1994. Arabidopsis Aba Response Gene Abi1 - Features of a Calcium-Modulated Protein
Phosphatase. Science 264 (5164):1448-1452.

44
Liu, J. P., M. Ishitani, U. Halfter, C. S. Kim, and J. K. Zhu. 2000. The Arabidopsis thaliana
SOS2 gene encodes a protein kinase that is required for salt tolerance. Proceedings of
the National Academy of Sciences of the United States of America 97 (7):3730-3734.
Liu, J. X., R. Srivastava, P. Che, and S. H. Howell. 2007. Salt stress responses in Arabidopsis utilize a signal transduction pathway related to endoplasmic reticulum stress signaling.
Plant Journal 51 (5):897-909.
Longstreth, D. J., and P. S. Nobel. 1979. Salinity Effects on Leaf Anatomy - Consequences for Photosynthesis. Plant Physiology 63 (4):700-703.
Maathuis, F. J. M., and A. Amtmann. 1999. K+ nutrition and Na+ toxicity: The basis of cellular
K+/Na+ ratios. Annals of Botany 84 (2):123-133.
Maathuis, F. J. M., and D. Sanders. 2001. Sodium uptake in arabidopsis roots is regulated by
cyclic nucleotides. Plant Physiology 127 (4):1617-1625.
Mahajan, S., G. K. Pandey, and N. Tuteja. 2008. Calcium- and salt-stress signaling in plants:
shedding light on SOS pathway. Arch Biochem Biophys 471 (2):146-58.
Mansour, M. M. F., K. H. A. Salama, and M. M. Al-Mutawa. 2003. Transport proteins and salt
tolerance in plants. Plant Science 164 (6):891-900.
Marcelis, L. F. M., and J. Van Hooijdonk. 1999. Effect of salinity on growth, water use and nutrient use in radish (Raphanus sativus L.). Plant and Soil 215 (1):57-64.
Maser, P., M. Gierth, and J. I. Schroeder. 2002. Molecular mechanisms of potassium and
sodium uptake in plants. Plant and Soil 247 (1):43-54.
Matysik, J., Alia, B. Bhalu, and P. Mohanty. 2002. Molecular mechanisms of quenching of
reactive oxygen species by proline under stress in plants. Current Science 82 (5):525-
532.
Meloni, D.A., M.A. Oliva, H.A. Ruiz, and C.A. Martinez. 2001. Contribution of proline and inorganic solutes to osmotic adjustmeny in cotton under salt stress Journal of Plant
Nutrition 24 (3):599-612.
Mitsuya, S., Takeoka Y., and Miyake H. 2000. Effects of sodium chloride on foliar ultrastructure of sweet potato ( Ipomoea batatas Lam.) plantlets grown under light and
dark conditions in vitro Journal of Plant Physiology 157:661-667.
Mittler, R., S. Vanderauwera, M. Gollery, and F. Van Breusegem. 2004. Reactive oxygen gene
network of plants. Trends Plant Sci 9 (10):490-8.
Mudgal, V., N. Madaan, and A. Mudgal. 2010. Biochemical Mechanisms of Salt Tolerance in
Plants: A Review. International Journal of Botany 6 (2):136-143.
Munns, R., and M. Tester. 2008. Mechanisms of salinity tolerance. Annu Rev Plant Biol 59:651-81.
Nesvizhskii, A. I., A. Keller, E. Kolker, and R. Aebersold. 2003. A statistical model for
identifying proteins by tandem mass spectrometry. Analytical Chemistry 75 (17):4646-4658.

45
Parida, A. K., and A. B. Das. 2005. Salt tolerance and salinity effects on plants: a review.
Ecotoxicology and Environmental Safety 60 (3):324-349.
Parida, A. K., A. B. Das, and B. Mittra. 2004. Effects of salt on growth, ion accumulation,
photosynthesis and leaf anatomy of the mangrove, Bruguiera parviflora. Trees-Structure and Function 18 (2):167-174.
Popova, O. V., S. F. Ismailov, T. N. Popova, K. J. Dietz, and D. Golldack. 2002. Salt-induced
expression of NADP-dependent isocitrate dehydrogenase and ferredoxin-dependent glutamate synthase in Mesembryanthemum crystallinum. Planta 215 (6):906-913.
Quintero, F. J., M. Ohta, H. Shi, J. K. Zhu, and J. M. Pardo. 2002. Reconstitution in yeast of the
Arabidopsis SOS signaling pathway for Na+ homeostasis. Proc Natl Acad Sci U S A 99 (13):9061-6.
Qureshi, M. I., S. Qadir, and L. Zolla. 2007. Proteomics-based dissection of stress-responsive
pathways in plants. Journal of Plant Physiology 164:1239-1260.
Reid, R. 2010. Can we really increase yields by making crop plants tolerant to boron toxicity? Plant Science 178 (1):9-11.
Rock, C. D. 2000. Pathways to abscisic acid-regulated gene expression. New Phytologist 148
(3):357-396.
Rubio, F., W. Gassmann, and J. I. Schroeder. 1995. Sodium-Driven Potassium Uptake by the
Plant Potassium Transporter Hkt1 and Mutations Conferring Salt Tolerance. Science
270 (5242):1660-1663.
Sadygov, R. G., D. Cociorva, and J. R. Yates, 3rd. 2004. Large-scale database searching using
tandem mass spectra: looking up the answer in the back of the book. Nature Methods 1
(3):195-202.
Shevchenko, A., H. Tomas, J. Havlis, J. V. Olsen, and M. Mann. 2006. In-gel digestion for mass spectrometric characterization of proteins and proteomes. Nat Protoc 1 (6):2856-60.
Shi, H., Y. Kim, Y. Guo, B. Stevenson, and J. K. Zhu. 2003. The Arabidopsis SOS5 locus
encodes a putative cell surface adhesion protein and is required for normal cell expansion. Plant Cell 15 (1):19-32.
Shi, H., L. Xiong, B. Stevenson, T. Lu, and J. K. Zhu. 2002. The Arabidopsis salt overly
sensitive 4 mutants uncover a critical role for vitamin B6 in plant salt tolerance. Plant
Cell 14 (3):575-88.
Srivastava, H. M., H. N. Shahi, R. Kumar, and S. Bhatnagar. 2000. Genetic Diversity in Beta
vulgaris ssp. maritima under Subtropical Climate of North India Journal of Sugar Beet
Research 37 (3):79-87.
Swaney, D. L., G. C. McAlister, and J. J. Coon. 2008. Decision tree-driven tandem mass
spectrometry for shotgun proteomics. Nature Methods 5 (11):959-964.
Teakle, N. L., and S. D. Tyerman. 2010. Mechanisms of Cl(-) transport contributing to salt tolerance. Plant Cell Environ 33 (4):566-89.
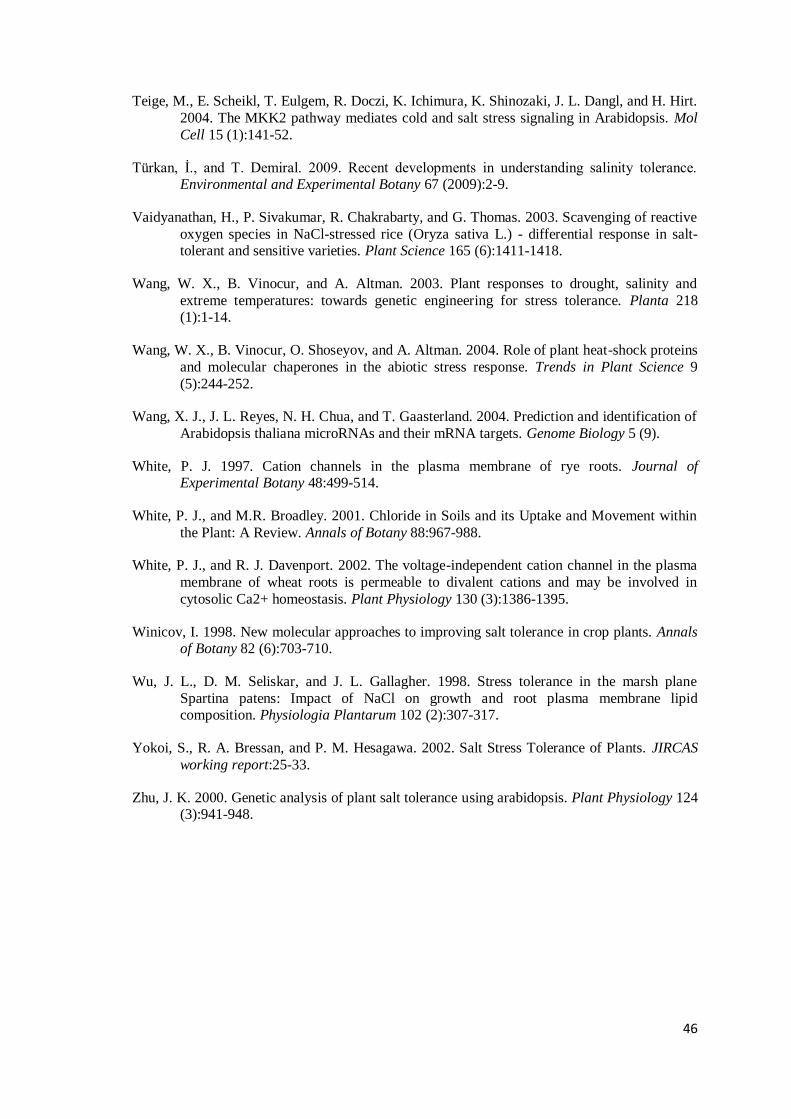
46
Teige, M., E. Scheikl, T. Eulgem, R. Doczi, K. Ichimura, K. Shinozaki, J. L. Dangl, and H. Hirt.
2004. The MKK2 pathway mediates cold and salt stress signaling in Arabidopsis. Mol
Cell 15 (1):141-52.
Türkan, İ., and T. Demiral. 2009. Recent developments in understanding salinity tolerance. Environmental and Experimental Botany 67 (2009):2-9.
Vaidyanathan, H., P. Sivakumar, R. Chakrabarty, and G. Thomas. 2003. Scavenging of reactive
oxygen species in NaCl-stressed rice (Oryza sativa L.) - differential response in salt-tolerant and sensitive varieties. Plant Science 165 (6):1411-1418.
Wang, W. X., B. Vinocur, and A. Altman. 2003. Plant responses to drought, salinity and
extreme temperatures: towards genetic engineering for stress tolerance. Planta 218 (1):1-14.
Wang, W. X., B. Vinocur, O. Shoseyov, and A. Altman. 2004. Role of plant heat-shock proteins
and molecular chaperones in the abiotic stress response. Trends in Plant Science 9
(5):244-252.
Wang, X. J., J. L. Reyes, N. H. Chua, and T. Gaasterland. 2004. Prediction and identification of
Arabidopsis thaliana microRNAs and their mRNA targets. Genome Biology 5 (9).
White, P. J. 1997. Cation channels in the plasma membrane of rye roots. Journal of Experimental Botany 48:499-514.
White, P. J., and M.R. Broadley. 2001. Chloride in Soils and its Uptake and Movement within
the Plant: A Review. Annals of Botany 88:967-988.
White, P. J., and R. J. Davenport. 2002. The voltage-independent cation channel in the plasma
membrane of wheat roots is permeable to divalent cations and may be involved in
cytosolic Ca2+ homeostasis. Plant Physiology 130 (3):1386-1395.
Winicov, I. 1998. New molecular approaches to improving salt tolerance in crop plants. Annals of Botany 82 (6):703-710.
Wu, J. L., D. M. Seliskar, and J. L. Gallagher. 1998. Stress tolerance in the marsh plane
Spartina patens: Impact of NaCl on growth and root plasma membrane lipid composition. Physiologia Plantarum 102 (2):307-317.
Yokoi, S., R. A. Bressan, and P. M. Hesagawa. 2002. Salt Stress Tolerance of Plants. JIRCAS
working report:25-33.
Zhu, J. K. 2000. Genetic analysis of plant salt tolerance using arabidopsis. Plant Physiology 124 (3):941-948.

47
APPENDIX A
LIST OF CHEMICALS
Ca(NO3)2.4H2O, MgSO4.7H2O, H3BO3, MnCl2.4H2O, ZnSO4.7H2O, CuSO4.5H2O,
NaMoO4, EDTA.2Na, FeSO4.7H2O, KOH, Tris, sucrose, KCl, PMSF, phenol,
ammonium acetate , urea, thiourea , CHAPS , DTT, CBB-G250, 85 % phosphoric acid ,
ethanol, SDS, glycerol anhydrous, acrylamide, bisacrylamide, ammonium sulfate,
glycine, agarose, Tris-dihydrogen phosphate, acetic acid and ammonium bicarbonate
(AppliChem)
KNO3, methanol, BSA, iodoacetamide, ammonium persulfate, TEMED and trypsin
proteomics grade (Sigma Aldrich)
KH2PO4, HCl, acetone, Bromophenol blue, acetonitrile and TFA (Merck)
Acetic acid and formic acid (Riedel-de Haën)
DTT (Fluka)
pH 3-10 Carrier Ampholyte (Biochemika)
CHCA (Bruker Daltonics)

48
APPENDIX B
CHEMICAL CONTENTS OF USED BUFFERS /
SOLUTIONS
Half-strength Hoagland: 3.5 mM Ca(NO3)2.4H2O, 2.5 mM KNO3, 1 mM
KH2PO4, 1 mM MgSO4.7H2O, 22 µM H3BO3, 4.5 µM MnCl2.4H2O, 0.35 µM
ZnSO4.7H2O, 0.2 µM CuSO4.5H2O, 0.07 µM NaMoO4, 15 µM EDTA.2Na, 14 µM
FeSO4.7H2O and 0.5 mM KOH are prepared in dH2O.
Protein Extraction Buffer: 500 mM Tris/HCl pH 8, 50 mM EDTA, 700 mM
sucrose, 100 mM KCl are prepared in water; just before usage 2 % (v/v) -
mercaptoethanol reducing agent and 1mM PMSF protease inhibitor are added.
Tris buffered phenol: Phenol is mixed with equal volume of 10X TE and after
the phases are separated well upper phase (TE) is discarded. This process is repeated
one more time with 10X TE and then two times with equal volume of 1X TE. Finally,
pH of the last discarded 1X TE should be ~8.
10X TE Buffer: 50 ml from 1M Tris (pH 8), 10 ml 0.5 M EDTA is mixed and
the total volume is completed to 500 ml with dH2O.
Protein Precipitation Reagent: 100 mM ammonium acetate is dissolved in ice
cold methanol.
2D-Rehydration Buffer: 7 M urea, 2 M thiourea, 4 % (w/v) CHAPS
zwitterionic detergent mixture is used for dissolving of proteins. IEF requires 65 mM
DTT and 8 % (v/v) pH 3-10 carrier ampholyte prepared with this buffer.
5X Red Colored Bradford Stock Reagent: 0.01 g CBB G-250 is dissolved in 5
ml ethanol, 10 ml 85 % phosphoric acid is added and final volume is completed to 25
ml with UP water. Reagent is filtered with Whatman paper and stored at 4oC in dark.
Equilibration Buffer I: 6 M urea, 375 mM Tris/HCl pH 8.8, 2 % (w/v) SDS, 20
% (v/v) glycerol and 2 % (w/v) DTT
Equilibration Buffer II: 6 M urea, 375 mM Tris/HCl pH 8.8, 2% (w/v) SDS,
20% (v/v) glycerol and 2.5 % (w/v) iodoacetamide
12 % Polyacrylamide Gel: 13.5 ml of dH2O, 16 ml of 30 % (w/v) acrylamide
mix, 10 ml of 1.5 M Tris (pH 8.8), 0.4 ml of 10 % (w/v) SDS, 0.4 ml of 10 % (w/v)
49
ammonium persulfate, 0.016 ml of TEMED are mixed respectively. Total volume is 40
ml.
30 % (w/v) acrylamide mix: 29 % (w/v) acrylamide and 1 % (w/v)
bisacrylamide are dissolved in dH2O.
1X Running Buffer: 250 mM glycine, 25 mM Tris, 0.1 % (w/v) SDS
Overlay Agarose Gel: 90 mM Tris, 190 mM glycine, 0.1 % (w/v) SDS, 0.5 %
(w/v) agarose and 0.002 % (w/v) Bromophenol blue indicator pH 3.0-4.6 are prepared
in water. Mixture is heated until the agarose is dissolved completely. Then, solution is
aliquoted into 1.5 ml micro centrifuge tubes and stored in -20oC.
Polyacrylamide Gel Staining Solution: 8 % (w/v) ammonium sulfate, 1.6 %
(v/v) concentrated phosphoric acid, 0.1 % (w/v) colloidal Coomassie Brilliant Blue G-
250, 20 % (v/v) methanol. CBB G-250 is pre-resolved in ~10 ml water and mixed with
the staining solution. Methanol is added finally.
Neutralization Buffer: 0.1 M Tris-Phosphate pH 6.5
Destaining Solution: 25 % methanol solution
Fixation Solution: 20 % Ammonium sulfate solution
Wash Solution for in Gel Digestion: 50 % (v/v) methanol and 5 % (v/v) acetic
acid in UP water.
10 mM DTT for in Gel Digestion: 1.5 mg DTT is dissolved in 1 ml of 100 mM
ammonium bicarbonate solution.
100 mM Iodoacetamide for in Gel Digestion: 18 mg iodoacetamide is
dissolved in 1 ml of 100 mM ammonium bicarbonate solution and stored in dark.
Trypsin solution: 100 l of ice cold 50 mM ammonium bicarbonate is added
onto 20 g of sequencing-grade modified trypsin. Final concentration is 200 ng/ l.
Then, 5 l of trypsin aliquots are stored in -80oC. Before used, ~70 l of freshly
prepared ice cold 50 mM ammonium bicarbonate solution is added and volume is
adjusted due to the spot size. Trypsin solution should cover the spot completely.
Extraction Buffer for in Gel Digestion: 50 % (v/v) acetonitrile and 5 % (v/v)
formic acid are prepared in UP water.
ZipTip Wetting Solution: Acetonitrile
ZipTip Equilibration Solution: 0.1 % (v/v) Trifluoro Acetic acid (TFA)
ZipTip Washing Solution: 0.1 % (v/v) TFA

50
ZipTip Elution Solution: 50 % (v/v) acetonitrile is prepared in 0.1 % (v/v)
TFA.
1st Layer of Matrix in MALDI: 3-6 mg of CHCA is dissolved in 100 l of
methanol and 400 l of acetone is added.
2nd
Layer of Matrix in MALDI: 5 mg CHCA is dissolved in 200 l methanol.
300 l of 0.1 % (v/v) trifluoro acetic acid (TFA) is added. As a result of aqueous media,
CHCA crystal formation is observed. Matrix solution is centrifuged at maximum speed
for 10 minutes. Supernatant is used as 2nd
layer.

51
APPENDIX C
SECOND AND THIRD SETS OF 2D-PAGE AND
BIOINFORMATIC RESULTS
2. Leaf Stress
2. Leaf Control
pH 10 pH 3
MW
pH 10 pH 3
MW

52
3. Leaf Stress
3. Leaf Control
MW
MW
pH 10 pH 3
pH 10 pH 3

53
2. Root Stress
2. Root Control
pH 10 pH 3
MW
pH 10 pH 3
MW

54
3. Root Stress
3. Root Control
pH 10 pH 3
pH 10 pH 3
MW
MW

55
2nd
and 3rd
Data Sets of Expression Profiles
0
0,5
1
1,5
L1 L2 L3 L4 L5 L6 L7 L8 L9 L10 L11
Re
lati
ve V
olu
me
(V
%)
stress group
control group
0
0,5
1
1,5
2
2,5
R1
R2
R3
R4
R5
R6
R7
R8
R9
R10
R12
R13
R14
R15
R17
R18
R19
R22
R23
R24
R25
R26
R27
Rel
ativ
e V
olu
me
(V%
)
stress group
control group
0
1
2
3
4
L1
L2
L3
L4
L5
L6
L7
L8
L9
L11
L12
L13
L14
L15
L16
L18
L21
L23
L24
L25
L26
Rel
ativ
e V
olu
me
(V%
)
stress group
control group
0
1
2
3
4
R1
R2
R3
R4
R5
R6
R7
R8
R9
R1
0
R11
R12
R1
3
R1
4
R1
5
R1
6
R1
7
R1
9
R2
0
R2
1
R2
2
R2
3
Rel
ativ
e V
olu
me
(V%
)
stress group
control group
2. Leaf
2. Root
3. Leaf
3. Root