Identification of novel lung genes in bronchial epithelium ...rng/psdepository/lung2006.pdf ·...
60
1 Identification of novel lung genes in bronchial epithelium by serial analysis of gene expression Kim M. Lonergan* 1 , Raj Chari 1 , Ronald J. deLeeuw 1 , Ashleen Shadeo 1 , Bryan Chi 1 , Ming-Sound Tsao 2 , Steven Jones 3 , Marco Marra 3 , Victor Ling 1 , Raymond Ng 1,4 , Calum MacAulay 5 , Stephen Lam 5 and Wan L. Lam 1 1 Cancer Genetics & Developmental Biology, 5 Department of Cancer Imaging, 3 Canada's Michael Smith Genome Sciences Centre, British Columbia Cancer Research Centre, Vancouver, BC, Canada, 2 Ontario Cancer Institute / Princess Margaret Hospital, Toronto, ON, Canada, 4 Computer Science, University of British Columbia, Vancouver, BC, Canada Running Title: Bronchial epithelium gene expression profiles Funding: This work was supported by funds from Genome Canada/Genome British Columbia and the National Cancer Institute of Canada. *Correspondence: Kim Lonergan British Columbia Cancer Research Centre 675 West 10 th Avenue, Vancouver, BC Canada V5Z 1L3 Tel. 604-675-8111 Fax. 604-675-8232 E-mail: [email protected] AJRCMB Articles in Press. Published on June 29, 2006 as doi:10.1165/rcmb.2006-0056OC Copyright (C) 2006 by the American Thoracic Society.
Transcript of Identification of novel lung genes in bronchial epithelium ...rng/psdepository/lung2006.pdf ·...

1
Identification of novel lung genes in bronchial epithelium by serial analysis of gene expression
Kim M. Lonergan*1, Raj Chari1, Ronald J. deLeeuw1, Ashleen Shadeo1, Bryan Chi1, Ming-Sound Tsao2, Steven Jones3, Marco Marra3, Victor Ling1, Raymond Ng1,4,
Calum MacAulay5, Stephen Lam5 and Wan L. Lam1
1Cancer Genetics & Developmental Biology, 5Department of Cancer Imaging, 3Canada's Michael Smith Genome Sciences Centre, British Columbia Cancer Research Centre, Vancouver,
BC, Canada, 2Ontario Cancer Institute / Princess Margaret Hospital, Toronto, ON, Canada, 4Computer Science, University of British Columbia, Vancouver, BC, Canada
Running Title: Bronchial epithelium gene expression profiles
Funding: This work was supported by funds from Genome Canada/Genome British Columbia and the National Cancer Institute of Canada.
*Correspondence: Kim Lonergan
British Columbia Cancer Research Centre 675 West 10th Avenue, Vancouver, BC
Canada V5Z 1L3 Tel. 604-675-8111 Fax. 604-675-8232
E-mail: [email protected]
AJRCMB Articles in Press. Published on June 29, 2006 as doi:10.1165/rcmb.2006-0056OC
Copyright (C) 2006 by the American Thoracic Society.
JPorteus
*This article has an online supplement, which is accessible from this issue’s table of content online at www.atsjournals.org

2
ABSTRACT
A description of the transcriptome of human bronchial epithelium should provide a basis for
studying lung diseases including cancer. We have deduced global gene expression profiles of
bronchial epithelium and lung parenchyma, based upon a vast data set of nearly two million
sequence tags from 21 serial analysis of gene expression (SAGE) libraries from individuals with
a history of smoking. Our analysis suggests that the transcriptome of the bronchial epithelium is
distinct from that of lung parenchyma and other tissue types. Moreover, our analysis has
identified novel bronchial-enriched genes such as MS4A8B, and has demonstrated the utility of
SAGE for the discovery of novel transcript variants. Significantly, gene expression associated
with ciliogenesis is evident in bronchial epithelium, and includes the expression of transcripts
specifying axonemal proteins DNAI2, SPAG6, ASP, and FOXJ1 transcription factor. Moreover,
expression of potential regulators of ciliogenesis such as MDAC1, NYD-SP29, ARMC3 and
ARMC4 were also identified. This study represents a comprehensive delineation of the bronchial
and parenchyma transcriptomes, identifying more than 20,000 known and hypothetical genes
expressed in the human lung, and constitutes one of the largest human SAGE studies reported to
date.
Key words: bronchial epithelial, lung parenchyma, SAGE, expression profile, ciliogenesis

3
INTRODUCTION
The bronchial epithelium is a pseudo-stratified structure, consisting of specialized cell types
including basal cells, goblet cells, and ciliated columnar cells, and plays an active role in airway
defense by protecting the respiratory tract from infection and damage induced by environmental
toxins. Moreover, maintenance of tissue architecture and cellular polarity is crucial for proper
lung function. Disorders such as cystic fibrosis and primary ciliary dyskinesia, originate from
impaired ionic transport across the bronchial epithelium and impaired ciliary function,
respectively (1-3).
Several large-scale gene expression studies have been published that describe disease
states of the lung such as chronic obstructive pulmonary disease (COPD), emphysema, and non-
small cell lung cancer (NSCLC), as well as response to microbial exposure in bronchial
epithelial primary cell cultures (4-11). In a recent study, 2,382 genes were identified to be
consistently expressed in large-airway epithelial cells of healthy never smokers, as were 97 genes
induced by smoking (12). Despite these informative studies, knowledge of gene expression in the
bronchial epithelium remains limited.
An improved understanding of the bronchial epithelium transcriptome, specifically that
exposed to tobacco smoke and therefore at an increased risk of malignant transformation and
other lung pathologies, should serve as a baseline to facilitate an understanding of molecular
mechanisms underlying central airway disorders of diverse etiologies. In this study, we have
determined the gene expression profile of 19 bronchial epithelial samples from current or former
smokers by serial analysis of gene expression (SAGE) (13), constituting one of the largest
human expression studies reported to date. Significantly, we were successful in constructing

4
SAGE libraries from human bronchial epithelial cells isolated by endoscopic brushing of the
central airways. This was achieved without the need for either cell culturing or linear
amplification of RNA. SAGE profile comparisons defined bronchial gene expression relative to
that of lung parenchyma, and offered the potential for discovery of alternate transcript variants in
known lung genes. Further comparison with profiles derived from various normal human
tissues, revealed novel bronchial-enriched genes, including those associated with innate defense
and ciliogenesis.
MATERIALS AND METHODS
Specimens
Bronchial epithelial specimens used in this study were obtained from segmental and sub-
segmental bronchi by brushing with a 3 mm teflon brush with a sheath (Hobbs Medical, Stafford
Springs, CT) during autofloresent bronchoscopy. The areas brushed were without abnormalities
for moderate dysplasia or worse pathology as determined by combined autoflouresent and white
light bronchoscopy using the LIFE-Lung device (14). The brush (with adhering tissue) was
immediately immersed in RNAlater (Ambion, Austin, Texas) and stored at -85°C. Cytologic
examination indicated that on average, specimens consisted of over 90% bronchial epithelial
cells with the remainder consisting of leukocytes and alveolar macrophages. All individuals
were Caucasians ranging in age from 54 to 72 years, and were either current or former smokers,
with smoking exposure ranging from 30 to 100 pack years (Table 1). No individuals were
known to be asthmatic based on clinical history and lung function testing. This study was
approved by the Review of Ethics Board of the Ministry of British Columbia.

5
Parenchyma was obtained from lung resections from former or current smokers
diagnosed with squamous cell carcinoma, and ranging in age from 54 to 84 years. Lung
parenchyma is typically comprised of various cell types including Type I and Type II alveolar
cells, bronchiolar cells that include Clara cells, endothelial cells, stromal material, and to a lesser
extent alveolar macrophages and leukocytes.
SAGE Library Construction and Sequence Processing
Bronchial brushing specimens in RNAlater were diluted 2-fold with phosphate buffered saline
and cells were collected by centrifugation and homogenized in lysis/binding solution (100 mM
Tris-HCl, pH 7.5, 500 mM LiCl, 10 mM EDTA, pH 8.0, 1 % LiDS, 5 mM dithiothreitol). The
resultant lysate was used directly for bronchial epithelial (BE) SAGE library construction.
For the lung parenchyma (LP) libraries, RNA was isolated from 8 individuals by
guanidium isothiocyanate and phenol/chloroform extraction (15). Each of 2 libraries was
constructed from RNA pooled from four specimens in equal amounts; ~19 !g of total RNA
were used in constructing each library.
All SAGE libraries were constructed according to the MicroSAGE protocol, using Nla III
as the anchoring enzyme and Bsm FI as the tagging enzyme [(13); detailed at www.sagenet.org].
Reagents, primers and restriction enzymes were purchased from Dynal Biotech (Brown Deer,
Wisconsin), Integrated DNA Technologies (Toronto, Ontario), Fisher Scientific (Nepean,
Ontario), and New England Biolabs (Pickering, Ontario). The I-SAGE kit and Platinum Taq
polymerase were purchased from Invitrogen Life Technologies (Burlington, Ontario).
On average, 105 SAGE tags, excluding linker and duplicate ditags, were sequenced per
library (Table 1). For normalization, tag counts were scaled to 106 tags/library and presented as

6
tags per million (TPM). Tag-to-gene mapping was according to the SAGE Genie database [(16);
cgap.nci.nih.gov/SAGE], with reference to SAGEmap.
Cluster Analysis
To evaluate the degree of similarity of the lung libraries to those generated from multiple tissue
types, the 19 BE and the 2 LP libraries from this study were compared with 14 libraries derived
from normal lung, brain, colon, breast and prostate tissue selected from the GEO (Gene
Expression Omnibus) data repository at SAGEmap (17). For cluster analysis, the 300 most
abundant tags (representing ~1/3 of the total tag count) were retained from each library, yielding
a merged list of 1610 unique tags. A correlation coefficient matrix between all pairs of libraries
was generated, processed through the statistical software package R (18), and then clustered
based on the single-link hierarchical clustering algorithm.
Identification of Bronchial-enriched Genes
To identify genes preferentially expressed in bronchial epithelium, we compared the 19 BE
libraries with those generated from a variety of normal tissue types including brain, breast, colon,
prostate, kidney, leukocyte, skin, peritoneum, liver, heart and spinal cord, all retrieved from the
GEO data repository at SAGEmap.
All 19 BE libraries were grouped together, and the mean and standard deviation were
computed for each tag. For some tags, the SD may be considerable relative to the mean. Thus, a
simple fold change may be misleading. One improvement is to use the standard deviation-
adjusted ratio (SD-Adj Ratio), which in this case is defined as (bronchial mean - bronchial SD) /
(non-lung mean + non-lung SD). This ratio, by design, is conservative because it always gives a

7
value no greater than the simple fold change. Bronchial-enriched tags were identified according
to their SD-Adj Ratio, and the results were sorted in descending order.
RT-PCR Analysis
RNA was isolated from bronchial brushing specimens using Trizol reagent (Invitrogen) and
treated with DNase I (Roche Diagnostics, Laval, Quebec) prior to cDNA synthesis. Forty
nanograms of total RNA was converted into cDNA using SuperScript II reverse transcriptase and
oligo dT20 primer according to manufacture’s recommendations (Invitrogen). Control reactions
were set up in parallel, omitting the reverse transcriptase. For validation of lung-specificity of
expression, human MTC Multiple Tissue cDNA Panels I and II (cat# 636742; 636743, Clontech,
Mississauga, Ontario) were used in addition to bronchial epithelial cDNA. PCR was performed
for 30 cycles using Platinum Taq DNA Polymerase (Invitrogen) and gene-specific primers
(Alpha DNA, Montreal, Quebec). Primers were selected from sequence close to the SAGE tag
and designed to generate 100 to 200 bp amplicons (Supplemental Table 2). PCR products were
resolved by agarose gel electrophoresis, and visualized by ethidium bromide staining.
For quantitative RT-PCR, total RNA was converted into cDNA using the High-Capacity
cDNA Archive kit (cat# 4322171, Applied Biosystems), and gene-specific quantitative PCR was
performed using TaqMan Universal PCR Master Mix and TaqMan primers (cat# 4326708,
Applied Biosystems), according to manufacturer’s recommendation. Beta-actin was used as an
endogenous control (primer product code 4352935E). Primer product codes for test genes:
ARMC3, Hs00330456_ml; Blu, Hs00210720_ml; MDAC1, Hs00373644_ml. The reactions
were run on an iCycler iQ Real-Time PCR Detection System (Bio-Rad), and method of analysis
was the delta-delta CT.

8
SFTPB transcript variant 2-short: cloning and cDNA sequencing
The 3’-terminal region of SFTPB (surfactant, pulmonary-associated protein B) transcript variant
2-short was identified by differential display (DD), based on a previously described method (19).
Briefly, poly (A)+ RNA isolated from lung parenchyma was primed and amplified using C-
anchored oligo dT with a Hind III site at the 5’-end (5’-TGCCGAAGCTTTTTTTTTTTC-3’)
and arbitrary primer encoding an Eco RI site (5’-CCGTGAATTCGCTGGGAT-3’). Full-length
SFTPB transcript variant 2-short was amplified from a Human Lung Marathon-ReadyTM cDNA
library (cat# 7408-1, Clontech), using the Marathon Adaptor Primer 1 (AP1), and an antisense
primer designed according to the sequence of the DD product (5’-
GCTAAGGCTTGTTTGGCTTTTTGTT-3’). The primary PCR product was reamplified using
the same primer, but including an EcoRI site at the 5’-end (5’-
CGGAATTCGCTAAGGCTTGTTTGGCTTTTTGTT-3’). The 5’-RACE product (~1.8 kb) was
cloned into Not I/Eco RI-digested pBluescript II KS (+/-) vector (Stratagene).
Northern hybridization
RNA was extracted from frozen lung parenchyma using Trizol reagent. Three to 5 !g of total
RNA were resolved by 2.2 M formaldehyle/1 % agarose gel electrophoresis, and transferred to
nylon membrane. SFTPB transcript variant 2-short 3’-UTR oligonucleotide probe (5’-
TCCTCATGACCTAACCTCATCCCAGT-3’) was labeled with "-32P dATP using terminal
deoxynucleotidyl transferase (Promega), and allowed to hybridize at a concentration of 0.1
pmol/ml of hybridization solution (50 mM NaPO4, pH 7.2, 0.65 M NaCl, 7 % SDS, 1 % BSA)
containing 10 !g/ml poly (A)+ RNA as blocker, at 60°C for 7 hours. The probed blot was

9
washed repeatedly in 2x SSC, 0.5 % SDS at room temperature, with a final wash in 0.5x SSC,
0.1 % SDS at 44°C for 2 minutes, and exposed to autoradiographic film. The SFTPB coding-
region probe (spans nucleotides 1 through 644, Fig. 4A) was labeled by random priming in the
presence of "-32P dATP, and hybridization was at 62°C for 19 hours in hybridization solution (as
above) containing 0.1 mg /ml salmon sperm DNA as blocker. The probed blot was washed
repeatedly in 2x SSC, 1 % SDS at room temperature, with a final wash in 0.2x SSC, 0.5 % SDS
at 55°C for 30 minutes, and exposed to autoradiographic film.
Tissue Dot Blot hybridization
Human RNA Master BlotTM (cat# 7770-1, Clontech) containing poly (A)+ RNA from 50
different tissues, was probed with SFTPB transcript variant 2-short 3’-UTR oligonucleotide
probe as described above, at 58°C for 7 hours. The probed blot was washed repeatedly in 2x
SSC, 1 % SDS at room temperature, with a final wash in the same solution at 41°C for 2
minutes, and exposed to autoradiographic film.
RESULTS AND DISCUSSION
Enumeration of sequence tags expressed in bronchial epithelium by SAGE
This study describes large-scale gene expression profiling of smoke-damaged bronchial
epithelium and lung parenchyma, through generation and analysis of 21 SAGE libraries,
sampling nearly 2 million sequence tags (Table 1). Even with the precautionary exclusion of
singleton sequence tags (some of which potentially contain sequencing errors) >80,000 unique
tags were identified from the 19 bronchial epithelial (BE) libraries collectively, and >10,000

10
unique tags from the 2 lung parenchyma (LP) libraries (pooled from 4 individuals each).
However, only 70 % of the unique tags from the BE dataset (55,869/80,183) mapped to a
UniGene cluster according to SAGE Genie tag-to-gene mapping. Remarkably, the fact that
24,314 unique tags do not match a UniGene cluster, suggests that many genes expressed in
bronchial epithelium are not represented in the current databases of expressed sequence tags
(ESTs). This interpretation is consistent with findings that the majority of unmatched SAGE
tags represent novel transcript variants and/or novel genes (20). Moreover, as multiple SAGE
tags frequently map to the same gene, the number of unique tags with UniGene mappings may
not necessarily reflect the number of genes expressed. Accordingly, the 55,869 mapped unique
SAGE tags converged to 22,822 unique UniGene clusters, presumably reflecting an abundance
of transcript variants [alternative splicing and/or alternate poly (A+) adenylation site usage], and
antisense transcripts (Fig. 1). Our tag-to-gene ratio of 2.45:1 is close to that calculated for the
entire publicly available SAGE database (2.25:1), which at the time of analysis consisted of 101
human libraries (20).
Notably, ~30 % of the unique 22,822 UniGene clusters, have non-annotated (i.e., no
associated gene symbol) mapping assignments. More than one-half of these map to transcribed
loci, while others map to hypothetical genes/loci and cDNA clones. Of the 15,680 annotated
UniGene clusters identified, a significant portion map to uncharacterized transcripts classified as
chromosomal open reading frames (~5%), hypothetical proteins (~6%), and KIAA proteins
(~3%). Hence, the sequencing of nearly two million SAGE tags not only yielded expressional
information on ~13,000 known genes, but also from a large number of uncharacterized genes.
Continuing cDNA sequencing efforts (e.g. RefSeq, Mammalian Gene Collection) will improve
prospective annotation of more UniGene clusters as well as the accuracy of tag-to-gene mapping.

11
Relatedness of epithelium and parenchyma expression profiles
Cluster analysis indicate that bronchial epithelium and lung parenchyma are distinguishable
based upon gene expression profiles. The 19 BE libraries cluster as one clade distinct from both
lung parenchyma libraries and select non-lung libraries in GEO; while the two lung parenchyma
libraries from this study (LP-1, LP-2) and an additional lung library (Lung_762) from SAGEmap
database, cluster together (Fig. 2).
In addition, linear regression analysis of all possible pairings between the individual BE
libraries and the LP libraries, was used as a measure of relatedness. The linear regression data is
provided in Supplemental Table 1. With the exception of library pair BE-8A/8B, the bronchial
epithelial libraries are all very similar to one another, with an average R value of 0.9 (SD = 0.06).
Likewise, the two LP libraries are also similar to each other (R = 0.93). In contrast, comparison
of the LP with the BE libraries yielded a low concordance (average R= 0.58), indicating a
significant difference between these two tissue types (p < 0.005). Thus, both cluster and linear
regression analysis illustrate the striking distinctiveness of these 2 lung tissue types.
Repeatability of SAGE
To test the repeatability of the SAGE protocol, we generated duplicate libraries (BE-4A/4B)
from a single tissue lysate of a bronchial brushing. According to the clustering analysis, these
duplicate libraries group together (Fig. 2). Similarly, linear regression scores indicate that
duplicate libraries BE-4A/4B are more closely related to one another (R = 0.99) than either is to
any other library in the dataset. For reference, the average R value for BE-4A versus the other

12
bronchial libraries (excluding BE-4B, and BE-8A/8B) is 0.9; the average R value for BE-4B
versus the other bronchial libraries (excluding BE-4A, and BE-8A/8B) is 0.89.
Reproducibility of bronchial brushings
To evaluate the reproducibility of bronchial brushings in terms of gene expression profile, two
pairs of libraries (BE-8A/8B and BE-11A/11B) were constructed from brushings attained from
the same individuals, taken approximately one month apart. According to cluster analysis, BE-
11A and BE-11B group together (Fig. 2). Similarly, linear regression data supports a strong
relatedness between libraries 11A and 11B [R = 0.97; compared with average R values to the
other brushing libraries of 0.86 for BE-11A (excluding BE-11B and BE-8A/B) and 0.91 for BE-
11B (excluding BE-11A and BE-8A/B)].
Conversely, although BE-8A and BE-8B (libraries originating from the same individual)
cluster within the bronchial epithelial clad (Fig. 2), linear regression data suggests that these two
libraries are distantly related to the other BE libraries (average R = 0.75 and 0.74, respectively),
and moreover have a relatively low similarity score to each other (R = 0.69). It is noted that the
presence of red blood cells was atypically evident within the lysate used to generate library BE-
8A; this is consistent with a relatively high abundance of SAGE tags specifying hemoglobin
transcripts in this library. Whether or not this contributes to the disparity observed between
libraries BE-8A and BE-8B is not known. Although BE-11A/11B strongly supports the
reproducibility of bronchial brushings, BE-8A/8B illustrates that care must be taken at the time
of sample acquisition.
Expression profile of bronchial epithelial SAGE libraries

13
The complete data for the 19 BE libraries has been deposited in the GEO database under
GenBank accession number GSE3707. Tag-to-gene mapping classifications of the 50 most
abundant SAGE tags from the average of these libraries are summarized in Fig. 3A. Twenty-one
of these tags map to nuclear-encoded, non-ribosomal transcripts, 8 of which show enriched
expression in the bronchial epithelium libraries relative to other tissue-specific SAGE libraries
(per SAGE Anatomic Viewer, SAGE Genie), and are described in Table 2. At least four of these
bronchial-enriched proteins are associated with defense of the bronchial epithelium against
susceptibility to infection, protection from cytotoxic effects of pro-inflammatory reactants, or
modulation of inflammatory responses: MUC5B (mucin 5B), a major component of respiratory
tract mucus associated with mucociliary transport and clearance (21); LPLUNC1 (long palate,
lung and nasal epithelium carcinoma-associated 1), one of seven members belonging to the
PLUNC family of proteins postulated to play a role in innate immune defense (22); SCGB1A1
(secretoglobin family 1A, member 1; also known as Clara-cell specific 10-kD protein;
uteroglobin), which is the most abundantly expressed transcript in the bronchial epithelium
libraries, associated with immunoregulatory and anti-inflammatory activities (23); SLPI
(secretory leukocyte proteinase inhibitor), a protease-inhibitor associated with protection against
proteolytic damage during inflammatory responses; also exhibiting anti-microbial and wound-
healing activities (24, 25).
Genes associated with basic cellular processes such as protein biosynthesis, nucleotide
metabolism, and cytoskeletal structure, are also highly expressed in the bronchial epithelial
libraries. We emphasize that all expression profiles presented in this study have been derived
from either current or former smokers, and thus the relative high expression of some of the genes
identified in Table 2 may be a consequence of smoke-damage to the bronchial epithelium. In
14
this regard, it is noted that expression of three of the genes identified in Table 2, MSMB
(microseminoprotein, beta), FTHI (ferritin heavy polypeptide 1), and MUC5B, were found to be
significantly elevated in current smokers relative to never smokers (12).
Expression profile of lung parenchyma SAGE libraries and novel transcript discovery
The complete data for the 2 LP libraries has been deposited in the GEO database under GenBank
accession number GSE3708. Tag-to-gene mapping classifications of the 50 most abundant
SAGE tags from the average of the 2 libraries are described in Fig. 3B. Twenty-five of these
tags map to nuclear-encoded, non-ribosomal proteins and are described in Table 2. Surfactant-
associated protein (SFTP) gene tags, including those mapping to SFTPA2, SFTPB, and SFTPC,
are prominent within this dataset. Surfactant is an extracellular phospholipid-protein complex
that plays an essential role in normal respiration by lowering surface tension at air-liquid
interfaces in the alveoli, and also plays an important role in innate immune defense within the
lung (26, 27). Notably, tags mapping to genes associated with humoral immune response are
also prominent within the LP dataset.
Detailed investigation into tag-to-gene mapping has resulted in discovery of a novel
transcript variant in lung parenchyma. The most abundant SAGE tag identified in the
parenchyma libraries for SFTPB has an internal localization within the 3’-UTR of transcript
variant 2 (tag position 3 spanning nt 1703-1716, GenBank Accession Number NM_198843) and
consequently has a low tag-to-gene mapping reliability score of 54%. This, in combination with
the finding that the most reliable SAGE tag mapping to transcript variant 2 (tag position 1
spanning nt 2378-2391; 92% reliability) is not prominent within the LP libraries, prompted us to
further investigate possible transcript variants of SFTPB within lung parenchyma. Using

15
differential display, we identified a transcript from lung parenchyma that terminates within the
3’-UTR of SFTPB transcript variant 2; more specifically, just downstream of the low reliability
SAGE tag described above. We refer to this transcript as SFTPB transcript variant 2-short.
Significantly, a potential poly (A)+ addition signal can be identified just upstream of the
experimentally determined 3’-terminus of transcript variant 2-short (Fig. 4A). Northern
hybridization of normal lung RNA using a probe specific to the 3’-UTR of transcript variant 2,
detects 2 transcripts measuring ~2.6 and ~1.9 kb in length. Rehybridization of the same blot to a
SFTPB coding-region probe, suggests the ~1.9 kb species represents SFTPB transcript variant 2-
short. Although the ~2.6 kb species is similar in size to that predicted for full-length transcript
variant 2, the absence of detectable hybridization to the SFTPB coding-region-specific probe,
leaves the exact identity of this species unresolved (Fig. 4B). In addition, the SFTPB coding-
region probe also detects a second relatively abundant species within the 1.5 to 2 kb size range,
which may correspond to SFTPB transcript variant 1 (GenBank Accession Number
NM_000542), gene-specific tags for which are also prominent within our SAGE database. In
accordance with surfactant gene expression, SFTPB transcript variant 2-short shows tissue-
specific expression in lung (Fig. 4C). It is noted that the 3’-terminus of cDNA clone from library
NCI_CGAP_D10 (Genbank Accession Number CA439044), generated from lung tissue RNA
primed with oligo (dT), matches that of SFTPB transcript variant 2-short reported here. These
data demonstrate the utility of SAGE for the identification of novel transcript variants, even for
well-studied genes such as the SFTPs.
Comparison of bronchial epithelial and lung parenchyma abundant transcripts

16
Remarkably, comparison of the BE and LP libraries, revealed that 28 of the 50 most highly
expressed tags are common to both datasets. These include 6 of the most abundant
mitochondrial-derived tags, 11 tags mapping to ribosomal protein-coding genes, and 7 tags
mapping to nuclear-encoded (non-ribosomal protein) transcripts described in Table 2. Among
those common to both bronchial epithelium and lung parenchyma, as well as to most major
tissue types in general, are tags mapping to LAMR1 (laminin receptor 1), TPT1 (tumor protein
translationally controlled), FTH1, and NT5C (5’, 3’-nucleotidase, cytosolic). Additionally, genes
involved in the synthesis and assembly of MHC (major histocompatibility complex), class 1 and
class II proteins, including B2M (beta-2-microglobulin), and CD74 (invariant polypeptide of
MHC, class II, antigen-associated) are also commonly expressed.
On the other hand, many of the most highly expressed genes differ when comparing
bronchial epithelium with lung parenchyma. Tags enriched in bronchial epithelium relative to
most major tissue types including lung parenchyma, include those mapping to MSMB (also
highly expressed in prostate), MUC5B, LPLUNC1, AGR2 (anterior gradient homolog 2, also
highly expressed in stomach), TFF3 (trefoil factor 3, a mucosal peptide also highly expressed in
thymus and colon), CAPS (calcyphosine), CGI-38 (compararaive gene identification-38), TUBB2
(tubulin, beta 2), and SLPI (Table 2). The most abundant tag in the bronchial dataset maps to
SCGB1A1, and is also detected in the parenchyma libraries, albeit at ~10-fold lower abundance.
Conversely, tags mapping to transcripts encoding surfactant-associated proteins and NAPSA
(napsin A aspartic peptidase), a protease involved in posttranslational processing of the
proSFTPB precursor (28), are enriched in lung parenchyma relative to most tissue types
including bronchial epithelium. Additionally, tags mapping to a number of transcripts including
G1m (immunoglobulin heavy constant gamma 1), SPARC (osteonectin), RNASE1 (ribonuclease,

17
RNase A family 1, also highly expressed in pancreas), EGR1 (early growth response 1), APOC1
(apolipoprotein C-I, also highly expressed in liver), TMSB4X (thymosin, beta 4, X chromosome),
and FTL (ferritin, light polypeptide) are highly represented in lung parenchyma and unrelated
tissue types relative to the bronchial epithelium (Table 2). These observations illustrate that,
despite similarities in expression profiles between bronchial epithelium and lung parenchyma,
significant differences exist reflecting regional distinctions in cellular composition and biological
function. These data, taken in conjunction with the cluster and linear regression analysis data,
stress the importance of using matching tissue types when analyzing expression profiles.
Identification of bronchial-enriched genes
Genes whose expression is enriched in bronchial epithelium relative to other tissue types were
identified by first comparing our data with normal non-lung libraries in the SAGEmap database,
and secondly by validating tissue specificity of expression for select genes by RT-PCR
experimentation. Through this approach, we have discovered the expression pattern of genes
previously unknown to be expressed in bronchial epithelium. Tag-to-gene mapping
classifications of the top 100 bronchial-enriched tags are summarized in Fig. 5. A description of
the top 30 tags with 70% or greater mapping reliabilities to defined transcripts is presented in
Table 3.
SCGB1A1 is the most highly expressed transcript within the BE SAGE dataset (see
above). Although SCGB1A1 expression is highly enriched in both bronchial epithelium and lung
parenchyma relative to all other tissue types studied here, RT-PCR analysis reveals relatively
moderate levels of expression in prostate, with lower levels in a minimal number of other tissues.

18
This is in accordance with literature reports that SCGB1A1 shows highest expression in lung, but
with significant expression in prostate (29).
KCNE1 (potassium voltage-gated channel, Isk-related family, member 1) is a member of
the KCNE family of accessory protein subunits, and in complex with the pore-forming channel
protein KCNQ1, is involved in the regulation of potassium (K+) channel activity in the heart
(30). Expression profiling reveals that KCNQ1 is expressed in many human tissues in addition to
heart, highlighting the relevance of voltage-gated K+ channels for normal physiology of many
tissues including lung (31). Enriched expression of KCNE1 in BE SAGE libraries reported here,
suggests that KCNQ1/KCNE1 complexes play a significant role in K+ conductance within the
bronchial epithelium.
ABCA13 (ATP binding cassette gene, subfamily A, member 13) is a recently identified
member of the ABC transporter superfamily of proteins. Highest expression levels in human
tissue is found in trachea, testis, and bone marrow (32). The data reported here, suggests that
ABCA13 is predominantly expressed in the bronchial epithelium, with lower levels of expression
observed in testis, pancreas, and lung parenchyma.
Expression of MS4A8B (membrane-spanning 4-domains, subfamily A, member 8B) has
not previously been reported in bronchus, and appears to be relatively specific to bronchus.
MS4A8B is a member of the MS4A family of transmembrane proteins structurally related to and
including the cell surface hematopoietic proteins CD20, the high affinity IgE receptor beta chain,
and HTm4 (hematopoietic cell 4 transmembrane protein). These proteins have been proposed to
function as ligand-gated ion channels with signal transduction activity (33). Multiple members
of the MS4A gene family (including member 8B) are clustered within an approximately 600 kb
region on chromosomal region 11q12, one of multiple genetic loci (11q12-q13) linked to asthma

19
development (34). Considering the highly enriched expression in bronchial epithelium, and the
chromosomal location, it is suggested that MS4A8B may play an important role in respiratory
function.
Discovery of genes associated with ciliary function in bronchial epithelium
Unexpectedly, many of the novel bronchial-enriched genes identified by library
comparisons were also found, according to the RT-PCR validation, to be prominently expressed
in testis (Table 3; Fig. 6). This reflects the absence of a testis library in the SAGEmap database
at the time of our analysis; hence those genes predominantly expressed in bronchus and testis
were included in our collection of bronchial-enriched tags. Coincidentally, these two tissues
share a common structural feature, the axoneme: instrumental to flagellar-mediated sperm
motility in testis and cilia-mediated mucociliary clearance in lung; thus accounting for many
shared transcripts. For example, DNAI2 (axonemal dynein intermediate polypeptide 2) belongs
to a family of dynein polypeptides localized to ciliary and flagellar axonemes and functions as a
component of a multi-subunit motor complex in association with microtubules to facilitate
ciliary/flagellar motility (35). In contrast to axonemal dyneins, expression of cytoplasmic dynein
polypeptides is evident within both bronchus and lung parenchyma, consistent with functional
expectation. Other examples of genes preferentially expressed in bronchial epithelium and testis
with known roles in flagellar/ciliary activity include: SPAG6 (sperm-associated antigen 6),
encoding an axonemal component of sperm flagella (36, 37); ASP (AKAP-associated sperm
protein), encoding a protein which binds to the A-kinase anchoring protein 110 from sperm
flagella (38) and FOXJ1 (forkhead transcription factor J1), required for developmental stages of
ciliogenesis (39). These findings concur with the fact that over 200 potential ciliary axonemal

20
proteins were detected in human bronchial epithelial cells using a proteomic approach (40).
Furthermore, the abundance of adenylate kinase 7 gene-specific tags in the bronchial epithelium
libraries is also consistent with ciliary function, as adenylate kinase activity has been associated
with axonemes in protozoa and green algae (41-43).
Other genes preferentially expressed in bronchial epithelium and testis, but with unknown
functions, include BLu (Zinc finger with MYND domain 10), MDAC1, ARMC3 and ARMC4
(armadillo repeat containing 3 and 4), CASC1 (cancer susceptibility candidate 1), and NYD-
SP29 (testis development protein). Notably, expression of ARMC3, ARMC4, MDAC1 and NYD-
SP29 has not previously been reported in lung. The preferential expression of BLu, MDAC1 and
ARMC3 in bronchial epithelium versus parenchyma was verified by quantitative real-time RT-
PCR in a separate cohort (Supplemental Table 6). Some or all of these genes may represent
previously unrecognized components or regulators of ciliogenesis. NYD-SP29 shares high
sequence similarity with dynein intermediate chain IC140, believed to mediate anchoring of
inner dynein arms to axonemal microtubules within the flagella of Chlamydomonas reinhardtii
(44). CASC1 has been identified as a putative homolog to a protein from rat, “similar to
axonemal p83.9”, and was initially identified as the Las1 gene, encoded within the murine
pulmonary adenoma susceptibility locus (Pas1) (45). These data suggest that an investigation
into the role of ciliary activity in maintenance of normal growth control within the lung may be
warranted.
A significant proportion of tags enriched in bronchial epithelium map to undefined
transcripts including chromosomal open reading frames and hypothetical proteins (Fig. 5). We
have further investigated the expression of 6 such transcripts (Table 3). Chromosomal open
reading frames C9orf117 and C6orf118, and hypothetical proteins DKFZp434I099 and

21
FLJ32884 were all found to be preferentially expressed in bronchus and testis, while expression
of hypothetical protein MGC48998 appeared to be specific to bronchus, and that of hypothetical
protein FLJ40919 was found to be highly enriched in bronchus, with minimal expression
detected in heart. Sequence similarity search results support a role in ciliogenesis for C9orf117
and FLJ32884.
Interestingly, tags specifying proteins assigned either an established (e.g., DNAI2) or a
potential (e.g., ARMC3) role in ciliogenesis, are frequently detected at notable levels in
ependymoma SAGE libraries in SAGEmap. And since ependymoma constitutes a cancer
originating within a ciliated region of the brain, ciliary proteins could potentially serve as
markers to detect clonal expansion originating from this cell type.
Correlation of gene expression in the bronchial epithelium with smoking status
We determined genes differentially expressed between current and former smokers in our
bronchial epithelium SAGE dataset, which was comprised of 5 current and 11 former smokers.
349 tags showed at least a three-fold difference -- of which 149 tags were higher in the current
smoker category (Supplemental Table 7), and 200 tags were higher in the former smoker
category (Supplemental Table 8). Despite the small sample size in this comparison, many of the
reported smoke induced gene expression changes were captured in our analysis (12, 46).
Classical phase I and phase II xenobiotic metabolizing enzymes known to be induced by
smoking such as subfamilies A and B of cytochrome P450, family 1 (CYP1A1, CYP1B1), and
glutathione S-transferase A2 (GSTA2), as well as antioxidants including glutathione peroxidase 2
(GPX2), thioredoxin (TXN), and sulfiredoxin 1 homolog (SRXN1) (47) were among those
showing the highest differential expression in our current-smoker dataset. Additionally, tags

22
mapping to oxidoreductases (associated with redox balance) including various members of the
aldo-keto reductase family of proteins (AKR1B10, AKR1C2, and AKR1C3), carbonyl reductase 1
(CBR1), alcohol dehydrogenase 7 (ADH7), aldehyde dehydrogenase 3 family, memberA1
(ALDH3A1), and NAD(P)H dehydrogenase, quinone 1 (NQO1), were also detected at higher
levels in the current smoker SAGE dataset relative to the former smoker dataset. Carbonyl
reductase 1 activity mediates inactivation of tobacco-derived carcinogens (48); expression of
NQO1 has been shown in a previous study to be induced by acrolein, a component of cigarette
smoke (49).
Conclusions
In this study, we have deduced the transcriptome of smoke-damaged bronchial epithelium by
analyzing 1,866,725 sequence tags from 19 SAGE libraries, representing one of the largest
human SAGE studies reported to date. We have detected the expression of at least 22,822 genes
in the bronchial epithelium and identified 24,314 sequence tags without matches to known
UniGene Clusters -- cautioning our current understanding of the transcriptome.
Our analysis emphasizes the distinctiveness of the bronchial epithelium from the lung
parenchyma at the gene expression level (Table 2, Fig. 6). Abundantly expressed genes from the
bronchial epithelium dataset are frequently associated with innate defense and protection of the
central airways, while those from the parenchyma dataset are frequently associated with
respiration and humoral immune response.
Additionally, we have identified genes preferentially expressed in bronchial epithelium,
some of which were previously unknown to be expressed in lung._ Many of these genes are also
prominently expressed in testis, where they are associated with flagella-mediated sperm motility,

23
and likely play a role in mucociliary clearance in the lung. It is noted that the majority of tags
most highly enriched in bronchial epithelium (63%) map to undefined transcripts including
chromosomal open reading frames and cDNAs._ Further investigation of these transcripts will
potentially identify additional genes associated with ciliogenesis, and other bronchial-specialized
functions. Furthermore, correlation of bronchial epithelium SAGE profiles to smoking status
identified a list of 349 differentially expressed gene tags. The detection of genes known to be
deregulated by tobacco smoke in this gene list suggests the potential biological relevance of the
genes previously unassociated with smoking.
The expression data of smoke-damaged bronchial epithelium generated in this study is
available as a public resource serving as a baseline for the benefit of future expression studies
pertaining to the bronchial epithelium and lung function. Improvements in tag-to-gene mapping
strategies, in conjunction with this comprehensive dataset, will continue to further our
understanding of the bronchial epithelial transcriptome and molecular biology of the upper
respiratory tract, potentially bringing us closer to the ultimate goal of enhanced understanding
and improved management of lung pathologies, most notably those associated with dysfunctional
cilia.

24
ACKNOWLEDGEMENTS
The author wish to thank Jin-Hee Kim, Shaminder Sandhu, Sandra Henderson, Andrea Pusic,
Sukhinder Atkar-Khattra, George Yang and Jeff Stott for their expert assistance.
Supplemental materials are available online. The following data have been deposited at GEO:
bronchial epithelial and lung parenchyma series of SAGE libraries (GSE3754), profile of
bronchial epithelial (GSE3707), profile of lung parenchyma (GSE3708), sequence of SFTPB
transcript variant 2-short (DQ317589)

25
REFERENCES
1 Boucher RC. New concepts of the pathogenesis of cystic fibrosis lung disease. Eur Respir J 2004;23:146-158
2 Chodhari R, Mitchison HM and Meeks M. Cilia, primary ciliary dyskinesia and molecular genetics. Paediatr Respir Rev 2004;5:69-76
3 Mall M, Grubb BR, Harkema JR, O'Neal WK and Boucher RC. Increased airway epithelial Na+ absorption produces cystic fibrosis-like lung disease in mice. Nat Med 2004;10:487-493
4 Fujii T, Dracheva T, Player A, Chacko S, Clifford R, Strausberg RL, Buetow K, Azumi N, Travis WD and Jen J. A preliminary transcriptome map of non-small cell lung cancer. Cancer Res 2002;62:3340-3346
5 Hibi K, Liu Q, Beaudry GA, Madden SL, Westra WH, Wehage SL, Yang SC, Heitmiller RF, Bertelsen AH, Sidransky D and Jen J. Serial analysis of gene expression in non-small cell lung cancer. Cancer Res 1998;58:5690-5694.
6 Nacht M, Dracheva T, Gao Y, Fujii T, Chen Y, Player A, Akmaev V, Cook B, Dufault M, Zhang M, Zhang W, Guo M, Curran J, Han S, Sidransky D, Buetow K, Madden SL and Jen J. Molecular characteristics of non-small cell lung cancer. Proc Natl Acad Sci USA 2001;98:15203-15208.
7 Ning W, Li CJ, Kaminski N, Feghali-Bostwick CA, Alber SM, Di YP, Otterbein SL, Song R, Hayashi S, Zhou Z, Pinsky DJ, Watkins SC, Pilewski JM, Sciurba FC, Peters DG, Hogg JC and Choi AM. Comprehensive gene expression profiles reveal pathways related to the pathogenesis of chronic obstructive pulmonary disease. Proc Natl Acad Sci U S A 2004;101:14895-14900
8 Powell CA, Spira A, Derti A, DeLisi C, Liu G, Borczuk A, Busch S, Sahasrabudhe S, Chen Y, Sugarbaker D, Bueno R, Richards WG and Brody JS. Gene expression in lung adenocarcinomas of smokers and nonsmokers. Am J Respir Cell Mol Biol 2003;29:157-162
9 Spira A, Beane J, Pinto-Plata V, Kadar A, Liu G, Shah V, Celli B and Brody JS. Gene expression profiling of human lung tissue from smokers with severe emphysema. Am J Respir Cell Mol Biol 2004;31:601-610
10 Vos JB, van Sterkenburg MA, Rabe KF, Schalkwijk J, Hiemstra PS and Datson NA. Transcriptional response of bronchial epithelial cells to Pseudomonas aeruginosa: identification of early mediators of host defense. Physiol Genomics 2005;21:324-336
11 Vos JB, Datson NA, van Kampen AH, Luyf AC, Verhoosel RM, Zeeuwen PL, Olthuis D, Rabe KF, Schalkwijk J and Hiemstra PS. A molecular signature of epithelial host defense: comparative gene expression analysis of cultured bronchial epithelial cells and keratinocytes. BMC Genomics 2006;7:9
12 Spira A, Beane J, Shah V, Liu G, Schembri F, Yang X, Palma J and Brody JS. Effects of cigarette smoke on the human airway epithelial cell transcriptome. Proc Natl Acad Sci U S A 2004;101:10143-10148
13 Velculescu VE, Zhang L, Vogelstein B and Kinzler KW. Serial analysis of gene expression. Science 1995;270:484-487.
14 Lam S, Kennedy T, Unger M, Miller YE, Gelmont D, Rusch V, Gipe B, Howard D, LeRiche JC, Coldman A and Gazdar AF. Localization of bronchial intraepithelial neoplastic lesions by fluorescence bronchoscopy. Chest 1998;113:696-702

26
15 Chomczynski P and Sacchi N. Single-step method of RNA isolation by acid guanidinium thiocyanate phenol-chloroform extraction. Anal. Biochem. 1987;162:156-159
16 Boon K, Osorio EC, Greenhut SF, Schaefer CF, Shoemaker J, Polyak K, Morin PJ, Buetow KH, Strausberg RL, De Souza SJ and Riggins GJ. An anatomy of normal and malignant gene expression. Proc Natl Acad Sci U S A 2002;99:11287-11292
17 Barrett T, Suzek TO, Troup DB, Wilhite SE, Ngau WC, Ledoux P, Rudnev D, Lash AE, Fujibuchi W and Edgar R. NCBI GEO: mining millions of expression profiles--database and tools. Nucleic Acids Res 2005;33:D562-566
18 Ihaka R and Gentleman R. R: A language for data analysis and graphics. Journal of Computational and Graphical Statistics 1996;5:299-314
19 Liang P and Pardee AB. Differential display of eukaryotic messenger RNA by means of the polymerase chain reaction. Science 1992;257:967-971
20 Chen J, Sun M, Lee S, Zhou G, Rowley JD and Wang SM. Identifying novel transcripts and novel genes in the human genome by using novel SAGE tags. Proc Natl Acad Sci U S A 2002;99:12257-12262
21 Thornton DJ and Sheehan JK. From mucins to mucus: toward a more coherent understanding of this essential barrier. Proc Am Thorac Soc 2004;1:54-61
22 Bingle CD and Craven CJ. PLUNC: a novel family of candidate host defence proteins expressed in the upper airways and nasopharynx. Hum Mol Genet 2002;11:937-943
23 Singh G and Katyal SL. Clara cell proteins. Ann N Y Acad Sci 2000;923:43-58 24 Ashcroft GS, Lei K, Jin W, Longenecker G, Kulkarni AB, Greenwell-Wild T, Hale-Donze H,
McGrady G, Song XY and Wahl SM. Secretory leukocyte protease inhibitor mediates non-redundant functions necessary for normal wound healing. Nat Med 2000;6:1147-1153
25 Sallenave JM. Antimicrobial activity of antiproteinases. Biochem Soc Trans 2002;30:111-115
26 Johansson J and Curstedt T. Molecular structures and interactions of pulmonary surfactant components. Eur J Biochem 1997;244:675-693
27 Wright JR. Immunoregulatory functions of surfactant proteins. Nat Rev Immunol 2005;5:58-68
28 Brasch F, Ochs M, Kahne T, Guttentag S, Schauer-Vukasinovic V, Derrick M, Johnen G, Kapp N, Muller KM, Richter J, Giller T, Hawgood S and Buhling F. Involvement of napsin A in the C- and N-terminal processing of surfactant protein B in type-II pneumocytes of the human lung. J Biol Chem 2003;278:49006-49014
29 Peri A, Cordella-Miele E, Miele L and Mukherjee AB. Tissue-specific expression of the gene coding for human Clara cell 10-kD protein, a phospholipase A2-inhibitory protein. J Clin Invest 1993;92:2099-2109
30 Melman YF, Um SY, Krumerman A, Kagan A and McDonald TV. KCNE1 binds to the KCNQ1 pore to regulate potassium channel activity. Neuron 2004;42:927-937
31 Yang WP, Levesque PC, Little WA, Conder ML, Shalaby FY and Blanar MA. KvLQT1, a voltage-gated potassium channel responsible for human cardiac arrhythmias. Proc Natl Acad Sci U S A 1997;94:4017-4021
32 Prades C, Arnould I, Annilo T, Shulenin S, Chen ZQ, Orosco L, Triunfol M, Devaud C, Maintoux-Larois C, Lafargue C, Lemoine C, Denefle P, Rosier M and Dean M. The human ATP binding cassette gene ABCA13, located on chromosome 7p12.3, encodes a

27
5058 amino acid protein with an extracellular domain encoded in part by a 4.8-kb conserved exon. Cytogenet Genome Res 2002;98:160-168
33 Liang Y and Tedder TF. Identification of a CD20-, FcepsilonRIbeta-, and HTm4-related gene family: sixteen new MS4A family members expressed in human and mouse. Genomics 2001;72:119-127
34 Adra CN, Mao XQ, Kawada H, Gao PS, Korzycka B, Donate JL, Shaldon SR, Coull P, Dubowitz M, Enomoto T, Ozawa A, Syed SA, Horiuchi T, Khaeraja R, Khan R, Lin SR, Flinter F, Beales P, Hagihara A, Inoko H, Shirakawa T and Hopkin JM. Chromosome 11q13 and atopic asthma. Clin Genet 1999;55:431-437
35 Inaba K. Molecular architecture of the sperm flagella: molecules for motility and signaling. Zoolog Sci 2003;20:1043-1056
36 Neilson LI, Schneider PA, Van Deerlin PG, Kiriakidou M, Driscoll DA, Pellegrini MC, Millinder S, Yamamoto KK, French CK and Strauss JF, 3rd. cDNA cloning and characterization of a human sperm antigen (SPAG6) with homology to the product of the Chlamydomonas PF16 locus. Genomics 1999;60:272-280
37 Sapiro R, Kostetskii I, Olds-Clarke P, Gerton GL, Radice GL and Strauss IJ. Male infertility, impaired sperm motility, and hydrocephalus in mice deficient in sperm-associated antigen 6. Mol Cell Biol 2002;22:6298-6305
38 Carr DW, Fujita A, Stentz CL, Liberty GA, Olson GE and Narumiya S. Identification of sperm-specific proteins that interact with A-kinase anchoring proteins in a manner similar to the type II regulatory subunit of PKA. J Biol Chem 2001;276:17332-17338
39 You Y, Huang T, Richer EJ, Schmidt JE, Zabner J, Borok Z and Brody SL. Role of f-box factor foxj1 in differentiation of ciliated airway epithelial cells. Am J Physiol Lung Cell Mol Physiol 2004;286:L650-657
40 Ostrowski LE, Blackburn K, Radde KM, Moyer MB, Schlatzer DM, Moseley A and Boucher RC. A proteomic analysis of human cilia: identification of novel components. Mol Cell Proteomics 2002;1:451-465
41 Nakamura K, Iitsuka K and Fujii T. Adenylate kinase is tightly bound to axonemes of Tetrahymena cilia. Comp Biochem Physiol B Biochem Mol Biol 1999;124:195-199
42 Pullen TJ, Ginger ML, Gaskell SJ and Gull K. Protein targeting of an unusual, evolutionarily conserved adenylate kinase to a eukaryotic flagellum. Mol Biol Cell 2004;15:3257-3265
43 Zhang H and Mitchell DR. Cpc1, a Chlamydomonas central pair protein with an adenylate kinase domain. J Cell Sci 2004;117:4179-4188
44 Yang P and Sale WS. The Mr 140,000 intermediate chain of Chlamydomonas flagellar inner arm dynein is a WD-repeat protein implicated in dynein arm anchoring. Mol Biol Cell 1998;9:3335-3349
45 Zhang Z, Futamura M, Vikis HG, Wang M, Li J, Wang Y, Guan KL and You M. Positional cloning of the major quantitative trait locus underlying lung tumor susceptibility in mice. Proc Natl Acad Sci U S A 2003;100:12642-12647
46 Hackett NR, Heguy A, Harvey BG, O'Connor TP, Luettich K, Flieder DB, Kaplan R and Crystal RG. Variability of antioxidant-related gene expression in the airway epithelium of cigarette smokers. Am J Respir Cell Mol Biol 2003;29:331-343
47 Jonsson TJ, Murray MS, Johnson LC, Poole LB and Lowther WT. Structural basis for the retroreduction of inactivated peroxiredoxins by human sulfiredoxin. Biochemistry 2005;44:8634-8642

28
48 Finckh C, Atalla A, Nagel G, Stinner B and Maser E. Expression and NNK reducing activities of carbonyl reductase and 11beta-hydroxysteroid dehydrogenase type 1 in human lung. Chem Biol Interact 2001;130-132:761-773
49 Tirumalai R, Rajesh Kumar T, Mai KH and Biswal S. Acrolein causes transcriptional induction of phase II genes by activation of Nrf2 in human lung type II epithelial (A549) cells. Toxicol Lett 2002;132:27-36

29
Table 1. Summary of SAGE libraries generated in this study
Lung Library Age Smoking Status4
Pack Years Sex Tags Sequenced1 Unique
Tags Bronchial Epithelium
BE-1 68 CS 81 M 81,964 23,987 BE-2 64 CS 45 M 123,995 32,808 BE-3 68 FS 33 M 61,701 20,935
BE-4A 69 FS 100 M 114,669 31,731 BE-4B 69 FS 100 M 107,726 31,343 BE-5 70 FS 75 M 82,048 23,680 BE-6 67 FS 55 M 91,571 27,931 BE-7 56 CS 62 M 81,309 23,275
BE-8A 72 FS 63 M 83,683 25,546 BE-8B 72 FS 63 M 80,057 23,343 BE-9 68 FS 30 M 79,218 24,975
BE-10 65 FS 82 M 86,725 26,843 BE-11A 56 FS 64 F 89,622 26,280 BE-11B 56 FS 64 F 92,950 27,719 BE-12 63 CS 44 F 88,186 26,010 BE-13 63 CS 40 F 91,425 26,327 BE-14 63 FS 45 F 155,462 38,184 BE-15 72 FS 40 M 143,129 36,802 BE-16 71 FS 56 F 131,285 34,664
Sum =1,866,725 182,5282 Lung Parenchyma Pools
LP-1 54, 64, 75, 84 -- 1M/3F 66,214 17,846 LP-2 65, 69, 74, 77 -- 4 M 64,434 20,003
Sum =130,648 30,6823 Total libraries = 21 Total tags = 1,997,373
1Excluding duplicate ditags; 280,183 excluding singletons; 310,052 excluding singletons; 4CS, current smoker; FS, former smoker 19 bronchial epithelium libraries (BE-1 through BE-16; constructed from bronchial brushing specimens acquired from 16 individuals), and two lung parenchyma libraries (LP-1, LP-2; constructed from specimens acquired from two pools of four individuals each) were generated and sequenced to a minimum of 60,000 tags each. Libraries BE-4A/4B were generated from the same tissue lysate to evaluate the repeatability of SAGE; libraries BE-8A/8B and BE-11A/11B were generated from repeated brushings acquired from the same individual to evaluate the reproducibility of bronchial brushings at the gene expression level. Unique tags are defined by the 10 bp nucleotide sequence, and represent the maximum number of unique transcripts present within the respective SAGE dataset. Singletons are defined as sequence tags having a raw tag count of one in the corresponding SAGE dataset. All subjects contributing to both the bronchial epithelial and the lung parenchymal datasets were either former or current smokers. The SAGE profiles for all 21 libraries have been deposited in the GEO database under GenBank accession number GSE3754.

30
Table 2. Normalized tag counts expressed as tags per million (TPM), are presented for the most abundant, unique tags mapping to nuclear-encoded (non-ribosomal) transcripts from the average of the 19 bronchial epithelial libraries constructed from specimens acquired from 16 individuals (BE), and from the average of the two lung parenchyma libraries, constructed from 2 pools of 4 individuals each (LP).
Tag Gene Symbol+ Gene Name Abundance
(TPM) Expression
Ratio Bronchial Epithelial Enriched BE LP BE/LP CTTTGAGTCC SCGB1A1 Secretoglobin, family 1A, member 1 39155 3426 11 CCTATCAGTA MSMB Microseminoprotein, beta 7262 38 191 GTTGTGGTTA B2M Beta-2-microglobulin 6047 5774 1 TAGGTTGTCT TPT1 Tumor protein, translationally-controlled 1 4356 5506 0.8 GTTCACATTA CD74 CD74 antigen 3613 12829 0.3 AAGCTCGCCG SCGB3A1 Secretoglobin, family 3A, member 1 3386 185 18 TTGGGGTTTC FTH1 Ferritin, heavy polypeptide 1 3313 6259 0.5 TGTGGGAAAT SLPI Secretory leukocyte protease inhibitor 2884 743 3.9 CTCCACCCGA TFF3 Trefoil factor 3 (intestinal) 2789 91 31 CTGTACAGAC TUBB2 Tubulin, beta, 2 2523 398 6.3 TGTGTTGAGA EEF1A1 Eukaryotic translation elongation factor 1α1 2503 1822 1.4 CCAAGGTGGC LPLUNC1 Long palate, lung & nasal epithelium carcinoma associated-1 2449 38 64 GTGATCAGCT MUC5B* Mucin 5B (tracheobronchial) 2116 30 70 GAAATACAGT NT5C* 5',3'-nucleotidase, cytosolic 1950 5357 0.4 GCTAACCCCT CGI-38 Brain specific protein 1810 138 13 CTGACCAGAG CAPS Calcyphosine 1789 84 21 TTCACTGTGA LGALS3 Galectin 3 1751 1274 1.4 ATTTTCTAAA AGR2 Anterior gradient 2 homolog (X. laevis) 1678 46 36 GAAAAATGGT LAMR1 Laminin Rc1 (ribosomal protein SA) 1662 2842 0.6 AATGCTTTGT TUBA3 Tubulin, alpha 3 1524 753 2 CAATTAAAAG XBP1 X-box binding protein 1 1486 935 1.6 Lung Parenchymal Enriched BE LP LP/BE CTCCCAGCCA SFTPA2* Surfactant, pulmonary-associated protein A2 1041 20330 19 GTTCACATTA CD74 CD74 antigen 3613 12829 3.5 GAAATAAAGC IGHG1* Immunoglobulin heavy constant gamma 1 132 8946 68 GCCGTGAGCA SFTPC* Surfactant, pulmonary-associated protein C 329 7435 23 TTGGGGTTTC FTH1 Ferritin, heavy polypeptide 1 3313 6259 1.9 GCCGTGAACA SFTPC Surfactant, pulmonary-associated protein C 354 5932 17 GTTGTGGTTA B2M Beta-2-microglobulin 6047 5774 0.9 TAGGTTGTCT TPT1 Tumor protein, translationally-controlled 1 4356 5506 1.3 GAAATACAGT NT5C* 5',3'-nucleotidase, cytosolic 1950 5357 2.7 CGCAGCGGGT NAPSA Napsin A aspartic peptidase 140 4315 31 GGGCATCTCT HLA-DRA MHC complex, class II, DR alpha 916 4144 4.5 TTGGTGAAGG TMSB4X Thymosin, beta 4, X-linked 904 3702 4.1 CTTTGAGTCC SCGB1A1 Secretoglobin, family 1A, member 1 39155 3426 0.1 AAGGGAGCAC IGLC2 Immunoglobulin lambda joining 3 46 3155 69 GAAAAATGGT LAMR1 Laminin receptor 1 (ribosomal protein SA) 1662 2842 1.7 CCCTGGGTTC FTL Ferritin, light polypeptide 722 2794 3.9 CTGACCTGTG HLA-B* Major histocompatibility complex, class I, B 552 2488 4.5 GTGCACTGAG HLA-A* Major histocompatibility complex, class I, A 823 2428 2.9 TGGCCCCAGG APOC1 Apolipoprotein C-I 302 2239 7.4 AGGACACCAA SFTPB* surfactant, pulmonary-associated protein B 110 2201 20 ATGTGAAGAG SPARC Secreted protein, acidic, cysteine-rich 37 2123 57 AGCACCTCCA EEF2 Eukaryotic translation elongation factor 2 1088 2074 1.9 GGATATGTGG EGR1 Early growth response 1 127 2027 16 GTGCTGAATG MYL6 Myosin, light polypeptide 6, alkali, smooth muscle & non-muscle 800 1993 2.5 TTAACCCCTC RNASE1 Ribonuclease, RNase A family, 1 101 1901 19
*Possibility of alternate tag-to-gene mapping noted. +Tag-to-gene mapping was according to SAGE Genie, Aug., 2005, with reference to SAGEmap.

31
Table 3. Thirty out of the top ranking 100 bronchial-enriched tags with mapping reliabilities to defined transcripts of 70 % or greater, and six bronchial-enriched tags mapping to hypothetical proteins are described. Selected genes were evaluated for tissue-specific expression by RT-PCR using gene-specific primers.
Tag Gene Symbol+ SDAdj Ratio#
Expression in Tissue Types* Gene Name
CTTTGAGTCC SCGB1A1 16587 (Brc, Lg), Pr, Pc Secretoglobin, 1A1 TCCAAGTCCG MDAC1 296 Brc, T, Lg MDAC1 GATAGTGTGG TUBA4 176 Brc, multiple Tubulin, alpha 4 CCAAGGGAAT ZMYND10 (Blu) 164 T, Brc, Lg, Pc Zinc finger, with MYND domain 10 CCAAGGTGGC LPLUNC1 150 ND Long palate, lung and nasal carcinoma-associated 1 CAAGACCAGT GSTA2 139 (Lv, K, Pc), multiple Glutathione S-transferase A2 AAAGTTATTT FOXJ1 91 ND Forkhead box J1 CAGAGCGAAC LRRC48 80 ND Leucine rich repeat containing 48 TGATAAGATG ARMC4 68 T, Brc, (Lg, Pr) Armadillo repeat containing 4 ATAAACATTT LRRC50 68 ND Leucine rich repeat containing 50 ATCGACCCTC DNAI2 55 T, Brc, Lg Dynein, axonemal, intermed. polypeptide 2 TGAGCTTGTG MS4A8B 54 Brc, Lg Membrane-spanning 4-domains, A8B TTCCATCCAG ARMC3 51 T, Brc, (Lg, Pc) Armadillo repeat containing 3 CTGGCCGGCC TRIB3 50 ND Tribbles homolog 3 (Drosphilia) GAGGATTCCA SKB1 49 ND SKB1 homolog (S. pombe) GTGAAAGACA CASC1 47 T, Brc, (Lg, K, Pc) Cancer susceptibility candidate 1 GTTATGGCTG CYP4B1 47 ND Cytochrome P450, 4B1 GTGATCAGCT MUC5B 46 Brc, Lg Mucin 5B, tracheobronchial CATTTTTACT SPAG6 42 T, Brc, (Pr, Lg), Pc Sperm associated antigen 6 ACTTGTTATC AK7 36 Brc, T, multiple Adenylate kinase 7 AAATTATATT ZNF214 35 (multiple) Zinc finger protein 214 ATAGGTCTTT ASP (ROPN1L) 32 T, Brc, multiple AKAP-associated sperm protein TGATTCTGAA ZNF140 32 Pc, (Lv, Pr), multiple Zinc finger protein 140
TACTGTTCTA KCNE1 30 Brc, (multiple) Potassium voltage-gated channel, Isk-related family, member 1
CTGAACATAT NYD-SP29 28 T, Brc Testis development protein NYD-SP29 TGTTATTTGA SPAG16 28 Brc, Pc, Pr, multiple Sperm associated antigen 16 CAGTCTGATT LRRC46 26 ND Leucine rich repeat containing 46 CTGACCAGAG CAPS 24 Brc, (Pc, Pr), multiple Calcyphosine AATGTGTTTA ABCA13 24 Brc, (T, Pc, Lg) ATP binding cassette gene, A13 TTCTGACATT CCDC17 22 ND Coiled-coil domain containing 17 CTTCTGAGGG C9orf117 95 (Brc, Lg, T) Chromosome 9 ORF 117 ATTTTCCTGT DKFZp434I099 82 T, Brc, Lg, Pc, (K, Lv) Hypothetical protein ATTGTAAAGA FLJ40919 53 Brc, Lg, H Hypothetical protein GTCTATAAAG MGC48998 47 Brc, Lg Hypothetical protein GCATTCTTCC FLJ32884 42 T, Brc, Lg Hypothetical protein ATTAGTTTCT C6orf118 36 Brc, T, Lg, (K, Pr) Chromosome 6 ORF 118
+Tag-to-gene mapping was according to SAGE Genie, Aug., 2005, with reference to SAGEmap #SDAdjRatio = (bronchial mean - bronchial SD) / (non-lung mean + non-lung SD) *Listed in descending order of signal intensity after 30 cycles of PCR (see Fig. 6), except with
equal intensities given in parenthesis. Expression detected in 5 or more tissue types is indicated as “multiple”. (Brc, bronchus; H, heart; Bn, brain; Pl, placenta; Lg, lung; Lv, liver; M, muscle; K, kidney; Pc, pancreas; Sp, spleen; Ty, thymus; Pr, prostate; T, testies; Ov, ovary; Int, intestine; C, colon; Lk, leukocyte)

32
FIGURE LEGENDS
Figure 1. Number of expressed genes detected within the bronchial epithelium by SAGE.
Singleton tags are defined as sequence tags having a raw tag count of one within the entire
bronchial epithelial SAGE dataset. Tag-to-gene mapping was per SAGE Genie, Oct., 2004.
Non-annotated refers to no associated Gene Symbol assigned to the mapping.
Figure 2. Relatedness of bronchial epithelial SAGE libraries (BE-1 through BE-16) and lung
parenchymal SAGE libraries (LP-1, LP-2). All 21 SAGE libraries generated in this study, along
with 14 libraries from the GEO data repository at SAGEmap, were analyzed by cluster analysis
using a single-link hierarchical algorithm. In the resultant dendrogram, branch length (height)
represents distance. SAGE libraries retrieved for analysis from the GEO data resposiory at
SAGEmap include:
676_NT_Brain_M; 677_NT_Breast_LuminarMammaryEpithelium_BerEp4;
685_NT_Prostate_M; 695_NT_Brain_Cerebellum; 728_NT_ColonicEpithelium1;
729_NT_ColonicEpithelium2; 739_NT_Prostate_M;
760_NT_LuminarMammaryEpitheliumAntibodyPurified_F; 761_NT_Cerebellum_F;
763_NT_Brain_Pooled_M; 780_NT_Breast_GestationalHyperplasia_F;
781_NT_Breast_Myoepithelial_F; 786_NT_Brain_PediatricFrontalCortex_M; 762_Lung.
33
Figure 3. Pie chart depicting tag-to-gene mapping classifications of the 50 most abundant,
unique tags from A). the average of the 19 bronchial epithelial SAGE libraries, and B). the
average of the two lung parenchymal SAGE libraries. Data in A corresponds with that presented
in Supplemental Table 3; data in B corresponds with that presented in Supplemental Table 4.
Tag-to-gene mapping was per SAGE Genie, Aug., 2005, with reference to SAGEmap.
Repetitive tags map with equally high reliabilities to multiple transcripts, which presumably
contribute to the cumulative tag counts

34
Figure 4. Expression analysis of SFTPB transcript variant 2-short. A, cDNA sequence of
SFTPB transcript variant 2-short. Nucleotide positions of the 3’-UTR, the SAGE tag, the
putative poly (A)+-addition signal, and the positions of probes used for hybridizations, are
indicated. It is noted that the entire sequence presented here is contained within GenBank
accession number NM_198843 (SFTPB transcript variant 2), spanning nts 18-1772, but with
several nucleotide differences identified (GenBank accession number DQ317589). Linear
representation comparing SFTPB transcript variant 2 (NM_198843) and SFTPB transcript
variant 2-short (DQ317589) is shown below. SAGE tag position refers to the location of the
NlaIII site relative to the 3’-terminus of the given transcript, as defined by SAGEGenie
nomenclature. B, Northern hybridization of SFTPB transcript variant 2-short in lung. Two
hybridizing species are detected in normal lung parenchyma by the 3’-UTR probe (see above),
measuring roughly 2.6 and 1.9 kb in length (lanes 1 and 2, filled-in arrows). Hybridization of
the same blot to a probe specific to the coding region of SFTPB (see A above), detects two
species within the 1.5 to 2 kb size-range, but without detection of the 2.6 kb species detected by
the 3’-UTR oligonucleotide probe (lanes 3 and 4, open arrows). Migration positions for the 28S
and 18S ribosomal RNAs are indicated by the open arrow-heads on the left. C, Tissue dot blot
illustrating expression of SFTPB transcript variant 2-short specific to lung (F2) and fetal lung
(G7). Oligonucleotide 3’-UTR was used as hybridization probe; thus hybridizing signals reflect
expression of two species (as shown in B).

35
Figure 5. Tag-to-gene mapping classifications of the top ranking 100 bronchial-enriched SAGE
tags. Data here corresponds with that presented in Supplemental Table 5. Tag-to-gene mapping
was per SAGE Genie, Aug., 2005. In addition to the non-lung libraries used in the cluster
analysis, the following libraries retrieved from the GEO data repository at SAGEmap were
included for identification of bronchial-enriched genes: 708_NT_Kidney_F;
709_NT_Leukocyte_F; 727_NT_Skin_PrimaryMesothelioma;
738_NT_Peritoneum_Mesothelial; 785_NT_Liver_M; 1499_NT_Heart_M;
2386_NT_SpinalCord.
Figure 6. RT-PCR verification of bronchial-enriched expression. Select genes presented in
Table 3 were evaluated experimentally for bronchial-enriched expression. Gene-specific PCR
products generated from cDNA representing 17 tissue types (15 non-lung) are presented above.
Amplicon length was typically 100 to 200 bp. RT-PCR from beta-actin (ACTB) specific primers
was used as a loading control. Minus-RT controls using bronchial epithelial cDNA as template
were negative for PCR product (not shown). These data are summarized in Table 3. To verify
differential expression between bronchial epithelium and lung parenchyma, three genes were
selected for real-time quantitative RT-PCR analysis (indicated by asterisks), Differential
expression for all three genes were confirmed at a p-value of less than 0.001 by Mann-Whitney
U-Test (Supplemental Table 6). Brc, bronchus; H, heart; Bn, brain; Pl, placenta; Lg, lung; Lv,
liver; M, muscle; K, kidney; Pc, pancreas; Sp, spleen; Ty, thymus; Pr, prostate; T, testies; Ov,
ovary; Int, intestine; C, colon; Lk, leukocyte.

1.9 x 10⁶ tags sequenced
1.9 x 10⁶ tags sequenced
19 bronchial epithelium SAGE
libraries
19 bronchial epithelium SAGE
libraries
80,183 unique tags (excl.
singleton tags)
80,183 unique tags (excl.
singleton tags)
24,314 tags without UniGene identifiers24,314 tags without UniGene identifiers
55,869 tags with UniGene identifiers
55,869 tags with UniGene identifiers
22,822 unique UniGeneclusters
22,822 unique UniGeneclusters
15,680 with annotation15,680 with annotation
7,142 without annotation
7,142 without annotation
Collapse multiple tags to gene
Figure 1

Brea
st78
1Pr
osta
te73
9Pr
osta
te 6
85Br
east
780
Brea
st 6
77Br
east
760
Lung
762
NLP
-1N
LP-2
Col
on72
8C
olon
729
Brai
n761
Brai
n786
Brai
n695
Brai
n676
Brai
n763
BE-8
ABE
-4A
BE-4
BBE
-13
BE-2
BE-1
BE-1
2BE
-7BE
-10
BE-9
BE-3
BE-5
BE-1
1ABE
-6BE
-11B
BE-1
4BE
-15
BE-8
BBE
-160.
00.
10.
20.
30.
40.
00.
10.
20.
30.
4
Heig
ht
SAGE Libraries
Figure 2

A B
mitochondrial -encodedribosomal proteinsnuclear -encoded (non -ribosomal)repetitiveambiguous
mitochondrial -encodedribosomal proteinsnuclear -encoded (non -ribosomal)repetitiveambiguous
Figure 3

B C
Figure 4
A
SFTPB transcript variant 2 (NM_198843)
SFTPB transcript variant 2-short (DQ317589)
5’
5’
3’
3’
Coding sequence
SAGE tag position 1 in NM_198843
SAGE tag position 2 in NM_198843
SAGE tag position 3 in NM_198843
Hybridization probes
and position 1 in DQ317589

no matchcDNA/transcribed lociHypothetical proteins/ORF/KIAA proteins≥ 70% mapping reliability to defined transcripts< 70% mapping reliability to defined transcripts
Figure 5

Brc H Bn Pl Lg Lv M K Pc Sp Ty Pr T Ov Int C Lk
C6ORF118
C9ORF117
DKFZp4341099
FLJ32884
FLJ40919
MGC48998
ABCA13
ACTB
ARMC4
AK7
ASP
CAPS
CASC1
DNAI2
GSTA2
KCNE1
*MDAC1
MS4A8B
MSMB
MUC5
NYD-SP29
SPAG16-related
SCGB1A1
SPAG6
TUB4A
ZNF140
ZNF214
*ARMC3
*Blu
Figure 6

42
Identification of novel lung genes in bronchial epithelium by serial analysis of gene expression
Kim M. Lonergan*1, Raj Chari1, Ronald J. deLeeuw1, Ashleen Shadeo1, Bryan Chi1, Ming-Sound Tsao2, Steven Jones3, Marco Marra3, Victor Ling1, Raymond Ng1,4,
Calum MacAulay5, Stephen Lam5 and Wan L. Lam1
1Cancer Genetics & Developmental Biology, 5Department of Cancer Imaging, 3Canada's Michael Smith Genome Sciences Centre, British Columbia Cancer Research Centre, Vancouver,
BC, Canada, 2Ontario Cancer Institute / Princess Margaret Hospital, Toronto, ON, Canada, 4Computer Science, University of British Columbia, Vancouver, BC, Canada
Running Title: Bronchial epithelium gene expression profiles
Funding: This work was supported by funds from Genome Canada/Genome British Columbia and the National Cancer Institute of Canada.
*Correspondence: Kim Lonergan
British Columbia Cancer Research Centre 675 West 10th Avenue, Vancouver, BC
Canada V5Z 1L3 Tel. 604-675-8111 Fax. 604-675-8232
E-mail: [email protected]
JPorteus
ONLINE DATA SUPPLEMENT
43
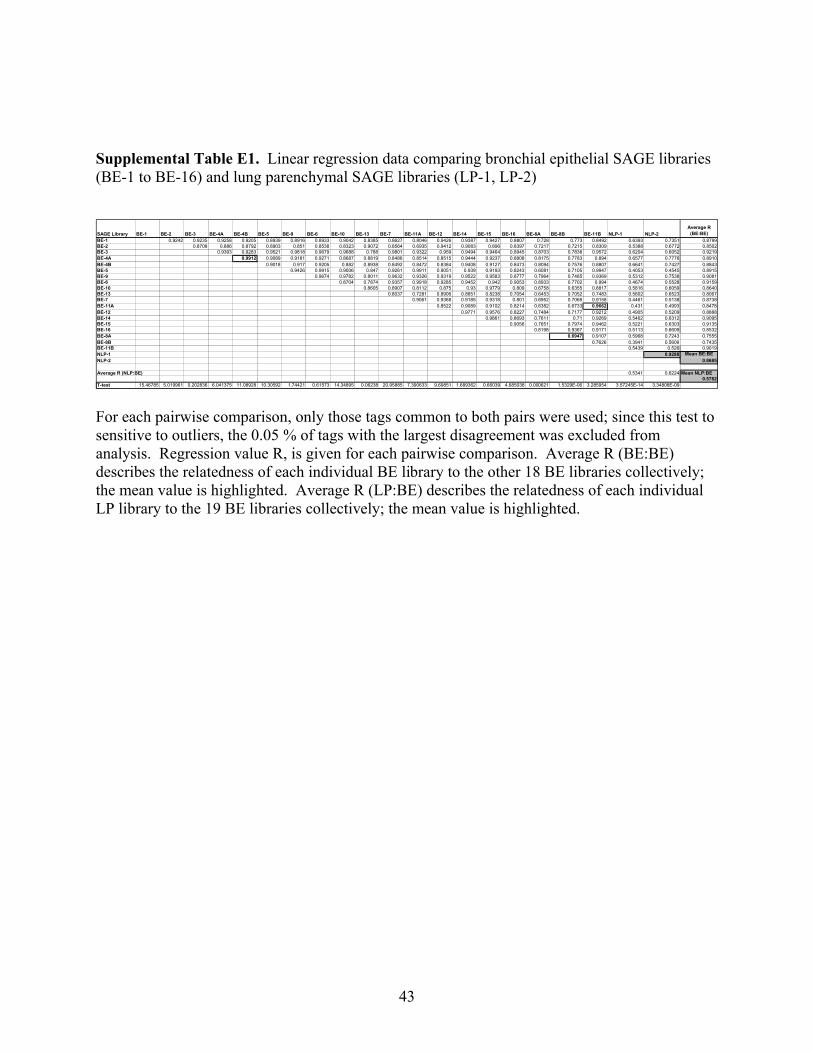
Supplemental Table E1. Linear regression data comparing bronchial epithelial SAGE libraries (BE-1 to BE-16) and lung parenchymal SAGE libraries (LP-1, LP-2) SAGE Library BE-1 BE-2 BE-3 BE-4A BE-4B BE-5 BE-9 BE-6 BE-10 BE-13 BE-7 BE-11A BE-12 BE-14 BE-15 BE-16 BE-8A BE-8B BE-11B NLP-1 NLP-2
Average R (BE:BE)
BE-1 0.9242 0.9235 0.9258 0.9205 0.8939 0.8916 0.8933 0.9042 0.8385 0.8627 0.8046 0.9426 0.9387 0.9427 0.8807 0.728 0.773 0.8492 0.6393 0.7351 0.8799BE-2 0.8708 0.886 0.8792 0.8903 0.851 0.8538 0.8323 0.9072 0.8564 0.6935 0.9412 0.9083 0.896 0.8397 0.7217 0.7215 0.8309 0.5388 0.6772 0.8502BE-3 0.9393 0.9283 0.9521 0.9818 0.9679 0.9688 0.788 0.9801 0.9322 0.959 0.9494 0.9464 0.8945 0.8703 0.7838 0.9572 0.6204 0.6052 0.9219BE-4A 0.9912 0.9089 0.9181 0.9271 0.8687 0.8819 0.8486 0.8514 0.8515 0.9444 0.9237 0.8808 0.8175 0.7783 0.894 0.6577 0.7776 0.8910BE-4B 0.9018 0.917 0.9205 0.882 0.8938 0.8492 0.8472 0.8384 0.9408 0.9127 0.8473 0.8094 0.7576 0.8807 0.6641 0.7427 0.8843BE-5 0.9426 0.9915 0.9006 0.847 0.9261 0.9911 0.9051 0.939 0.9193 0.8243 0.6081 0.7105 0.9947 0.4053 0.4545 0.8915BE-9 0.9674 0.9782 0.8011 0.9632 0.9326 0.9319 0.9522 0.9583 0.8777 0.7964 0.7485 0.9369 0.5312 0.7538 0.9081BE-6 0.8704 0.7874 0.9357 0.9918 0.9285 0.9452 0.942 0.9053 0.8933 0.7702 0.994 0.4674 0.5528 0.9159BE-10 0.8605 0.8907 0.8112 0.875 0.93 0.9779 0.809 0.6758 0.6355 0.8817 0.5816 0.6059 0.8640BE-13 0.8037 0.7281 0.8906 0.8651 0.8238 0.7054 0.6453 0.7052 0.7483 0.5602 0.6523 0.8067BE-7 0.9061 0.9368 0.9185 0.9318 0.801 0.6952 0.7068 0.9158 0.4461 0.5138 0.8738BE-11A 0.8522 0.9089 0.9102 0.8214 0.6382 0.6733 0.9662 0.431 0.4993 0.8478BE-12 0.9771 0.9576 0.8227 0.7484 0.7177 0.9212 0.4905 0.5209 0.8888BE-14 0.9861 0.8693 0.7611 0.71 0.9269 0.5462 0.6312 0.9095BE-15 0.9056 0.7651 0.7974 0.9462 0.5221 0.6303 0.9135BE-16 0.8198 0.9367 0.9171 0.5113 0.6609 0.8532BE-8A 0.6947 0.9107 0.5968 0.7243 0.7555BE-8B 0.7626 0.3941 0.5609 0.7435BE-11B 0.5439 0.526 0.9019NLP-1 0.9288 Mean BE:BENLP-2 0.8685
Average R (NLP:BE) 0.5341 0.6224 Mean NLP:BE 0.5782T-test 15.46785 5.019961 0.202836 6.041375 11.08928 10.30592 1.74421 0.61573 14.34895 0.06238 20.95885 7.390633 9.69851 1.689362 0.66039 4.685038 0.000621 1.5329E-06 3.285954 3.57245E-14 3.34808E-09 For each pairwise comparison, only those tags common to both pairs were used; since this test to sensitive to outliers, the 0.05 % of tags with the largest disagreement was excluded from analysis. Regression value R, is given for each pairwise comparison. Average R (BE:BE) describes the relatedness of each individual BE library to the other 18 BE libraries collectively; the mean value is highlighted. Average R (LP:BE) describes the relatedness of each individual LP library to the 19 BE libraries collectively; the mean value is highlighted.

44
Supplemental Table E2. Nucleotide sequence of gene-specific oligonucleotide primers used for validation of bronchial-enriched expression by RT-PCR
Gene Symbol Genbank Accession Number
Forward Primer (5' to 3') Reverse Primer (5' to 3') Amplicon length (bp)
ABCA13 NM_152701 CCAGTCAGACATTTCTGAGTTCAG CCGGTACTCAACGTTAGTGTTG 131
ACTB X00351 J00074 M10278
GTCCACCGCAAATGCTTC CCATGCCAATCTCATCTTG 100
AK7 NM_152327 GTGCATAGCTCATGAGACAAATAC GGGGCGATAACAAGTCATG 179
ARMC3 NM_173081 GGCTCTGGCTGATAGAATTG CGTCTGATGGCTTAAATGAATC 222
ARMC4 NM_018076 GAAGCTGCAGCTGGTTGTATAT GGGAGTGACATGTCCTGTGT 130
ASP BC014607 CCGCTACTTGGCCAGATTAG GACCTATCATGCCGTTCTTC 107
Blu NM_015896 CCCTGAACCTCAAGATCAC CAGGAAGTCTCGAGCCTT 130
C6orf118 BC026278 GGCCAGTGGAAATTCTTAACTTC GCAGCGCTGAATTCCTTATTC 291
C9orf117 AL833241 TCGTGTTGCCAACTGTTTG CTCCCAACCGAAGGTCAAG 200
CAPS NM_004058 CTGGACAACTTCGACTCCTCT ATGGCCACGAACTCCTCAT 113
CASC1 NM_018272 CTGAGGAAGCAATGGAGAAAG GAGGTTAGGAGTAGCTGAGCAATC 102
DKFZp4341099 BC036667 GCCTCAATCGACACAAGGAAC GAGGCCAGGTGTCTGTGTAAAC 218
DNAI2 NM_023036 CCTCAACCAGACTTGCAT GCCTGGAAAGGTATTTTCA 145
FLJ32884 BC033790 GCCACAGTGCAGTATCAGATG CCTCATCCTCCCTGAGTTTG 181
FLJ40919 NM_182508 CACCATGAGCCAGCAATTC GACACATGAGCTGACACCATATG 250
GSTA2 NM_000846 CCAGCCATAGAGGTCAAGAA AGCTTCACAACAGGCACAAT 97
KCNE1 BC036452 GAGATCCCTATGGCGTTAGTCTTC CATGGTGCATAGCAAAGACTCTG 208
MDAC1 NM_139172 GTCCGTGTGACATGTCCAAG CCACATCCCTGGACTCTTTG 114
MGC48998 BC040018 GGAGAGGAAGAATGAATCTTCTG GTCCCTGAAAGCAAGACTGTTAC 121
MS4A8B NM_031457 CCTAGGGCACATGCATCA TCCTCTAACCCACAAGCTCA 103
MSMB NM_002443 CACCTGTGGGTTATGACAAAG GGCATGGCTACACAATCATTG 205
MUC5 U06711 CACCTGAGGGTCTCAGGAAT CAACAGATTGGCCGTGTACT 129
NYD-SP29 AY049724 GGCCTAATCAAAGTCACAGAGA CATGCCAGTTCACCTGACATA 119
DKFZp666P1710 (SPAG16-related) AL832962 GGCACTTCTTTGGCCTCTATC CTGGAGGACCTAGACAAAGCAC 469
SCGB1A1 NM_003357 GCCCAGAGAAAGCATCATTAAG GCGTGGACTCAAAGCATG 125
SPAG6 NM_012443 GATCCTTGTCCTAACGTCACTTTC ACCCTCTTTCACCCGTTTAC 140
TUB4A NM_025019 CGCCTGGACCACAAGTTTG CATGCCCACCTCCTTGTAATC 144
ZNF140 NM_003440 CCTCATTCCGCATCTGTCAAC GGCATTCCCAAATCACTGTG 131
ZNF214 NM_013249 CTGGTTGGCCAACTGTTAAAC GGTGGCTTTTGTCCATAAAC 138

45
Supplemental Table E3. Normalized tag counts expressed as tags per million (TPM), reflect relative transcript levels corresponding to the 50 most abundant, unique tags from the average of the 19 bronchial epithelial libraries, constructed from specimens acquired from 16 individuals. Tag-to-gene mapping was per SAGE Genie, Aug., 2005, with reference to SAGEmap.
Tag Gene Symbol Gene Name Abundance (TPM) CTTTGAGTCC SCGB1A1 secretoglobin, family 1A, member 1 39155 ACTTTTTCAA tRNA transfer RNA (mitochondrial) 12774 CCTATCAGTA MSMB microseminoprotein, beta- 7262 TTCATACACC NADH4 NADH dehydrogenase subunit 4 (mitochondrial) 6630 CACCTAATTG ATPase6 ATP synthase F0 subunit 6 (mitochondrial) 6370 GTTGTGGTTA B2M beta-2-microglobulin 6047 CCCATCGTCC COX2 cytochrome c oxidase, subunit II (mitochondrial) 5470 AAAAAAAAAA mutiple mappings1 5138 TAGGTTGTCT TPT1 tumor protein, translationally-controlled 1 4356 AGCCCTACAA NADH3 NADH dehydrogenase subunit 3 (mitochondrial) 4231
GTTCACATTA CD74 CD74 antigen (invariant polypeptide of major histocompatibility complex, class II antigen-associated) 3613
TTCAATAAAA RPLP12 ribosomal protein, large, P1 3581 AAGCTCGCCG SCGB3A1 secretoglobin, family 3A, member 1 3386 TTGGGGTTTC FTH1 ferritin, heavy polypeptide 1 3313 ATAATTCTTT RPS29 ribosomal protein S29 3306 GTGAAACCCC mutiple mappings1 3301 CCACTGCACT mutiple mappings1 3153 CTAAGACTTC 16S RNA ribosomal RNA (mitochondrial) 3004 TTGGTCCTCT RPL413 ribosomal protein L41 2946 TGTGGGAAAT SLPI secretory leukocyte protease inhibitor 2884 CTCCACCCGA TFF3 trefoil factor 3 (intestinal) 2789 TGATTTCACT COX3 cytochrome c oxidase, subunit III (mitochondrial) 2766 CTGTACAGAC TUBB2 tubulin, beta, 2 2523 TGTGTTGAGA EEF1A1 eukaryotic translation elongation factor 1 alpha 1 2503 TAATAAAGGT RPS8 ribosomal protein S8 2484 ACTAACACCC NADH2 NADH dehydrogenase subunit 2 (mitochondrial) 2457 CCAAGGTGGC LPLUNC1 long palate, lung and nasal epithelium carcinoma-associated 1 2449 CCTGTAATCC mutiple mappings1 2404 TCTCCATACC NADH1 (likely) NADH dehydrogenase subunit 1 (mitochondrial) 2381 GAGGGAGTTT RPL27A ribosomal protein L27a 2365 TCAGATCTTT RPS4X ribosomal protein S4, X-linked 2174 AAAACATTCT 16S RNA ribosomal RNA (mitochondrial) 2141 GCATAATAGG RPL21 ribosomal protein L21 2129 GTGATCAGCT MUC5B4 mucin 5, subtype B, tracheobronchial 2116 GAAATACAGT NT5C5 5',3'-nucleotidase, cytosolic 1950 GTGAAACCCT mutiple mappings1 1854 GCTAACCCCT CGI-38 brain specific protein 1810 CTGACCAGAG CAPS calcyphosine 1789 TTCACTGTGA LGALS3 lectin, galactoside-binding, soluble, 3 (galectin 3) 1751 CTGGGTTAAT RPS19 ribosomal protein S19 1742 CCTCAGGATA NADH6 NADH dehydrogenase subunit 6 (mitochondrial) 1697 ATTTTCTAAA AGR2 anterior gradient 2 homolog (Xenepus laevis) 1678 GAAAAATGGT LAMR1 laminin Rc1/ribosomal protein SA, 67 kDa 1662 GGATTTGGCC RPLP2 ribosomal protein, large P2 1608 TAAAAAAAAA mutiple mappings1 1579 TGCACGTTTT RPL32 ribosomal protein L32 1538 AATGCTTTGT TUBA3 tubulin, alpha 3 1524 CTCATAAGGA 16S RNA ribosomal RNA (mitochondrial) 1491 CAATTAAAAG XBP1 X-box binding protein 1 1486 CAATAAATGT RPL37 ribosomal protein L37 1471
1Repetitive tag has multiple, equally high reliability mappings; 2Other high reliability mapping to TCN1 (transcobalamin 1); 3Other high reliability mapping to DKGI (diacylglycerol kinase, iota) 4High reliability mapping to Accession number U06711; 5Other high reliability mapping to CTSD (cathepsin D)

46
Supplemental Table E4. Normalized tag counts expressed as tags per million (TPM), reflect relative transcript levels corresponding to the 50 most abundant, unique tags from the average of the two lung parenchyma libraries, constructed from specimens acquired from two pools of four individuals each. Tag-to-gene mapping was per SAGE Genie, Aug., 2005, with reference to SAGEmap.
Tag Gene Symbol Gene Name Abundance (TPM) CTCCCAGCCA SFTPA2* surfactant, pulmonary-associated protein A2 20330
GTTCACATTA CD74 CD74 antigen (invariant polypeptide of major histocompatibility complex, class II antigen-associated) 12829
GAAATAAAGC IGHG1* immunoglobulin heavy constant gamma 1 (G1m marker) 8946 GCCGTGAGCA SFTPC* surfactant, pulmonary-associated protein C 7435 ATAATTCTTT RPS29 ribosomal protein S29 7210 CCCATCGTCC COX2 cytochrome c oxidase, subunit II (mitochondrial) 6743 TTGGGGTTTC FTH1 ferritin, heavy polypeptide 1 6259 GCCGTGAACA SFTPC surfactant, pulmonary-associated protein C 5932 GTTGTGGTTA B2M beta-2-microglobulin 5774 TAGGTTGTCT TPT1 tumor protein, translationally-controlled 1 5506 TTCATACACC NADH4 NADH dehydrogenase subunit 4 (mitochondrial) 5365 GAAATACAGT NT5C* 5',3'-nucleotidase, cytosolic 5357 ACTTTTTCAA tRNA transfer RNA (mitochondrial) 5306 CACCTAATTG ATPase6 ATP synthase F0 subunit 6 (mitochondrial) 5088 TTCAATAAAA RPLP1* ribosomal protein, large P1 4906 CCACTGCACT --- multiple mappings+ 4523 GGATTTGGCC RPLP2 ribosomal protein, large P2 4335 TAATAAAGGT RPS8 ribosomal protein S8 4315 CGCAGCGGGT NAPSA napsin A aspartic peptide 4315 GGGCATCTCT HLA-DRA major histocompatibility complex, class II, DR alpha 4144 CTGGGTTAAT RPS19 ribosomal protein S19 4124 GAGGGAGTTT RPL27A ribosomal protein L27a 3784 TTGGTGAAGG TMSB4X thymosin, beta 4, X chromosome 3702 CACAAACGGT RPS27 ribosomal protein S27 (metallopanstimulin 1) 3465 GTGAAACCCC --- multiple mappings+ 3438 CTTTGAGTCC SCGB1A1 secretoglobin, family 1A, member 1 3426 AGCCCTACAA NADH3 NADH dehydrogenase subunit 3 (mitochondrial) 3237 AAGGGAGCAC IGLC2 immunoglobulin lambda joining 3 3155 TCAGATCTTT RPS4X ribosomal protein S4, X-linked (utyrophilin-like 9) 2852 GAAAAATGGT LAMR1 laminin receptor 1 (ribosomal protein SA, 67kDa) 2842 CCCTGGGTTC FTL ferritin, light polypeptide 2794 AAAAAAAAAA --- multiple mappings+ 2792 AAGACAGTGG RPL37A ribosomal protein L37a 2707 TTGGTCCTCT RPL41 ribosomal protein L41 2626 CTAAGACTTC 16S RNA ribosomal RNA (mitochondrial) 2545 CTGACCTGTG HLA-B* major histocompatibility complex, class I, B 2488 CAATAAATGT RPL37 ribosomal protein L37 2481 GTGCACTGAG HLA-A* major histocompatibility complex, class I, A 2428 GGGCTGGGGT RPL29* ribosomal protein L29 2266 TGGCCCCAGG ApoC1 apolipoprotein C-I 2239 AGGACACCAA SFTPB* surfactant, pulmonary-associated protein B 2201 ATGTGAAGAG SPARC secreted protein, acidic, cysteine-rich (osteonectin) 2123 CCTGTAATCC --- multiple mappings+ 2098 GCATAATAGG RPL21 ribosomal protein L21 2085 TGCACGTTTT RPL32 ribosomal protein L32 2081 AGCACCTCCA EEF2 eukaryotic translation elongation factor 2 2074 GGATATGTGG EGR1 early growth response 1 2027 GTGACCACGG --- ambiguous 1994 GTGCTGAATG MYL6 myosin, light polypeptide 6, alkali, smooth muscle and non-muscle 1993 TTAACCCCTC RNASE1 ribonuclease, RNase A family, 1 (pancreatic) 1901
* Possibility of alternate tag-to-gene mappings noted + Repetitive tag has multiple, equally high reliability mappings

47
Supplemental Table E5. Top 100 bronchial-enriched SAGE tags. Tags are sorted according to standard deviation-adjusted ratio ( SDAdjRatio) of bronchus versus non-lung. Tag-to-gene mapping was per SAGE Genie, Aug., 2005.
Tag BE
Mean TPM1
BE SD
Non Lung Mean TPM2
Non Lung
SD
SDAdjRatio3 T-Value Gene Symbol Mapping
Reliability (%) Gene Name
CTTTGAGTCC 45562 28975 0 0 16587 7 SCGB1A1 96 secretoglobin, family 1A, member 1 (uteroglobin)
CAACATAATA 483 115 0 0 367 18 DKFZp666G057 78 hypothetical protein DKFZp666G057
GGATGTTGCA 550 190 0 0 360 12 C20orf85 73 chromosome 20 open reading frame 85
AGCTTAATGA 1402 1058 0 0 343 6 Hs.460176 41 (internal tag) transcribed locus CATTTGTCAA 443 145 0 0 298 13 56 cDNA clone IMAGE: 2134382 TCCAAGTCCG 502 206 0 0 296 10 MDAC1 72 MDAC1 GGCTGTATTT 361 118 0 0 242 13 Hs.363312 48 similar to mouse fat 1 cadherin AGATTGAGGG 327 116 0 0 212 12 48 cDNA clone IMAGE 4551232 GATAGTGTGG 242 67 0 0 176 15 TUBA4 72 tubulin, alpha 4 CTAGGAAAAT 257 84 0 0 173 13 EPHA3 48 EPH receptor A3
CCAAGGGAAT 270 106 0 0 164 11 ZMYND10 (Blu) 89 zinc finger, MYND domain containing 10
CCAAGGTGGC 2834 1418 2 7 150 8 C20orf114 (LPLUNC1) 94 chromosome 20 open reading frame 114
CAAGACCAGT 770 631 0 0 139 5 GSTA2 94 glutathione S-transferase A2
GCCAGGACTC 203 80 0 0 123 11 Hs.343383 58 similar to hypothetical protein FLJ25955
TATACAGTCC 201 80 0 0 122 11 C6orf97 92 chromosome 6 open reading frame 97 GCAGCGGCAG 1474 1368 0 0 106 5 CTSW 58 (internal tag) cathepsin W (lymphopain)
CTTCTGAGGG 193 97 0 0 95 8 C9orf117 73 chromosome 9 open reading frame 117
AAAGTTATTT 1196 290 2 8 91 17 FOXJ1 94 forkhead box J1
ATTTTCCTGT 120 38 0 0 82 13 DKFZp434I099 94 chromosome 16 open reading frame 50
TCTCTCTGGA 266 185 0 0 80 6 Hs.404306 43 Transcribed locus
CAGAGCGAAC 126 46 0 0 80 12 DKFZP586M1120 /LRRC48 94 leucine rich repeat containing 48
CTTGAGTCCA 299 224 0 0 76 6 44 (internal tag) (cDNA) TGATAAGATG 115 46 0 0 68 11 ARMC4 88 armadillo repeat containing 4 ATAAACATTT 675 294 1 5 68 10 LOC123872 /LRRC50 89 leucine rich repeat containing 50
ATTAATTTCC 107 40 0 0 67 11 DNALI1 61 dynein, axonemal, light intermediate polypeptide 1
CTTTTGCCCT 113 47 0 0 66 10 N4BP2 52 (internal tag) Nedd4 binding protein 2
ATCGACCCTC 89 34 0 0 55 11 DNAI2 94 dynein, axonemal, intermediate polypeptide 2
TGAGCTTGTG 1072 261 4 12 54 17 MS4A8B 94 membrane-spanning 4-domains, subfamily A, member 8B
TGATTATTAA 96 43 0 0 53 9 TOX 59 (internal tag) thymus high mobility group box protein TOX
ATTGTAAAGA 102 49 0 0 53 9 FLJ40919 88 hypothetical protein FLJ40919 TTCCATCCAG 90 38 0 0 51 10 ARMC3 94 armadillo repeat containing 3 TGCCCAACAC 77 25 0 0 51 13 DKFZp434A128 72 hypothetical protein DKFZp434A128
CTGGCCGGCC 77 27 0 0 50 12 TRIB3 73 (internally primed) tribbles homolog 3 (Drosphilia)
ATAGATATGG 103 52 0 0 50 8 PICALM 44 (internal tag) phosphatidylinositol binding clathrin assembly protein
ATTTTCTTAA 664 213 2 7 50 13 C6orf206 89 chromosome 6 open reading frame 206
GAGGATTCCA 93 44 0 0 49 9 SKB1 80 SKB1 homolog (S. pombe)
GGATTTTATT 80 31 0 0 49 11 DKFZP434H0115 92 hypothetical protein DKFZp434H0115
GTCTATAAAG 73 26 0 0 47 12 MGC48998 89 chromosome 1 open reading frame 110
GTGAAAGACA 98 51 0 0 47 8 CASC1 88 cancer susceptibility candidate 1
GTTATGGCTG 620 290 1 6 47 9 CYP4B1 75 cytochrome P450, family 4, subfamily B, polypeptide 1
GTGATCAGCT 2465 1658 4 14 46 6 MUC5AC4 44 (internal tag) mucin 5, subtypes A and C, tracheobronchial/gastric
TATCCCTGGT 78 32 0 0 45 10 44 (internal tag) (cDNA) AATATACTAG 84 39 0 0 45 9 no match GTAATGTTTT 416 128 2 5 43 14 KIAA1600 47 (internal tag) KIAA1600 CATTTTTACT 243 75 1 3 42 14 SPAG6 94 sperm associated antigen 6
ACTTTAACTG 71 29 0 0 42 10 RAB33B 50 (internal tag) RAB33B, member RAS oncogene family

48
GCATTCTTCC 81 39 0 0 42 9 FLJ32884 89 chromosome 1 open reading frame 92 TGACTGTAGC 69 29 0 0 39 10 KIAA1533 48 KIAA1533 CTCTGAGTCC 172 133 0 0 39 5 53 (internal tag) cDNA clone IMAGE: 4253586
TATAGTTGGA 64 27 0 0 37 10 CTNNB1 46 (internal tag) catenin (cadherin-associated protein), beta 1, 88 kDa
TTTGCAAATA 610 159 4 8 37 16 48 cDNA clone c149g10 ACCGCAGGCT 319 112 1 5 37 12 no match GTTGCATCCC 70 33 0 0 37 9 no match GAAATACGTA 75 39 0 0 37 8 48 cDNA clone CS0DC002YG12 ACTTGTTATC 73 36 0 0 36 8 AK7 94 adenylate kinase 7
ATTAGTTTCT 67 31 0 0 36 9 C6ORF118 94 chromosome 6 open reading frame 118
AGTCAGGATA 1095 265 8 16 35 17 FLJ34512 89 hypothetical protein FLJ34512 AAATTATATT 64 29 0 0 35 9 ZNF214 88 zinc finger protein 214
TGAACATTTG 203 66 1 3 35 13 MGC16186 74 (internally primed) hypothetical protein MGC16186
TGGGGGCCTC 128 94 0 0 35 6 48 cDNA clone IMAGE: 2090661
CAAGGCAATT 60 27 0 0 33 10 MPH1B 58 (internal tag) malate dehydrogenase 1B, NAD (soluble)
TCAGTATGTG 59 26 0 0 33 10 no match
AGCAAAGCCC 61 28 0 0 33 9 c22orf15 49 chromosome 22 open reading frame 15
ATAGGTCTTT 224 97 1 3 32 10 ASP/ROPN1L 89 AKAP-associated sperm protein/roppprin 1-like
TGATTCTGAA 74 42 0 0 32 7 ZNF140 70 zinc finger protein 140 (clone pHZ-39)
TCATCACACT 61 30 0 0 31 9 FLJ23049 94 hypothetical protein FLJ23049
TACTGTTCTA 73 43 0 0 30 7 KCNE1 94 potassium voltage-gated channel, lsk-related family, member 1
GAACACTATT 56 25 0 0 30 9 Hs.512441 54 similar to polycystin 1-like 3 ACTTCTCCTT 52 22 0 0 30 10 CLSPN 50 (internal tag) claspin homolog (Xenopus laevis) CTTCGAGTCC 127 98 0 0 29 6 FASTK 58 (internal tag) fas-activated serine/threonine kinase AAATTATAAA 184 57 1 4 29 14 68 cDNA TGTTATTTGA 43 14 0 0 28 13 PF20/SPAG16 78 PF20/SPAG16
CATTTGGAAC 95 67 0 0 28 6 CHCHD3 48 coiled-coil-helix-coiled-coil-helix domain containing 3
AGTGGATCAC 228 71 1 5 28 14 c9orf18 88 chromosome 9 open reading frame 18
CTGAACATAT 63 36 0 0 28 8 NYD-SP29 94 testis development protein NYD-SP29/WD repeat domain 63
CAGAGGCCAG 302 152 1 5 27 8 48 cDNA clone IMAGE 5284144 CAAAGAGGGT 49 23 0 0 26 9 48 cDNA clone IMAGE: 2308801 CAGTCTGATT 146 56 1 3 26 11 MGC16309 /LRRC46 73 leucine rich repeat containing 46 ATGGTTTCCG 190 43 1 5 26 18 FLJ11724 80 hypothetical protein FLJ11724 GCCCACCCAA 57 31 0 0 26 8 48 cDNA clone IMAGE: 4579858 TCTCATTTAG 56 31 0 0 25 8 44 (internal tag) cDNA clone IMAGE: 4244412 GCAGCCTTGC 136 111 0 0 25 5 KIAA1609 44 (internal tag) KIAA1609 protein TTTCTCCCCA 50 25 0 0 25 8 MGC34837 94 chromosome 1 open reading frame 87
AATAAATGTG 283 97 2 6 25 12 C10orf79 67 (internally primed)
chromosome 10 open reading frame 79
CATCTGAAAT 49 24 0 0 25 8 Hs.233936 53 (internal tag) LOC440476
AATGTGTTTA 288 158 1 4 24 8 ABCA13 92 ATP binding cassette gene, subfamily A member 13
ATGAGAGTGG 162 76 1 3 24 9 CTSZ 48 cathepsin Z TCTTATTCTC 47 23 0 0 24 9 48 cDNA clone IMAGE: 4366048 GCTTTGCTCT 49 25 0 0 24 8 48 cDNA CTGACCAGAG 2068 681 21 37 24 13 CAPS 88 calcyphosine GAGGAGGCCC 224 59 1 6 24 16 FLJ44299 88 FLJ44299 protein CATCCAGCAG 53 29 0 0 23 8 raptor 48 raptor TTTTCAGATG 47 23 0 0 23 8 EHBP1 56 EH domain binding protein 1 TCCTCTAAAT 231 102 1 5 23 10 48 cDNA CTGTGATGCA 78 56 0 0 23 6 48 cDNA clone IMAGE 4763847 TGAAGAGTCT 468 145 4 11 22 14 LOC134121 56 (internal tag) hypothetical protein LOC134121 TAATATAACA 70 47 0 0 22 6 48 cDNA clone IMAGE: 461631 TTCTGACATT 395 104 4 10 22 16 FLJ33084/CCDC17 88 coiled-coil domain containing 17
TGATTAGATA 68 47 0 0 21 6 C15orf26 94 chromosome 15 open reading frame 26
CCGCTAGGGG 137 31 1 4 21 19 DKFZp43400527 72 hypothetical protein DKFZp43400527
1Calculated from the 19 bronchial epithelial (BE) libraries 2Calculated from SAGE libraries representing 11 non-lung tissue types 3SDAdjRatio = (bronchial mean - bronchial SD) / (non-lung mean + non-lung SD) 4Reliable mapping to GenBank Accession Number U06711 (tracheobronchial mucin)

49
Supplemental Table E6. Quantitative RT-PCR data comparing expression between bronchial epithelium and lung parenchyma for three selected genes in a new cohort. Sample ACTB ARMC3 BLU MDAC1
CT CT Normalized
CT CT Normalized
CT CT Normalized
CT CS1 30.7 29.0 -1.8 27.1 -3.6 27.0 -3.7 CS2 29.6 28.1 -1.5 26.6 -3.0 26.0 -3.6 CS3 29.2 28.2 -1.0 26.1 -3.1 27.5 -1.7 CS4 29.9 28.8 -1.2 26.6 -3.3 26.4 -3.5 CS5 29.3 28.6 -0.7 26.3 -3.0 26.6 -2.7 CS6 29.3 28.1 -1.2 25.9 -3.4 25.0 -4.3 CS7 29.7 28.1 -1.6 26.5 -3.2 27.6 -2.1 CS8 28.9 28.0 -0.9 25.5 -3.4 25.8 -3.1 CS9 29.7 29.0 -0.7 26.4 -3.3 26.1 -3.6 FS1 29.4 28.3 -1.1 26.7 -2.7 27.9 -1.5 FS2 30.2 29.3 -0.9 27.4 -2.9 27.0 -3.3 FS3 30.5 29.2 -1.2 27.2 -3.3 27.7 -2.8 FS4 30.4 29.1 -1.3 26.8 -3.6 26.0 -4.3 FS5 29.4 27.7 -1.7 25.6 -3.8 25.7 -3.7 FS6 29.1 27.8 -1.3 25.6 -3.5 28.2 -0.9 FS7 30.2 29.0 -1.1 27.5 -2.7 27.3 -2.9 LP1 26.6 36.3 9.7 33.2 6.5 34.9 8.3 LP2 26.6 33.2 6.6 29.7 3.1 32.1 5.5 LP3 25.2 40.0 14.8 33.8 8.6 40.0 14.8 LP4 29.6 40.0 10.4 34.3 4.8 34.2 4.7 LP5 26.2 34.2 8.0 30.9 4.7 32.3 6.1
CT = cycle threshold Normalized CT = gene CT minus ACTB CT CS = Current Smoker FS = Former Smoker LP = Lung parenchyma 40 = not detected within 40 cycles

50
Supplemental Table E7. Identification of SAGE tags enriched in current smoker libraries (CS) relative to former smoker libraries (FS). Mean normalized tag abundance values (TPM) representing the five CS libraries were compared with those representing the 11 FS libraries. [Average tag abundance values from library pairs generated from the same individual (BE-4A/B, BE-8A/B, BE-11A/B) were used in determining the FS mean.] One hundred and forty-nine tags were found to be enriched in the CS dataset three-fold or greater, at a minimal mean abundance level of 20 TPM, and with expression in at lease four out of the five CS libraries. Tag-to-gene mapping was according to SAGE Genie, May, 2006. Mapping reliabilities of <70 % are noted within the table.
Tag Gene Symbol Gene Name
CS Mean (TPM)
FS Mean (TPM)
CS Mean/ FS Mean
CCTATCAGTA MSMB microseminoprotein, beta- 14355 4558 3
GGCCCAGGCC ALDH3A1 aldehyde dehydrogenase 3 family,
memberA1 4006 305 13 CAAGACCAGT GSTA2 glutathione S-transferase A2 1418 437 3
TTAAAAATTC ADH7 alcohol dehydrogenase 7 (class IV),
mu or sigma polypeptide 861 120 7 TTATCAAATC NQO1 NAD(P)H dehydrogenase, quinone 1 761 197 4
AGGTCTGCCA AKR1C2 aldo-keto reductase family 1,
member C2 512 117 4 GCTACACAAT 504 128 4
GGTGGTGTCT GPX2 glutathione peroxidase 2
(gastrointestinal) 362 42 9 CAAATAAACC PIR Pirin 257 42 6
GTGCAGGGAG SPDEF SAM pointed domain containing ets
transcription factor 231 60 4
GCTTGAATAA AKR1B10 aldo-keto reductase family 1,
member B10 223 6 37
TATTTTTGAA DRB1 developmentally regulated RNA-
binding protein 1 220 34 6
AGGTCTACCA AKR1C2 aldo-keto reductase family 1,
member C2 190 35 5 GCTATCAGTA no match 175 50 3
AATGCTTTTA CYP1B1 cytochrome P450, family 1, subfamily B, polypeptide 1 171 14 12
AATATTTATA CEACAM5 carcinoembryonic antigen-related
cell adhesion molecule 5 170 55 3
TATTTTGAAA ZDHHC15 zinc finger, DHHC-type containing
15 148 16 9
CTCCAAAAAA CPSF2 (55 %) cleavage and polyadenylation
specific factor 2, 100 kDa 146 45 3 GGCCCCATTT CBR1 carbonyl reductase 1 142 30 5 TGGGAGTGGG 140 13 11
GAGAGCTTTG AKR1C3
aldo-keto reductase family 1, member C3 (3-alpha hydroxysteroid
dehydrogenase, type II) 130 20 7
TCCCTTTAAG PLEKHO1 (37 %) pleckstrin homology domain
containing, family O member 1 127 38 3 TCTGAATAGC TXN thioredoxin 115 27 4 CTTCCTGTGA SBEM small breast epithelial mucin 111 25 4 CTTATCAGTA BTBD7 (39 %) BTB (POZ) domain containing 7 95 29 3 CTTGCATAAG CYP1A1 cytochrome P450, family 1, 85 2 40

51
subfamily A, polypeptide 1
GTGGAGAAGA CLDN10* (P2RY1 80
%) claudin 10* (purinergic receptor
P2Y, G-protein coupled, 1) 77 22 4 TATTTTTCGT TTC9 tetratricopeptide repeat domain 9 75 20 4 TCCAAGCGTC 72 12 6 GCGTGCTCTC 71 24 3
GAATGAACTG EDIL3 (42 %) EGF-like repeats and discoidin I-like
domains 3 68 7 10
GCAAGAAGAG ALDH3A1 (55 %) aldehyde dehydrogenase 3 family,
memberA1 64 10 6
GTTGGGGTTT USH2A (39 %) usher syndrome 2A (autosomal
recessive, m ile) 63 21 3 TTTGCAGTAA 59 19 3 TTGCACCCTT MSMB (55 %) microseminoprotein, beta- 59 14 4 CCTATCAGCA Hs.619737 transcribed locus 59 5 11
CAAGCATAAA CABYR
calcium-binding tyrosine-(Y)-phosphorylation regulated
(fibrousheathin 2) 58 5 11
CAGTCTAAAA UCHL1 ubiquitin carboxyl-terminal esterase
L1 (ubiquitin thiolesterase) 56 5 11 AGTGGTGGCT FMOD fibromodulin 55 10 6 TCCCTATTGA 49 16 3
AATAGAAATT SPP1
secreted phosphoprotein 1 (osteopontin, bone sialoprotein I, early T-lymphocyte activation 1) 47 8 6
CCTACCAGTA 46 8 6
TCTATCAGTA YES1 (39 %) V-yes-1 Yamaguchi sarcoma viral
oncogene homolog 1 46 11 4
GTGATGTAAG SRXN1 sulfiredoxin 1 homolog (S.
cerevisiae) 45 12 4 AATAAATTGG 45 11 4 GTGGGGTTTC 45 11 4 CCTATCAGAA no match 45 14 3 GGCATTTTGT 44 10 4 CTCCACCCAA Hs.147579 (41 %) transcribed locus 43 5 8
CACGCGCTCA POLR2E polymerase (RNA) II (DNA
directed) polypeptide E, 25kDa 42 8 5 TATATAAAAA COMMD6 COMM domain containing 6 40 10 4 CAGCCGCACT no match 39 5 9 CCTATCGGTA no match 39 9 4
ATCAGCAAGT C10orf104 (54 %) chromosome 10 open reading frame
104 39 13 3 TGGACATAAA ZNF714 (50 %) zinc finger protein 714 38 12 3 CAAATGAATA ZNF585A zinc finger protein 585A 38 12 3 AATAGTTTCC Hs.605431 (66 %) transcribed locus 37 6 6 ATGAAAATCT FLJ45803 FLJ45803 protein 36 11 3
TTATAGATAT UBE1C (44 %) ubiquitin-activating enzyme E1C
(UBA3 homolog, yeast) 36 10 4 GCCTGTGGAT PSKH1 protein serine kinase H1 36 8 4 CGTATCAGTA no match 36 7 5 CCTATTAGTA no match 35 0 84
CAAGATACAC Hs.534006 (55 %)
(clone TR1.6VL) anti-thyroid peroxidase monoclonal autoantibody
IgK chain, V region 35 10 3

52
TAGAGGGCCA 35 1 33 CCGCTGTTCC no match 35 4 8 CCACCTGCTA no match 34 1 67
TTTATTTTTT EHMT1/FLJ21106
euchromatic histone-lysine N-methyltransferase 1/hypothetical
protein FLJ21106 34 11 3
CTGGGGTTTC TNFRSF10C (39 %)
tumor necrosis factor receptr superfamily, member 10c, decoy without an intracellular domain 34 7 5
TGTTACCTGG MYOM2 myomesin (M-protein) 2, 165kDa 33 7 5 ATAGCAGTCT ZNF331 (49 %) zinc finger protein 331 33 8 4 CCCATCAGTA no match 33 9 4 GAGTAACAAA LOC401098 (66 %) hypothetical LOC401098 33 9 4 GCGGCAGCGG RPL22 (49 %) ribosomal protein L22 32 9 4 TACACAGAAT 32 7 5
CCTGTCAGTA DVL3 (47 %) dishevelled, dsh homolog 3
(Drosophila) 32 5 7 TAACCCAGGC 31 10 3
GGAATTGCCC BPIL1 bactericidal/permeability-increasing
protein-like 1 31 5 6 CATATCAGTA 31 7 4 CCTTTCAGTA TRIM4 (33 %) tripartite motif-containing 4 30 4 8 CTGACCAAAA 29 2 13 TCATTGTAAG 29 5 6 CCTATCAGTG 29 8 4
TTGGCGGGTC PCMTD1 (32 %)
protein-L-isoasparate (D-asparate) O-methyltransferase domain
containing 1 28 7 4 CTTTGTATTT COL18A1 (39 %) collagen, type XVIII, alpha 1 28 1 45 GGCCCAGGCT NPTXR (43 %) neuronal pentraxin receptor 28 3 10
ACTGTTCTCT LGALS3 lectin, galacoside-binding, soluble, 3
(galectin 3) 28 5 5 CAGAATTAAC PANX2 pannexin 2 28 5 5 ATTGCAGACA 28 8 3 TTGGGGTCTC MGC13098 (42 %) hypothetical protein MGC13098 27 8 3
GACACAGCAA ENTPD8 ectonucleoside triphosphate
diphosphohydrolase 8 27 3 9
TACCTGTGCC RCD-8/OR10W1 autoantigen/olfactory receptor,
family 10, subfamily W, member 1 27 9 3
TATGTAAAAT TATDN1/C6orf79
TatD Dnase domain containing 1/chromosome 6 open reading frame
79 27 9 3 TCAAAAAGTA Hs.557807 (49 %) transcribed locus 27 8 3 TGTGAATCTG VIL2 (43 %) villin 2 (ezrin) 26 7 4
TTGAAAATAT LOC345222 (46 %) hypothetical gene supported by
BC043530 26 8 3
GAATAGACTT GAPVD1 (43 %) GTPase activating protein and VPS9
domains 1 26 8 3
AAGAGTTTTG AKR1B1 aldo-keto reductase family 1,
member B1 (aldose reductase) 26 5 5 TCTTTATTAA Hs.598324 (43 %) transcribed locus 25 5 5
CTCTGCATTT HEMK1 HemK methyltransferase family
member 1 25 6 4 TGGTGACAAT VDP vesicle docking protein p115 25 8 3

53
TAATATATAT RAB38 RAB38, member RAS oncogene
family 25 4 6
AAAGTAATTT RY1 (54 %) putative nucleic acid binding protein
RY-1 25 8 3 GCACTGAACC RPL15 (39 %) ribosomal protein L15 25 8 3 TGAACTTGGG ADORA2B (33 %) adenosine A2b receptor 24 8 3
AACATTAAAT NEDD4L (53 %)
neural precursor cell expressed, developmentally down-regulated 4-
like 24 8 3
GCTCCTGTAT Hs.487648 (39 %)
transcribed locus, strongly similar to NP_055947.1 sorting nexin 13; rgs
domain- and phox domain-containing protein [Homo sapiens] 24 8 3
TTTCCTCATA RPL4/Hs.216623 (39
%) ribosomal protein L4/transcribed
locus 24 5 5 GGGGCAGAGA JTB jumping translocation breakpoint 24 6 4
TTAATATTCA EIF4A1 (39 %) eukaryotic translation initiation
factor 4A, isoform 1 24 3 8 TCATTTAATG no match 24 1 26 GGGCCCAGGC MGC33486 hypothetical protein MGC33486 24 1 37
TATTACTTGT TRPM7 (49 %) transient receptor potential cation channel, subfamily M, member 7 23 6 4
TCTCACAGTT MSMB (39 %) microseminoprotein, beta- 23 6 4
AAGATGTTTG RFK/C14orf86 riboflavin kinase/chromosome 14
open reading frame 86 23 7 4
CTCCCCCCGA C19orf10 chromosome 19 open reading frame
10 23 5 4 TCACCCCCAA TFF3 (55 %) trefoil factor 3 (intestinal) 23 7 4 TATCTTTATA CNIH4 cornichon homolog 4 (Drosophila) 23 6 4 GACAGGCTTG no match 23 7 3
ATCAAAGAGT HMGN1 (50 %) high-mobility group nucleosome
binding domain 1 23 5 5
CTGGAGACTC PRKCDBP protein kinase C, delta binding
protein 23 7 3 AGCTCTGTAG 22 6 4 CAAGTTGTTA CASD1 CAS1 domain containing 1 22 7 3
CTGGTCCTCT C20orf91 (33 %) chromosome 20 open reading frame
91 22 7 3 GCCTTATCTT YEATS4 (39 %) YEATS domain containing 4 22 7 3
TCCAAAAATA PIGA
phosphatidylinositol glycan, class A (paroxysmal nocturnal
hemoglobinuria) 22 7 3 GTAGACCCCA FLJ25222 CXY orf1-related protein 22 7 3 CTCCCACCCG no match 22 2 10
TCTTTATTAG ELOVL4
elongation of very long chain fatty acids (FEN1/Elo2, SUR4/Elo3,
yeast)-like 4 22 6 4 TAAAAATATT ANKRD26 ankyrin repeat domain 26 22 7 3
GCACTAATAT Hs.120/PRDX6 (51
%) clone TESTIS-714 mRNA sequence/peroxiredoxin 6 22 7 3
TTTTGTATTC no match 22 2 13 GCACCCTTTC MIDN midnolin 21 2 14 TGTGTTGAAA no match 21 7 3
TGCTTTTGTA SLC7A11
solute carrier family 7, (cationic amino acid transporter, y+ system)
member 11 21 1 33

54
GTAACCAAAT ST6GALNAC3/RAB2
(39 %)
ST6 (alpha-N-acetyl-neuraminyl-2,3-beta-galactosyl-1,3)-N-
acetylgalactosaminide alpha-2,6-sialyltransferase 3/RAB2, member
RAS oncogene family 21 6 4
AGGAGCAACT APH1A (39 %) anterior pharynx defective 1
homolog A (C. elegans) 21 4 5
TATAAAAGTC ITGB3BP/ZNF117
integrin beta 3 binding protein (beta3-endonexin)/zinc finger
protein 117 (HPF9) 21 4 5 TGGTTTGCAG RP11-217H1.1 (41 %) implantation-associated protein 21 6 3
CAATGGTAGG Hs.593121 (45 %)
T84 colon carcinoma cell IL-1beta regulated HSCC1 mRNA, partial
sequence 21 7 3 CAATTAATTC GRPEL2 (41 %) GrpE-like 2, mitochondrial (E. coli) 21 7 3
TAAGATGTTG NME5
non-metastatic cells 5, protein expressed in (nucleoside-
diphosphate kinase) 21 6 3
CACTTGTTAT IER3IP1/COPS2
immediate early response 3 interacting protein 1/COP9
constitutive photomorphogenic homolog subunit 2 (Arabidopsis) 21 7 3
AATAATGGTT ULK2 unc-51-like kinase 2 (C. elegans) 21 6 3 AGTTGTACTT RPSA ribosomal protein SA 21 7 3
GGGATCAGCT GIT1 (43 %) G protein-coupled receptor kinase-
interactor 1 20 6 4
GATATTTTCA NUDT4 nudix (nucleoside diphosphate linked moiety X)-type motif 4 20 4 5
CCCCAGTGAG ARRDC1 arrestin domain containing 1 20 6 3 ACACAGTCGA 20 6 3 GCGATCAGCT FOXK2 (32 %) forkhead box K2 20 3 7

55
Supplemental Table E8. Identification of SAGE tags enriched in former smoker libraries (FS) relative to current smoker libraries (CS). Mean normalized tag abundance values (TPM) representing the 11 FS libraries were compared with those representing from the five CS libraries. [Average tag abundance values from library pairs generated from the same individual (BE-4A/B, BE-8A/B, BE-11A/B) were used in determining the FS mean.] Two hundred tags were found to be enriched in the FS dataset three-fold or greater, at a minimal mean abundance level of 20 TPM, and with expression in at lease nine out of the 11 FS libraries. Tag-to-gene mapping was according to SAGE Genie, May, 2006. Mapping reliabilities of <70 % are noted within the table.
Tag Gene Symbol Gene Name
CS Mean (TPM)
FS Mean (TPM)
FS Mean/ CS Mean
TCTCCATACC 775 2343 3 TGCCCTCAGG LCN2 lipocalin 2 (oncogene 24p3) 578 1756 3 GCAAGAAAGT HBB hemoglobin, beta 176 1085 6
GGGCATCTCT HLA-DRA major histocompatibility complex, class II,
DR alpha 328 1033 3 CCCAACGCGC HBA1 hemoglobin, alpha 1 59 992 17 TGCCCTCAAA LCN2 lipocalin 2 (oncogene 24p3) 243 939 4
CCTGCTGCAG TRFP (54 %) Trf (TATA binding protein-related factor)-
proximal homolog (Drosophila) 174 780 4 GTTGTCTTTG C10orf86 chromosome 10 open reading frame 86 124 676 5 CTTCTTGCCC HBA1 hemoglobin, alpha 1 75 666 9
TGCCCTCAGA PRKAB1 (39 %) protein kinase, AMP-activated, beta 1 non-
catylatic subunit 134 484 4 ATTAACACCC 11 364 34 GCCGTGAGCA ABHD10 (66 %) abhydrolase domain containing 10 95 340 4 TGGCCCCAGG APOC1 apolipoprotein C-I 23 337 15 GTGCGGAGGA LDHA/SAA2 lactate dehydrogenase A/serum amyloid A2 6 318 56
AATGTGTTTA ABCA13 ATP-binding casseette, sub-family A
(ABC1), member 13 101 309 3
GAGTTAAAAA HLA-DRB1 major histocompatibility complex, class II,
DR beta 1 69 252 4 ATCAAGAATC IFI30 interferon, gamma-inducible protein 30 45 225 5 GCCCTATGCG LYPD2 LY6/PLAUR domain containing 2 14 200 14
GGAAAAGTGG SERPINA1
serine (or cysteine) proteinase inhibitor, clade A (alpha-1 antiproteinase, antitrypsin),
member 1 42 165 4 AGTTTCTTGT MPDU1 mannose-P-dolichol utilization defect 1 16 158 10
AAGAATTTGA NDUFB1 NADH ehydrogenase (ubiquinone) 1 beta
subcomplex, 1, 7 kDa 34 141 4
GAAATAAAGC IGHG1 immunoglobulin heavy constant gamma 1
(G1m marker) 23 141 6 ATTTTTACTA UBD ubiquitin D 24 127 5
TGAAAACTAC HLA-DPA1 major histocompatibility complex, class II,
DP alpha 1 33 120 4
GAAGCAATAA ST3GAL3 ST3 beta-galactoside alpha-2,3-
sialytransferase 3 37 119 3
GTGGCCACGG S100A9 S100 calcium binding protein A9
(calgranulin B) 19 117 6 ATCACACCAC 38 115 3 TTAACCCCTC RNASE1 ribonuclease, RNase A family, 1 (pancreatic) 13 110 9

56
AAGCACAAAA TYROBP TYRO protein tyrosine kinase binding
protein 35 106 3
TACCTGCAGA S100A8 S100 calcium binding protein A8
(calgranulin A) 20 100 5
TTAAACAAAG RARRES1 retinoic acid receptor responder (tazarotene
induced) 1 15 97 6
GCACTCCAGC TNFAIP8 tumor necrosis factor, alpha-induced protein
8 29 94 3 TGGAAGCACT IL8 interleukin 8 15 91 6 GAATTATACT TMEM45A transmembrane protein 45A 29 90 3 GCAGCTGGGC DOC2A double C2-like domains, alpha 14 83 6
GATCAATCAG CCL18 chemokine (C-C motif) ligand 18 (pulmonary
and activation-regulated) 4 80 20
AAATCAATAC C1QG complement component 1, q subcomponent,
gamma polypeptide 20 75 4 GTAATCCTGC 16 73 5 GCCTTAACAA PBEF1 pre-B-cell colony-enhancing factor 1 21 72 3 TTTATTTAGC NARCH3 membrane-associated ring finger (C3HC4) 3 22 69 3 ATTGATGTGT SFTPA2 surfactant, pulmonary-associated protein A2 14 66 5 GTGCTGTCTC HBA1 (54 %) hemoglobin, alpha 1 3 65 20 TTAAACTTAA CXCR4 chemokine (C-X-C motif) receptor 4 8 65 9
AACACAGCCT C4A complement component 4A (Rodgers blood
group) 17 65 4
AAATTCTGTT AHSA2 AHA1, activator of heat shock 90 kDz
protein ATPase homolog 2 (yeast) 17 59 3 TACATTTGAA SLC26A4 solute carrier family 26, member 4 17 58 3
ACTCAGCCCG Hs.525607 ATBETA-AMY (BETA-AMYLASE); beta-
amylase 9 57 7 GGAACAGGGG LOC553158 (55 %) PRR5-ARHGAP8 fusion 18 57 3 TTTCCCATAA CAPN13 calpain 13 14 57 4 AAGGGAGCAC IGL@ immunoglobulin lambda locus 5 55 11 AAAAACCCTT TOPORS topoisomerase I binding, argining/serine-rich 15 54 4 TGTTTTCATA CCL4L2 chemokine (C-C motif) ligand 4-like 2 2 53 25 ATTTAGCAAG FABP4 fatty acid binding protein 4, adipocyte 7 53 8 CGACCCCACG APOE apolipoprotein E 2 53 23 TTTTGAAATA TBC1D3 TBC1 domain family, member 3 11 52 5
CTCCCCCAAA IGHG1 immunoglobulin heavy constant gamma 1
(G1m marker) 16 51 3 TGCTGCCTGT BST2 bone marrow stromal cell antigen 2 15 48 3
GTAATAAAAT FCGR3A Fc fragment of IgG, low affinity IIIa,
receptor (CD16a) 11 47 4
TATCACATTC CXCL6 chemokine (C-X-C motif) ligand 6 (granulocyte chemotactic protein 2) 5 47 9
GACTTGTATA NFKBIA (60 %) nuclear factor of kappa light polypeptide gene enhancer in B-cells inhibitor, alpha 12 45 4
GCAGTTCTGA HLA-DRB1 major histocompatibility complex, class II,
DR beta 1 6 45 7 AAACCCCAAT IGL@/FBS1 innunoglobulin lambda locus/fibrosin 1 6 42 7 CTTATTTCCT HTR4 (39 %) 5-hydroxytryptamine (serotonin) receptor 4 12 42 4
GAGGGTGCCA C1QB complement component 1, q subcomponent,
beta polypeptide 14 42 3 AAATCAATAA Hs.576821 (51 %) transcribed locus 4 42 11 GAATTTCCCA C2 complement component 2 8 41 5 TTGAATCCCC PI3 protease inhibitor 3, skin-derived (SKALP) 12 40 3

57
TGTGGAAATC LOC285033 (33 %) hypothetical protein LOC285033 4 40 10 GGCTTTCCCT RNF149 ring finger protein 149 13 40 3 GGGGCTTAGG DTX2 deltex homolog 2 (Drosophila) 13 39 3 TAATGAATAA BCL2A1 BCL2-related protein A1 2 39 16 AAGAATTAAA TOPBP1 (43 %) topoisomerase (DNA) II binding protein 8 38 5 GGGGCAACAG CD52 CD52 molecule 5 38 8 TTTGAATCCA STAG3 stromal antigen 3 10 37 4 CTGTTGGCAT RPL21 ribosomal protein L21 10 37 4 TTTGAGTCCA KIF20A (39 %) kinesin family member 20A 12 37 3 AAAGCAATCA PHC1 polyhomeotic-like 1 (Drosophila) 7 37 5
CAATGCCTCT HLA-DRA major histocompatibility complex, class II,
DR alpha 5 36 7
ATGTGAAGAG SPARC secreted protein, acidic, cysteine-rich
(osteonectin) 2 36 22 GGAGGTGGAG ZNF713 zinc finger protein 713 4 35 9 TCTCTGATGC TIMP2 tissue inhibitor of metalloproteinase 2 2 35 16
GCGGTTGTGG LAPTM5 Lysosomal-associated multispanning
membrane protein-5 12 35 3 CCACTGTGCT CCM2 cerebral cavernous malformation 2 11 35 3
CCACTGAACT ALS2CR8/IER5L
amyotrophic lateral sclerosis 2 (juvenile) chromosome region, candidate 8/immediate
early response 5-like 9 35 4
ACCATTCTGC IFITM2 interferon induced transmembrane protein 2
(1-8D) 10 35 4
CTGACAGTGA HLA-DMB major histocompatibility complex, class II,
DM beta 7 34 5 GCATCTTCAA SP110 SP110 nuclear body protein 9 34 4 GTTGTGTTAA TMEM125 (54 %) transmembrane protein 125 10 34 4 CCAGGGCAAC TncRNA trophoblase-derived noncoding RNA 7 34 5
ACACTGCACT PPM1F protein phosphate 1F (PP2C domain
containing) 10 34 3
CCCCTCCCTC SLC4A2
solute carrier family 4, anion exchanger, member 2 (erythrocyte membrane protein
band 3-like 1) 9 33 4
TTCTGTGAAT VPS37B/CALD1 vacuolar protein sorting 37B
(yeast)/caldesmon 1 8 33 4 GATAACACAT CCL4 chemokine (C-C motif) ligand 4 2 32 15
TATTTAGGAA ELF2 (30 %0 E74-like factor 2 (ets domain transcription
factor) 7 32 5
CCTTGCCCTA Hs.462615/Hs.620548
CDNA FLJ30263 fis, clone BRACE2002606/CDNA FLJ38433 fis, clone
FEBRA2014578 10 32 3 GCCATAAAAT PRG1 proteoglycan 1, secretory granule 7 32 5
CTGACTGTCC CD74 (55 %)
CD74 antigen (invariant polypeptide of major histocompatibility complex, class II
antigen-associated) 6 31 5
TTACTGCACT FAM83D/Hs.577380
(49 %) family with sequence similarity 83, member
D/transcribed locus 3 31 10 ATTTAGTCAT IFI44 interferon-induced protein 44 7 31 4 GTTGTGGTAA 8 30 4 AATTTGTGTC MGC40178 (49 %) hypothetical protein MGC40178 9 30 3 ACTATTTCCA FBP1 fructose-1,6-bisphosphatase 1 9 30 3 AAACTCGCTG 7 30 4 GCTTGCAAAA SOD2 superoxide dismutase 2, mitochondrial 10 30 3

58
GACAATGAGA IDH3G isocitrate dehydrogenase 3 (NAD+) gamma 8 30 4 GTCGTGGTTA TPT1 (32 %) tumor protein, translationally-controlled 1 8 29 3 CCACTGCAAT FNDC3B fibronectin type III domain containing 3B 2 29 18
TGACTGTATT AOC3/FLJ12355
amine oxidase, copper containing 3 (vascular adhesion protein 1)/ hypothetical protein
FLJ12355 8 29 4
CAGGAACACT Hs.573145 (49 %)
transcribed locus, weakly similar to XP_375410.1 PREDICTED: hypothetical
protein XP_375410 [Homo sapiens] 8 29 4 AGGGAATTAA PDCD11 (66 %) programmed cell death 11 6 28 4 CCTGGCCCTA CXCL16 chemokine (C-X-C motif) ligand 16 7 28 4 GAACGCCTAA DPYSL2 dihydropyrimidinase-like 2 0 28 28
GGAGGCAGAG Hs.573578 (49 %)
transcribed locus, weakly similar to NP_061913.2 elongation protein 4 homolog; PAX6 neighbor gene; chromosome 11 open
reading frame 19 [Homo sapiens] 9 28 3 AATTTTGTCT Hs.192729 (27 %) transcribed locus 4 28 6 GCACCTTATT FLJ14668 hypothetical protein FLJ14668 2 28 11
ATTCACCCCC MAST3 microtubule associated serine/threonine
kinase 3 9 28 3 TCAGGCCTGT CSF3 colony stimulating factor 3 (granulocyte) 0 27 27 TGACTGTAAA SR140 (36 %) U2-associated SR140 protein 6 27 4
ACTGTATTTT GPRC5A G protein-coupled receptor, family C, group
5, member A 7 27 4 CAGCTGCTCC ACTRT2 actin-related protein T2 2 27 11 GTGGCATATG CDH13 cadherin 13, H-cadherin (heart) 7 27 4 CCCCGATCTT ATAD3A ATPase family, AAA domain containing 3A 9 27 3 TCTTGATTTA A2M alpha-2-macroglobulin 0 27 27
TTTTCTATCA STEAP2 six transmembrane epithelial antigen of
prostate 2 6 27 5 TGAGCTACCC FER1L4 fer-1-like 4 (C. elegans) 2 26 12 ACAGAGTGAG PARVA parvin, alpha 6 26 4 AGCACATTTG COTL1 coactosin-like 1 (Dictyostelium) 6 26 4
TACCAAGCCA PTAR1 protein prenyltransferase alpha subunit repeat
containing 1 5 26 5 GTGGCACATA SFT2D2 (51 %) SFT2 domain containing 2 7 25 4
GCCCGAGATG CTGLF1/RP11-
144G6.7
centaurin, gamma-like family, member 1/hypothetical gene supported by AK093334;
AL833330; BC020871; BC032492 7 25 4
TTTTTGCTTT C4BPA complement component 4 binding protein,
alpha 0 25 25 GGTTCAAGGC ATHL1 ATH1, acid trehalase-like 1 (yeast) 3 25 8 GATTATTCCT DNAH1 dynein, axonemal, heavy polypeptide 1 7 25 4 TTGCTGACTT COL6A1 collagen, type VI, alpha 1 2 25 10
GAGCTTTAAT Hs.438314 (35 %)
transcribed locus, strongly similar to XP_37321.2 PREDICTED: hypothetical
protein XP_373821 [Homo sapiens] 0 25 25
CCCAGCCTAA FAM44A family with sequence similarity 44, member
A 7 25 4
ACACAGTTTT FAT FAT tumor suppressor homolog 1
(Drosophila) 5 25 5
GACTCTTCAG SERPINA3
serine (or cysteine) proteinase inhibitor, clade A (alpha-1 antiproteinase, antitrypsin),
member 3 0 25 25
ACACACAGGA CXCL6 (33 %) chemokine (C-X-C motif) ligand 6 (granulocyte chemotactic protein 2) 5 25 5

59
ACTGCAGCCA MARCO/PRSS12
macrophage receptor with collagenous structure/protease, serine, 12 (neurotrypsin,
motopsin) 0 25 25 AAGGGATTTT KIAA0256 KIAA0256 gene product 8 24 3 CAACAACGCC SAT spermidine/spermine N1-acetyltransferase 5 24 5
GAGTTGGGTA FUT2 (39 %) fucosyltransferase 2 (receptor status
included) 4 24 6 TTAAGTATAG C20orf6 chromosome 20 open reading frame 6 8 24 3
CCTGGAATCC TFDP2 transcription factor Dp-2 (E2F dimerization
partner 2) 2 24 15
GAAACTAGGA KCNS3 potassium voltage-gated channel, delayed-
rectifier, subfamily S, member 3 2 24 11
TTCTCTCTGG TMED3/KCNMB2
(39 %)
transmembrane emp24 protein transport domain containing 3/potassium large
conductance calcium-activated channel, subfamily M, beta member 2 4 24 5
AGGCTGGATG DNAL4 dynein, axonemal, light polypeptide 4 5 24 5 GTGGCTTATG Hs.545933 CDNA clone IMAGE:5302821 7 24 3
CTCCATCCAG CSF3R colony stimulating factor 3 receptor
(granulocyte) 2 24 15
GAAGATTGAG STAT5A signal transducer and activator of
transcription 5A 6 24 4
TATATTTCCA SYF2/EIF4E3 (56 %)
SYF2 homolog, RNA splicing factor (S. cerevisiae)/eukaryotic translation initiation
factor 4E member 3 6 23 4 AAAAGCTTGA URB steroid sensitive gene 1 7 23 4 AATCTGAACC CLIC5 choride intracellular channel 5 6 23 4
GATTTTCTGG PSCD4 pleckstrin homology, Sec7 and coiled/coil
domains 4 7 23 3 GCACCAAAGC CCL3L3 chemokine (C-C motif) ligand 3-like 3 0 23 23
GGCAGGAGTA GBP1 guanylate binding protein 1, interferon-
inducible, 67kDa 7 23 3 TTAACACCTA MSR1 macrophage scavenger receptor 1 5 23 5
CTGGCCTTCG LDLRAP1 low density lipoprotein receptor adaptor
protein 1 5 23 5
GCACCTGTCG ANPEP
alanyl (membrane) aminopeptidase (aminopeptidase N, aminopeptidase M,
microsomal aminopeptidase, CD13, p150) 5 23 5 GCACAGGCCA EGFL7 EGF-like-domain, multiple 7 2 23 14 AAGCTGTTGT DNMT1 DNA (cytosine-5-)-methyltransferase 1 7 23 3 TTCAGTAATA VPS37C vacuolar protein sorting 37C (yeast) 6 23 4 AATCCGGGAG ZFP41 (55 %) zinc finger protein 41 homolog (mouse) 4 23 5
GATCACTGCT Hs.332649 (66 %)
transcribed locus,, strongly similar to XP_498081.1 PREDICTED: similar to Olfactory receptor 212 [Homo sapiens] 0 23 23
TGCCACCACG 0 23 23
TATACAGATT TANC2 (55 %) tetratricopeptide repeat, ankyrin repeat and
coiled-coil containing 2 3 22 7
TTCACATTAG CCT4 (39 %) chaperonin containing TCP1, subunit 4
(delta) 7 22 3 GGATGATTAT ALOX5 arachidonate 5-lipoxygenase 2 22 14 TCATAAATGA CLNS1A (39 %) chloride channel, nucleotide-sensitive, 1A 6 22 4 CCGGCCCTAC PDZK1IP1 PDZK1 interacting protein 1 7 22 3 AACCCAAGAG YIPF6 Yip1 domain family, member 6 7 22 3
CAAGGGGGGA Hs.529860 (51 %) Homo sapiens, clone IMAGE:3851018,
mRNA 6 22 3

60
GTGAACCCCT NT5C2 (43 %) 5'-nucleotidase, cytosolic II 2 22 13 AGTTTGAGAC Hs.613501 (66 %) transcribed locus 5 22 5 TGTTCATTTA SELENBP1 selenium binding protein 1 2 22 13 TGGACAAAGA DNAH5 (55 %) dynein, axonemal, heavy polypeptide 5 5 21 5
CCATTGCTCT ABCA11/PTGIR (39
%)
ATP-binding casseette, sub-family A (ABC1), member 11
(pseudogene)/prostaglandin 12 (prostacyclin) receptor (IP) 4 21 5
CCAGCAGTGG MRPL48 mitochondrial ribosomal protein L48 2 21 13 GTGAAACTTC ZNF517 zinc finger protein 517 5 21 5 GTGCTGTTTA 2 21 9 ATTAGTGTTG RPL7A (51 %) ribosomal protein L7a 5 21 4
TAAAGACTCT IQGAP2 IQ motif containing GTPase activating
protein 2 4 21 5 TGCCCTCAAG 5 21 4
GGGATAAAAT B4GALNT1/TCF20 Beta-1,4-N-acetyl-galactosaminyl transferase
1/transcription factor 20 (AR1) 6 21 3 TCTTTCTCAT COMMD8 COMM domain containing 8 6 21 3
GTTCACTGCA ICAM1 intercellular adhesion molecule 1 (CD54),
human rhinovirus receptor 4 21 5
AGCCTGGGAG ACSL6 (55 %) acyl-CoA synthetase long-chain family
member 6 3 21 6
ATAGTGCCAC Hs.562075 (49 %)
transcribed locus, moderately similar to XP_508169.1 PREDICTED: hypothetical
protein XP_508169 [Pan troglodytes] 7 21 3
GTCTCCTAAT GPRC5A G protein-coupled receptor, family C, group
5, member A 5 21 4
TATTTATATG IFIT3/ATP2B4
interferon-induced protein with tetratricopeptide repeats 3/ATPase, Ca++
transporting, plasma membrane 4 5 20 4 GGGATTTAGA no match 4 20 5
TTAAGAAGCC ACAD8 acyl-Coenzyme A dehydrogenase family,
member 8 5 20 4 ATAAAGGTTC STRBP spermatid perimuclear RNA binding protein 5 20 4 AAAAGATTAA FMO2 flavin containing monooxygenase 2 2 20 10 AACCCCGGAG RAD50 (49 %) RAD50 homolog (S. cerevisiae) 0 20 20 ATGCTTGCTT ADFP adipose differentiation-related protein 4 20 5
TGCCTATAAT CPT2/TMEM111 carnitine palmitoyltransferase II/transmembrane protein 111 5 20 4
CAAACTAACC IGHG1 immunoglobulin heavy constant gamma 1
(G1m marker) 2 20 12 GTTTCAGGAG SIRPA signal-regulatory protein alpha 2 20 8