IDENTIFICATION OF CEREAL VARIETIES BY GEL...
25
CHAPTER 5 IDENTIFICATION OF CEREAL VARIETIES BY GEL ELECTROPHORESIS OF THE GRAIN PROTEINS C. W. WRIGLEY CS/RO Wheat Research Unit North Ryde, NSW, Australia J.C. AUTRAN /NRA Laboratoire de Techno/ogie des Cereales Montpel/ier, France W.BUSHUK Department of Plant Science University of Manitoba Winnipeg, Canada I. INTRODUCTION The many factors that determine the price and suitability for processing of cereal grain can be divided into two groups: seasonal factors and inherited factors. Seasonal factors are largely determined by growing, harvesting, and storage conditions. These aspects of quality are readily tested and include moisture content, test weight, soundness of the grain, and the presence of contaminants. On the other hand, many other aspects of quality are bred into the seed long before the grower receives it. These factors include milling yield, flour color, and the strength, stickiness, and extensibility of the dough in wheat, and malting quality in barley. The comprehensive testing of these characteristics upon receipt at the grain elevator would be impossible. Fortunately, such testing is not necessary, because these factors are largely defined by varietal specification. Some rapid tests, such as the Bolling test for nonbread wheats (Jonas, 1978), have been devised for on-the-spot identification of grain with undesirable quality. However, most wheat producing countries have adopted a system of assuring the quality characteristics of the grain they receive by restricting deliveries to certain suitable varieties. Because the prices paid for grain often vary, an ability to identify the variety of 211
Transcript of IDENTIFICATION OF CEREAL VARIETIES BY GEL...
CHAPTER 5
IDENTIFICATION OF CEREAL VARIETIES BY GEL ELECTROPHORESIS OF THE GRAIN PROTEINS
C. W. WRIGLEY CS/RO Wheat Research Unit North Ryde, NSW, Australia
J.C. AUTRAN /NRA Laboratoire de Techno/ogie des Cereales Montpel/ier, France
W.BUSHUK Department of Plant Science University of Manitoba Winnipeg, Canada
I. INTRODUCTION
The many factors that determine the price and suitability for processing of cereal grain can be divided into two groups: seasonal factors and inherited factors. Seasonal factors are largely determined by growing, harvesting, and storage conditions. These aspects of quality are readily tested and include moisture content, test weight, soundness of the grain, and the presence of contaminants.
On the other hand, many other aspects of quality are bred into the seed long before the grower receives it. These factors include milling yield, flour color, and the strength, stickiness, and extensibility of the dough in wheat, and malting quality in barley. The comprehensive testing of these characteristics upon receipt at the grain elevator would be impossible. Fortunately, such testing is not necessary, because these factors are largely defined by varietal specification. Some rapid tests, such as the Bolling test for nonbread wheats (Jonas, 1978), have been devised for on-the-spot identification of grain with undesirable quality. However, most wheat producing countries have adopted a system of assuring the quality characteristics of the grain they receive by restricting deliveries to certain suitable varieties.
Because the prices paid for grain often vary, an ability to identify the variety of
211
212 / Advances in Cereal Science and Technology, Vol. V
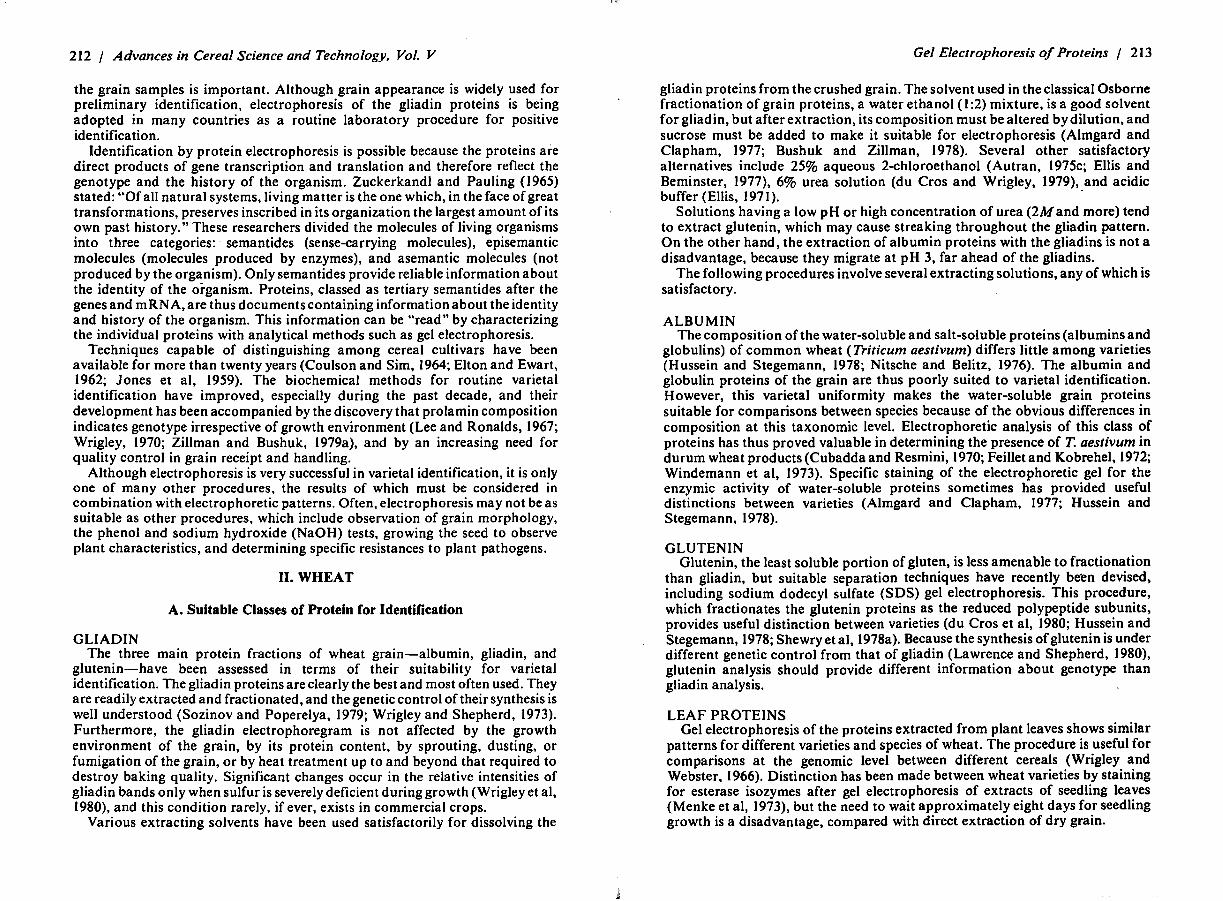
the grain samples is important. Although grain appearance is widely used for preliminary identification, electrophoresis of the gliadin proteins is being adopted in many countries as a routine laboratory procedure for positive identification.
Identification by protein electrophoresis is possible because the proteins are direct products of gene transcription and translation and therefore reflect the genotype and the history of the organism. Zuckerkandl and Pauling ( 1965) stated: "Of all natural systems, living matter is the one which, in the face of great transformations, preserves inscribed in its organization the largest amount of its own past history." These researchers divided the molecules of living organisms into three categories:· semantides (sense-carrying molecules), episemantic molecules (molecules produced by enzymes), and asemantic molecules (not produced by the organism). Only semantides provide reliable information about the identity of the organism. Proteins, classed as tertiary semantides after the genes and mRN A, are thus documents containing information about the identity and history of the organism. This information can be "read" by characterizing the individual proteins with analytical methods such as gel electrophoresis.
Techniques capable of distinguishing among cereal cultivars have been available for more than twenty years (Coulson and Sim, 1964; Elton and Ewart, 1962; Jones et al, 19 59). The biochemical methods for routine varietal identification have improved, especially during the past decade, and their development has been accompanied by the discovery that prolamin composition indicates genotype irrespective of growth environment (Lee and Ronalds, 1967; Wrigley, 1970; Zillman and Bushuk, 1979a), and by an increasing need for quality control in grain receipt and handling.
Although electrophoresis is very successful in varietal identification, it is only one of many other procedures, the results of which must be considered in combination with electrophoretic patterns. Often, electrophoresis may not be as suitable as other procedures, which include observation of grain morphology, the phenol and sodium hydroxide (NaOH) tests, growing the seed to observe plant characteristics, and determining specific resistances to plant pathogens.
II. WHEAT
A. Suitable Classes of Protein for Identification
GLIADIN The three main protein fractions of wheat grain-albumin, gliadin, and
glutenin-have been assessed in terms of their suitability for varietal identification. The gliadin proteins are clearly the best and most often used. They are readily extracted and fractionated, and the genetic control of their synthesis is well understood (Sozinov and Poperelya, 1979; Wrigley and Shepherd, 1973). Furthermore, the gliadin electrophoregram is not affected by the growth environment of the grain, by its protein content, by sprouting, dusting, or fumigation of the grain, or by heat treatment up to and beyond that required to destroy baking quality. Significant changes occur in the relative intensities of gliadin bands only when sulfur is severely deficient during growth (Wrigley et al, 1980), and this condition rarely, if ever, exists in commercial crops.
Various extracting solvents have been used satisfactorily for dissolving the
Gel Electrophoresis of Proteins / 213
gliadin proteins from the crushed grain. The solvent used in the classical Osborne fractionation of grain proteins, a water ethanol (I :2) mixture, is a good solvent for gliadin, but after extraction, its composition must be altered by dilution, and sucrose must be added to make it suitable for electrophoresis (Almgard and Clapham, 1977; Bushuk and Zillman, 1978). Several other satisfactory alternatives include 25% aqueous 2-chloroethanol (Autran, I 975c; Ellis and Beminster, 1977), 6% urea solution (du Cros and Wrigley, 1979), and acidic buffer (Ellis, 197 I). -
Solutions having a low pH or high concentration of urea (2M and more) tend to extract glutenin, which may cause streaking throughout the gliadin pattern. On the other hand, the extraction of albumin proteins with the gliadins is not a disadvantage, because they migrate at pH 3, far ahead of the gliadins.
The following procedures involve several extracting solutions, any of which is satisfactory.
ALBUMIN The composition of the water-soluble and salt-soluble proteins (albumins and
globulins) of common wheat ( Triticum aestivum) differs little among varieties (Hussein and Stegemann, 1978; Nitsche and Belitz, 1976). The albumin and globulin proteins of the grain are thus poorly suited to varietal identification. However, this varietal uniformity makes the water-soluble grain proteins suitable for comparisons between species because of the obvious differences in composition at this taxonomic level. Electrophoretic analysis of this class of proteins has thus proved valuable in determining the presence of T. aestivum in durum wheat products (Cubadda and Resmini, 1970; Feillet and Kobrehel, 1972; Windemann et al, 1973). Specific staining of the electrophoretic gel for the enzymic activity of water-soluble proteins sometimes has provided useful distinctions between varieties (Almgard and Clapham, 1977;· Hussein and Stegemann, 1978).
GLUTENIN Glutenin, the least soluble portion of gluten, is less amenable to fractionation
than gliadin, but suitable separation techniques have recently be~n devised, including sodium dodecyl sulfate (SDS) gel electrophoresis. This procedure, which fractionates the glutenin proteins as the reduced polypeptide subunits, provides useful distinction between varieties (du Cros et al, 1980; Hussein and Stegemann, I 978; Shewry et al, I 978a). Because the synthesis of glutenin is under different genetic control from that of gliadin (Lawrence and Shepherd, I 980), glutenin analysis should provide different information about genotype than gliadin analysis.
LEAF PROTEINS Gel electrophoresis of the proteins extracted from plant leaves shows similar
patterns for different varieties and species of wheat. The procedure is useful for comparisons at the genomic level between different cereals (Wrigley and Webster, 1966). Distinction has been made between wheat varieties by staining for esterase isozymes after gel electrophoresis of extracts of seedling leaves (Menke et al, 1973), but the need to wait approximately eight days for seedling growth is a disadvantage, compared with direct extraction of dry grain.

214 / Advances in Cereal Scien ce and Technology, Vol. V
B. Sample Preparation
Because electrophoretic identifica tio n is basically a comparative technique, authentic samples of the varieties must be used . Standa rd samples from a central wheat collection should be compared to pedigreed seed in use loca lly. A routine p ractice is to group samples, so that those of the same decla red variety a re examined together on the same gel that has an authentic sa mple of the variety.
Examination of a wheatmeal sam ple is reco mmended for initial electrophoretic identification because the act of grinding serves to average the contributions of many seeds, thus providing a n indication of purity as well as identity. The fineness of grinding is not critical, but if the sa mple is only coarsely ground , a portion larger than I g must be taken to avoid possible sa mpling error.
If the sample is heterogeneous, grains must be examined individually, a nd the results must be statistically analyzed. Each grain can be c rushed with a hamme r o r a pair of pliers or cut into small pieces with a scalpel. Paulis and Wall ( 1979) described a small "mill" for single grains.
Knowledge of the phenol reaction of individual gra ins is helpful for preliminary identificatio n. Phenol-trea ted grains should be soaked in water to remove excess phenol before they are extracted for electrophoresis (Wrigley a nd McCausland, 1975). Alternatively, the end or some of the bran layer from a dry grain should be cut off, a nd the cut surface of the piece should be placed o n phenol-soaked paper (Wrigley, 1976a). The bulk of the grain is then available for electrophoretic a nalysis.
A major advantage of electrophoretic analysis is that it can be applied to milled products, to various processed foods (Wrigley, 1977a), a nd to grain that is pinched , immature, sprouted , fumigated , or discolored. Satisfactory results can be o btained with sa mples that are quite o ld (stored for as long as 125 yea rs), but examina ti on of archeological sam ples has not been successful (Zeven et al, 1975) .
C. Starch Gel Electrophoresis of Gliadins
PRINCIPLE Electrophoretic separation of gliadins produces a pattern of bands that is
characteristic for the va riety. Early investigators of gliad in fractionation d emonstrated the potentia l value of sta rch gel electrophoresis (Bourdet et al, 1963; Coulson and Sim, 1964; Doekes, 1969; Elton and Ewart, 1962; Feillet a nd Bourdet, 1967; Gra ha m, 1963; Lee a nd Wrigley, 1963). Ellis ( 1971) first proposed a systemati c key based on starch gel electroph oregrams (electrophoretic patterns) and later suggested other tests (phenol test, kernel ha rdness, and coleo ptile color). Identification required several days and cou ld not be applied to samples con taining a mixture of varieties. More rece ntly, the potential of this work was translated into an effective procedure of va rieta l identification based on starch gel electrophoresis of gliadins a lone (Autran, 1973; Autra n and Bo urdet , 1973, 1975a; Wrigley a nd S hepherd , 1974) .
In the most commonly used methods, electrophoresis is done in acidic buffered sta rch gel, which acts as support medium. At such a pH , gliadin proteins are positively cha rged , a nd in the applied e lectric field they migrate towards the cathode and sepa rate into individua l bands according to the electric charge density and molecular size. After electrophoresis, the gel is stained to reveal the
Gel Electrophoresis of Proteins / 215
location of the protein bands (Fig. 1). These pa tterns (electrophoregrams) are related to genetic co nstitution and are the "fingerprints" of va rieties. Beca use most wheat varieties have unique gliadin patterns, the variety of an un known sa mple ca n be ide nt ified by its gliadi n e lectrophoregram. If a sa mple is suspected of being a mi xtu re of varieties, the single kernel technique can be used to d etermine the va rieties in the mixture and to obtain information about the composition (Autran and Bourdet , 1975b, 1975c; Wrigley and Baxter, 1974; Wrigley a nd McCausland , 1975).
T he followi ng procedure is used regularly in many European countries to check the adhe rence to the varieta l specification of contracts, especially when d isc repancies exist in technological tests.
--~._..._._ -Figure I. Electrophoregrams of gliad in proteins extracted with 2-chloroethanol 25% on 10% starch gel containing alumi num lactate (pH 3.20). Time of electrophoresis: five hours at 8 V / cm. Varieties are (from left): Val my. Bocquiau, Rudi. Roa zon. Capito le, Eloi, Rafa. Vilmorin 53. Wattines, Cappelle, Remois. Top. (From Autran, 1979)

216 / Advances in Cereal Science and Technology, Vol. V
APPARATUS The apparatus, which is made of acrylic sheet, comprises the gel compartment
and two electrode buffer tanks. It is available from Apelex (92220 Bagneux, France) or from 0.S.I. (75739 Paris Cedex 15, France).
In the routine procedure the gel is cast in the gel former (300 X 170 X 9 mm), the ends of which form bridges that cause the gel to be in direct contact with the buffer (Autran, 1979). At the recommended voltage, overheating does not occur, and the gel need not be cooled. However, control of gel temperatures is recommended to improve the quality of the electrophoregram. Other apparatuses are available that use cool water for higher voltages (Wrigley and McCausland, 1975).
The power supply should be capable of delivering 400 V and I 00 mA.
PROCEDURE_ The following procedure employs the Apelex apparatus.
1. To prepare the gel former, close the lower openings to the bridges with adhesive tape. Insert a sheet of glass (285 X 169 X 2 mm) into the gel former and place the apparatus in a horizontal position. Aluminum lactate buffer(µ = 0.0045, 0.5Murea, pH 3.20) is used to prepare the gel. Prepare two volumes of buffer solution. Heat the first one (360 ml) to boiling, and mix the second one (120 ml) carefully with 50 g of hydrolyzed starch (Connaught Laboratories, Toronto, Canada) in a 1-L beaker. Add the boiling buffer to the starch in suspension and mix vigorously in a blender for 30 seconds. Pour the resulting slurry into the gel former and cool the gel for 45 minutes at laboratory temperature or in a refrigerator. Finally, remove the adhesive tape and place the gel former horizontally on the electrode tanks filled with buffer solution, and cover the gel with plastic film to limit dehydration.
2. Prerun the gel to remove ionic impurities by applying 250 V across the gel (8 V /cm) for 75 minutes at a current of 35-40 mA.
3. Gliadin proteins should be extracted from single kernels to prevent the effects of possible contaminants. Place each kernel between folded paper and crush with a hammer or pliers. Transfer the crushed grain into microtubes or into wells of a microtiter plate and add extracting solvent (25% 2-chloroethanol in water containing 0.2% pyronin G) (Prolabo, 75526 Paris Cedex 11, France). Use 3 µl of solvent per 1 mg of grain. Mix with individual glass rods and allow extraction to proceed overnight at laboratory temperature. Alternatively, gliadins can be extracted with I Murea from flour or wheatmeal (du Cros and Wrigley, 1979). Extraction time can be reduced to one to two hours (Autran, 1979) or even to IO minutes if an ultrasonic apparatus is used (Technicon, 95330 Domont, France). Centrifuge for 10 minutes to clarify extract.
4. Using a lancet and an acrylic guide, cut I 0-mm-long, regularly spaced vertical slits in the gel in a line about 3 cm from the anodic end of the gel. Apply gliadin samples into the slots in the gel by means of rectangles (5 X 10 mm) of Whatman No. 3 filter paper soaked in the gliadin extracts.
5. Turn on the power supply (8 V /cm of gel) and continue the electrophoresis until the pyronin G dye marker has migrated 17 cm (about five hours).
6. Turn off the power supply. Release the gel from the gel former using a scalpel. Lift out the 2-mm glass plate and insert a 3-mm glass plate of identical size. Slice the gel horizontally with stainless or nylon wire. Discard the top and
Gel Electrophoresis of Proteins / 217
transfer the bottom portion of the gel that remains on the plate into a plastic container for staining. Submerge the gel in staining solution (500 ml of0.05% nigrosine and 2% trichloroacetic acid in water) and leave overnight.
RECORDING RESULTS Electrophoretic bands are clearly visible after overnight staining. Staining may
be hastened by raising the temperature or dye concentration (Aragoncillo et al, 1975). After staining, excess nigrosine should be removed from the gel by transferring it to 40% ethanol solution. The electrophoregrams can be interpreted within one hour. Results can usually be assessed by direct examination of the gel, but if a permanent record is required, the gel can be photographed in reflected light or scanned in a recording densitometer using reflected light. The gel can also be stored for several weeks in 95% ethanol solution.
DISCUSSION Starch gel was the first support medium that gave a satisfactory resolution of
gliadins to make the procedure effective for varietal identification. The starch gel procedure has several other advantages. Simple equipment is used that does not require cooling; the fastest-moving gliadin bands have good resolution; and the support material (starch) is nontoxic.
However, starch gel also has many drawbacks (Autran et al, 1981). Resolution is influenced by stirring and heating conditions of the starch slurry, and resolution of the slowest-moving gliadin bands is poor. Uniform and reproducible gels are difficult to make because the consistency of commercial batches of starch varies; pre-electrophoresis is generally required for consistent results. Gels must be sliced before interpretation and therefore must be thicker, increasing the cost. Densitometer scans are of questionable accuracy. Application with paper rectangles requires very concentrated extracts. In spite of these disadvantages, however, the starch gel procedure, introduced in 1975, is still routinely used in many European laboratories for . wheat variety identification. Interpretation of electrophoregrams derives from a scheme of varietal formulas (Autran and Bourdet, 1973) (Table I). The electrophoregram of each variety comprises about 20 bands. A total of 50 different gliadin bands have been identified among European wheat varieties.
A chemotaxonomic key, similar to that used for botanical flora, was developed for wheat. It is based on the presence or the absence of certain specific bands and, through a dichotomic approach, unambiguously identifies most of the varieties grown in European countries (Table II).
So far, the starch gel procedure has been used only on a small laboratory scale. At least one attempt has been made to scale up and automate the procedure using the "Gliaphore" apparatus (Technicon Company, 95330 Domont, France). The apparatus can analyze as many as 100 kernels per day, but because the electrophoregrams obtained by this procedure are significantly different from those obtained by the more commonly used procedure, it is more effective for identifying a small number of excluded varieties than for identifying a large number of varieties, using the published key.
218 / Advances in Cereal Science and Technology, Vol. V
Relative Mobilitiesb
21 22 25 26 28 30 33 34 37 39 4) 43 44 45 46 49 50 52 53 55 56 57 59 60 62 65 68 69 7J 72 74 75 77 79 80 8) 82 83 85 86 88 90 91 93 94 96 98 99
JOO 105
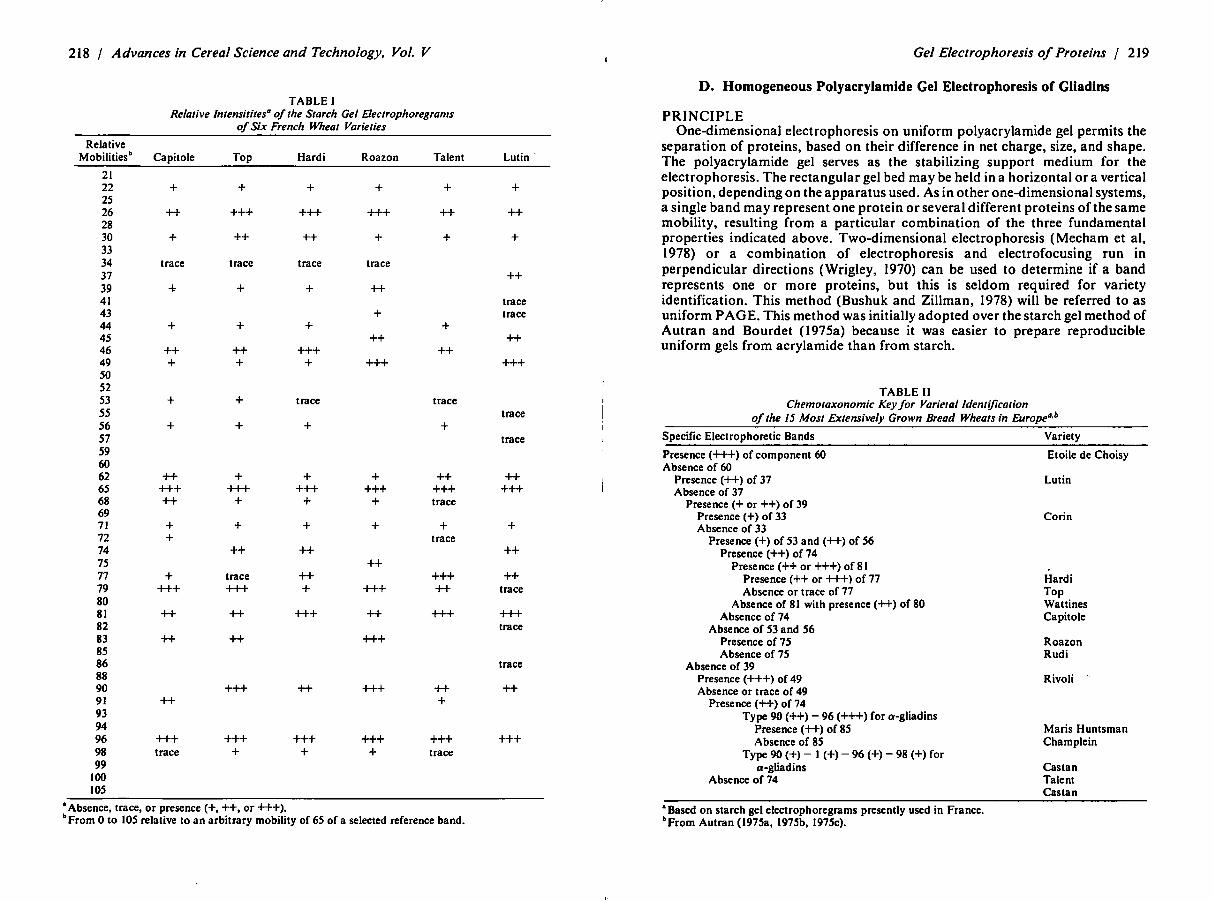
TABLE I Re/alive lntensitites0 of the Starch Gel E/ectrophoregrams
of Six French Wheat Varieties
Capito le
+
++
+
trace
+
++ +
+
+
++ +++ ++
+ +
+ +++
++
++
++
+++ trace
Top
+
+++
++
trace
+
+
++ +
+
+
+ +++ +
+
Hardi
+
+++
++
trace
+
+
+++ +
trace
+
+ +++ +
+
++ ++
trace +++
++
++
+++
+++ +
++ +
+++
++
+++ +
Roazon
+
+++
+
trace
++
+
++
+++
+ +++ +
+
++
+++
++
+++
+++
+++ +
Talent
+
++
+
+
++
trace
+
++ +++ trace
+ trace
+++ ++
+++
++ +
+++ trace
•Absence, trace, or presence(+,++, or+++). bFrom 0 to 105 relative to an arbitrary mobility of 65 of a selected reference band.
Lutin ·
+
++
+
++
trace trace
++
+++
trace
trace
++ +++
+
++
++ trace
+++ trace
trace
++
+++
Gel Electrophoresis of Proteins / 219
D. Homogeneous Polyacrylamide Gel Electrophoresis of Gliadins
PRINCIPLE One-dimensional electrophoresis on uniform polyacrylamide gel permits the
separation of proteins, based on their difference in net charge, size, and shape. The polyacrylamide gel serves as the stabilizing support medium for the electrophoresis. The rectangular gel bed may be held in a horiz<?ntal or a vertical position, depending on the apparatus used. As in other one-dimensional systems, a single band may represent one protein or several different proteins of the same mobility, resulting from a particular combination of the three fundamental properties indicated above. Two-dimensional electrophoresis (Mecham et al, 1978) or a combination of electrophoresis and electrofocusing run in perpendicular directions (Wrigley, 1970) can be used to determine if a band represents one or more proteins, but this is seldom required for variety identification. This method (Bushuk and Zillman, 1978) will be referred to as uniform PAGE. This method was initially adopted over the starch gel method of Autran and Bourdet (1975a) because it was easier to prepare reproducible uniform gels from acrylamide than from starch.
TABLE II Chemotaxonomic Key for Varietal Identification
of the 15 Most Extensively Grown Bread Wheats in Europea.b
Specific Electrophoretic Bands
Presence (+++) of component 60 Absence of 60
Presence (++) of 37 Absence of 37
Presence(+ or++) of 39 Presence (+) of 33 Absence of 33
Presence (+) of 53 and (++)of 56 Presence (++) of 74
Presence (++ or+++) of 81 Presence (++ or +++) of 77 Absence or trace of 77
Absence of 81 with presence(++) of 80 Absence of 74
Absence of 53 and 56 Presence of 75 Absence of 75
Absence of 39 Presence(+++) of 49 Absence or trace of 49
Presence(++) of 74 Type 90 ( ++) - 96 ( +++) for a-gliadins
Presence(++) of 85 Absence of 85
Type 90 (+) - 1 (+) - 96 (+) - 98 (+)for a-gliadins
Absence of 74
•Based on starch gel electrophoregrams presently used in France. bFrom Autran (J975a, J975b, J975c).
Variety
Etoile de Choisy
Lu tin
Corin
Hardi Top Wattines Capito le
Roazon Rudi
Rivoli
Maris Huntsman Champlein
Castan Talent Castan
220 / Advances in Cereal Science and Technology, Vol. V
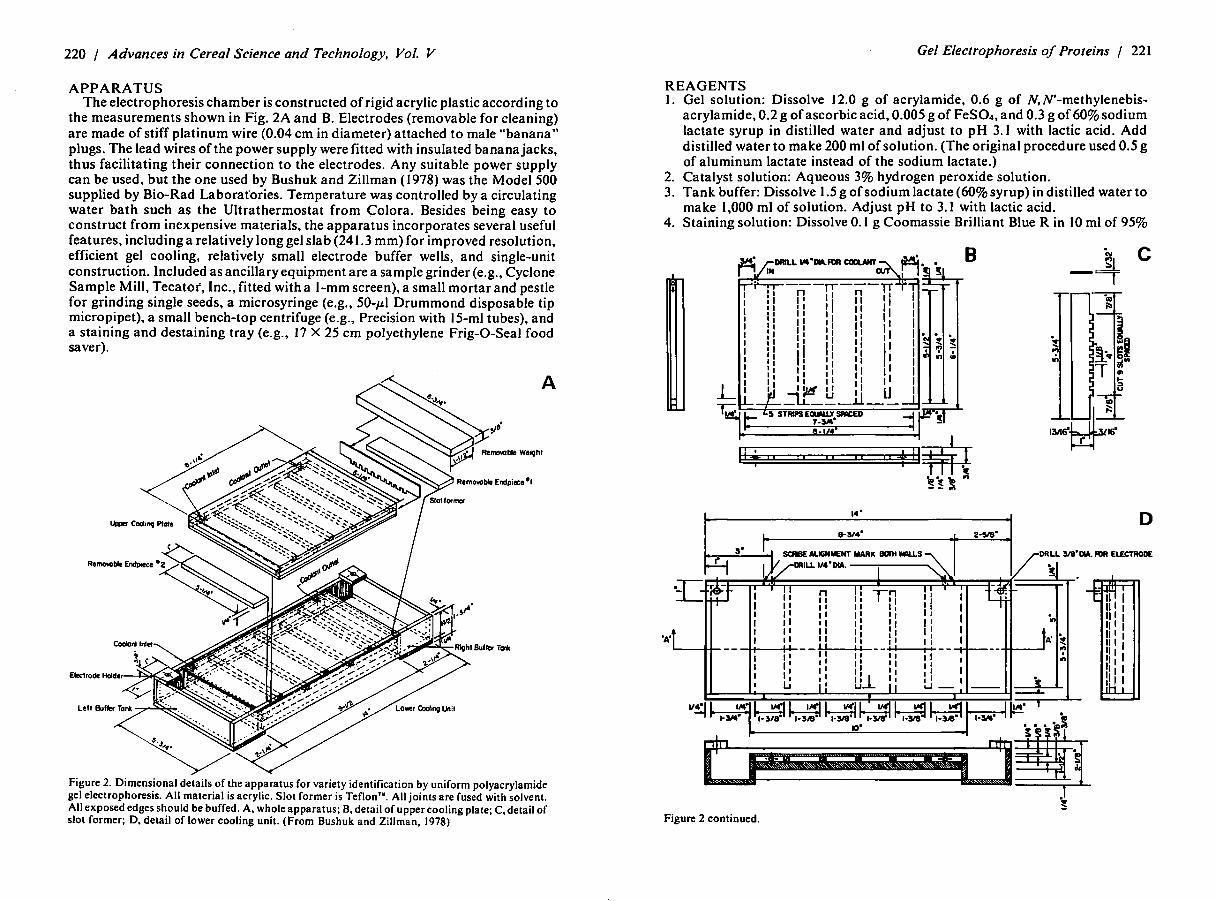
APPARATUS The electrophoresis chamber is constructed of rigid acrylic plastic according to
the measurements shown in Fig. 2A and B. Electrodes (removable for cleaning) are made of stiff platinum wire (0.04 cm in diameter) attached to male "banana" plugs. The lead wires of the power supply were fitted with insulated banana jacks, thus facilitating their connection to the electrodes. Any suitable power supply can be used, but the one used by Bushuk and Zillman (I 978) was the Model 500 supplied by Bio-Rad Laborat·ories. Temperature was controlled by a circulating water bath such as the Ultrathermostat from Colora. Besides being easy to construct from inexpensive materials, the apparatus incorporates several useful features, including a relatively long gel slab (241.3 mm) for improved resolution, efficient gel cooling, relatively small electrode buffer wells, and single-unit construction. Included as ancillary equipment are a sample grinder (e.g., Cyclone Sample Mill, Tecator, Inc., fitted with a I-mm screen), a small mortar and pestle for grinding single seeds, a microsyringe (e.g., 50-µl Drummond disposable tip micropipet), a small bench-top centrifuge (e.g., Precision with 15-ml tubes), and a staining and destaining tray (e.g., 17 X 25 cm polyethylene Frig-0-Seal food saver).
A
Upper Coclinc;i Pla1e
Figure 2. Dimens.ional details.of ~he ap~aratus for variety identification by uniform polyacrylamide gel electrophoresis. All material 1s acryhc. Slot former is Teflon'". All joints are fused with solvent. All exposed edges s~ould be buffed .. A, wh.ole apparatus; B. detail of upper cooling plate; C, detail of slot former; D. detail of lower coolmg umt. (From Bushuk and Zillman. 1978)
Gel Electrophoresis of Proteins / 221
REAGENTS I. Gel solution: Dissolve 12.0 g of acrylamide, 0.6 g of N,N'-methylenebis
acrylamide, 0.2 g of ascorbic acid, 0.005 g of FeSQ4, and 0.3 g of 60% sodium lactate syrup in distilled water and adjust to pH 3.1 with lactic acid. Add distilled water to make 200 ml of solution. (The original procedure used 0.5 g of aluminum lactate instead of the sodium lactate.)
2. Catalyst solution: Aqueous 3% hydrogen peroxide solution. 3. Tank buffer: Dissolve 1.5 g of sodium lactate (60% syrup) in distilled water to
make 1,000 ml of solution. Adjust pH to 3.1 with lactic acid. 4. Staining solution: Dissolve 0. I g Coomassie Brilliant Blue R in IO ml of 95%
B r-.,-----rr---rr·
: n n 11 I ! 11 I I 11 i I 11 I I 11
! i 11 I I 11 : I 11 I I~ LJ ..:u:_~_ll_ - ~1----L
S STRIPS EQUAU.Y SRICED 7.3.41•
14• D 9-314"
DRU 318°DIA. FOR ELECTRODE
'A' A'~ ---- '? .,,
Figure 2 continued.

222 / Advances in Cereal Science and Technology, Vol. V
ethanol, filter through glass wool, and add to 250 ml of 12% trichloroacetic acid.
5. Destaining solution: 250 ml of 12% trichloroacetic acid. 6 .. Gliadin solvent: 70% aqueous ethanol. 7. Powdered sucrose. 8. Methyl green dye.
Sodium lactate can be obtained from Fisher Chemicals, aluminum lactate can be obtained from Research Organic/ Inorganic Chemical Corp. (Sun Valley, CA), and Coomassie Brilliant Blue R from Sigma Chemical Company (St. Louis, MO). The hydrogen peroxide was purchased locally. All remaining
· chemicals are of reagent grade and were obtained from Fisher Chemicals.
PROCEDURE _ Preparation of Gliadin l. Extract a sample (0.5 g) of wheat meal (l mm sieve) or flour with three times
its weight ( 1.5 ml) of 70% aqueous ethanol in a stoppered centrifuge tube. The mixture is vortexed periodically during the extraction period of 60 minutes at room temperature. If the grain sample may be a mixture of varieties, meal of single kernels should be extracted.
2. Centrifuge the contents for 10 minutes at 20,000 g at room temperature. 3. Decant the supernatant into a clean test tube and mix with two times its
volume (2 ml) of tank buffer. 4. Dissolve powdered sucrose in the sample solution to a concentration of 30%
w / v to increase the density and facilitate sample application. 5. Add methyl green (0.02 g) to serve as a tracking dye during electrophoresis. Preparation of the Gel l. To prepare the apparatus for gel polymerization, insert the two removable
acrylic end pieces into each end of the lower cooling unit, thus forming a gel tray. Allow the coolant (water at 21°C) to circulate through both the upper and lower gel cooling plates for five minutes.
2. Chill 200 ml of gel solution in a 400 ml beaker to 1°C before adding the catalyst. Add one ml of peroxide catalyst, swirl the mixture briefly, and pour quickly into the gel tray.
3. Immediately place the upper cooling plate over the gel solution. To avoid trapping air bubbles under the cooling plate, bring one edge of the plate into contact with the edge of the gel solution, and then gradually lower the other end. Through this method, excess gel and air are forced out over the far edge of the gel tray.
4. Place the slot former (usually IO-place) against the end of the upper cooling plate so that the slot teeth protrude into the uncovered portion of the gel solution. Hold in place during polymerization with a heavy strip of acrylic that also covers the remaining end of the gel solution, thereby making the gel of overall uniform thickness.
5. During gel polymerization, which occurs quickly, do not disturb the apparatus for 5-10 minutes before removing the three removable pieces of acrylic and the slot-former .. Remove these carefully and without disturbing the gel.
6. Position the electrodes in the buffer compartments so that they extend the entire width of the gel and are parallel to each end .. Then fill both
Gel Electrophoresis of Proteins / 223
compartments with tank buffer to a level even with the upper surface of the gel.
Sample Application l. Just before the start of electrophoresis, carefully deposit 20 µl of sample
solution into each slot with a microsyringe. Sample application is easier if the slots are first filled with buffer so that the sample solution, which is more dense settles uniformly into the slot, displacing the buffer.
2. The t~o outer slots are generally used for the reference sample (e.g., Marquis), while the remaining eight slots accommodate the test samples.
Electrophoresis . I. Connect the lead wires to the electrodes and to the power supply, makmg
certain that the slot end of the gel is the anode. 2. Perform the electrophoresis at a constant current of I00-110 mA. This
corresponds to a voltage of about 16 V /cm at the beginning of the run, which decreases to 14 V /cm by the end.
3. To maximize the separation of gliadin bands, continue electrophoresis for 30 minutes after the second dye band has migrated out of the gel. This usually results in a total run time of 5-5.5 hours.
4. At the conclusion of electrophoresis, remove the upper cooling plate, and transfer the gel to a -staining tray. The transfer is best done with a thin sheet of acrylic cut to the same width as the gel and with one end bevelled. Carefully slide the acrylic sheet under the gel and lift to remove the gel.
Staining . . . .. l. To stain the protein bands, allow the gel to remam m the Coomass1e Brllh~nt
Blue solution for 48 hours. Cover the staining tray to prevent evaporation during this period. Gentle agitation during staining diminishes precipitation of the dye on the gel surface. Precipitate detracts from the appearance of the stained gel and subsequent photographs.
2. To maximize the clarity of the stained bands, destain the gel for 24 hours in 250 ml of 12% aqueous trichloroacetic acid. Use a cotton swab to remove precipitated dye adhering to the gel surface.
Photography l. After destaining, transfer the gel from the tray onto a sheet of clear glass and
rinse with water. 2. Illuminate the gel from below by means of a fluorescent light ~ox a~d
photograph on Kodak 5069 high-contrast copy film. Develop the fllm with D 19 developer.
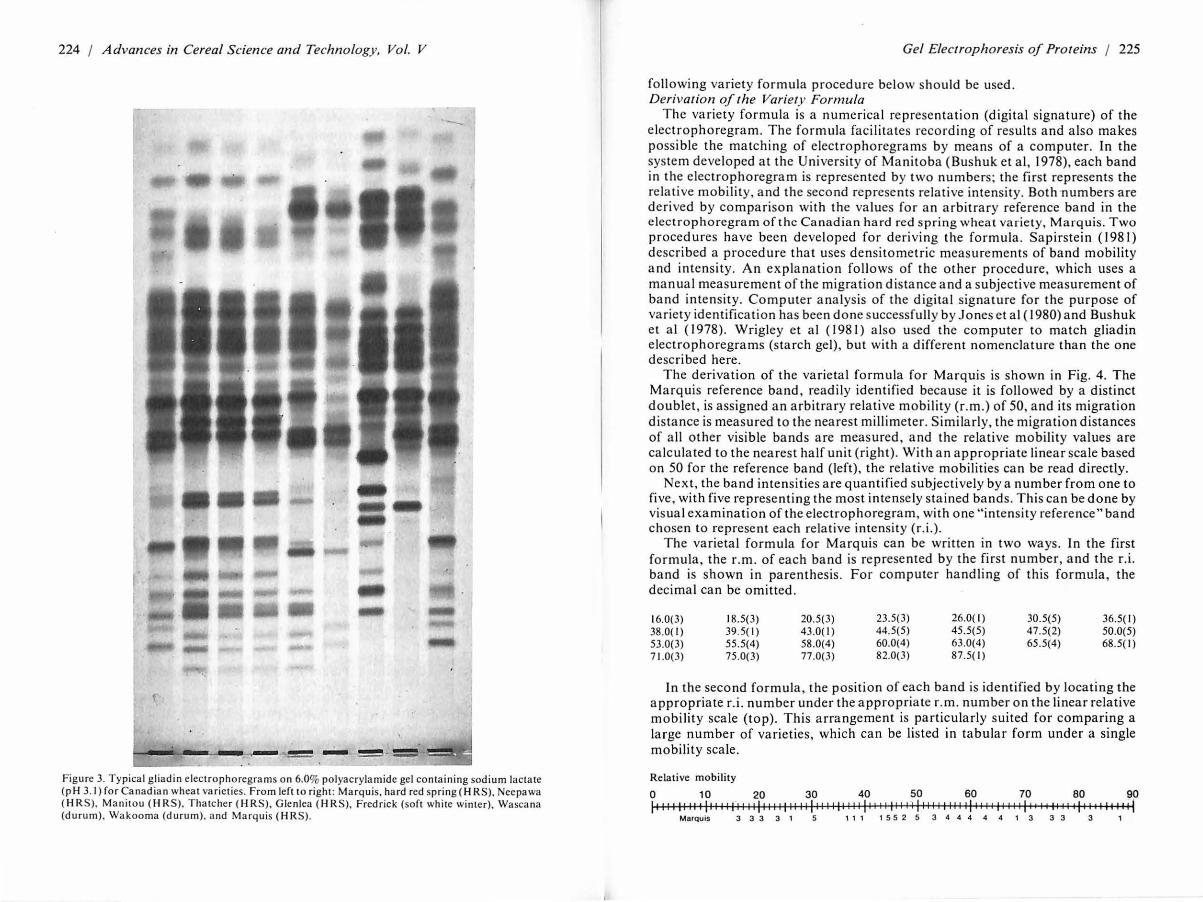
3. Print on Kodak Ektamatic SC type F paper. Conditions of printing vary among individual negatives. Figure 3 shows electrophoregrams obtained by this procedure for Canadian wheat varieties.
APPLICATION FOR VARIETY IDENTIFICATION Visual Comparison of Electrophoregrams .
For routine identification, the electrophoregram of the unknown sample is compared visually with the electrophoregrams of k~own varieties in ~he photographic library. With some experience, this comparison can be made fairly quickly. If necessary, the identity can be confirmed by running the extracts of the unknown and the known variety as adjoining electrophoregrams in a single gel. For a numerical record or for computer matching of the electrophoregram, the
224 / Advances in Cereal Science and Technology, Vol. V
·-
Figure 3. Typical gliadin electrophoregrams on 6.0% polyacrylamide ge l containing sodium lactate (pH 3. 1) for Canadian wheat varieties. From left to right : Ma rqu is. hard red spring ( HRS), Neepawa (HRS). Manitou (H RS), Thatcher (HRS), Glenlca (H RS), Fredrick (soft whi te winter), Wascana (durum), Wakooma (durum). and Marquis (HRS).
Gel Electrophoresis of Proteins / 225
following variety formula procedure below should be used . Derivation of the Variety Formula
T he variety formula is a numerica l representati on (d igi tal signat ure) of the electrophoregram. The form ula facilitates reco rding of results and also makes possible the matching of elect ro phoregrams by means of a computer. In the system developed at the University of Manitoba (Bushuk et al, 1978), each band in the electrophoregram is represented by two numbers; the fi rst represents the relative mobility, and the second re presents relative intensity. Both numbers are d erived by comparison with the values for an arbi t rary reference band in the e lectrophoregram of the Canad ia n ha rd red spring wheat variety, Marquis. T wo procedures have been d eveloped for deriving the formula. Sapirstein ( 1981) described a procedure tha t uses densitometric measurements of band mobility a nd intensity. An explanation fo llows of the other procedure, which uses a manual measureme nt of the migration distance and a subjective measurement of band intensity. Computer analysis of the d igital signature for the purpose of variety identificat ion has been done successfully by Jones et al ( 1980) and Bushuk et a l ( 1978). Wrigley et al (198 1) also used the computer to match gliadin elect rophoregrams (starch gel), but with a different nomenclature than the one described here.
The derivation of the varietal formula for Marquis is shown in Fig. 4. T he Marquis reference band , readily identified because it is followed by a distinct doublet, is assigned a n arbit rary relative mob ility (r.m .) of 50, and its migration distance is measured to the nearest millimeter. Similarly, the migration distances of a ll other visible bands a re measured , and the relative mobility values are calcula ted to the nearest ha lf unit (right). With an a ppropriate linear scale based on 50 for the reference band (left) , the relative mobilities can be read di rectly.
Nex t, the band intensities a re quantified subjectively by a number from one to fi ve, with five represe nting the most inte nsely stained bands. This can be d one by visua l examination of the electrop horegram, with one "intensity reference" band chosen to represe nt each relative intensity (r.i.).
The varietal formu la for Marquis can be written in two ways. In the first formula, the r.m . of each band is represented by the first number, and the r.i. band is shown in pa renthesis. For computer ha ndling of this formula, the decimal can be omitted .
16.0(3) 38.0(1) 53.0(3) 71.0(3)
18.5(3) 39.5(1) 55.5(4) 75.0(3)
20.5(3) 43.0( I) 58.0(4) 77.0(3)
23.5(3) 44.5(5) 60.0(4) 82.0(3)
26.0(1 ) 45.5(5) 63.0(4) 87.5( 1)
30.5(5) 47.5(2) 65.5(4)
36.5(1) 50.0(5) 68.5( I )
In the second form ula, the position of each band is identified by locating the appropriate r.i. number under the appropriate r.m. number on the linear relative mobility sca le (top). This a rrange ment is particularly suited for comparing a large number of varieties, which can be listed in tabula r fo rm under a single mobili ty scale.
Relative mobility
0 10 20 30 40 50 60 70 80 90 11 11 I 11 II I I 11 I I I 1 I I lj I I I I I 11 11 111 I 111 I II 11 I II I 11 I I 111 I I I II I lj 11 I I Ii II lj I 1 I I 11 II 111 I 1 I II I 11 I
Marquis 3 3 3 3 1 5 1 1 1 1 5 5 2 5 3 4 4 4 4 4 1 3 3 3 3 1

226 / Advances in Cereal S cience and Technology, Vol. V
Dis to nee Relative Relative from Mobility Intensity
Marquis Origil(mm) (Dist.x50/172) (Scale of I to 5)
' Origin 0
10- - 55 16 3 64 18.5 3
20- 70 20.5 3
81 23.5 3 90 26
30- 105 30.5 5
\~ n ·5 135 39.5
40-147 43 I 152 44.5 5 157 45.5 5 164 47.5 2
50---+ 172 50 5
181 53 3 190 55.5 4 197 58 4
60- 204 60 4 215 63 4 223 ~.5 4
235 68.5 I 70- 242 71 3
252 75 3 262 77 3
80-280 82 3
e 298 87.5
Figure 4. Derivation of the varietal formula from the g liad in electrophoregram for the variety Marquis. (From Bushuk and Zillman. 1978)
Gel Electrophoresis of Proteins / 227
NOTES ON FLAT BED PAGE METHOD I. Acrylamide monomer is a toxic chemical that is absorbed directly through the
skin, so caution should be exercised when handling the crystalline powder, the solution, or the gel.
2. The hydrogen peroxide, which initiates gel polymerization, gradually decomposes during storage. Thus, freshly prepared peroxide solutions should be used routinely. Optimum concentration is approximately 3%. Lower and higher concentrations produce inferior gels that are soft and tend to swell extensively during staining, making them difficult to handle. The optimum concentration should be established for each source of hyd rogcn peroxide by trials with several different concentrations.
3. The formation of bubbles in the gel during polymerization is due to dissolved air coming out of solution and occurs when the gel solution is mixed too vigorously before pouring.
4. A common problem encountered in flatbed gel electrophoresis is band sloping. Band sloping can cause closely migrating bands to appear as one continuous band when viewed perpendicular to the gel surface. One method to minimize the effects of this problem is to minimize the volume of sample applied to the slot. In this way, the height of the column of sample is minimal, and the sloping is less apparent. Very little protein is actually required for the stained band to become visible.
5. Since the current, and hence the rate of protein mobility, is sensitive to changes of temperature, the coolant must be maintained at a constant temperature throughout electrophoresis.
6. The time required for electrophoresis to be completed at 110 mA varies somewhat with the voltage. The voltage drop at constant current is affected by the purity of the chemical components in the gel, especially in acrylamide monomer, which varies significantly in conductivity .
7. Excessive staining of the gel should be avoided because the dye, which penetrates deeply into the gel matrix, will not easily be removed by destaining, and faint bands can be masked. When destaining is completed the gel should be photographed as soon as possible in order to retain the faint bands, which fade after a few days of storage.
8. Transferring the gel during staining and destaining can be done using a sheet of flexible plastic cut slightly larger than the size of the gel.
E. Gradient Gel Electrophoresis of Gliadins
PRINCIPLE The use of a commercially available precast polyacryla mide gel is considerably
advantageous in routine examination of large numbers of samples by staff without extensive laboratory experience. The 14-sample gel is provided ready for use in cassettes, so the handling of the toxic acrylamide monomer is avoided, and gel preparation time is eliminated. These gels, used in many branches of biochemistry, are available in a standard size (about 8 cm square) from a number of suppliers. Prices differ considerably. Figure 5 shows the gliadin electrophoregrams for representative wheat varieties.
In the gradient gel, the concentration of polyacrylamide increases from the top point of sample application to t he bottom (Margolis and Wrigley, 1975). This

228 / Advances in Cereal Science and Technology, Vol. V
provides the advantage of optimal gel porosity for a_ll sizes of p_roteins_ ~~ a mixture. As the protein molecules move down a gradient gel, their mob1ltt1es decrease progressively as the increasing gel concentration restricts migration. The protein zones a re consequently sharpened, a nd resolution is enhanced.
Whereas charge differences a re accentuated in the early stages of electrophoresis, differences in molecular size beco me the basis of separation when migration becomes restricted by the pore size of the gel after prolonged electrophoresis. This can result in many zo nes being closely spaced in a mixture such as g liadin with many components of similar size. A linea r gradient of 2.5-13% gel (Fig. 5) (Wrigley, 1980) is optimal for the gliadins, in combination with electrophoresis for about 400 V hours (one hour a t 400 V). This gel is available
Figure 5. Electrophoresis of gliadin proteins, ext racted with 6% urea , in a polyacrylamide gradient gel (2.5-13%) containing sodium lactate, pH 3. The o rigin and anode are a t _the top. Time of electrophoresis is two hours at 30 V/ cm. Varieties (from left) are Scout 66. Ima 66R, Cap1to le, Diplomat, Marquis, Chinese S pring, Eagle (Aust ra lian). Halberd, Millewa, Olympic, Ja biru, and La nce.
Gel Electrophoresis of Proteins / 229
from Gradient Pty. Ltd . (Pyrmont, N.S. W .. 2009, Australia) and from Universal Scientific Ltd. (London, U.K.), a nd is similar to the 2-16% gel from Pharmacia AB (Uppsala, Sweden).
In the following procedure, sodium lacta te buffer system gave better resolution than a luminum lacta te, which traditionally has been used for gliadin electrophoresis. Furthermore, gel destaining was omitted by using a staining procedu re based o n that of Diezel et al (1972).
The entire procedure is comprised of four main steps: the pre run of the gel (to incorporate the desired buffer), a pplication of sa mples, electrophoresis, and overnight staining.
APPARATUS In this routine procedure, the gel slab (72 X 72 X 3 mm) is held between two
glass plates (82 X 82 X 1 mm) with a spacing strip (82 X 5 X 3 mm) down each side. A plastic sa mple spacer is inserted between the glass pla tes on top of the soft end of the gel. This whole gel cassette is held vertically by a rubber gasket so that the gel slab has co ntact at top and bottom with the res pecti ve electrode soluti ons. Suitable a ppa ratuses a re availa ble from Gradient Pty. Ltd .. Pharmacia AB, Universal Scientific, and Isola b Inc. (Akron , Ohio). Facilities for longer a nd wider gels are also ava ilable . The power supply should be capable of de livering 400 V and about 50 mA for each gel cassette.
PROCEDURE I. With the sa mple spacer in place, insert the gel cassette into the rubber gasket
of the upper electrode compartment. Prevent the entry of air bubbles between the gel and the glass plates by moistening the bottom of the cassette, if necessary. Fill the electrode compartments with sodium lactate buffer (0.017% sodium hydroxide adjusted to pH 3.1 with lactic acid), a nd a pply 200 V for about one hou r (or 400 V for 30 minutes) with the lower electrode negative (cathode).
2. After gel a nd buffer have been eq uilibrated in the prerun, apply IO µl of gliadin extract in each of the 14 sa mple p ositions across the top-of the gel (low concentration end). (Prepare these extracts by mixing 50 mg wheatmeal or flour with 0.3 ml of 6% urea and centrifuging to clear the extract.)
3. Apply 400 V for one hour (or 200 V for two hours) a t 25° C. These times may have to be reduced a ppropria tely if the temperature of the buffer increases significa ntly.
4. After electrophoresis, remove the gel cassette, peel the ta pe off one side, and pry the two glass pla tes apart. Ma rk the position of the first slot by cutting a corner off the gel, and place the gel into a tray containing 95 ml of 12% trichloroacetic acid solution. Mix in 5 ml of 0.25% Coomassie Blue G250 solution (most of it precipita tes) a nd leave overnight for staining.
RECORDING RES UL TS Electrophoretic ba nd s are visible within approxima tely one hour. Sta ining
may be ha stened by raising the temperature. Results ca n often be assessed by direct exa mination of the gel, but if a permanent record is required , the following procedure should be followed. Store the wet gel in a sealed plastic bag. Air-dry the gel (loosely held between sheets of plastic mesh) after soaking for one hour in

230 / Advances in Cereal Science and Technology, Vol. V
acetic acid-water (I: 12), for one hour in acetic acid-methanol-water (I :5: 14), and overnight in glycerol-methanol-water (I: 11 :8). Photograph the gel by transmitted light, using a red filter to enhance contrast, or scan the gel, using a recording densitometer.
DISCUSSION The main advantages of the gradient gel method are its convenience and
suitability for routine checking of many samples. Although the small gel size does not give large separation of band zones, it does facilitate handling and storage, and shortens the time of electrophoresis. The cost of buying ready-made gels adds to the overall cost of analysis, but it must be balanced against the time and cost of gel preparation.
Variations in relative mobilities are expected in gradient gel electrophoresis, because of the progressive increase in molecular sieving during the run. However, this effect is not serious in a 2.5-13% gel, for which the average variation in relative mobility from 400 to 450 V hours was less than I%. Good reproducibility of patterns has been obtained irrespective of minor variations in the time of electrophoresis.
Gradient gel electrophoregrams for the systematic identification of Australian wheats have been published by du Cros et al (1980). For identifying these varieties, gradient gels were preferred over starch or uniform-pore polyacrylamidegels(duCrosand Wrigley, 1978, 1979), but Redmanetal(l980) preferred 6% polyacrylamide to gradient gels for distinguishing between English wheats. Gradient gel electrophoresis satisfactorily identified Californian wheats (Qualset and Wrigley, 1979).
F. Gel Isoelectric Focusing of Grain Proteins
PRINCIPLE Whereas methods of gliadin fractionation have involved adapting a technique
originally devised for proteins of another type, much of the early development of gel isoelectric focusing was done using grain proteins from wheat (Wrigley, 1968) and from soybean (Catsimpoolas, 1968). Its potential for distinguishing between wheat varieties was realized at this early stage (Wrigley and Moss, 1968). It has since been applied to a wide range of seed proteins (Wrigley, 1977c) as well as throughout biochemistry, either alone or in combination with gel electrophoresis (Wrigley, 1970).
Gel electrofocusing was one of the first electrophoretic methods to be adopted as an official AOAC method of analysis (Lundstrom, 1980). In this application (identification of fish species), the method is said to be particularly "forgiving" of small errors or variations in experimental conditions (Lundstrom and Roderick, 1979).
The information about protein composition provided by gel isoelectric focusing is likely to differ from that obtained with gel electrophoresis because the principles of separation are different. Whereas gel electrophoresis involves the migration of proteins at uniform pH with consequent separation according to size and charge, the protein molecules in isoelectric focusing are focused within a pH gradient to the point at which each protein loses its overall charge, that is,
.l
Gel Electrophoresis of Proteins / 231
where the pH of the support medium equals the isoelectric point of the protein. A two-dimensional combination of the two methods has thus proved useful, particularly for distinguishing between closely related varieties (du Cros and Wrigley, 1979; Hussein and Stegemann, 1978; Qualset and Wrigley, 1979).
The pH gradient in which isoelectric focusing occurs is formed by applying an electric field to a mixture of carrier ampholytes in a stabilizing medium such as polyacrylamide gel. The ampholytes used here have a spectrum of isoelectric poin~s from three .to IO. Thus, as they focus in the electric field, they form a contmuous range of pH from three at the positive end of the gel to 10 at the cathodic end. The pH gradient is completed with paper strips containing a strong acid (IM phosphoric acid) at the anode and a strong base (IM sodium hydroxide) at the cathode. The cost of carrier ampholytes restricts the routine use of this method, though it can be overcome by synthesizing them in the laboratory (Vinogradov et al, 1973).
APPARATUS Gel isoelectric focusing is generally performed in a flat thin layer of poly
acr~lamide, and samples are applied on the surface of the gel. Alternatively, vertical tubes may be used in a disc-gel electrophoresis apparatus. The· brief details that follow apply to the former type of gel, but procedures for both have been published by Lea back and Wrigley ( 1976). Suitable apparatuses may be obtained from a range of suppliers. In addition, preformed gels are available from LKB Produkter, Bromma, Sweden.
PROCEDURE I. Prepare the gel-forming cell to receive the gel reagents premixed in the
following order:
Urea Water Carrier ampholytes (pH 3.5-10.4) Acrylamide stock solution Riboflavin (0.01 %)
3.6g 16.9 ml 1.5 ml 7.5 ml 1.5 ml
This provides 30 ml of 7.5% gel containing 2M urea. Pour the gel mixture into the gel-forming cell and illuminate it with a fluorescent tube about IO cm from the cell for about 30 minutes. Alternatively, the gel may be chemically polymerized (without the need of illumination) by replacing the riboflavin solution with an equal volume of potassium persulfate (IO mg/ml). The acrylamide stock solution contains 30 mg acrylamide (pure grade) and I g N,N'-methylenebisacrylamide per IOO ml solution. .
2. Place the gel on the cooling plate of the apparatus, preferably on a film template imprinted with positions to apply samples (du Cros and Wrigley, 1979). Protein zones are focused from any part of the pH gradient, so the position of their application is not critical; they may be applied anywhere between electrodes. To apply, place a piece of filter paper soaked with gliadin extract on the surface of the gel. Apply other samples in sequence across the gel, parallel to the positions of the electrode strips.
3. Place strips of filter paper, soaked in either IM sodium hydroxide or IM
232 / Advances in Cereal Science and Technology, Vol. V
phosphoric acid, across the ends of the gel. Place the electrodes on these (cathode and anode, respectively), and apply an electric field , progressively increasing the voltage to about 50 V / cm. After about 2.5 hours, remove the gel and place it in a solution of 3.5% perchloric acid containing 0.06% Coomassie Blue for 1.5 hours, preferably after a preliminary soak of 39-60 minutes in 12% trichloroacetic acid. Destaining is not necessary.
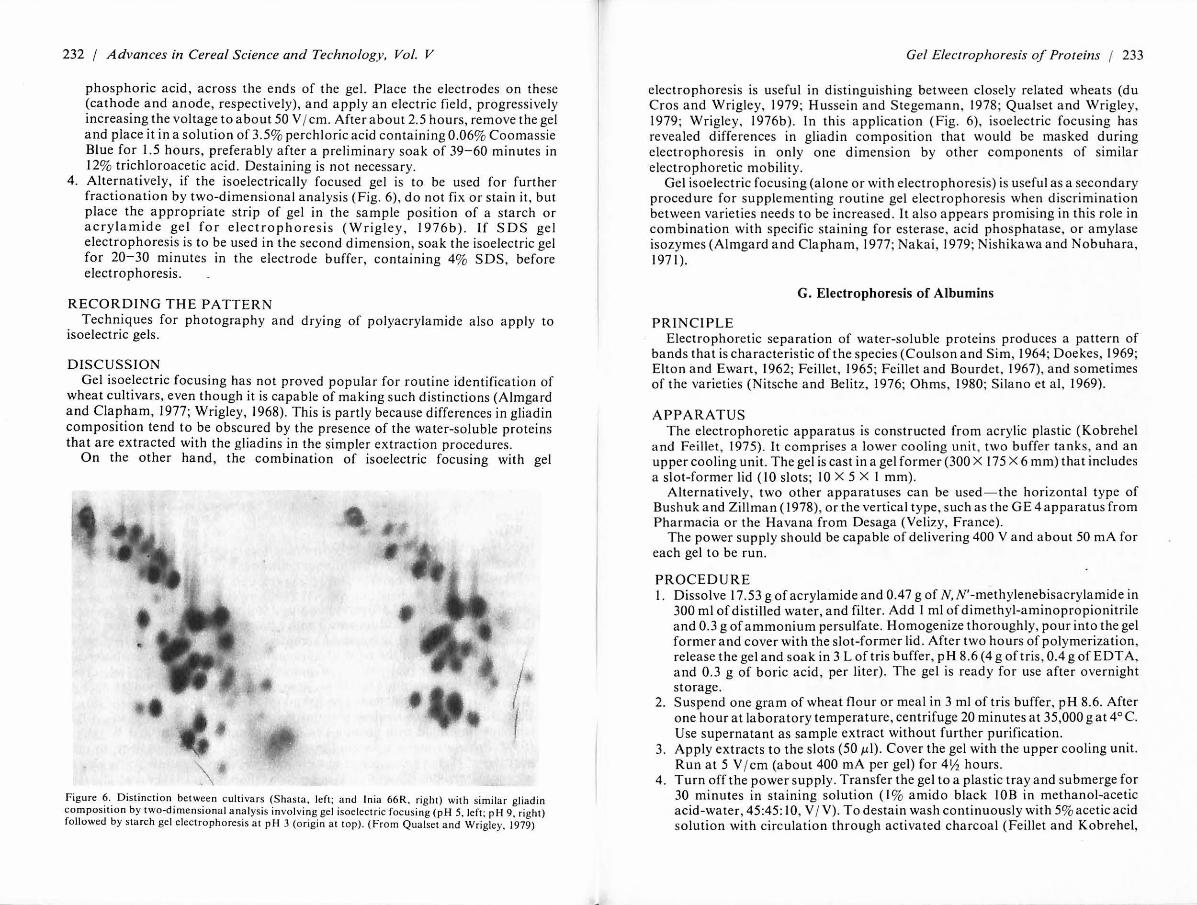
4. Alternatively, if the isoelectrically focused gel is to be used for further fractionation by two-dimensional analysis (Fig. 6), do not fi x or stain it, but place the appropriate strip of gel in the sample position of a starch or acrylamide gel for electrophoresis (Wrigley, 1976b) . If SOS ge l electrophoresis is to be used in the second dimension, soak the isoelectric gel for 20-30 minutes in the electrode buffer, containing 4% SOS, before electrophoresis.
RECORDING THE PATTERN Techniques for photography a nd drying of polyacrylamide also apply to
isoelectric gels.
DISCUSSION Gel isoelectric focusing has not proved popular for routine identification of
wheat cultivars, even though it is capable of making such distinctions (Almgard and Clapham, 1977; Wrigley, 1968). This is partly because differences in gliadin composition tend to be obscured by the presence of the water-soluble proteins that are extracted with the gliadins in the simpler extraction procedures.
On the other hand, the combination of isoelectric focusing with gel
Figure 6. Distinction between cultivars (Shasta, left; and lnia 66R. right) with similar gliadin composition by two-dimensional a nalysis involving gel isoe lectric focusing (pH 5. left; pH 9, right) followed by starch gel electrophoresis at pH 3 (origin at top). (From Qualset and Wrigley. 1979)
Gel Electrophoresis of Proteins / 233
electrophoresis is useful in distinguishing betwee n closely related wheats (du Cros and Wrigley, 1979; Hussein and Stegemann, 1978; Qualset and Wrigley, 1979; Wrigley, 1976b). In this application (Fig. 6), isoelectric focusing has revealed differences in gliadin composition that would be masked during electrophoresis in only one dimension by other components of similar electrophoretic mobility.
Gel isoelectric focusing (alone or with electrophoresis) is useful as a secondary procedure for supplementing routine gel electrophoresis when discrimination between varieties needs to be increased. It also a ppears promising in this role in combination with specific staining for esterase, acid phosphatase, or amylase isozymes (Almgard and Clapham, 1977; Nakai, 1979; Nishikawa and Nobuhara, 1971).
G. Electrophoresis of Albumins
PRINCIPLE Electrophoretic separation of water-soluble proteins produces a pattern of
bands that is characteristic of the species (Coulson and Sim, 1964; Doekes, 1969; Elton and Ewart, 1962; Feillet, 1965; Feillet and Bourdet , 1967), and sometimes of the varieties (Nitsche and Belitz, 1976; Ohms, 1980; Silano et al, 1969).
APPARATUS The electrophoretic apparatus is constructed from acrylic plastic (Kobrehel
and Feillet, 1975). It comprises a lower cooling unit, two buffer ta nks, a nd an upper cooling unit. The gel is cast in a gel former (300 X 175 X 6 mm) that includes a slot-former lid ( 10 slots; 10 X 5 X 1 mm).
Alternatively, two other apparatuses can be used- the horizontal type of Bushuk a nd Zillman ( 1978), or the vertical type, such as the GE 4 apparatus from Pharmacia or the Havana from Desaga (Yelizy, France).
The power supply should be capable of delivering 400 V and about 50 mA for each gel to be run.
PROCEDURE 1. Dissolve 17.53 g of acrylamide and 0.47 g of N,N'-methylenebisacrylamide in
300 ml of distilled water, and filter. Add 1 ml of dimethyl-aminopropionitrile and 0.3 g of ammonium persulfate. Homogenize thoroughly, pour into the gel former and cover with the slot-former lid. After two hours of polymerization, release the gel and soa k in 3 L of tris buffer, pH 8.6 (4 g oftris, 0.4 g of EDTA, and 0 .3 g of boric acid , per liter). The gel is ready for use after overnight storage.
2. Suspend one gram of wheat flour or meal in 3 ml of tris buffer, pH 8.6. After one hour at laboratory temperature, centrifuge 20 minutes a t 35,000 g at 4° C. Use supernatant as sample extract without further purification.
3. Apply extracts to the slots (50 µl) . Cover the gel with the upper cooling unit. Run at 5 V / cm (about 400 mA per gel) for 4Yi hours.
4. Turn off the power supply. Transfer the gel to a plastic tray and submerge for 30 minutes in staining solution (I % amido black I OB in methanol-acetic acid-water, 45:45: 10, V / V). To destain wash continuously with 5% acetic acid solution with circulation through activated charcoal (Feillet and Kobrehel,

234 / Advances in Cereal Science and Technology, Vol. V
1972). Alternatively, destaining can be d one by electrophoretic rem oval of the dye from the gel.
RECORDING RESULTS Electrophoretic ba nd s are visible a fter two hours. Results can be assessed by
direct examination of the gel. If a permanent record is required , the gel can be pho tograp hed or scanned on a recording densitometer with transmitted light.
DISCUSS ION Electrophoresis of a lbumins is a simple and rapid method that can help
varietai identification in some special cases. For example, Silano et al ( 1969) distinguis hed four groups of bread wheats a nd two groups of durum wheats on the basis of albumin electrophoregrams. Nitsche a nd Belitz ( 1976) described a n albumin fractionation that permitted the distinction of the undesirable variety, Kranich, from nine acceptable varieties. After reduction by 2-mercaptoetha nol of soluble proteins, Ohms ( 1980) s ucceeded in c ha racterizing a gro up of German cultivars with good baking qua lity.
In general, however, the electrophoretic composition of soluble proteins differs little from one varie ty to a nother. On the o ther hand , such varietal uniformity makes the a lbumins more useful for compariso ns between species than between varieties. In addition to methods based on enzyme patterns (Kobrehel and Feillet , 1976), a lbumin electrophoregrams have bee n extensive ly used for determining the presence of common wheat in durum wheat products either through polyac rylamide gel electrophoresis (Fig. 7) (Cubadda and Resmini , 1970; Feillet and Kobrehel, 1972; Garcia-Faure et a l, 1969; Resmini,
---L--
Figure 7. Electrophoresis of soluble pro teins, ex tracted with tris buffer, pH 8.6, in a 6% polyacrylamide gel containing tris buffer. Time of electrophoresis is four hours, 30 minutes at 5V / cm. Samples used are durum whea t pasta containing variable amoun ts of T. aestivum: (from left) 100%. 80%, 60%, 40%, 20%, 0%. (From Feillet and Kobrehel , 1972)
Gel Electrophoresis of Proteins / 235
1968; Si la no et al , 1967, 1968) o r through isoelectric focusing (Resmini and de Bernardi, 1976). Alternative methods based on immunochemical comparisons of a ntige nic albumins of durum and bread wheats have also been successful (Cantagalli et a l, 1969; Hamauzu et a l, 1967; Nimmo and O'Sullivan, 1967; Piazzi a nd Cantagalli, 1969; Piazzi et al, 1972). Common wheats can be identified by a specific albumin component called 0.19 by the Italian scientists and described by Feillet a nd Nimmo ( 1970) as a lbumin 13. More recently, Konarev ( 1978) showed tha t the a ntigenically specific component of common wheat differed from the 0.19 component.
An improved specificity of so luble protein electrophoregrams was obtained by using s pecial stai ning. Silano and Pocc hia ri ( 1968) and Mi netti et al ( 197 1) observed that a lbumins, globulins, a nd gliad ins stained with aniline blue-black gave blue, green, and red ba nd s, respectively. Caldwell and Kasarda ( 1978) took advantage of diffe rential dye bi nd ing of soluble proteins to distinguish varieties a nd species of wheats by viewing the Coomassie Blue-stained gels thro ugh an ora nge filter.
H. SDS Electrophoresis of Glutenin Subunits
PRINCIPLE Although the gliad in proteins are generally examined in electrophoretic
identification of wheat varie ties , the info rma ti on so obtained can be usefully com plemented by a na lysis of glutenin-subunit composition, since synthesis of the two groups of proteins is under separate genetic control (Lawrence and Shepherd, 1980). Extraction of the glutenin subu nits, gliadin, and a lbumin proteins is obtained by using 2-mercaptoethanol to break disulfide bonds and the detergent sodium dodecyl sulfate (SOS) to d isrupt va rio us noncovalent bonds. During gel e lectrophoresis, the prese nce of SOS maintains solubility. In additi on, it provides fractionation that is ma inly based on size differences because the p resence of SOS largely cancels out differences in the charge of the proteins themselves. The group of components most appropriate fo r study (bracketed in Fig. 8) a re those of lowest mobility (largest size) or the high molecular weight glutenin subunits. Useful information is also provided by the co mponents of higher mobility.
APPARATUS Several commercia l units are available for SOS electrophoresis in tubes or in a
horizontal or vertical slab of gel. A flat gel offers better opportunity for close comparison between samples than separate tubes do . A recent laboratory ma nua l (du Cros et a l, 1980) gives detailed instructions for performing SOS gel electropho resis in apparatuses normally used for gradient gel electrophoresis.
PROCEDURE Use of a discontinuous buffer system is recommended, together with separate
stacking (uppe r) a nd separating gels. In addition, the use of a gradient gel (7.5-16% polyacrylamide) improves resolution for sma ller polypeptides. The fo ll owing procedure, however, involves a uniform 8.4% separating gel (du Cros et a l, 1980) a nd is based on the meth od of King and Laemmli ( 197 1). 1. Ext ract fl our o r wheatmeal (8 µ I/ mg sample) with 0.06Mtris hydroxymethyl

236 / Advances in Cereal Science and Technology , Vol. V
amino methane (tris) buffer (pH 6.8) containing 4% SOS, 10% glycerol, 0.00 I% bromophenol blue , and 1.5% 2-mercaptoethanol. Centrifuge a t sufficiently high speed to ensure cla rity of the extract and absence of streaking in the electrophoretic pattern .
2. Set the lower separating gel in most of the space availa ble for gel formation. It
Figure 8. Fractionation of endosperm proteins from the wheat va rieties Condor B ( left), Condor A, Egret, Oxley. Shortim, a nd Timson by SOS-electrophoresis in a gradient gel (7.5% polyacrylamide at the top (origin , cathode) to 16%). The high-molecula r-weight glutenin subunits are bracketed. Electrophoresis was perfo rmed fo r 3.5 hours at 12 V/ cm. (From Wrigley, 1981)
Gel Electrophoresis of Proteins / 237
is chemically polymerized from a mi xture containing 0 .38M tris , adjusted to pH 8.8 with HCI , 8.4% acryla mide, 0.7% N, N'-methylenebisacrylamide (B IS), 0.1 % SOS, 0. 1% N,N,N'N'-tetramethyl ethylenediamine (TEMED) a nd 0.013% a mmonium persulfate. Form a layer (about I cm) of stacking gel on top of the separa ting gel. Stacking gel comprises O. I 3M tris, adjusted to pH 6.8 with HCI , 3.0% acrylamide, 0.08% BIS, 0. 1% SOS, 0. 1% TEMED, a nd 0.02% ammonium persulfate. Leave the gel overnight before use. Minimize the amount of ammonium persulfate because a n excess will modify the electrophoretic pattern . . . .
3. Mount the gel in the a pparatus so that the sa mple prote ins migrate into the gel towards the a node (positive). The electrode buffer contains 0 .025M tris, adjusted to pH 8.3 with glycine, and 0. 1 % SOS. Apply sampl~s (I 0 ti' for a 2 X 8 mm area). Turn on the power and conti nue electrophoresis until the d ye front reaches the end of the gel.
4 . Remove the gel. Mark the position of the first sample . Soa k the gel overnight in 0.025% Coomassie Blue in 5.8% trichloroacetic acid , 18% methanol, a nd 6% acetic acid. Des ta in in acetic acid-methanol-water (I :6: 13).
RECORDING THE PATTERN Photograph or scan the gel when it is destained . Contrast between bands and
background may be enhanced by overnight storage in a plastic bag a t 4°C.
DISCUSSION The SOS electrophoregrams of the high molecular weight glutenin subunits
were listed for 65 Australian wheat varieties (du Cros et al, 1980). The method provided clear distinctions between some. v~rieties with similar gliad~n composition. Jn other cases, a group of vanet1es sho~~d t?e sa~e gl~tenin pattern . The procedure is therefore recommended f~r v.enf1cat1on of 1de~t1ty for cases in which it is more discriminating tha n gltadin electrophoresis. SOS electrophoregra ms and method s have been published for European wheats by Shewry et al (1978a) a nd by Hussein and Stegemann (1978).
I. Systematic Evaluation of Identity
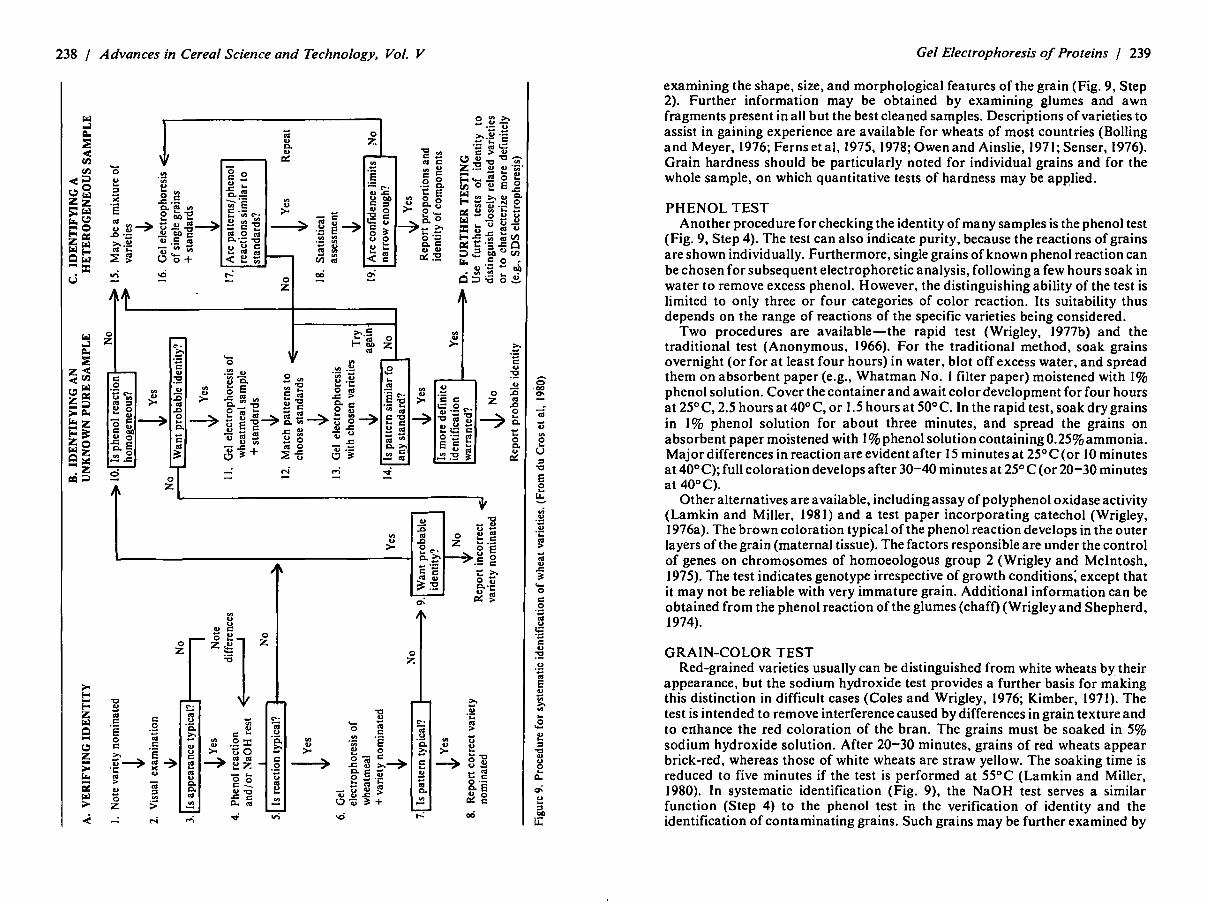
A systematic approach to identification is im~ortant to m~ni~ize its cost a nd to ensure efficiency and accuracy. Such a system 1s suggested in Fig. 9 (du Cros et al 1980). Section A of the flowcha rt is designed to answer the question, "Is the sa'mple true-to-label?" Jn ma ny cases, no more information than this is needed , but when the answer is negative, there is the inevitable further question, "Then wha t is it?" Sections Band C of Fig. 9 address themselves to the second question , for pure and for heterogeneous samples, respectively. The a pproach emphasizes the use of complementary test methods and of electrophoresis of wheat me~! samples to minimize the time and expense of unnecessa ry electrophoret1c analyses.
J. Complementary Testing Methods
VISUAL IDENTIFICATION A trained inspector can provide a reasonably definite identification by
238 / Advances in Cereal Science and Technology, Vol. V
0
0 z
....:
- -0 0 c: -"' "O .c c: c. co
r-.i M
0 z
~.§ 0 .,, ... ~ I- :> z
:!
.,, "' ;.>-
0 z
"' :0 co 0 .0 z e C"-· o.c c·= co ~ ~:-9 ~
"O - "' u (; "' - c: -·-0 e u .5 0
c: - >. -0 ti C.·-
"' -IX ~
-"' .,, e u ::s
"O
e 2 ~
Gel Electrophoresis of Proteins / 239
examining the shape, size, and morphological features of the grain (Fig. 9, Step 2). Further information may be obtained by examining glumes and awn fragments present in all but the best cleaned samples. Descriptions of varieties to assist in gaining experience are available for wheats of most countries (Bolling and Meyer, 1976; Ferns et al, 1975, 1978; Owen and Ainslie, 1971; Senser, 1976). Grain hardness should be particularly noted for individual grains and for the whole sample, on which quantitative tests of hardness may be apP.lied.
PHENOL TEST Another procedure for checking the identity of many samples is the phenol test
(Fig. 9, Step 4). The test can also indicate purity, because the reactions of grains are shown individually. Furthermore, single grains of known phenol reaction can be chosen for subsequent electrophoretic analysis, following a few hours soak in water to remove excess phenol. However, the distinguishing ability of the test is limited to only three or four categories of color reaction. Its suitability thus depends on the range of reactions of the specific varieties being considered.
Two procedures are available-the rapid test (Wrigley, 1977b) and the traditional test (Anonymous, 1966). For the traditional method, soak grains overnight (or for at least four hours) in water, blot off excess water, and spread them on absorbent paper (e.g., Whatman No. I filter paper) moistened with 1% phenol solution. Cover the container and await color development for four hours at 25° C, 2.5 hours at 40° C, or 1.5 hours at 50° C. In the rapid test, soak dry grains in I% phenol solution for about three minutes, and spread the grains on absorbent paper moistened with I% phenol solution containing 0.25% ammonia . Major differences in reaction are evident after 15 minutes at 25° C (or IO minutes at40°C); full coloration develops after 30-40 minutes at 25°C (or 20-30 minutes at 40°C).
Other alternatives are available, including assay of polyphenol oxidase activity (Lamkin and Miller, 1981) and a test paper incorporating catechol (Wrigley, l 976a). The brown coloration typical of the phenol reaction develops in the outer layers of the grain (maternal tissue). The factors responsible are under the control of genes on chromosomes of homoeologous group 2 (Wrigley and Mcintosh, 1975). The test indicates genotype irrespective of growth conditions: except that it may not be reliable with very immature grain. Additional information can be obtained from the phenol reaction of the glumes (chaff) (Wrigley and Shepherd, 1974).
GRAIN-COLOR TEST Red-grained varieties usually can be distinguished from white wheats by their
appearance, but the sodium hydroxide test provides a further basis for making this distinction in difficult cases (Coles and Wrigley, 1976; Kimber, 1971). The test is intended to remove interference caused by differences in grain texture and to enhance the red coloration of the bran. The grains must be soaked in 5% sodium hydroxide solution. After 20-30 minutes, grains of red wheats appear brick-red, whereas those of white wheats are straw yellow. The soaking time is reduced to five minutes if the test is performed at 55°C (Lamkin and Miller, 1980). In systematic identification (Fig. 9), the NaOH test serves a similar function (Step 4) to the phenol test in the verification of identity and the identification of contaminating grains. Such grains may be further examined by

240 / Advances in Cereal Science and Technology, Vol. V
electrophoresis if they are rinsed in water before extraction. ~lternati~ely, the washed grains may be dried and stored for later electrophoretlc analysis.
FURTHER ELECTROPHORETIC TESTS As indicated in Fig. 9, exhaustive electrophoretic analysis of gliadin
composition may not always be adequate for definite identification. Several methods may. fill this role, depending on the specific varieties being considered. These include staining for specific isozymes after gel electrophoresis, or isoelectric focusing of extracts of dry or soaked grain or of seedlings (Almgard and Clapham, 1977; Hussein and Stegemann, 1978). The following enzyme systems are useful for this purpose: acidic phosphatases (Auriau et al, 1976; Nakai, 1973); amylases (Joudrier, 1974; Joudrier and Bernard, 1977; Nishikawa and Nobuhara, 1971); 5!Sterases (Cubadda and Quattrucci, 1974; Menke et al, 1973; Nakai, 1979); and peroxidases (Alexandrescu et al, 1979; Kobrehel and Gautier, 1974). The types of fi-amylase and peroxidase isozyme patterns encountered in French wheat varieties are shown in Fig. IO and Table Ill. A combination of the two isozyme patterns can be used to distinguish some otherwise indistinguishable varieties. For example, Axel and Fleurus have the same fi-amylase type but different peroxidase type.
K. Authenticity of Standard Samples
All of the described methods are comparative; that is, the electrophoretic and the complementary tests compare the results for the sample being tested with those for an authentic sample of each variety being considered. The reliability of the identification thus depends on how genuine the standards are. These should
........
.... • . • I'· -· •~- · . · . • -
· Figure JO. Electrophoresis and specific staining of ,B-amylase isozymes. Major electrophor~tic types discovered among bread wheat varieties (from left): Ciano (type I). Roazon (type II), He1ma (type Ill), Blason (type IV), Azteca (type V), Yaktana (type VI). (From Joudrier, 1974)
Gel Electrophoresis of Proteins / 241
preferably be obtained from a central officia l cultivar collection, but familiarity with local certified seed should also be established.
Certain cultivars are polymorphic for electrophoretic pattern and / or phenol reaction), ie, different kernels give different patterns or phenol reactions, yet all can be shown to be of one c'ultivar and to have come from the same cross (Appleyard et al, 1979). Multiple biotypes of a cultivar may appear a.s the result of the se lection methods used in their breeding, or they may be caused by the release of a different selection under the same name (Wrigley, I 976c). As many as four biotypes have been reported for a cultivar (du Cros and Wrigley, 1979), though in this case only two biotypes are present as major components. It is important, however, to examine the grains of a standard sa mple one by one to determine whether the variety is polymorphic, because this information is vital to its identification.
L. Evaluation of Electrophoregrams
In its simplest form, electrophoretic identification involves comparing the electrophoregrams of test samples with that of an authentic sample. A lack ~f correspondence between the respective patterns may indicate that the sample is not true-to-label or at least that it is contaminated with a variety having a different electrophoregram. Sections Band C of Fig. 9 recommend procedures for determining the true identity in such cases. These suggestions rely on the availability of a catalog of electrophoregrams of the varieties likely. to be encountered. If reproducibility of electrophoresis can be assured, matching the pattern of the unknown to those in the catalog may be sufficient for identification. Alternatively, Step 12 would at least indicate a suitable set of
TABLE Ill Use of Combined Specific /soenzyme Electrophoreric Patterns in Distinguishing
Closely Related Varieties with Identical Gliadin Pa11erns
Groups of Varieties with ,B-Amylase Peroxidase Identical Gliadin Patterns Type' Typeb
Axel IV A Fleurus IV B Ha rdi II A
Noroit IV B Top II B
Cappelle IV A Ouest II A
Blas on IV B Ca pi tole II A Moisson II B Splendeur IV A
Heima Ill A Roazon II B
•From Joudrier ( 1974). "From Kobrehel and Gautier ( 1974) .

242 / Advances in Cereal Science and Technology, Vol. V
varieties for direct electrophoretic comparison with the unknown (Step 13). Recent studies (Autran et al, 1979) and the current activities of Study Group 6
of the International Association of Cereal Chemistry (A-2320 Schwechat, Schmidgasse 3-7, Austria) will lead toward establishment ofa uniform procedure for electrophoretic identification. Achievement of this aim would open the way for a wofld-wide catalog of electrophoregrams to be compiled for wheat. On the other hand, the task of pattern-matching with such a catalog, or with any reasonably extensive one, is difficult. This task has been facilitated in published catalogs by arranging the electrophoregrams in the form of a key, so that the presence of certain bands is considered before others (Autran and Bourdet, 1975a; du Cros et al, 1980; Ellis and Bemister, 1977; Wrigley and Shepherd, 1974; Zillman and Bushuk, l 979b ).
Alternatively, such a task might be performed using computer-based methods of analysis. The initial step in both cases is transforming the arrangement of stained protein zones in an electrophoretic gel to form a suitable for manual or computerized comparison. This step usually has involved scoring for the presence or intensity of protein zones in a series of predetermined band positions. In addition, densitometric scanning of a photographic transparency has been interfaced to a computer to avoid the subjective assessment of band position and intensity (Bushuk et al, 1978). Autran and Bourdet ( l 975a) proposed an index of dissimilarity for comparing electrophoregrams in pairs. The computer programs used by Wrigley et al ( 1981) can select patterns, resembling those of an unknown sample, from a computer-stored catalog of electrophoregrams; a quantitative estimate of the degree of similarity compares the pattern of the unknown sample to each electrophoregram retrieved. Related programs may be used to examine relationships between the electrophoretic bands and other attributes, such as grain quality (Wrigley, 1981).
M. Statistical Evaluation of Results
If a grain sample is a mixture of varieties, electrophoresis of a ground sample provides a limited indication of its composition, and kernel-by-kernel analysis is generally necessary (Fig. 9, Step 16). These results are then analyzed statistically (Wrigley and Baxter, 1974) whether they are obtained by electrophoretic analysis or by phenol or NaOH testing. This involves determining the confidence limits for the proportion of each component. For example, the identification of one kernel of A in a total of 10 kernels examined ( 10% of A found) indicates that A occurs in the whole sample between 0 and 45% (confidence limits, using a confidence coefficient of 95%). If, on further analysis, 20 grains of A are identified in 200 grains (still 10% of A found), the confidence limits on the proportion of A are reduced to 6-14%. It is thus advisable to use 200-500 grains routinely for phenol or NaOH testing.
Confidence limits for the proportion of a component can be determined for total grain numbers up to 100 by reference to tables of binomial distribution (Beyer, 1968). For larger numbers of grains, the confidence limits are determined from the formula P ± 2[P( 100-P)/ n]~, where Pis the percentage of the component found in a total of n kernels examined. After determining the confidence limits for analysis of a set of kernels, further testing may be needed if the limits are too wide for the purpose (Fig. 9, Step 19).
Gel Electrophoresis of Proteins I 243
Table IV provides a practical example of the effect of progressive e!cctrophoretic identification on the statistical assessment of analyses of four samples taken from a truckload of grain for forensic purposes. Whole meal was examined by electrophoresis to provide an initial indication of identity and heterogeneity. The results indicated that Timgalen predominated, with Ki~e as .a significant contaminant. Application of the phenol test was not helpful m this case, because nearly all grains gave the same (dark brown) reaction.
Electrophoretic identification of the first nine kernels from the center of the load might have suggested that Kite and Timgalen were present in equal proportions, without also considering the wide confidence limits (8-70% for each) at this preliminary stage. In contrast, the next nine grains examined were all Timgalen, for which the confidence limits changed markedly. Even after identifying 35 grains from this part of the load, the confidence limits were st~ll wide, and a 95% probability existed that varieties present at up to 10% were still undetected.
Identification ofa similar number of kernels from other parts of the truckload gave a more complete indication of its composition. Variations in the actual proportions of varieties from one point of sampling to another suggested that the truckload was not homogeneous, but this conclusion is not definitely supported
TABLE IV Progressive Identification of Samples from One Truckload of Wheal
Number of Varieties Grains
Sample Examined Timgalen Gatcher Kite Winglen Condor Other
Center of truckti First 9 33 II 33 0 22 0
8-70 o-48 8-70 0-33 3-60 0-33 First 18 67 6 17 0 II 0
41-87 0-27 4-41 0-19 1-35 0-19 35 63 9 20 0 9 0
45-79 2-23 8-37 0-10 2-23 0-10
Rear of truckc First 12 67 0 17 0 17 0
35-90 0-27 2-48 0-27 2-48 0-27 34 70 6 9 9 6 0
53-85 1-20 2-24 2-24 1-20 0-10
Front of truck 35 80 9 3 6 3 0 63-92 2-23 0-15 J-19 0-15 0-10
Preliminary 36 78 11 0 0 3 8 61-90 3-25 0-10 0-10 HO 0-10
Total 140 73 9 8 4 5 2 65-80 4-13 3-13 1-7 1-9 0-5
•The first entry for each variety shows its percentage of the number of grains examined by electrophoresis. The confidence limits (based on a confidence coefficient of 0.95) appear immediately below as percentage_s. (Fr?m tables in ~ey~r: 1968) . . .
tiExamination of meal showed mamly Tamgalen and s1gmf1cant contammataon by Kate. c Examination of meal showed mainly Timgalen and some Kite.

244 / Advances in Cereal Science and Technology, Vol. V
when the confidence limits are exa mined for each sample, as shown by comparing Kite center (20%, 8-37) with Kite preliminary (0%, 0-10).
III. OTHER GRAINS
A. Rye and Triticale
The electrophoretic techniques described for wheat grain identification can be applied to rye a nd triticale without any modifica tion (du Cros and Wrigley, 1979). For example, Fig. 11 compares the prolamin electrophoregrams of varieties of wheat , rye, and triticale. Although differences are evident between
Figure 11 . Gradient gel electrophoresis {pH 3) of prolamine proteins extracted from crushed grain samples with 6% urea so lution for varieties of wheat (Marq uis (left). Diplomat, Ha lberd, and Duramba). rye {Black Winter Rye. Prolific. Gazelle. and Puma) and triticale {Sa tu. Coorong, Tyalla, and Siskiyou). The gel conta ins a linear gra dient by concentration of polyacryla mide from 2.5% {top. o rigin) to 13%.
Gel Elecrrophoresis of Proreins / 245
var ie ti es within each ge nus. g e neral characteris ti cs distinguish the electrophoregrams of each genus from o ne another. Such d istinctions may be useful, for example, in distinguishing wheat from rye products a fter processing has removed more obvious distinguishing characteristics. Densitometric scanning of electrophoregra ms has been used to determi ne the proportions of wheat and rye in mixtures (McCausland and Wrigley, 1976).
The phenol reaction of rye grain is controlled by genes on chromosome 2R (W rigley a nd Mc intosh, 1975). Although a dark phenol reaction is given by gra ins of many rye and triticale va rieties. the test may sometimes make useful distinctions. For example, the Australian triticale Grow-Quick gives a light brown reaction, in contrast to the dark phenol reaction of other triticales grown in Australia (du Cros et at, 1980).
B. Barley
Both the prolamin (hordein) and a lbumin proteins of the barley grain are useful for va rietal id entification b y electrophoresis. The descri bed electrophoretic and isoelectric focusing methods may be applied to barley. The following modifications are recommended (du Cros and Wrigley, 1979). Add a reducing agent ( I% 2-mercaptoethanol) to the extracting solution to promote the extraction of hordein . Reduce the time of electrophoresis by about 50% to reta in the albumin proteins on the gel, and slightly decrease the proportion of liquid used for extraction to accommodate the lower protein content usual in ba rley. Figure 12 illustrates the use of gel isoelectric focusing to distinguish between barley varieties. The full range of electroph oretic methods has been a pplied to barley identification , includ ing the added step of staining for enzymic activity (A lmgard and Landegren, 1974; Autran a nd Scriban, 1977; Ba xter and Wainwright, 1978; du Cros and Wrigley, 1979; Gavrilyuk and Diaguileva , 1975; Gunzel and Fischbeck , 1979; Konarev et al, 1976; McCa usla nd and Wrigley, 1977; Mes rob and Iva nov, 1970; Neyreneuf and Bourdet, 1979; Scriban a nd Strobbel , 1978; Scriban et al , 1979; Shewry et a l, 1978b, 1978c, 1980; Yan Lonkhuysen and Marseille, 1978a).
C. Oats
For the identification of oat va rieties (or species), grain proteins can be extracted with 2.5M urea (6 µI / mg crus hed grain) for gel isoelectric focusing (Fig. 13) or for electrophoresis in a 2.5-27% gradient of polyacrylamide (sod ium lactate, pH 3) for about 2.3 hours at 200 V (for standard 70 X 70 X 3 mm gels). Figure 13 illustrates the use of gel isoelectric focusing to compa re the protein composition of wild-oat gra ins, fatuoid off-types, and the cultivated oat with which the off-types were growing. Gel electrophoresis of isozymes from grain and from seed lings has also been useful for characterizing varieties a nd species of oat (Almgard and Clapham, 1975; Dass, 1972; Singh et al, 1973; Smith and Bennett, 1974; Williamson et a l, 1968).
D. Rice
Procedures for identifying rice varieties by their grain protein composition

246 / Advances in Cereal Science and Technology, Vol. V
were published by Park a nd Stegemann ( 1979) and by du Cros et al ( 1979). Both groups investigated both gradient gel electrophoresis and isoelectric foc using. Park and Stegemann ( 1979) found S DS electroph oresis unsuitable for va rietal identification, preferring gradient (5-30%) gel electrophoresis (pH 9.9) of the albumin proteins (extracted with 0.02% sodium azide, a nd stai ned for protein or esterases). du Cros et al ( 1979) extracted the grain proteins with 3M urea containing 1% 2-mercapt oe thanol ( 4 µ1 / mg crushed grain). The cla rified extract was analyzed by gradient ge'l electrophoresis or by gel isoelectric focusing. According to Juliano (1980) , the proteins being exa mined in these cases are albumins and globulins, rather than prolamins.
E. Corn
Gel electrophoretic a nd isoelectric focusing procedures were published for fracti onation of ma ize seed protei ns; these appear to be suited to varietal identificati on in this crop (Sietz, 1979; Drawert and Gorg, 1975; Paulis and Wall, 1979; Righetti et a l, 1977; Soave et a l, 1977; Stegemann, 1977).
F. Other Grains
Methods of varietal identification by electrophoresis have not been applied so
-· ~-
...
Figure 12. Gel isoelectric focusing (pH 3.5-10) of barley grain proteins, extracted with 6% urea conta ining 1% 2-mercaptoethanol, of a range of Australian varieties. (From du Cros and Wrigley, 1979)
Gel Electrophoresis of Proteins / 247
extensively to o ther grains, but p rocedures are available for many, including sorghum (Suh et al, 1977), rape seed (Finlayson et al, 1969; Yadava et al, 1979), peanut (Ory et a l, 1979), and soy bean (Llewellyn and Fla herty, 1976).
IV. CURRENT APPLICATIONS
A. European Economic Community
In rece nt years in Western Europe, several high-yielding wheat varieties to tally unsuita ble for bread baking-varieties such as Maris H untsman , Clement, Kranic h, Ben no, o r Anouska - have become increasingly popular. Therefore, the milling and baking industries have ta ken a n increased interest in the quality of wheat varieties. Although va riety is not the only factor influencing wheat quality, millers a nd bakers ha ve become more insistent that the wheat grain they acce pt be of the claimed variety a nd free of other, unsuita ble varieties. Varietal cri teria seemed the bes t to guarantee a given leve l of technological quality. For example, they ca n differentiate bread whea ts from nonbread wheats, so that the latter can be segregated after the harvest and excluded from the top grade.
Until 1975- 1976, grain and agricultural merchants lacked positive proof of varietal identity, and co rrect varietal description could only be checked by trained cro p inspectors who examined the growing crop before harvest. Great reliance was placed on a methodical a pproach by contract growers a nd seed
Figure 13. Gel isoelectric focusing (pH 3.5-10) of oat proteins. extracted from the grain with 2.5M urea . Each pa ttern represents a differen t grain or sample. Electrophoregrams 1-3 (from left) are grains of the variety Cassia; 4-6 are Cassia off-types; 7-9 are Avenafatua; and 10-12 a re A vena sterilis subspecies /udoviciana. Conditions: 600 V across an 85 mm gel for 3.5 hours.

248 / Advances in Cereal Science and Technology, Vol. V
processors. Subsamples of seed lots sold had to be retained and grown in control plots to ensure the reliability of the harvesting, delivery, and processing routines. Needless to say, an error discovered at this late stage could not be rectified.
As soon as electrophoresis had proved valid for distinguishing European varieties of wheat and giving positive proof of varietal identity, people accepted the idea of a grain trade based upon variety specification, and two price levels were brought into play. Employees of many European grain companies were trained to carry out electrophoretic tests in their laboratories according to the starch gel procedure of Autran (1975b). In all countries, scientists were made aware of this new tool for improvement of varietal control (Almgard and Clapham, 1977; Bourdet, 1976; Bourdet and Autran, 1976; Colas, 1979; Dal Belin Peruff o, 1980; Ellis, 1976; Ellis and Beminster, 1977; Ewart, 1975; Godon and Autran, 1976; Gunzel, l 976a, l 976b, l 976c; Konarev et al, 1975, I 977; Kuchumova et al,- 1978; Maier and Wagner, 1980; Meyer and Nierle, 1977; Nierle, 1976, 1977; Nitsche and Belitz, 1976; Ohms, 1980; Shewry et al, l 978a; Van Lonkuysen and Marseille, l 978a).
The "Grou pemen t des Associations Meunieres des Pays de la C. E. E." accepted starch gel electrophoresis of gliadins as the standard method for determining variety and recently submitted it to the European Economic Community.
Actually, grain consumers (millers, semolina manufacturers, and bakers) and seed producers (plant breeders and grain merchants) alike have benefited from electrophoretic tests.
Two types of contracts exist at the consumer level: exclusion of some varieties (such as Maris Huntsman or Clement in bread wheats, and Durtal, Rikita, or Tomclair in durum wheats), and a restrictive list of admitted varieties.
The declaration of identity of grain is made by the seller. This declaration is checked by technological tests, including baking tests. Starch gel electrophoresis, which is still an expensive and time-consuming method (50 kernels must be checked in a mixture of varieties), is not used as a routine test but is used every time abnormal behavior is found in technological tests.
The key for identification (catalog) of the varieties, which recently seemed inaccessible to control laboratories, is now commonly used. In France, this key is updated every year. To ensure proper use of the key, monthly collaborative tests are performed.
During seed production, electrophoresis can give additional information before harvest on the purity of a field. Several varieties, which may be morphologically similar, are electrophoretically distinct. Plant breeders can also use this procedure to advantage. Where morphological distinctness is lacking, electrophoresis can show differences between breeding lines that are new and valuable. Since 1977, the record cards of the new varieties registered in France include the starch electrophoregram.
Although it is less developed, electrophoresis is also useful in identifying varieties in other cereals. Malt and beer manufacturers are beginning to take interest in electrophoresis for identification of barley varieties, especially by analysis of malt hordein (Autran and Scriban, I 977; Konarev et al, I 976; Scriban and Strobbel, 1978; Scriban et al, 1979; Shewry et al, 1978b, 1980; Van Lonkh uysen and Marseille, I 978b) or peroxidase (Neyreneuf and Bourdet, I 979) patterns. In France and Italy, where regulations prohibit the use of cereals other than durum wheat in pasta making, electrophoresis is used extensively to check
Gel Electrophoresis of Proteins / 249
for the presence of bread wheats through albumin (Resmini and De Bernardi, 1976) or peroxidase (Kobrehel and Feillet, 1976) patterns. Admixtures of barley can also be detected (J oudrier et al, I 981 ).
B. North America
In Canada, the statutory grade specifications for red spring and durum wheats and barley require that the two top grades be equal in quality to named standard varieties. The implication of this specification is that varieties that are not equal in quality to the standard must be readily identifiable by visual means so that grain of these varieties can be readily segregated in the grain handling system. Grain breeders are encountering difficulties in their attempts to breed in morphological characteristics that will facilitate visual identification in grading. This has generated much interest in a practical, accurate test for variety identification. The electrophoresis test is being actively investigated for this purpose. Further interest in a specific variety identification test has. been generated by the proposal by Canadian Government of Plant Breeders Rights legislation currently before Parliament.
The electrophoresis test has no official status within the Canadian grain handling system. Unofficially, the Canadian Grain Commission, the government agency that regulates handling and grading of grain, uses the electrophoresis test (uniform PAGE) to identify suspected "unlicensed"varieties that are not readily distinguishable visually. The test has been extremely useful in this regard. A catalog of varietal formulas for all the Canadian licensed wheat varieties was published by Zillman and Bushuk (1979b).
The electrophoresis test has been used extensively for identification of varieties (or samples presumed to be particular varieties) in wheat breeding programs. The test is beginning to be used effectively for selecting potential parents for crossing purposes. Certain bands (or blocks of bands) appear to be linked to specific agronomic or quality traits (Sozinov and Poperelya, 1979). In durum wheat, the gliadin electrophoregram is being used for selecting varieties with superior spaghetti cooking quality (Kosmolak et al, 1980; Zillman and. Bushuk, 1979b). The test is also used occasionally for identifying varieties of grain in breeding programs before compositing the samples for quality testing. With the large numbers of samples that are generated by breeding programs, it is easy to mix up varieties. The electrophoresis test has been particularly useful in distinguishing between them.
In the United States, there is no official requirement for identification of grain varieties as part of the commercial grading of the grain. However, in the past few years, the electrophoresis test has attracted some interest for variety identification in the official registration of new varieties. Private plant breeders are exploring the possibility of including the gliadin electrophoregram as evidence of variety uniqueness. A catalog of the electrophoregram formulas of the 80 most commonly grown U.S. wheat varieties was compiled by Jones et al (I 980), using the Bushuk and Zillman (I 978) nomenclature.
As in Canada, the electrophoresis test is now used quite widely in the United States to identify varieties (or samples of grain) in grain breeding programs. In the durum variety development program at North Dakota State University, the
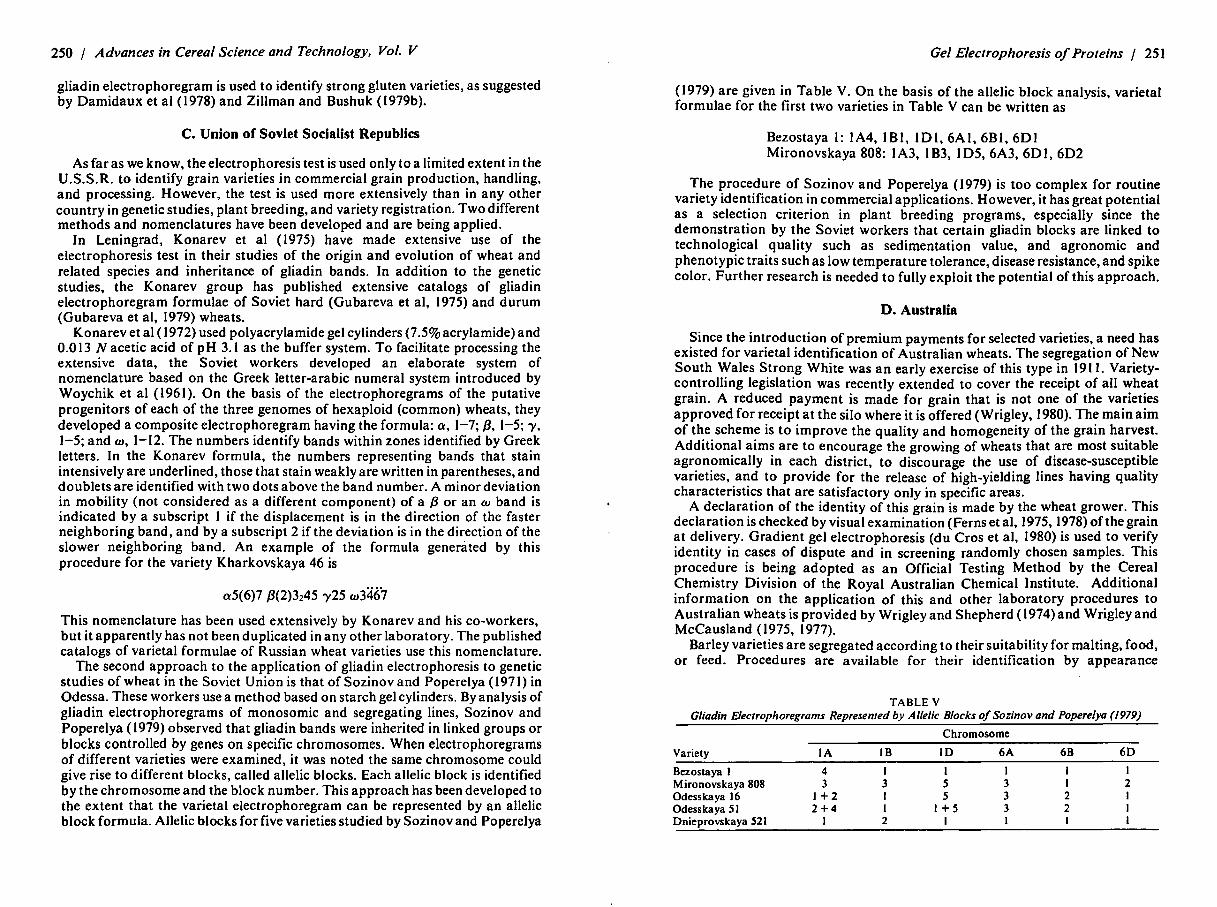
250 / Advances in Cereal Science and Technology. Vol. V
gliadin electrophoregram is used to identify strong gluten varieties, as suggested by Damidaux et al ( 1978) and Zillman and Bushuk ( l 979b ).
C. Union of Soviet Socialist Republics
As far as we know, the electrophoresis test is used only to a limited extent in the U.S.S.R. to identify grain varieties in commercial grain production, handling, and processing. However, the test is used more extensively than in any other country in genetic studies, plant breeding, and variety registration. Two different methods and nomenclatures have been developed and are being applied.
In Leningrad, Konarev et al (I 975) have made extensive use of the electrophoresis test in their studies of the origin and evolution of wheat and related species and inheritance of gliadin bands. In addition to the genetic studies, the Konarev group has published extensive catalogs of gliadin electrophoregram formulae of Soviet hard (Gubareva et al, 1975) and durum (Gubareva et al, 1979) wheats.
Konarev et al ( 1972) used polyacrylamide gel cylinders (7.5% acrylamide) and 0.013 N acetic acid of pH 3.1 as the buffer system. To facilitate processing the extensive data, the Soviet workers developed an elaborate system of nomenclature based on the Greek letter-arabic numeral system introduced by Woychik et al (1961). On the basis of the electrophoregrams of the putative progenitors of each of the three genomes of hexaploid (common) wheats, they developed a composite electrophoregram having the formula: a, 1-7; /3, 1-5; ")', 1-5; and w, 1-12. The numbers identify bands within zones identified by Greek letters. In the Konarev formula, the numbers representing bands that stain intensively are underlined, those that stain weakly are written in parentheses, and doublets are identified with two dots above the band number. A minor deviation in mobility (not considered as a different component) of a {3 or an w band is indicated by a subscript I if the displacement is in the direction of the faster neighboring band, and by a subscript 2 if the deviation is in the direction of t~e slower neighboring band. An example of the formula generated by this procedure for the variety Kharkovskaya 46 is
a5(6)7 /3(2)3245 ")'25 w3461 This nomenclature has been used extensively by Konarev and his co-workers, but it apparently has not been duplicated in any other laboratory. The published catalogs of varietal formulae of Russian wheat varieties use this nomenclature.
The second approach to the application of gliadin electrophoresis to genetic studies of wheat in the Soviet Union is that of Sozinov and Poperelya ( 1971) in Odessa. These workers use a method based on starch gel cylinders. By analysis of gliadin electrophoregrams of monosomic and segregating lines, Sozinov and Poperelya ( 1979) observed that gliadin bands were inherited in linked groups or blocks controlled by genes on specific chromosomes. When electrophoregrams of different varieties were examined, it was noted the same chromosome could give rise to different blocks, called allelic blocks. Each allelic block is identified by the chromosome and the block number. This approach has been developed t.o the extent that the varietal electrophoregram can be represented by an allehc block formula. Allelic blocks for five varieties studied by Sozinov and Poperelya
Gel Electrophoresis of Proteins / 251
(1979) are given in Table V. On the basis of the allelic block analysis, varietal formulae for the first two varieties in Table V can be written as
Bezostaya 1: l A4, 1B1, ID I, 6A I, 6B 1, 601 Mironovskaya 808: I A3, 1 B3, 105, 6A3, 601, 602
The procedure of Sozinov and Poperelya ( 1979) is too complex for routine variety identification in commercial applications. However, it has great potential as a selection criterion in plant breeding programs, especially since the demonstration by the Soviet workers that certain gliadin blocks are linked to technological quality such as sedimentation value, and agronomic and phenotypic traits such as low temperature tolerance, disease resistance, and spike color. Further research is needed to fully exploit the potential of this approach.
D. Australia
Since the introduction of premium payments for selected varieties, a need has existed for varietal identification of Australian wheats. The segregation of New South Wales Strong White was an early exercise of this type in 1911. Varietycontrolling legislation was recently extended to cover the receipt of all wheat grain. A reduced payment is made for grain that is not one of the va!iet~es approved for receipt at the silo where it is offered (Wrigley, 1980). The mam aim of the scheme is to improve the quality and homogeneity of the grain ha~vest. Additional aims are to encourage the growing of wheats that are most smtable agronomically in each district, to discourage the use of disease-susceptible varieties, and to provide for the release of high-yielding lines having quality characteristics that are satisfactory only in specific areas. .
A declaration of the identity of this grain is made by the wheat grower. This declaration is checked by visual examination (Ferns et al, 1975, 1978) of the grain at delivery. Gradient gel electrophoresis (du Cros et al, 1980) is used to veri~y identity in cases of dispute and in screening randomly chosen samples. This procedure is being adopted as an Official Testing Method by the Cereal Chemistry Division of the Royal Australian Chemical Institute. Additional information on the application of this and other laboratory procedures to Australian wheats is provided by Wrigley and Shepherd ( 1974) and Wrigley and McCausland (1975, 1977).
Barley varieties are segregated according to their suitability for malting, food, or feed. Procedures are available for their identification by appearance
TABLE V Gliadin Electrophoregrams Represemed by Allelic Blocks of Sozinov and Popere/ya (1979)
Chromosome
Variety IA 18 ID 6A 68 60
Bezostaya I 4 I I I I I Mironovskaya 808 3 3 s 3 I 2 Odesskaya 16 1+2 I s 3 2 I Odesskaya SI 2+4 I l+S 3 2 I Dnieprovskaya 521 I 2 I I I I

252 / Advances in Cereal Science and Technology, Vol. V
(Fitzsimmons and Wrigley, 1979) and by laboratory methods (McCausland and Wrigley, 1977; Wrigley and McCausland, 1977).
Electrophoretic techniques are also useful for analysis of cereal products in foods (Wrigley, 1977a), for investigation of pedigrees (Wrigley and Shepherd, I 977), and for characterizing off-types in pure-seed production (Appleyard et al, 1979).
V. PROSPECTS FOR FURTHER DEVELOPMENTS
Electrophoretic identification of varieties is one example of the practical application of basic research. The described procedures are based on research conducted I 5 to 20 years ago, which had no more practical aim than to investigate the composition of endosperm protein. This link with basic research will continue to influence the development of improved techniques for grain segregation.
In the future, international agreement on a reference procedure for electrophoretic identification may open the possibility of identification from a catalog of wheats from many countries, instead of the local basis of identification currently used. However, the likely introduction of multiline varieties and recommendations to sow varietal mixtures will greatly complicate the task of identification. So that the implications of such recommendations can be assessed, information on problems of identification should be provided to assist in making decisions. This information may also be required to accompany applications for registration of new varieties, to ensure that varieties of different quality types can be distinguished.
"Dry" methods of analysis are obviously preferred to "wet" chemical analysis. A prime example of a preferred dry method, near-infrared reflectance spectroscopy, may itself soon permit distinction between quality types. Pyrolysis-based methods being applied to the identification of microbes (Ma ugh, I 976) may provide a basis for rapid "dry" varietal identification. Gas-liquid chromatography of steryl esters has been used to distinguish durum from common wheats (Hsieh and Watson, 1977).
However, proteins and nucleic acids still hold the best potential for characterization of genotype. The rapidly advancing field of high-pressure liquid chromatography (Regnier and Gooding, 1980) promises to provide a procedure for analyzing a small volume of grain extract by ion exchange chromatography. The resulting profile might be computer matched to provide identification within minutes. The cereal chemist is challenged to make further research advances for the solution of a very important problem in our food industry.
LITERATURE CITED
ALEXANDRESCU, V., HAGIMA, I., and SAULESCU, N. N. 1979. Peroxidase genetic variants in seeds of some T. aestivum cultivars. Rev. Roum. Biochim. 16:167-173.
ALMGARD, G., and CLAPHAM, D. 1975. lsoenzyme variation distinguishing 18 Avena cultivars grown in Sweden. Swed. J. Agric. Res. 5:61-67.
ALMGARD, G., and CLAPHAM, D. 1977. Swedish wheat cultivars distinguished by content of gliadins and isozymes. Swed. J. Agric. Res. 7:137-142.
ALM GARD, G., and LAN DEG REN, U. 1974. lsoenzymatic variation used for the identification of barley varieties. Z. Pflanzenzuecht. 72:63-67.
ANONYMOUS. 1966. International rules for seed testing. 1966. Proc. Int. Seed Test. Assoc. 31:118.
APPLEYARD. D. B., McCAUSLAND,J.,and WRIGLEY, C. W. 1979. Checking the identity and origin of off-types in the propagation of pedigreed wheat seed. Seed Sci. Technol. 7:459-466.
ARAGONCILLO. C., RODRIGUEZLOPERENA. M.A.. CARBONERO. P .• and GARCIA-OLMEDO. F. 1975. Nigrosine staining of wheat endosperm proteolipid patterns on starch gels. Anal. Biochem. 63:603-606.
AURIAU, P .• AUTRAN, J. C., CHARBONNIER, L., DOUSSINAUL T. G., FEILLET. P., GODON, B .• GRIGNAC, P., JOUDRIER, P .• KOBREHEL, K., KOLLER, J., ROUSSET. M., and RIVALLANT, S. 1976. Variabilite genetique de la composition des gliadines, glutenines. P-amylases, aesterases, peroxydases et phosphatases acides du ble ( T. aestivum). Ann. Amelior. Plant. 26:51-66.
AUTRAN, J. C. 1973. L'identification des varietes de ble. Bull. Anc. Eleves Ee. Fr. Meun. 256:163-169.
AUTRAN, J. C. 1975a. Bies: Une nouvelle methode d'identification. Encycl. Univ. Suppl. Univ.: 171-174.
AUTRAN, J. C. 1975b. Identification des principales varietes communautaires de ble tendre par electrophorese des gliadines du grain. Bull. Anc. Eleves Ee. Fr. Meun. 270:3-11.
AUTRAN, J. C. 1975c. Nouvelles possibilites d'identification des varietes fran~ises de ble par electrophorese de gliadines du grain. Ind. Agric. Alim. 9-10: 1075-1094.
AUTRAN,J. C. 1979. Manueld'instructionssur la technique d'identification des varietes de ble par electrophorese des gliadines. Brochure Inst. Natl. Rech. Agr. 1-58.
AUTRAN, J. C .. and BOURDET, A. 1973. Nouvelles donnees permettant l'exploitation de l'heterogeneite electrophoretique des gliadines du grain de ble en vue d'une identification varietale. C.R. Acad. Sci. Paris. Ser. D. 277:2081-2084.
AUTRAN, J. C,. and BOURDET, A. 1975a. L 'identification des varietes de ble: establissement d'un tableau general de determination fonde sur le diagramme electrophoretique des gliadines du grain. Ann. Amelior. Plant. 25:277-30 I.
AUTRAN. J. C .• and BOURDET, A. 1975b. Nouvelles possibilites de controle varietal qualitatif et quantitatif dans les lots de ble commerciaux. Tech. Ind. Cerealieres 150:7-13.
Gel Electrophoresis of Proteins / 253
AUTRAN. J. C .. and BOURDET. A. 1975c. Possibilites d'un controle varietal qualitatif et quantitatif dans les lots de hies commerciaux. C.R. Acad. Agric. 61:661-669.
AUTRAN, J. C .. and SCRIBAN, R. 1977. Recherche sur la purete varietale d'un malt. European Brewery Convention. Pages 47-62 in: Proc. 16th Congr. Amsterdam.
AUTRAN, J. C .. BUSHUK, W .• WRIGLEY, C. W .. and ZILLMAN. R. R. 1979. Wheat cultivar identification by gliadin electrophoregrams. IV. Comparison of International Methods. Cereal Foods World 24:471-472, 474-475.
AUTRAN, J.C., BERRIER, R., JEANJEAN, M. F., JOUDRIER, P., and KOBREHEL, K. I 981. Emplois de l'electrophorese dans la filiere cereales. Possibilites et limites. Ind. Cereales 8:3-19.
BAXTER, E. D .• and WAINWRIGHT, T. 1978. Hordein and malting quality. Am. Soc. Brew. Chem. 37:8-12.
BEYER. W. H. 1968. Handbook of Tables of Probability and Statistics. 2nd ed. Chemical Rubber Co.: Ohio.
BIETZ, J. A. 1979. Recent advances in the isolation and characterization of cereal proteins. Cereal Foods World 24:199-207.
BOLLING, H., and MEYER. D. 1976. Praktische Erfahrungen mit Erkennungsmethoden auf Grund ailsserer Kornmerkmale. Getreide Mehl Brot 30:20 J-203.
BOURDET, A. 1976. Meunerie Europeenne: L 'identification des varietes de ble par electrophorese. Symp. INRA. Meunerie Francaise 322: 15-21.
BOURDET, A., and AUTRAN, J.C. 1976. Elektrophoretische Bestimmung des Gliadins zur Erkennung von Weizenmischungen. Getreide Mehl Brot 30:203-207.
BOURDET, A .. FEILLET, P., and METTA VANT. F. J 963. Sur le comportement electrophoretique des prolamines du ble en gel d'amidon. C.R. Acad. Sci. 256:4517-4520.
BUSHUK. W .• and ZILLMAN, R. R. 1978. Wheat cultivar identification by gliadin electrophoregrams. I. Apparatus. method, and nomenclature. Can. J. Plant Sci. 58:505-5 I 5.
BUSHUK. W .• SAPIRSTEIN, H. D., and ZILLMAN, R. R. 1978. Wheat cultivar identification by computer analysis of gliadin electrophoregrams (Abstr. C6-l) Cereal Foods World 23:496.
CALDWELL, K. A .• and KASARDA, D. D. 1978. Assessment of genomic and species relationships in Triticum and Aegi/ops by PAGE and differential staining of seed albumins and globulins. Theor. Appl. Genet. 52:273-280.

254 / Advances in Cereal Science and Technology, Vol. V
CANTAGALLI, P., PIAZZI, J. E., and SORDI-GALLI, S. 1969. II controlla della genuinita dell semole di frumento duro e della paste alimentari mediante analisi immunologica. Tee. Molitoria 20:79-84.
CATSIMPOOLAS, N. 1968. Micro isoelectric focusing in polyacrylamide gel columns. Anal. Biochem. 26:480-482.
COLAS, A. 1979. L'identification varietale des hies. Motor. Tech. Agric. 12:64-65.
COLES, G. D., and WRIGLEY, C. W. 1976. Laboratory methods for identifying New Zealand wheat cultivars. N.Z. J. Agric. Res. 19:499-503.
COULSON, C. B., and SIM, A. K. 1964. Proteins of various species of wheat and closely related genera and their relationship to genetical characteristics. Nature 202: 1305-1308.
CUBADDA,-R-.. and QUATIRUCCl, E. 1974. Separation by gel electrofocusing and characterization of wheat esterases. J. Sci. Food Agric. 25:417-422.
CUBADDA, R., and RESMINI, P. 1970. Analyses of cereals and related products by means of electrophoretic techniques in polyacrylamide gels. Proc. Fifth World Cereal Bread Congr. Dresden: 6:159-166.
DAL BELIN PERUFFO, A. 1980. Identificazione di varieta di frumento geneticamente affini mediante electtroforesi su gel di polyacrylamide. Tee. Molitoria 31 :95-10 I.
DAMIDAUX, R., AUTRAN,J. C., GRIGNAC, P., and FEILLET, P. 1978. Relation applicable en selection entre l'electrophoregramme des gliadines et les proprietes viscoelastiques du gluten de Triticum durum Desf. C.R. Hebd. Seances Acad. Sci. Ser. D. 287:701-704.
DASS, H. C. 1972. Analysis of species relationships in A venae by thin-layer chromatography and disc electrophoresis. Can. J. Genet. Cytol. 14:305-316.
DIEZEL, W., KOPPERSCHLAGER, G., and HOFMAN, E. 1972. An improved procedure for staining in polyacrylamide gels with a new type of Coomassie Brilliant Blue. Anal. Biochem. 48:617-620.
DOEKES, G. J. 1969. Wheat grain proteins: Analysis of varieties by starch gel electrophoresis. Thesis, Institute for Cereals, Flour and Bread TNO, Wageningen, The Netherlands.
DRA WERT, F., and GORG, A. 1975. Uber die elektrophoretische Differenzierung und Klassifizierung von Proteinen. VI. DiskElectrophorese und isoelektrische Fokussierung in Polyacrylamid-Gelen von Proteinen und Enzymen aus Tomaten, Gurken, Zuckermais und Zwiebeln. Z. Lebensm. Unters. Forsch. 159:23-30.
du CROS, D. L., and WRIGLEY, C. W. 1978.
Identification of recently registered wheat cultivars. J. Aust. Inst. Agric. Sci. 44: 126-128.
du CROS, D. L., and WRIGLEY, C. W. 1979. Improved electrophoretic methods for identifying cereal varieties. J. Sci. Food Agric. 30:785-794.
du CROS, D. L., WRIGLEY, C. W., and BLAKENEY, A. B. 1979. Fractionation of rice-grain proteins by gradient gel electrophoresis and gel isoelectric focusing: Characterization of rice genotypes. II Riso 28:275-284.
du CROS, D. L., LAWRENCE, G. J., MISKELLY, D., and WRIGLEY, C. W. 1980. Systematic identification of Australian wheat varieties by laboratory methods. Tech. Puhl. 7. CSIRO Wheat Research Unit, North Ryde, NSW, Australia.
ELLIS, J. R. S. 1976. Wheat protein electrophoresis. A contribution to improved quality control. J. Flour Anim. Feed Milling 159:16-18.
ELLIS,J. R. S.,and BEMINSTER, C. H.1977. The identification of U.K. wheat varieties by starch gel electrophoresis of gliadin proteins. J. Natl. Inst. Agric. Bot. 14:221-231.
ELLIS, R. P. 1971. The identification of wheat varieties by the electrophoresis of grain proteins. J. Natl. Inst. Agric. Bot. 12:223-235.
ELTON, G. A. H.,and EWART,J. A. D. 1962. Starch-gel electrophoresis of cereal proteins. J. Sci. Food Agric. 13:62-72.
EWART, J. A. D. 1975. Wheat identification by starch gel electrophoresis. Flour Milling and Baking Res. Ass. Bulletin 10: 147-149.
FEILLET, P. 1965. Contribution a l'etude des proteines du ble. Influence des facteurs genetiques, agronomiques, et technologiques. Ann. Technol. Agric. 14:1-94.
FEILLET, P., and BOURDET, A. 1967. Composition proteique et caracteristiques genetiques des hies. Bull. Soc. Chim. Biol. 49: 1273-1283.
FEILLET, P., and KOBREHEL, K. 1972. Recherche et dosage des produits de ble tendre dans les pates alimentaires par electrophorese des proteines solubles. Ann. Technol. Agric. 21: 17-24.
FEILLET, P .• and NIMMO, C. C. 1970. Soluble proteins of wheat. III. Isolation and characterization of two albumins, ALB 13A and ALB 13B, from flour. Cereal Chem. 47:447-464.
FERNS, G. K., FITZSIMMONS, R. W., MARTIN, R. H., SIMMONDS, D. H., and WRIGLEY, C. W. 1975. Australian wheat varieties: Identification according to growth, head, and grain characteristics. CSIRO: Melbourne, Australia.
FERNS, G. K., FITZSIMMONS, R. W.,
MARTIN, R. H., and WRIGLEY, C. W. 1978. Australian wheat varieties. Supplement I. Eleven recent wheats, grain defects, and appendices on foreign seeds and insects. CSIRO: Melbourne, Australia.
FINLAYSON, A. J., BHATTY, R. S., and CHRIST, C. M. 1969. Species and varietal differences in the proteins of rape seed. Can. J. Botany 47:679-685.
FITZSIMMONS, R. W., and WRIGLEY, C. W. 1979. Australian barleys. Identification of varieties, grain defects, and foreign seeds. CSI RO: Melbourne, Australia.
GARCIA-FAURE, R., MERCK-LUENGO, J. G., and GARCIA-OLMEDO, F. 1969. Detection of flour or farina from T. aestivum in macaroni by starch gel electrophoresis of water-soluble proteins. Cereal Chem. 46:621-625.
GAVRILYUK, 1. P.,and DIAGUILEVA,G. E. 1975. Varietal identification of barleys from hordein electrophoretic patterns. Pages 1-14 in: Dokl. V.I.R. V. G. Konarev and A. Y. Trofimovsk, eds. VIR: Leningrad.
GODON, B., and AUTRAN, J.C. 1976. Profils technologiques des varietes de ble tendre incrites au catalogue en 1975 et 1976. Bull. Anc. Eleves Ee. Fr. Meun. 273: 129-132.
GRAHAM, J. S. D. 1963. Starch gel electrophoresis of wheat flour proteins. Aust. J. Biol. Sci. 16:342-349.
GUBAREVA, N. K., GAVRILYUK, l. P.,and CHERNOBUROVA, A. D. 1975. Determination of the identity and the cultivar purity of wheat grain according to electrophoretic patterns of the gliadins. Experimental methods and catalogue of cultivar electrophoregrams. Dokl. Vses. Akad. Sel'skhokh. Nauk 6:1-39.
GUBAREVA, N. K., RUDENKO, M. I., and CHERNOBUROVA, A. D. 1979. Comparative analysis of cultivars of durum wheat by gliadin electrophoretic spectra (in Russian). Tr. Prikl. Bot. Genet. Sel. 63:24-31.
GUNZEL, G. 1976a. Elektrochemisches Verhalten harnstoffloslicher Komponenten von Weizenkleber Proteinen. Z. Pflanzenernaehr. Bodenkd. 2: 169-180.
GUNZEL, G. 1976b. Sortendifferenzierung bei Weizen mittels Polyakrylamidegel Elektrophorese von Gliadin. Z. Acker Pflanzenbau 143:83-87.
GUNZEL, G. 1976c. Zur Problematik der elektrophoretischen Sortenunterscheidung am Gliadimmuster des Weizens. Getreide Mehl Brot 30:210-212.
GUNZEL. G., and FISCHBECK. G. 1979. Diagnosing the variety of a barley corn. Method and reliability of an electrophoretic process in practical use. Brauwissenschaft
Gel Electrophoresis of Proteins / 255
32:226-232. HAMAUZU, Z., YONEZAWA, D., and
SHIMOMURA, H. 1967. Immunoelectrophoret analysis of wheat flour albumins. Agric. Biol. Chem. 31 :448-451.
HSIEH, C. C., and WATSON, C. A. 1977. Qualitative and quantitative analysis of wheat steryl esters by gas-liquid chromatography. Cereal Foods World 22:479. .
HUSSEIN, K. R. F., and STEGEMANN, H. 1978. Comparison of proteins from wheat kernels by various electrophoretic methods in polyacrylamide. Z. Acker Pflanzenbau 146:68-78.
JONAS, K. 1978. Ergebnisse des Teigtestes und der Elektrophorese an Weisenproben der Ernte 1977 in Bayern. Muhle und Mischfuttertechnik 115:569-571.
JONES, B. L., LOOKHART, G. L., HALL, S. B.,and FINNEY, K. F. 1980. Polyacrylamide gel electrophoretic patterns of gliadin proteins from the 80 most commonly grown U.S. wheat varieties. (Abstr.) Cereal Foods World 25(8):51 I.
JONES, R. W., TAYLOR, N. W., and SENTI, F. R. 1959. Electrophoresis and fractionation of wheat gluten. Arch. Biochem. Biophys. 84:363-376.
JOUDRIER, P. 1974. Specificite genetique de la ~-amylase chez Triticum aestivum: Existence de 5 types varietaux de zymogrammes. C.R. Acad. Sci. 278, Ser. D:l777-1780.
JOUDRIER, P., and BERNARD, M. i977. Responsabilite du genome D sur certaines isozymes beta-amylase du grain de ble tend re. Ann. Amelior. Plant. 27:35-47.
JOUDRIER, P., GOBIN, G., and WOAYEHUNE, C. 1981. Possibilite de detecter la presence d'orge dans les pates alimentaires. Ann. Falsif. Expert. Chim. In Press.
JULIANO, 8. 0. 1980. Rice: Recent progress in chemistry and nutrition. Pages 407-428 in: Cereals for Food and Beverages. Recent Progress in Cereal Chemistry and Technology. G. E. Inglett, and L. Munck, eds. Academic Press, Inc.: New York.
KIMBER, G. 1971. The inheritance of red grain colour in wheat. Z. Pflanzenzuecht. 66: I 5 l-157.
KING, J., and LAEMMLI, U. K. 1971. Polypeptides of the tail fibres of bacteriophage T4. J. Mol. Biol. 62:465-477.
KOBREHEL, K., and FEILLET, P. 1975. Method officielle de determination de la teneur en ble tendre des pates alimentaires et des semoules. J. Off. Repub. Fr. 6:102-106.
KOBREHEL. K .• and FEILLET, P. 1976. Detection et dosage des bles tendres dans Ies pates alimentaires. Ann. Falsif. Expert. Chim. 69:47-55.
KOBREHEL, K., and GAUTIER, M. F. 1974.

256 / Advances in Cereal Science and Technology, Vol. V
Variability in peroxidase isozymes in wheat and related species. Can. J. Botany 52:755-759.
KONAREV, A. V. 1978. Identification of albumin 0.19 in grain proteins of cereals. Cereal Chem. 55:927-936.
KONAREV, V. G., GAVRILYUK, I. P., and GUBAREVA, N. K. 1975. The method of cul ti var identification of wheat grain meal (in Russian). Rep. 507271. Bull. Discovery, Invention 11.
KONAREV, V. G., Y AKUBZINER, M. M., TROFIMOVSKA YA, A. Y., GAVRILYUK, I. P., GUBAREVA, N. K., and CHERNOBUROVA, A. D. 1976. The determination of cultivars of wheat and-barley grain by protein formulas (in Russian). Vest. Skh. Nauki. 9:_124-129.
KONAREV, V. G., GAVRILYUK, I. P., and GUBAREVA, N. K. 1977. Gliadin polymorphism and its use in identifying varieties and registration of genetic resources with regard to wheat and other cereals (in Russian). Vestn. Skh. Nauki. 7:84-93.
KOSMOLAK, F. G., DEXTER, J. E., MATSUO, R. R., LEISLE, D., and MARCHYLO, B. A. 1980. A relationship between durum wheat quality and gliadin electrophoregrams. Can. J. Plant Sci. 60:427-432.
KUCHUMOVA, I. P., RABINOVICH, S. V., and PARKHOMENKO, R. G. 1978. Electrophoretic spectra of prolamines in connection with economic and biologic characteristics of wheat varieties (in Russian). Fiziol. Biokhim. Kutt Rast. 10:30-33.
LAMKIN, W. M., and MILLER, B. S. 1980. Note on the use of sodium hydroxide to distinguish red wheats from white common, club, and durum wheats. Cereal Chem. 57:293-294.
LAMKIN, W. M., and MILLER, B. S. 1981. Polyphenol oxidase activities of hard red winter, soft red winter, hard red spring, white common, club, and durum wheat cultivars. Cereal Chem. 58:27.
LAWRENCE, G. J., and SHEPHERD, K. W. 1980. Variation in glutenin subunits of wheat. Aust. J. Biol. Sci. 33:221-233.
LEABACK, D. H., and WRIGLEY, C. W. 1976. Isoelectric focusing of proteins. Pages 272-320 in: Chromatographic and Electrophoretic Techniques, Vol. 2. Zone Electrophoresis, 4th ed. I. Smith, ed. Wm. Heinemann Medical Books: London.
LEE, J. W., and RONALDS, J. A. 1967. Effect of environment on wheat gliadin. Nature 213:844-846.
LEE, J. W., and WRIGLEY, C. W. 1963. The protein composition of gluten extracted from
different wheats. Aust. J. Exp. Agric. Anim. Hush. 3:85-88.
LLEWELLYN, J. W., and FLAHERTY, B. 1976. The detection and estimation of soya protein in food products by isoelectric focusing. J. Food Technol. 11 :555-563.
LUNDSTROM, R. C. 1980. Fish-species identification by thin-layer polyacrylamide gel isoelectric focusing: Collaborative study. J. Assoc. Off. Anal. Chem. 63:69-73.
LUNDSTROM, R. C., and RODERICK, S. A. 1979. Fish-species identification by thin-layer isoelectric focusing of sarcoplasmic proteins. Sci. Tools 26:38-43.
MAIER, G., and WAGNER, K. 1980. Routinemethode zur Identifizierung von Weizensorten mit Hilfe der Polyakrylamidegelelektrophorese. Z. Lebensm. Unters. Forsch. 170:343-345.
MARGOLIS, J., AND WRIGLEY, C. W. 1975. Improvement of pore gradient electrophoresis by increasing the degree of cross-linking at high acrylamide concentrations. J. Chromatogr. 106:204-209.
MAUGH, T. H. 1976. Pyrolysis-spectrometry: automated identification of microbes. Science 194:1403-1405, 1447.
McCAUSLAND, J., and WRIGLEY, C. W. 1976. Electrophoretic analysis of wheat and rye mixtures in meal, flour, and baked goods. J. Sci. Food Agric. 27:1197-1202.
McCAUSLAND, J., and WRIGLEY, C. W. 1977. Identification of Australian barley cultivars by laboratory methods: Gel electrophoresis and gel isoelectric focusing of the endosperm proteins. Aust. J. Exp. Agric. Anim. Husb. 17:1020-1027.
MECHAM, D. K., KASARDA, D. D., and QUALSET, C. 0. 1978. Genetic aspects of wheat gliadin proteins. Biochem. Genet. 16:831-853.
MENKE, J. F., SINGH, R. S., QUALSET, C. 0., and JAIN, S. K. 1973. Protein electrophoresis aids cereal variety identification. Calif. Agric. 37:3-5.
MESROB, B. K., and IVANOV, C. P. 1970. Comparative fraction composition of hordein from different barley varieties. C.R. Acad. Bulg. Sci. 23:291-294.
MEYER, D., and NIERLE, W. 1977. Zur Differenzierung von Weizensorten auf Grund morphologischer und chemischer Unterschiede. Getreide Mehl Brot 31:258-261.
MINETTI, M., PETRUCCI, T., POCCHIARI, F., SILANO, V., and AVELLA, R. 1971. Varietal differences in water soluble gliadin fractions of durum wheat and bread wheat. J. Sci. Food Agric. 22:72-74.
NAKAI, Y.1973. IsozymevariationinAegi/ops and Triticum. I I. Esterase and acid
phosphatase isozymes studied by the gel isoelectrofocusing method. Seiken Ziho 24:45-73.
"1AKAI, Y. 1979. Isozyme variations in Aegi/ops and Triticum. IV. The origin of the common wheats revealed from the study on esterase osozymes in synthesized hexaploid wheat. Jpn J. Genet. 54: 175-189.
NEYRENEUF, 0., and BOURDET, A. 1979. Identification of barley varieties. Bios. 10:73-79.
NIERLE, W. 1976. Versuche zur elektrophoretischen Erkennung von Weizensorten. Getreide Mehl Brot 8:207-210.
NIERLE, W. 1977. Elektrophorese von Weizengliadinen, ein Hilfsmittel zur Qualitatskontrolle. Muhle und Mischfuttertechnik 114: 101-103.
NIMMO, C. C., and O'SULLIVAN, M. T. 1967. Immunochemical comparisons of antigenic proteins of durum and hard red spring wheats. Cereal Chem. 44:584-591.
NISHIKAWA, K.,and NOBUHARA, M.1971. Genetic studies of a-amylase isozymes in wheat. I. Location of genes and variation in tetra- and hexaploid wheat. Jpn. J. Genet. 46:345-353.
NITSCHE, G., and BELITZ, H. D. 1976. Elektrophoretische Untersuchung wasserlOslichet Weizenproteine. Getreide Mehl Brot 30:213.
OHMS, J. P. 1980. Elektrophoretische Sortendiagnose von Getreide. z. Lebensm. Unters. Forsch. 170:27-30.
ORY, R. L., CONKERTON, E. J.,and SEK UL, A. A. 1979. Peanut proteins in food products. Pages 447-462 in: Tropical foods: Chemistry and Nutrition, Vol. 2. G. E. Inglett, and G. Charalambous, eds. Academic Press, Inc.; New York.
OWEN, C. H., and AINSLIE, M. M. 1971. Handbook on Varietal Identification by Kernel Characters; Barley, Wheat, and Small Oilseeds. Queen's Printer for Canada, Ottawa.
PARK, W. M., and STEGEMANN, H. 1979. Rice protein patterns. Comparison by various PAGE-techniques in slabs. Z. Acker Pflanzenbau 148:446-454.
PAULIS,J. W.,and WALL,J.S.1979. Note on mill for pulverizing single kernels of cereals for isoelectric focusing. Cereal Chem. 56:497-498.
PIAZZI, S. E., and CANTAGALLI, P. 1969. Immunochemical analysis on soluble proteins of wheat. Cereal Chem. 46:642-646.
PIAZZI, S. E., RIPARBELLI, G., SORDI, S., CANT AGALLI, P., POCCHIA RI, F., and SILANO, V. 1972. Immunochemical characterization of specific albumins of bread wheat.
Gel Electrophoresis of Proteins / 257
Cereal Chem. 49:72-78. QUALSET, C. 0., and WRIGLEY, C. W. 1979.
Electrophoresis and electrofocusing identify wheat varieties. Calif. Agric. 33: 10-12.
REDMAN, D. G. FERGUSON, S., and BURBRIDGE, K. 1980. Identification of wheat varieties by polyacrylamide gel electrophoresis. Pages 63-69 in: Bull. 2, Flour Milling and Baking Res. Assoc. Chorleywood, U.K.
REGNIER, F. D.,and GOODING, K. M. 1980. High-performance liquid chromatography of proteins. Anal. Biochem. 103: 1-25.
RESMINI, P. 1968. Un nuovo metodo per identificare e dosare gli sfarinati di grano tenero presenti in quelli di grano duro e nelle paste alimentari. Tee. Molitoria 19: 145-168.
RESMINI, P., and de BERNARDI, G. 1976. Un metodo elettroforetico rapido per ii riconoscimento ed ii dosaggio del grano tenero nel grano duro, negli sfarinati e nelle paste alimentari. Tee. Molitoria 27:97-109.
RIGHETTI, P. G., GIANAZZA, E., SALAMINI, F., and GALANTE, E. 1977. Zein macro molecular properties, biosynthesis and genetic regulation. Pages 199-211 in: Electrofocusing and Isotachophoresis. B. J. Radola, and D. Graesslin, eds. Walter de Gruyter: Berlin.
SAPIRSTEIN, H. D. 1981. M.Sc. thesis. Wheat cul ti var identification by computer analysis of gliadin electrophoregrams. University of Manitoba, Winnipeg, Canada.
SCRIBAN, R., and STROBBEL, B. -1978. Etude chimiotaxonomique de l'orge et du malt par electrofocalisation. C.R. Acad. Sci. Paris, Ser. D, 287:841-843.
SCRIBAN, R., AUTRAN, J.C., STROBBEL, B., and NICOLAIDIS, M. 1979. Preliminary report on various analytical studies for barley and malt. Bios. 10:80, 83-87.
SENSER, F. 1976. Sortenmerkmale von Weizenkorner-11. Beeinflussung der ausseren Merkmale von Weizenko rner durch Umweltfaktoren. Getreide Mehl Brot 30: 199-20 I.
SHEWRY, P.R., FAULKS, A. J., PRATT, H. M., and MIFLIN, B. J. 1978a. The varietal identification of single seeds of wheat by sodium dodecyl sulfate polyacrylamide gel electrophoresis of gliadin. J. Sci. Food Agric. 29:847-849.
SHEWRY, P.R., ELLIS,J. R. S., PRATT, H. M., and MIFLIN, B. J. 1978b. A comparison of methods for the extraction and separation of hordein fractions from 29 barley varieties. J. Sci. Food A~ric. 29:433-441
SHEWRY, P. R., PRATT, H. M., and MIFLIN, B. J. 1978c. Varietal identification of barley by analysis of hordein polypeptides.
258 / Advances in Cereal Science and Technology, Vol. V
J. Sci. Food Agric. 29:587-596. SHEWRY. P.R .• FAULKS. A. J .• PARMAR,
S., and MIFLIN. B. J. 1980. Hordein polypeptide pattern in relation to malting quality and the varietal identification of malted barley grain. J. Inst. Brew. 86: 138-141.
SILANO, V .• and POCCHIARI, F. 1968. A specific color reaction of albumin, globulin. and gliadin preparations from wheat. Cereal Chem. 48:445-447.
SILANO, V .• deCILLIS, U.,and POCCHIARI, F. 1967. Composizione elettroforetiche di estratti proteici di T. aestivum e T. durum. Ann. 1st. Super. Sanita 3:559-563.
SILANO. V., de CILLIS. U., de PONTE. R .• D'ERRICO, A. M., and POCCHIARI, F. I 968. L •analisi delle composizioni electtroforetiche di estratti proteici albuminici e globulinici nella differenziazione del T. aestivum dal T. durum. Ric. Sci. 38:745-748.
.SILANO, V.,deCILLIS, U.,and POCCHIARI, F. 1969. Varietal differences in albumin and globulin fractions of Triticum aestivum and T. durum. J. Sci. Food Agric. 20:260-261.
SINGH, R. S.,JAIN, S. K.,and QUALSET, C. 0. 1973. Protein electrophoresis as an aid to oat variety identification. Euphytica 22:98-105.
SMITH, J. B., and BENNETT, M. D. 1974. Amylase isozymes of oats (Avena saliva L. ). J. Sci. Food Agric. 25:67-71.
SOAVE, C., VIOTTI, A., SALAMINI. F .• GENTINETTA, E .• GIANAZZA, E., and RIGHETTI, P. G. 1977. Techniques for the separation of seed proteins of maize. Pages 61-68 in: Techniques for Separation of Barley and Maize Proteins. B. J. Miflin and P. R. Shewry. eds. Commission of the European Communities, Luxembourg.
SOZINOV, A. A., and POPEREL YA, F. A. 1971. Vertical electrophoresis of alcoholsoluble proteins of endosperm in starch gel as a method for studies of genetic characteristics of wheat (in Russian). Dokl. Vses. Akad. Sel'skhokh. Nauk. 2:9-11.
SOZINOV, A. A., and POPER ELY A, F. A. 1979. Polymorphism of prolamines and selection (in Russian). Dokl. Vses. Akad. Sel'skhokh. Nauk. 10:21-34.
STEGEMANN. H. 1977. Plant proteins evaluated by two-dimensional methods. Pages 385-393 in: Electrofocusing and lsotachophoresis. B. J. Radola and D. Graesslin, eds. Walter de Gruyter: Berlin.
SUH, H. W., GOFORTH, D. R., CUNNINGHAM, B. A., and LIANG, G. H. 1977. Biochemical characterization of six trisomics of grain sorghum. Sorghum bicolor (L.) Moench. Biochem. Genet. 15:611-620.
VAN LONKHUYSEN. H.J.,and MARSEILLE, J. P. 1978a. Jdentifiezierung van Gerstensorten
durch Starkegelelektrophorese. Getreide Mehl Brot 32:288-291.
VAN LONKHUYSEN. H. J.,and MARSEILLE, J. P. 1978b. Schnellmethode zur ldentifizierung von Weizensorten durch die Starkegelelektrophorese. Gertreide Mehl Brot 32: 146-149.
VINOGRADOV. S. N., LOWENKROW, S., ANDONIAN, M. R., BAGSHAW, J .• FELGENHAVER, K .• and PAK, S. J. 1973. Synthetic ampholytes for the isoelectric focusing of proteins. Biochem Biophys. Res. Commun. 54:501-506.
WILLIAMSON, J. A., KLEESE, R. A., and SNYDER, J. R. 1968. Electrophoretic variation in esterases of three varieties of oats (Avena sativa). Nature 220: 1135-1136.
WINDEMANN, H., MUELLER. U., and BAUMGARTNER. E. 1973. Isoelektrische Fokussierung und zweidimensionale Auftretung einer wasserloslichen Proteinfraktion von Hart - und Weichweizen aus Teigwarenprodukten. Z. Lebensm. Unters. Forsch. 153:17-22.
WOYCHIK, J. H .• BOUNDY, J. A .• and DIMLER, R. J. 1961. Starch gel electrophoresis of wheat gluten proteins with concentrated urea. Arch. Biochem. Biophys. 94:477-482.
WRIGLEY, C. W. 1968. Gel electrofocusing: A technique for analyzing multiple protein samples by isoelectric focusing. Sci. Tools 15: 17-23.
WRIGLEY, C. W. 1970. Protein mapping by combined gel electrofocusing and electrophoresis: Application to the study of genotypic variations in wheat gliadins. Biochem. Genet. 4:509-516.
WRIGLEY. C. W. 1976a. Single-seed identification of wheat varieties: Use of grain hardness testing. electrophoretic analysis, and a rapid test-paper for phenol reaction. J. Sci. Food Agric. 27:429-432.
WRIGLEY, C. W. 1976b. Isoelectric focusing/ electrophoresis in gels. Pages 93-117 in: Isoelectric Focusing. N. Catsimpoolas, ed. Academic Press: New York.
WRIGLEY, C. W. 1976c. Identification, distribution, and origin of two lines of Olympic wheat. J. Aust. Inst. Agric. Sci. 42:244-246.
WRIGLEY, C. W. 1977a. Characterization and analysis of cereal products in foods by protein electrophoresis. Food Technol. Aust. 29:17-20.
WRIGLEY, C. W. 1977b. Wheat cultivars quickly identified by modified phenol test. J. Aust. Inst. Agric. Sci. 43: 148.
WRIGLEY, C. W. 1977c. Isoelectric focusing of seed proteins. Pages 211-264 in: Biological
and Biomedical Applications of lsoelectric Focusing. N. Catsimpoolas and J. Drysdale. eds. Plenum Press: New York.
WRIGLEY. C. W. 1980. Improving Australian wheat quality by varietal management: Identification of varieties. Food Technol. Aust. 32:508-511.
WRIGLEY, C. W. 1981. The genetic and chemical significance of varietal differences in gluten composition. Ann. Technol. Agric. In Press.
WRIGLEY. C. W., and BAXTER. R. I. 1974. Identification of Australian wheat cultivars by laboratory procedures: Grain samples containing a mixture of cultivars. Aust. J. Exp. Agric. Anim. Hush. 14:805-810.
WRIGLEY. C. W., and McCAUSLAND, J. 1975. Instruction manual on laboratory procedures for identifying grain samples of Australian wheat varieties. Technical Publication 3, CSIRO Wheat Research Unit, North Ryde, 2113, Australia. 27 pp.
WRIGLEY. C. W .• and McCAUSLAND. J. 1977. Variety identification by laboratory methods. Instruction manual for barley and other cereals. Tech. Puhl. 4, CSIRO Wheat Research Unit. North Ryde, 2113, Australia, 25 pp.
WRIGLEY. C. W .• and McINTOSH. R. A. 1975. Genetic control of factors regulating the phenol reaction of wheat and rye grain. Wheat Information Service (Japan) 40:6-10.
WRIGLEY. C. W., and MOSS, H. J. 1968. Selection for grain quality in wheat breeding. Pages 439-448 in: Proc. 3rd Int. Wheat Genet. Symp. K. W. Finlay and K. W. Shepherd, eds. Butterworths, Sydney.
WRIGLEY. C. W .• and SHEPHERD. K. W. 1973. Electrofocusing of grain proteins from wheat genotypes. Ann. N. Y. Acad. Sci. 209: 154-162.
WRIGLEY, C. W., and SHEPHERD, K. W. 1974. Identification of Australian wheat cultivars by laboratory procedures: Examination of pure samples of grain. Aust. J. Exp.
Gel Electrophoresis of Proteins / 259
Agric. Anim. Hush. 14:796-804. WRIGLEY. C. W .• and SHEPHERD, K. W.
1977. Pedigree investigation using biochemical markers: The wheat cultivar Gabo. Aust. J. Exp. Agric. Anim. Hush. 17:I028-I031.
WRIGLEY,C. W.,and WEBSTER, H. L.1966. The effect of stem rust infection on the soluble proteins of wheat leaves. Aust. J. Biol. Sci. 19:895-901. .
WRIGLEY, C. W., du CROS, D. L., ARCHER. M. J., DOWNIE. P. G., and ROXBURGH. C. M. 1980. The sulfur content of wheat-endosperm proteins and its relevance to grain quality. Aust. J. Plant Physiol. 7:755-766.
WRIGLEY, C. W., ROBINSON, P. J., and WILLIAMS, W. T. 1981. Computer-based comparison of electrophoretic patterns for identifying cereal varieties and for investigating relationships between protein composition and phenotypic characteristics. J. Sci. Food Agric. In Press.
YADAVA. J. S., CHOWDHURY, J. B., KAKAR, S. N., and NAINAWATEE, H. S. 1979. Comparative electrophoretic studies of proteins and enzymes of some Brassica species. Theor. Appl. Genet. 54:89-91.
ZEVEN, Z. C., DOEKES, G. J., and KISLEV, M. 1975. Proteins in old grains of Triticum sp. J. Archaeol. Sci. 2:209-213.
ZILLMAN, R. R., and BUSHUK, W. 1979a. Wheat cultivar identification by gliadin electrophoregrams. JI. Effects of environmental and experimental factors on the gliadin electrophoregram. Can. J. Plant Sci. 59:281-286.
ZILLMAN, R. R., and BUSHUK, W. 1979b. Wheat cultivar identification by gliadin electrophoregrams. III. Catalogue of electrophoregram formulas of Canadian wheat cultivars. Can. J. Plant Sci. 59:287-298.
ZUCKERKANDL, E., and PAULING, L. 1965. Molecules as documents of evolutionary history. J. Theor. Biol. 8:357-366.