Identification of antigenic peptides derived from B-cell ...
IDENTIFICATION OF ANTIHYPERTENSIVE PEPTIDES IN
NUTRACEUTICALS BY CAPILLARY ELECTROPHORESIS-MASS
SPECTROMETRY
Fernando Benaventea,*, Roger Pero-Gascona, Laura Ponta, Joaquim Jaumotb, José
Barbosaa, Victoria Sanz-Nebota
aDepartment of Chemical Engineering and Analytical Chemistry, Institute for Research
on Nutrition and Food Safety (INSA·UB), University of Barcelona, Martí i Franquès 1-
11, 3rd floor, 08028, Barcelona, Spain.
bDepartment of Environmental Chemistry, IDAEA-CSIC, Jordi Girona 18-26, 08034,
Barcelona, Spain.
*Corresponding author: [email protected] (F. Benavente, PhD)
Tel: (+34) 934039116 Fax: (+34) 934021233
Declarations of interest: none
KEYWORDS: Bioactive peptides; Capillary electrophoresis; Chemometrics;
Foodomics; Peptidomics; Mass spectrometry
Non-standard abbreviations:
BGE: background electrolyte
CE-MS: capillary electrophoresis-mass spectrometry
CSN: casein
EIE: experimental extracted ion electropherogram

HAc: acetic acid
HFor: formic acid
MCR-ALS: multivariate curve resolution alternating least squares
ROIs: regions of interest
TIE: total ion electropherogram

4
ABSTRACT
We present capillary electrophoresis-mass spectrometry (CE-MS) in combination with
advanced chemometric tools for the analysis of bioactive compounds in food, in
particular for the identification of antihypertensive peptides in a nutraceutical derived
from a bovine milk protein hydrolysate. Different extracts of the nutraceutical were
analyzed by CE-MS, and the electropherograms were processed using a novel data
analysis workflow that included regions of interest (ROIs) compression and multivariate
curve resolution alternating least squares (MCR-ALS). MCR-ALS permitted the
description of the nutraceutical extract as ten characteristic components with their
electrophoretic profiles and mass spectra. Twenty-two compounds were tentatively
identified as antihypertensive bovine casein fragments through a mass search in a
database of bioactive peptides. The identity of 17 antihypertensive peptides was reliably
confirmed by capillary electrophoresis-tandem mass spectrometry. The proposed
analytical approach demonstrated the potential to obtain a characteristic and activity-
related fingerprint for quality control and authentication of the antihypertensive
nutraceutical.

5
1. Introduction
Many peptide fragments derived from food protein hydrolysates are of great interest in
food and pharmaceutical sciences because they present different physiological roles,
providing benefits in human health [1–6]. Milk and milk-derived protein hydrolysates
are one of the most studied sources of biologically active peptides and they are regarded
as potential ingredients of functional dairy foods, nutraceuticals, and cosmetics [1–3].
Bovine milk is accessible and inexpensive and contains approximately 3.5% (m/m) of
proteins, with 80% (m/m) of casein (CSN) and 20% (m/m) of whey proteins [1]. Many
bovine CSN and whey protein fragments with different bioactivities have been
described, including, among others, immunostimulation, antimicrobial, opioid, metal
binding, antithrombotic, allergenic and angiotensin converting enzyme (ACE) inhibition
[1–3,7–9]. ACE inhibitors are by far the largest and most investigated group, as it is
evidenced by the number of papers published on this topic that are cited in the most
comprehensive on-line databases, such as BIOPEP [7] (a general database of bioactive
peptides, http://www.uwm.edu.pl/biochemia/index.php/pl/biopep), AHTPDB [8] (a
specific database of antihypertensive peptides, http://crdd.osdd.net/raghava/ahtpdb/) or
MBPDB [9] (a specific database of bioactive peptides in milk,
http://mbpdb.nws.oregonstate.edu/). ACE participates in blood pressure regulation and
inhibition of this enzyme, which has been demonstrated in most cases in vitro, could
have an antihypertensive effect in vivo [2,8]. With this idea in mind, over the past years,
several antihypertensive functional foods and nutraceuticals have been launched
worldwide [2,10]. Consumer awareness about the benefits of these state-of-the-art
pharmaco-nutritional products with bioactive peptides is continuously increasing, but
also the concerns about the absence of reliable clinical trials supporting evidence for

6
health claims in vivo, allergenicity, cytotoxicity and stability of the peptides during
gastrointestinal digestion [2]. Furthermore, it is necessary to develop novel analytical
methods for the characterization of functional foods and nutraceuticals with bioactive
peptides, as part of quality control, food safety and fraud control programs [11,12].
Most of the methods that have been developed for the analysis of peptides in milk
protein hydrolysates in a wide variety of food products are based on reversed-phase
liquid chromatography-mass spectrometry (LC-MS) [10–12]. Capillary electrophoresis-
mass spectrometry (CE-MS) has been applied to a lower extent [11–15], despite the
many and well-known benefits of this high-performance separation technique based on
electromigration, which provides complementary, and very often better, separations
than hydrophobicity-driven reversed-phase LC-MS, especially for charged polar
compounds [16]. In this respect, we have described a CE-MS method to identify the
presence of bioactive peptides in several commercial hypoallergenic infant formulas
manufactured by hydrolysis of bovine milk proteins to diminish the risk of protein
allergy [13,14]. A sample clean-up and preconcentration using a citrate buffer with
dithiothreitol (DTT) and urea followed by solid-phase extraction (SPE) with a C18
sorbent was applied before CE-MS. Then, features and bioactive peptides were searched
in the electropherograms using the typical tools of the commercial software packages
provided with the mass spectrometer [13,14] or similar alternatives freely available on-
line [15], which very often are difficult and tedious to use and must be carefully applied
to avoid biased and unreliable results. As an alternative to this traditional data analysis
methods, here, using as a case study a topic of interest nowadays in food analysis, such
as the identification of antihypertensive peptides in a nutraceutical derived from a milk
protein hydrolysate, we propose a data analysis workflow for data pre-processing, data
7
resolution and untargeted compound (feature) finding based on advanced chemometric
tools [17], specifically regions of interest (ROIs) compression [18] and multivariate
curve resolution alternating least squares (MCR-ALS) [19,20]. The core of the current
data analysis workflow was adapted to be applied for the first time in foodomics from
our previous LC-MS and CE-MS studies in metabolomics [21–23], because bioactive
peptides are, as metabolites, low molecular mass compounds. For the identification of
the selected features, we propose the use of the information available in the most
comprehensive and currently updated on-line databases that were indicated above [7–9],
which in case of AHTPDB [8] and MBPDB [9] were recently developed. The proposed
analytical approach demonstrated a great potential for the simple, rapid and systematic
identification of antihypertensive peptides in the nutraceutical sample. The obtained
characteristic and activity-related fingerprint of antihypertensive bovine casein peptide
fragments for the nutraceutical analyzed in this study could be very useful for quality
control and authentication.

8
2. Materials and methods
2.1. Chemicals, reagents and samples
All the chemicals used in the preparation of background electrolytes (BGEs) and
solutions were of analytical reagent grade or better. Acetic acid (HAc, glacial), formic
acid (HFor, 25% (v/v)), sodium hydroxide (≥99.0% (m/m)) and water (LC-MS grade)
were purchased from Merck (Darmstadt, Germany). Propan-2-ol (LC-MS grade) was
purchased from Scharlau (Barcelona, Spain).
The antihypertensive nutraceutical (N) was purchased at a local parapharmacy. In
accordance with the information provided by the manufacturer, it is a mixture of vegetal
extracts with approximately 9 g of hydrolyzed casein proteins per 100 g of nutraceutical
(i.e. 62.5 mg / 1 tablet). The tablets were stored at room temperature when not in use.
2.2. Electrolyte solutions, sheath liquid and sample solutions
The BGE contained 1 M HAc (measured pH was 2.3) and was passed through a 0.22
µm nylon filter (MSI, Westboro, MA, USA) before analysis. The sheath liquid solution
consisted of a mixture of 60:40 v/v propan-2-ol:water with a 0.05% (v/v) of HFor. The
sheath liquid was degassed for 10 min by sonication before use [13,14].
Ten nutraceutical tablets were ground together with mortar and pestle until a fine
powder was obtained. The powder (0.15 g) was added to a plastic vial with 1 mL of
warm water (at 45ºC) and the mixture was shaken 1 h at 45ºC and 700 rpm [13,14,24].
Then, the mixture was centrifuged at 7000 x g for 10 min at 25ºC. The solid was

9
discarded and the supernatant was filtered through a 0.22 µm nylon filter before the
analysis by CE-MS. Ten independent samples were weighed and prepared from the
powdered tablets.
2.3. Apparatus and procedures
pH measurements were made with a Crison 2002 potentiometer and a Crison electrode
52-03 (Crison Instruments, Barcelona, Spain). Centrifugal filtration was carried out in a
cooled Rotanta 460 centrifuge (Hettich Zentrifugen, Tuttlingen, Germany). Agitation
during sample extraction was performed with a Thermo-Shaker TS-100 (Biosan,
Warren, USA).
2.3.1 Capillary electrophoresis-mass spectrometry (CE-MS)
CE-MS experiments were performed in a 7100 CE system coupled with an orthogonal
G1603A sheath-flow interface to a 6220 oa-TOF LC/MS spectrometer (Agilent
Technologies, Waldbronn, Germany). The sheath liquid was delivered at a flow rate of
3.3 µL·min-1 by a KD Scientific 100 series infusion pump (Holliston, MA, USA). CE-
MS control and data acquisition were performed using ChemStation and MassHunter
softwares (Agilent Technologies) [13,14].
A 72 cm total length (LT) x 75µm id x 360 µm od bare fused-silica capillary supplied by
Polymicro Technologies (Phoenix, AZ, USA) was used for the separations. All capillary
rinses were performed at high pressure (930 mbar). New capillaries were flushed with 1
M NaOH (15 min), water (15 min) and BGE (30 min). The system was finally
10
equilibrated by applying the separation voltage (10 kV) for 15 min. Between workdays,
the capillary was conditioned by rising successively with 0.1 M NaOH (5 min), water
(10 min) and BGE (15 min). Both activation and conditioning procedures were
performed off-line in order to avoid the unnecessary entrance of NaOH into the MS
system. Samples were hydrodynamically injected at 34 mbar for 15 s. A separation
voltage of 10 kV (normal polarity, anode at the injection capillary end) was applied for
the electrophoretic separations at 25ºC. Between runs, the capillary was rinsed for 2 min
with water and 2 min with BGE. The working BGE was refreshed after every analysis
to ensure optimum separation repeatability.
The accurate mass and high resolution TOF mass spectrometer was tuned and calibrated
following the manufacturer’s instructions. The TOF mass spectrometer parameters in
positive mode were optimized for the analysis of low molecular mass peptides: capillary
voltage 4000 V, drying gas (N2) temperature 200ºC, drying gas flow rate 4 L·min-1,
nebulizer gas (N2) 7 psig, fragmentor voltage 215 V, skimmer voltage 60 V, OCT 1 RF
Vpp voltage 300 V. Data were collected in profile at 1 spectrum/s between 200 and
1500 m/z with the mass range set to high resolution mode (4 GHz). In order to ensure
the accuracy of the molecular mass measurements, a standard solution of neuropeptides
was analyzed, as quality control, after analyzing the nutraceutical samples [25].
2.3.2 Capillary electrophoresis-tandem mass spectrometry (CE-MS/MS)
CE-MS/MS experiments were performed with the same CE instrument and sheath-flow
interface coupled to an MSD ion trap (IT) mass spectrometer (Agilent Technologies).
CE/MSD Trap Software (Agilent Technologies) was used for instrument control, data
acquisition and data processing. The separation, sheath liquid, capillary voltage, drying

11
and nebulizer gas conditions were as in CE-MS. The rest of parameters of the IT mass
spectrometers were optimized for the analysis of low molecular mass peptides: voltages
on the capillary exit and skimmer were 150 and 50 V, respectively; octopole voltages
were 15.41 and 3.34 V and the octopole radiofrequency was 267.2 Vpp; lens voltages
were -11.32 and -100 V and the trap drive value was 70.4 (arbitrary units). MS/MS
analyses were performed on the selected precursor ions (Table S-1) in the scanning
range from 80 to 1250 m/z with an intensity threshold of 8000 and an MS/MS
fragmentation amplitude of 1.0 V or 2 V (auto MS/MS mode).
2.4. Data analysis
This section and Figure 1 describe the dataset and data analysis workflow followed for
data pre-processing, data resolution, feature finding, identification and confirmation of
antihypertensive peptides in the nutraceutical sample, which is based on our previous
studies in metabolomics [21–23].
2.4.1. Data pre-processing
First, CE-MS raw data from the nutraceutical samples were converted to mzXML
format with the ProteoWizard software 3.0 (Palo Alto, CA, USA, freely available at
http://proteowizard.sourceforge.net) and, then, imported into the MATLAB
environment (MATLAB R2013a, The Mathworks Inc. Natick, MA, USA). The input
full resolution data matrix was compressed through a “regions of interest” (ROI) search
(Fig. 1A) using a home-made MATLAB program (A download link can be found in
reference [18] o it is available upon request) [17,18,23]. Using this compression, ROI

12
values are searched among every migration time of the considered electrophoretic runs.
These vectors with the common ROIs among the different migration times are grouped
into a matrix and the final m/z values of each ROI are calculated as the mean of the m/z
values obtained for that specific ROI. The number of rows and columns in the resulting
matrix are equal to the total number of migration times of the considered run and to the
total number of detected ROIs, respectively.
ROI approach requires the input of several parameters, including the signal-to-noise
threshold, the mass accuracy (i.e. m/z error) and the minimum number of migration
times to be considered as a peak for each ROI. In our case, after visual inspection of the
raw data and different preliminary tests, these parameters were set at 10,000 of MS
intensity threshold signal, 0.05 m/z of mass accuracy and a minimum number of 25
times in a peak to avoid losing information about low abundant compounds. After ROI
compression a considerable size reduction was achieved and only the regions of the raw
data with significant information about sample composition were considered for further
analysis.
In this case, run-to-run and sample-to-sample intensity reproducibilities were high
because different extracts of the same nutraceutical were analyzed. Therefore, it was not
necessary to normalize the intensity scale of the MS-ROI data matrices using internal
standards. Intensity scale normalization is necessary after MS-ROI compression to
correct among run instrumental intensity drifts, differences on sample matrix or any
other fonts of low detection reproducibility [17,18,23]. Individual MS-ROI matrices
were arranged in a column-wise augmented data matrix to find, by a pairwise search,
common and uncommon ROI values among them. This search transformed the original

13
individual MS-ROI in data matrices with an equal number of m/z values (column of the
final data matrix). The dimension of the ROI augmented data matrix (Daug, Fig. 1A) was
the total number of migration times considered in the whole set of samples (rows) and
the total number of considered m/z ROI values (columns). The augmented data matrix
was considered for MCR-ALS analysis (Fig. 1B).
2.4.2. MCR-ALS analysis
MCR-ALS (MCR-ALS 2.0 MATLAB toolbox, freely available at
http://www.mcrals.info [20]) was applied to resolve the component profiles from the
nutraceutical samples. MCR-ALS resolves as different components the overlapped
electrophoretic peaks from the data and provides their electrophoretic profiles and mass
spectra. This approach allows overcoming problems such as retention time shifts,
background noise contributions, and differences in S/N among the different samples.
MCR-ALS analysis of a data matrix D, following a bilinear model, gives the two factor
matrices, C and ST, as in Eq. 1:
𝐃 = 𝐂𝐒𝐓 + 𝐄 (1)
where matrix C contains the electrophoretic profiles of the resolved contributions
(components), matrix ST contains the corresponding mass spectra of the resolved
contributions, and matrix E contains the residuals unexplained by the model.
In this study, the different samples were simultaneously analyzed and compared by
MCR-ALS using the ROI column-wise augmented data matrix (Daug):

14
𝐃𝐚𝐮𝐠 = [𝑫𝟏
⫶𝑫𝟏𝟎
] = [𝑪𝟏
⫶𝑪𝟏𝟎
] 𝐒𝐓 + [𝑬𝟏
⫶𝑬𝟏𝟎
] = 𝐂𝐚𝐮𝐠𝐒𝐓 + 𝐄𝐚𝐮𝐠 (2)
This strategy allowed obtaining a common matrix of the mass spectra of the resolved
components (ST) for all samples (ten components were selected in this study), and an
augmented matrix describing the resolved electrophoretic profiles (Caug) in every
sample. These electrophoretic peaks resolved in matrix Caug were allowed to vary in
position (shifts) and shape among samples because the only requirement for a proper
resolution is that the resolved mass spectra are the same for the common constituents in
the different samples. This aspect is especially useful in the case of CE data where
migration shifts among samples often occur and, hence, the alignment of electrophoretic
peaks before analysis is not necessary [17,23].
MCR-ALS analysis was carried out following standard procedures for the determination
of the number of components (SVD) and initial estimates (pure variable detection
method based on the SIMPLISMA algorithm) [19,20]. ALS optimization was
performed under non-negativity constraints for electrophoretic (Caug) and spectral (ST)
profiles, and spectral normalization (equal height). All these tasks are incorporated in
the MCR-ALS toolbox.
2.4.3. Detection, identification and confirmation of antihypertensive peptides
The mass spectra of the different MCR-ALS components contained in ST were searched
for relevant compounds (features) (Fig. 1C). The mMass software
15
(http://www.mmass.org/ [26]), which is an open-source mass spectrometry software,
was used to automate feature selection and database search. Once imported the mass
spectra of the different components to the mMass environment, only the ions with an
intensity higher than 5% of the maximum intensity were considered as significant
features for database search. This intensity threshold was low enough and close to the
mass spectra background to ensure detection of the most relevant features in the mass
spectra of the resolved MCR-ALS components.
An mMass database of antihypertensive peptides from milk proteins was built (see
supplementary material for details) from the information collected after a “source
search” with the keywords “milk” or “casein” in the on-line antihypertensive peptide
database AHTPDB (http://crdd.osdd.net/raghava/ahtpdb/ [8]). The accurate
experimental m/z value (m/zROI-MCR-ALS) of the significant features was searched in the
lab-made mMmass database, considering different [M+zH]z+ ions, with z from +1 to +3.
An error of 100 ppm from the m/ztheoretical values was used to evaluate the accuracy of
the identifications (Er≤100 ppm, │m/zROI-MCR-ALS – m/ztheoretical │ / m/ztheoretical * 106). The
tentative identifications were verified from the analysis of the raw mass spectra and
extracted ion electropherograms (EIE) of the antihypertensive peptides, which were
obtained with the MassHunter software, taking as a reference the m/z value and the
migration time of the MCR-ALS resolved components. BIOPEP [7] and MBPDB [9]
databases were also used to validate and complement the information provided by
AHTPDB [8] for the identified antihypertensive peptides.
The tentatively identified antihypertensive peptides were reliably confirmed by CE-
MS/MS comparing the experimental m/z of the product ions observed in the tandem

16
mass spectra with the theoretical m/z of the peptide fragments generated by mMass
following Biemann’s nomenclature. Only the ions in the tandem mass spectra with an
intensity higher than 5% of the maximum intensity were considered.
3. Results and discussion
3.1. CE-MS
In a previous study we used CE-MS in positive ESI mode for separation and
identification of bioactive peptides in hypoallergenic infant milk formulas derived from
bovine milk protein hydrolysates [13,14]. Sample clean-up and preconcentration using a
citrate buffer with dithiothreitol (DTT) and urea followed by SPE with a C18 sorbent
was applied before CE-MS. In CE-MS, an acidic BGE (1 M HAc (pH 2.3)) and sheath
liquid hydroorganic solution (60:40 (v/v) propan-2-ol:water with 0.05% (v/v) of HFor)
resulted in excellent separation and detection of many low molecular mass bioactive
peptides. These CE-MS conditions were used here for the analysis of the nutraceutical
extracts, which contained approximately 9% (m/m) of hydrolyzed CSN proteins. The
nutraceutical sample was simply prepared using hot water (45ºC/1h) as extractant
[13,14,24], because we wanted to minimize the sample pretreatment. Furthermore, the
nutraceutical extract, after centrifugation and filtration, was a transparent solution that
could be directly analyzed by CE-MS without further clean-up, in contrast to the milk-
like emulsions obtained after adding hot water to the hypoallergenic infant milk
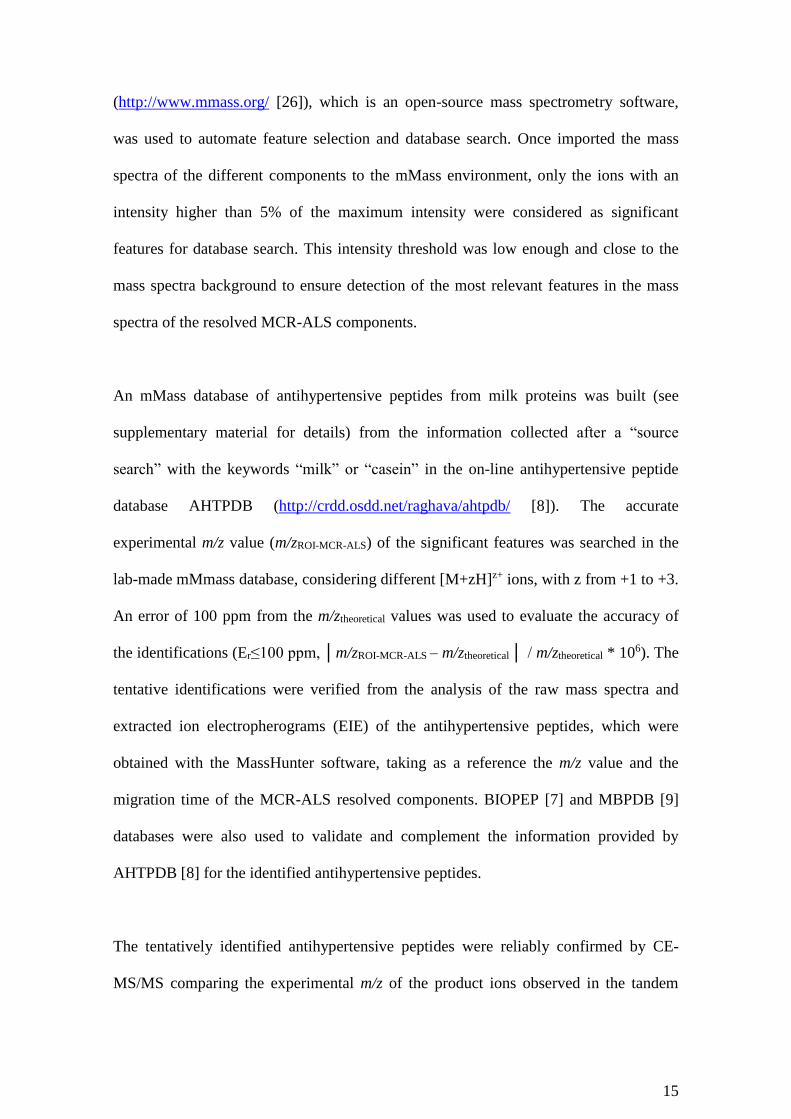
formulas [13,14]. Fig. 2A shows the typical total ion electropherogram (TIE) by CE-MS
for the nutraceutical extract. As can be observed, the nutraceutical extract presented a
characteristic and complex electrophoretic profile with multiple compounds comigrating

17
between 7 and 20 min in several electrophoretic peaks of different intensities. To
facilitate, speed-up and systematize data analysis, it was applied a workflow (Fig. 1)
based on advanced chemometric tools that includes data pre-processing, resolution,
feature finding and identification of antihypertensive peptides.
3.2. Data analysis
The data analysis workflow was applied to the dataset generated from the raw CE-MS
electropherograms obtained for the analysis of the different independent nutraceutical
extracts. The ROI search resulted in a great reduction of the m/z dimension (columns) of
the input full resolution data matrix, from 171798 m/z values (raw CE-MS data, Fig.
1A) until 954 m/z ROIs (CE-MS-ROI compressed data, Fig. 1A). The comparison of
Fig. 2A and 2B shows a good agreement between the raw TIE and the detected ROIs for
a typical nutraceutical extract (sample 1), suggesting the reliability of the compression.
The ROI compression is a very efficient untargeted m/z peaking algorithm based on
detection of relevant electrophoretic peaks above a certain intensity threshold. In
contrast to the binning compression method, it does not arbitrarily skew m/z accuracy
[17]. ROI compression greatly decreases the memory and computing requirements
needed later for resolution by MCR-ALS with such complex data sets.
MCR-ALS was applied to the column-wise augmented data matrix containing
simultaneously the ROI-compressed data matrices of all the nutraceutical extracts.
MCR-ALS resolved the electropherogram profiles and mass spectra of the common
nutraceutical components in the different extracts (Fig. 1B). Ten components allowed
explaining a high percentage of variance (R2=94.8%), with an acceptable lack-of-fit

18
value (LOF=22.9%). These figures of merits did not substantially improve if the
number of components was increased, for example, until 25 (R2=97.6% and
LOF=15.3%), and ten components were selected to avoid fitting non-systematic or
residual data variance. Fig. 3 shows the typical electrophoretic profiles of the 10
resolved components for the nutraceutical extract (sample 1), which agreed to a large
extent with the most relevant 954 m/z ROIs detected after data compression (Fig. 2B).
Table 1 shows the average relative area of the different components (%Area) calculated
from the values obtained for the electrophoretic profiles of the different extracts. This
area gives a rough idea of the total concentration of the compounds in the MCR-ALS
resolved components, but being aware that the relation between the MS signal and the
concentration may vary notably between the different compounds, even between those
from the same structural family (e.g. peptides). The mass spectra of the components
were screened for relevant features. Only the mass spectra ions with a relative intensity
(%Intensity) higher than 5% of the maximum intensity were considered as significant
features for the targeted database mass search. The mMass MS software was used in the
last part of the data analysis workflow because it allowed processing, as line mass
spectra, the mass spectra of the components directly exporting from MATLAB in text
format [26]. Furthermore, mMass had many other interesting features for this study
related to peptide sequence editing, molecular formula generation, accurate molecular
mass and m/z calculation, database building and search.
Table 1 shows the 22 antihypertensive peptides tentatively identified in the nutraceutical
extract after database search and comparison of the raw EIE and mass spectra with the
corresponding MCR-ALS component profiles and mass spectra. Fig. 4 shows as an
example this confirmatory comparison for some of the peptides. As can be observed, the

19
agreement between the raw EIE (Fig. 4A) and the MCR-ALS components (Fig. 4B) was
good. Regarding the zoomed regions of the mass spectra shown as insets, the MCR-
ALS mass spectra showed a smaller number of ions in some of the cases because the
comigrating compounds were resolved in different components (e.g. compare Fig. 4A-ii
and B-ii). As can be observed in Table 1, as the nutraceutical was prepared from
hydrolyzed casein proteins (9% (m/m)), all the identified antihypertensive peptides
corresponded to bovine CSN fragments, from 2 to 15 amino acids. Furthermore, in
general, they were found at low concentration, as can be observed by the %Area of the
different components and the %Intensity of the detected ions. The half maximal
inhibitory concentration (IC50) for angiotensin-converting enzyme (ACE) was reported
for some of the peptides, and ranged from 1.7 µM for the most bioactive peptide
(SKVYPFPGPI) until 2439 µM for the least (RL). In addition to the antihypertensive
activity, some peptides were also reported to be dipeptidyl peptidase IV inhibitors (DPP
IV inhibitor), and hence relevant for diabetes mellitus type 2 treatment, and another
DPP IV inhibitor, antioxidative, renin inhibitor, calmodulin-dependent cyclic nucleotide
phosphodiesterase (CaMPDE) inhibitor. All the antihypertensive peptides were reported
in AHTPDB database [8], which in our opinion is the most comprehensive
antihypertensive peptide database of the three investigated in this study. Anyway, it is
always recommended crosschecking the information for the identified peptides in
AHTPDB database with BIOPEP [7] and MBPDB [9] databases, as well as with the
original references cited in the databases. Furthermore, it is necessary to use a
specialized MS software such as mMass to ensure accurate molecular mass and m/z
calculations [26].

20
Regarding the accuracy of the identifications, an error (Er) of 100 ppm from the
m/ztheoretical values was considered. This value was a good compromise to avoid the loss
of potential identifications, because Er was measured on the mass spectra of the
different MCR-ALS components, which were resolved considering all the nutraceutical
extracts. As can be observed, the mass spectra shown as insets in Fig. 4A-i-iii and B-i-
iii show some differences in the m/z values of the ions between the experimental and the
MCR-ALS mass spectra.
In order to reliably confirm the identity of the peptide candidates, targeted CE-MS/MS
experiments were performed. Table S-1 shows the selected precursor ions and the
detected product ions for the tentatively identified antihypertensive peptides of Table 1.
The identity of 17 antihypertensive peptides was confirmed (highlighted in bold in
Table 1 and Table S-1) from the tandem mass spectra fragmentation patterns. As an
example, Fig. S-1 shows the EIE, the mass spectrum, the tandem mass spectrum and the
peptide fragments obtained for the antihypertensive peptide DKIHPF (m/ztheoretical =
378.7056, z=+2). The identity of 5 peptides could not be confirmed by CE-MS/MS
(Table 1 and Table S-1). VLNENL, IP/LP and PL peptides were not detected due to the
lower sensitivity of the IT mass spectrometer when compared to the TOF mass
spectrometer. Only the identity of the ENLLRF peptide could not be confirmed because
the product ions in the MS/MS spectra did not match with the expected fragmentation
pattern. This low false identification rate suggested the validity of the accurate mass and
high resolution TOF mass spectrometer for the straightforward and inexpensive
untargeted screening of antihypertensive peptides. The number of confirmed
antihypertensive peptides was high, considering the low content of hydrolyzed casein
proteins in the nutraceutical and the very simple sample pretreatment. In general, these

21
results suggest the great potential of the proposed analytical methodology for the
simple, rapid and systematic analysis of bioactive peptides in nutraceuticals and milk
derived functional foods, as part of quality control, food safety and fraud control
programs. More broadly, it could be adapted to similar untargeted and targeted CE-MS
and LC-MS analysis in other foodomics research areas.
Acknowledgements
This study was supported by a grant from Spanish Ministry of Economy and
Competitiveness (CTQ2014-56777-R) and the Cathedra UB Rector Francisco
Buscarons Ubeda (Forensic Chemistry and Chemical Engineering). Roger Pero-Gascon
acknowledges the same Ministry for a FPU fellowship. We also thank Karen Martí for
her collaboration in part of this study.
The authors have declared no conflict of interest.

22
References
[1] S. Séverin, X. Wenshui, Milk biologically active components as nutraceuticals:
review, Crit. Rev. Food Sci. Nutr. 45 (2005) 645–56.
doi:10.1080/10408690490911756.
[2] D. Martinez-Ledesma, B. Miralles, I. Recio, B. Hernández-Ledesma,
Antihypertensive peptides from food proteins, Food Funct. 3 (2012) 350–61.
doi:10.1039/C2FO10192K.
[3] M. Hajfathalian, S. Ghelichi, P.J. García-Moreno, A.-D. Moltke Sørensen, C.
Jacobsen, Peptides: production, bioactivity, functionality, and applications., Crit.
Rev. Food Sci. Nutr. (2017) 1–33. doi:10.1080/10408398.2017.1352564.
[4] Y. Liu, M. Pischetsrieder, Identification and relative quantification of bioactive
peptides sequentially released during simulated gastrointestinal digestion of
commercial kefir, J. Agric. Food Chem. 65 (2017) 1865–1873.
doi:10.1021/acs.jafc.6b05385.
[5] X. Fan, L. Bai, L. Zhu, L. Yang, X. Zhang, Marine algae-derived bioactive
peptides for human nutrition and health, J. Agric. Food Chem. 62 (2014) 9211–
22. doi:10.1021/jf502420h.
[6] S.Y. Lee, S.J. Hur, Antihypertensive peptides from animal products, marine
organisms, and plants, Food Chem. 228 (2017) 506–17.
doi:10.1016/j.foodchem.2017.02.039.
[7] P. Minkiewicz, J. Dziuba, A. Iwaniak, M. Dziuba, M. Darewicz, BIOPEP
database and other programs for processing bioactive peptide sequences, J.
AOAC Int. 91 (2008) 965–80.
[8] R. Kumar, K. Chaudhary, M. Sharma, G. Nagpal, J.S. Chauhan, S. Singh, A.
Gautam, G.P.S. Raghava, AHTPDB: a comprehensive platform for analysis and
presentation of antihypertensive peptides, Nucleic Acids Res. 43 (2015) D956-
62. doi:10.1093/nar/gku1141.
[9] S.D. Nielsen, R.L. Beverly, Y. Qu, D.C. Dallas, Milk bioactive peptide database:
a comprehensive database of milk protein-derived bioactive peptides and novel
visualization, Food Chem. 232 (2017) 673–82.
doi:10.1016/j.foodchem.2017.04.056.
[10] P.B. Kunda, F. Benavente, S. Catalá-Clariana, E. Giménez, J. Barbosa, V. Sanz-
Nebot, Identification of bioactive peptides in a functional yogurt by micro liquid
chromatography time-of-flight mass spectrometry assisted by retention time
prediction, J. Chromatogr. A. 1229 (2012) 121–8.
doi:10.1016/j.chroma.2011.12.093.
[11] J. Giacometti, A. Buretić-Tomljanović, Peptidomics as a tool for characterizing
bioactive milk peptides, Food Chem. 230 (2017) 91–8.
doi:10.1016/j.foodchem.2017.03.016.
[12] A.L. Capriotti, C. Cavaliere, S. Piovesana, R. Samperi, A. Laganà, Recent trends
in the analysis of bioactive peptides in milk and dairy products, Anal. Bioanal.
Chem. 408 (2016) 2677–2685. doi:10.1007/s00216-016-9303-8.
[13] S. Català-Clariana, F. Benavente, E. Giménez, J. Barbosa, V. Sanz-Nebot,
Identification of bioactive peptides in hypoallergenic infant milk formulas by
capillary electrophoresis–mass spectrometry, Anal. Chim. Acta. 683 (2010) 119–
25. doi:doi:10.1016/j.aca.2010.10.002.
[14] S. Català-Clariana, F. Benavente, E. Giménez, J. Barbosa, V. Sanz-Nebot,

23
Identification of bioactive peptides in hypoallergenic infant milk formulas by
CE-TOF-MS assisted by semiempirical model of electromigration behavior,
Electrophoresis. 34 (2013) 1886–94. doi:10.1002/elps.201200547.
[15] C. Ibáñez, T. Acunha, A. Valdes, V. Garcia-Cañas, A. Cifuentes, C. Simo,
Capillary electrophoresis in food and foodomics, in: P. Schmitt-Kopplin (Ed.),
Methods Mol. Biol., Humana Press, New York, 2016: pp. 471–507.
doi:10.1007/978-1-4939-6403-1_22.
[16] D. Heiger, High performance capillary electrophoresis. An introduction, Agilent
Technologies, Germany, 2000. doi:10.1039/9781847550521-00208.
[17] E. Gorrochategui, J. Jaumot, S. Lacorte, R. Tauler, Data analysis strategies for
targeted and untargeted LC-MS metabolomic studies: overview and workflow,
TrAC - Trends Anal. Chem. 82 (2016) 425–42. doi:10.1016/j.trac.2016.07.004.
[18] E. Gorrochategui, J. Jaumot, R. Tauler, A protocol for LC-MS metabolomic data
processing using chemometric tools, Protoc. Exch. (2015) 1-27. Accessed on
November 13, 2017. doi:10.1038/protex.2015.102.
[19] J. Jaumot, R. Gargallo, A. de Juan, R. Tauler, A graphical user-friendly interface
for MCR-ALS: a new tool for multivariate curve resolution in MATLAB,
Chemom. Intell. Lab. Syst. 76 (2005) 101–10.
doi:10.1016/j.chemolab.2004.12.007.
[20] J. Jaumot, A. de Juan, R. Tauler, MCR-ALS GUI 2.0: New features and
applications, Chemom. Intell. Lab. Syst. 140 (2015) 1–12.
doi:10.1016/j.chemolab.2014.10.003.
[21] E. Ortiz-Villanueva, J. Jaumot, F. Benavente, B. Piña, V. Sanz-Nebot, R. Tauler,
Combination of CE-MS and advanced chemometric methods for high-throughput
metabolic profiling, Electrophoresis. 36 (2015) 2324–35.
doi:10.1002/elps.201500027.
[22] L. Pont, F. Benavente, J. Jaumot, R. Tauler, J. Alberch, S. Ginés, J. Barbosa, V.
Sanz-Nebot, Metabolic profiling for the identification of Huntington biomarkers
by on-line solid-phase extraction capillary electrophoresis mass spectrometry
combined with advanced data analysis tools, Electrophoresis. 37 (2016) 795–808.
doi:10.1002/elps.201500378.
[23] E. Ortiz-Villanueva, F. Benavente, B. Piña, V. Sanz-Nebot, R. Tauler, J. Jaumot,
Knowledge integration strategies for untargeted metabolomics based on MCR-
ALS analysis of CE-MS and LC-MS data, Anal. Chim. Acta. 978 (2017) 10–23.
doi:10.1016/j.aca.2017.04.049.
[24] M. Plaza, C. Turner, Pressurized hot water extraction of bioactives, Trends Anal.
Chem. 76 (2017) 53–82. doi:10.1016/bs.coac.2016.12.005.
[25] M. Borges-Alvarez, F. Benavente, E. Giménez, J. Barbosa, V. Sanz-Nebot,
Assessment of capillary electrophoresis TOF MS for a confident identification of
peptides, J. Sep. Sci. 33 (2010) 2489–98. doi:10.1002/jssc.201000361.
[26] M. Strohalm, M. Hassman, B. Kosata, M. Kodicek, mMass data miner: an open
source alternative for mass spectrometric data analysis, Rapid Commun. Mass
Spectrom. 22 (2008) 905–8. doi:10.1002/rcm.

24
Figure 1. Data analysis workflow: (A) data pre-processing, (B) data resolution and (C)
feature finding, identification and confirmation of antihypertensive peptides.
25
Figure 2. (A) Experimental total ion electropherogram (TIE) and (B) detected regions
of interest (ROI) for the nutraceutical extract sample 1 (each colour trace stands for a
ROI with a different m/z value in sample 1. No colour legend is shown because of the
large number of ROIs).

26
Figure 3. Resolved components by multivariate curve resolution alternating least
squares (MCR-ALS) for the nutraceutical extract sample 1 (each colour trace stands for
one of the 10 characteristic resolved components in sample 1).

27
Figure 4. (A) Experimental extracted ion electropherogram (EIE) and (B)
corresponding multivariate curve resolution alternating least squares (MCR-ALS)
resolved component for the nutraceutical extract sample 1. The tentatively identified
antihypertensive peptides are i) DKIHPF (m/ztheoretical = 378.7056, z=+2), ii)
IASGEPTSTPT (m/ztheoretical = 530.7615, z=+2) and iii) GVW (m/ztheoretical = 361.1870,
z=+1).

28
Table 1. Antihypertensive peptides tentatively identified in the mass spectra of the resolved MCR-ALS components of the nutraceutical extract
after database search. All peptides were confirmed by comparison of the experimental CE-MS with the MCR-ALS data (CSN=casein). MCR-ALS component Antihypertensive peptidesa
Number
%Area
(an average in
the profiles)
m/z ROI-MRC-ALS
m/z theoretical
Er (m/z) Er (ppm) z
%Intensity (in the
spectra of the MCR-
ALS components)
Sequence Bovine milk CSN protein IC50 (ACE,
µM) Databasesb Confirmed by
CE-MS/MS
1 32.5 203.1408 203.1390 0.0018 8.8 1 22 IA kappa-CSN 153c (soybean) AHTPDB and BIOPEP
2 13.5 378.7373 378.7056 0.0317 84 2 100 DKIHPF beta-CSN 257 AHTPDB, BIOPEP and
MBPDB
3 6.0
396.2342 396.2241 0.0101 25 2 8.3 ENLLRF alpha-CSN 82
(caprine milk) AHTPDB and MBPDB
796.4355 796.4240 0.0115 14 1 7.0 YIPIQY kappa-CSN 10
(ovine milk)
AHTPDB, BIOPEP and
MBPDB
4 2.5 701.4156 701.3828 0.0328 47 1 33 VLNENL alpha-CSN - AHTPDB
5 3.4 552.8019 552.8080 -0.0062 -11 2 18 SKVYPFPGPI beta-CSN (sequence conflict
SLVYPFPGPI)b 1.7 AHTPDB and BIOPEP
6 12.2 - - - - - - - - - -
7 2.0
276.1533 276.1554 -0.0021 -7.7 1 10
EK alpha-CSN, beta-CSN and kappa-CSN -c
AHTPDB and BIOPEP
KE alpha-CSN and beta-CSN -
288.2096 288.2030 0.0066 23 1 29
IR kappa-CSN 695e
AHTPDB and BIOPEP
RL alpha-CSN 2439
322.1815 322.1874 -0.0059 -18 1 13
FR alpha-CSN 920c (sake
lees) AHTPDB and BIOPEP
RF kappa-CSN 93 (sake lees)
530.8057 530.7615 0.0442 83 2 22 IASGEPTSTPT kappa-CSN - AHTPDB
580.0036 579.9734 0.0302 52 3 8.9 KYPVQPFTESQSLTL beta-CSN 44 AHTPDB
8 1.8
229.1541 229.1547 -0.0006 -3.0 1 13
IP / LPd alpha-CSN, beta-CSN and kappa-CSN 130c / -c AHTPDB, BIOPEP and
MBPDB
PLd alpha-CSN and beta-CSN -c
246.1622 246.1561 0.0061 25 1 37 AR kappa-CSN 95.5 AHTPDB and BIOPEP
318.1715 318.1812 -0.0097 -30 1 8.8 LW alpha-CSN 15f AHTPDB, BIOPEP and
MBPDB
335.1816 335.2148 -0.0332 -99 3 12 LKKYKVPQ alpha-CSN - AHTPDB
342.2635 342.2387 0.0247 72 1 14 IPI kappa-CSN - AHTPDB
867.451 867.5298 -0.0788 -91 1 11 SKVLPVPQ beta-CSN 39 AHTPDB and MBPDB
9 4.0 361.1607 361.1870 -0.0264 -73 1 58 GVW alpha-CSN (sequence conflict GAW)b 240 AHTPDB and BIOPEP
10 21.9 - - - - - - - - - - -

29
a)All the peptides are bovine CSN fragments. Most of them were reported after enzymatic hydrolysis of milk, dairy products and purified CSNs of bovine origin, excepting otherwise indicated. b)The peptide sequence from bovine CSN in the peptide databases differ from the most typical bovine CSN proteoform reported in Uniprot knowledgebase (www.uniprot.org).
c)This peptide was also dipeptidyl peptidase IV inhibitor (DPP IV inhibitor). d)These peptides cannot be differenced from their MS/MS fragmentation patterns.
e)This peptide was also antioxidative, renin inhibitor, calmodulin-dependent cyclic nucleotide phosphodiesterase (CaMPDE) inhibitor and DPP IV inhibitor. f)This peptide was antioxidative and DPP IV inhibitor.

S-30
Supporting Information
Table of contents
Building the mMass database of antihypertensive peptides
from milk proteins
S-31
Table S-1. CE-MS/MS confirmation of the antihypertensive
peptides
S-32
Figure S-1. CE-MS/MS confirmation of the antihypertensive
peptide DKIHPF
S-33

S-31
Building the mMass database of antihypertensive peptides from milk proteins
The mMass database of antihypertensive peptides from milk proteins was built from the
information collected after a “source search” with the keywords “milk” or “casein” in
the on-line antihypertensive peptide database AHTPDB
(http://crdd.osdd.net/raghava/ahtpdb/ [8]). A tab-delimited text file with the AHTPDB
database ID number, the source and the one letter code sequence of the antihypertensive
peptides was saved in Microsoft Excel 2016, and converted to FASTA format using a
freely available on-line application
(http://sequenceconversion.bugaco.com/converter/biology/sequences/tab_to_fasta.php).
The FASTA file was imported into mMass to generate the molecular formulas of the
different peptide sequences, which later were used to calculate the accurate
monoisotopic molecular mass and the accurate m/z values of differently charged
molecular ions (m/ztheoretical). The Excel file with the AHTPDB database ID, the source
and the sequence was completed with the molecular formulas obtained by mMass from
the imported FASTA file. Then, the Excel file was given the appropriate XML format
using as an XML origin one of the default databases available in mMass (e.g.
compounds.xml). Finally the Excel file was exported as an XML file ready to use as a
database in mMass.

S-32
Table S-1. CE-MS/MS confirmation of the antihypertensive peptides identified in the
mass spectra of the resolved MCR-ALS components of the nutraceutical extract after
database search. a)These peptides cannot be differenced by their MS/MS fragmentation patterns.
MCR-ALS Precursor ion Antihypertensive peptides Product ions
Component m/zexperimental z m/ztheoretical Sequence m/zexperimental z Sequence
1 203.1 1 203.1 IA - - -
2 378.7 2 378.8 DKIHPF
513.3 1 y4
494.3 1 b4
369.8 2 M-H2O
321.2 2 y5
263.2 1 y2
3
396.2 2 396.2 ENLLRF - - -
796.4 1 796.4 YIPIQY
779.9 1 M-NH3
778.9 1 M-H2O
615.7 1 b5
374.5 1 b3
4 701.4 1 701.4 VLNENL - - -
5 552.8 2 552.8 SKVYPFPGPI
501.2 2 z9
473.3 2 a9
437.1 2 z8
387.4 2 z7
312.1 1 x3
216.1 1 b2
6 - - - - - - -
7
276.2 1 276.2 EK 258.2 1 M-H2O
KE 258.2 1 M-H2O
288.1 1 288.2
IR
271.2 1 M-NH3
270.2 1 M-H2O
175.1 1 y1
RL
271.2 1 M-NH3
270.2 1 M-H2O
157.1 1 b1
322.3 1 322.2
FR
305.2 1 M-NH3
304.2 1 M-H2O
175.1 1 y1
RF
305.2 1 M-NH3
304.2 1 M-H2O
157.1 1 b1
530.8 2 530.8 IASGEPTSTPT
760.4 1 c8
638.5 1 b7-H2O
217.1 1 y2
580.1 3 580.0 KYPVQPFTESQSLTL
433.2 1 y4
418.1 3 y11
416.1 1 z4
8
229.2 1 229.2 IP / LPa - - -
PL - - -
246.2 1 246.2 AR 229.1 1 M-NH3
228.1 1 M-H2O
318.2 1 318.2 LW
300.2 1 M-H2O
205.1 1 y1
188.1 1 z1
8
335.2 3 335.2 LKKYKVPQ
2 a5
3 a6
1 x1
1 y3
342.2 1 342.2 IPI - 1 M-NH3
1 M-H2O
867.5 1 867.5 SKVLPVPQ 849.6 1 M-H2O
641.4 1 c6
9 361.2 1 361.2 GVW 287.1 1 z2
129.1 1 a2
10 - - - - - - -

S-33
Figure S-1. (A) Experimental extracted ion electropherogram (EIE) and mass spectrum,
(B) tandem mass spectrum and (C) peptide fragmentation obtained by CE-MS/MS for the
antihypertensive peptide DKIHPF (m/ztheoretical = 378.7, z=+2).
0.0
0.2
0.4
0.6
0.8
1.0
100 200 300 400 500
Inte
nsit
y(*
105 )
m/z
B) Tandem mass spectrum
513.3
y4
494.3
b4
369.7
M-H2O (z=+2)321.2
y5 (z=+2)
263.2
y2
y4y5y2
b4
H+
C) Peptide fragmentation
0.0
2.0
4.0
6.0
8.0
0 5 10 15 20 25
Inte
nsit
y(*
106 )
Time (min)
0
4
8
375.0 380.0 385.0
Inte
nsi
ty(*
10
5 )m/z
378.8
379.2
379.7
A) Extracted ion electropherogram (EIE) (m/z=378.7, z=+2)
Mass spectrum
![Survey, isolation and purification of bioactive peptides with antihypertensive activity from sweet potato (Ipomoea batatas) and winged bean [Psophocarpus tetragonolobus (L) D.C.]](https://static.fdocuments.net/doc/165x107/577d2b6f1a28ab4e1eaac38f/survey-isolation-and-purification-of-bioactive-peptides-with-antihypertensive.jpg)