Identification of Acoustic Characteristics of Honeycomb...
11
Yong-Joe Kim Mem. ASME Department of Mechanical Engineering, Texas A&M University, 3123 TAMU, College Station, TX 77843-3123 e-mail: [email protected] Je-Heon Han Department of Mechanical Engineering, Texas A&M University, 3123 TAMU, College Station, TX 77843-3123 e-mail: [email protected] Identification of Acoustic Characteristics of Honeycomb Sandwich Composite Panels Using Hybrid Analytical/Finite Element Method 1 For the purpose of identifying the acoustic characteristics of honeycomb sandwich pan- els, finite element method (FEM), combined with boundary element method (BEM), has been widely used. However, the latter approach is not always applicable to high fre- quency analyses since it requires a large number of FEM/BEM meshes. In order to reduce computational resources and modeling times, a hybrid analytical/finite element method (HAFEM) is described that uses a finite element approximation in the thickness direction, while analytical solutions are assumed in the plane directions. Thus, it makes it possible to use a small number of finite elements, even for high frequency analyses. By using the HAFEM, the wave transmission, propagation, and radiation characteristics of the honeycomb sandwich panels are investigated. The proposed HAFEM procedure is validated by comparing the predicted transmission loss (TL) results to the measured ones. Through the use of the HAFEM model of a honeycomb sandwich panel, it is shown that the structural responses of the panel converge asymptotically to flexural waves in the low audible frequency region, core shear waves in the high audible to ultrasonic fre- quency region, and skin flexural waves in the high ultrasonic frequency region. Coinci- dent frequencies occur at the transition region from the flexural to core shear wave behaviors. From the TL sensitivities of various panel design parameters, the most domi- nant design parameters contributing to the TL results are determined as a function of fre- quency. In order to improve the acoustic performance of the honeycomb sandwich panel while satisfying weight and strength requirements, a new double core honeycomb sandwich panel is designed to have the same mass per unit area as the baseline single core panel but have a larger equivalent flexural stiffness than that of the baseline panel. [DOI: 10.1115/1.4007241] 1 Introduction Honeycomb sandwich panels, each fabricated by co-curing a single honeycomb core or multiple honeycomb cores with face sheets, are extensively used in most contemporary fuselage struc- tures due to their superior mechanical properties (i.e., their light weight and high strength). However, it is well known that their acoustic characteristics are generally poor, which makes them unfavorable to aircraft interior noise. As the aircraft interior noise has been increasingly emphasized, it has become critical to design acoustically-optimized honeycomb composite panels. For the purpose of investigating various composite panels, in general, it is required to consider “thin” panels as well as “thick” panels of which the thickness is comparable to the structural wave length at the maximum frequency of interest. It is also necessary to consider various waves, e.g., flexural, shear, and longitudinal waves propagating though the panels. In addition, it is required to take into account the orthotropic material properties, e.g., fiber materials are inserted to reinforce composite materials in particu- lar directions. Finally, “multiple” honeycomb core panels should be investigated, although single honeycomb core panels have been extensively investigated. In order to accommodate the aforementioned aspects, various numerical and analytical methods have been developed. Although analytical methods can be used to analyze the acoustic character- istics of multilayered composite panels, their applications are re- stricted to a few composite panels that have simple layer configurations such as single core sandwich panels, thin panels, or panels with isotropic or transverse-isotropic layers. Kurtze and Watters developed an analytical model for single core panels, presented the asymptotic structural wave propagation characteristics, and described how to adjust the coincidence fre- quency to improve the sound transmission characteristics based on the asymptotic behaviors [1]. Dym et al. estimated the transmission loss (TL) through single isotropic core sandwich panels based on their symmetric and antisymmetric acoustic impedances [2,3]. Moore et al. developed a single core sandwich panel model similar to the model in Refs. [2,3] that can be applied to either an isotropic or orthotropic honeycomb core [4,5]. In addition, Nilsson derived an analytical model of three layered isotropic panels to predict the TL characteristics as functions of frequency, plate geometries, and material parameters including the damping loss factor [6]. Kim and Bolton developed a transfer function of anisotropic poroelastic layers and applied this transfer function technique to model infinite-sized composite sandwich panels to predict their TL charac- teristics [7,8]. Zhou et al. analytically estimated the TL characteris- tics of asymmetric sandwich panels fabricated with orthotropic graphite fiber face sheets and foam-filled honeycomb cores [9]. 1 Portions of this work are presented in “Identification of Sound Transmission Char- acteristics of Honeycomb Sandwich Panels Using Hybrid Analytical/One-Dimensional Finite Element Method,” Proceedings of Inter-Noise 2006, December 2006, Honolulu, HI and “Acoustical Characteristics of Honeycomb Sandwich Composite Panels,” 161st Meeting of the Acoustical Society of America, May 2011, Seattle, Washington. Contributed by the Noise Control and Acoustics Division of ASME for publica- tion in the JOURNAL OF VIBRATION AND ACOUSTICS. Manuscript received June 2, 2011; final manuscript received June 20, 2012; published online February 4, 2013. Assoc. Editor: Lonny Thompson. Journal of Vibration and Acoustics FEBRUARY 2013, Vol. 135 / 011006-1 Copyright V C 2013 by ASME Downloaded 04 Feb 2013 to 165.91.12.182. Redistribution subject to ASME license or copyright; see http://www.asme.org/terms/Terms_Use.cfm
Transcript of Identification of Acoustic Characteristics of Honeycomb...
Yong-Joe KimMem. ASME
Department of Mechanical Engineering,
Texas A&M University,
3123 TAMU,
College Station, TX 77843-3123
e-mail: [email protected]
Je-Heon HanDepartment of Mechanical Engineering,
Texas A&M University,
3123 TAMU,
College Station, TX 77843-3123
e-mail: [email protected]
Identification of AcousticCharacteristics of HoneycombSandwich Composite PanelsUsing Hybrid Analytical/FiniteElement Method1
For the purpose of identifying the acoustic characteristics of honeycomb sandwich pan-els, finite element method (FEM), combined with boundary element method (BEM), hasbeen widely used. However, the latter approach is not always applicable to high fre-quency analyses since it requires a large number of FEM/BEM meshes. In order toreduce computational resources and modeling times, a hybrid analytical/finite elementmethod (HAFEM) is described that uses a finite element approximation in the thicknessdirection, while analytical solutions are assumed in the plane directions. Thus, it makes itpossible to use a small number of finite elements, even for high frequency analyses. Byusing the HAFEM, the wave transmission, propagation, and radiation characteristics ofthe honeycomb sandwich panels are investigated. The proposed HAFEM procedure isvalidated by comparing the predicted transmission loss (TL) results to the measuredones. Through the use of the HAFEM model of a honeycomb sandwich panel, it is shownthat the structural responses of the panel converge asymptotically to flexural waves in thelow audible frequency region, core shear waves in the high audible to ultrasonic fre-quency region, and skin flexural waves in the high ultrasonic frequency region. Coinci-dent frequencies occur at the transition region from the flexural to core shear wavebehaviors. From the TL sensitivities of various panel design parameters, the most domi-nant design parameters contributing to the TL results are determined as a function of fre-quency. In order to improve the acoustic performance of the honeycomb sandwich panelwhile satisfying weight and strength requirements, a new double core honeycombsandwich panel is designed to have the same mass per unit area as the baseline singlecore panel but have a larger equivalent flexural stiffness than that of the baseline panel.[DOI: 10.1115/1.4007241]
1 Introduction
Honeycomb sandwich panels, each fabricated by co-curing asingle honeycomb core or multiple honeycomb cores with facesheets, are extensively used in most contemporary fuselage struc-tures due to their superior mechanical properties (i.e., their lightweight and high strength). However, it is well known that theiracoustic characteristics are generally poor, which makes themunfavorable to aircraft interior noise. As the aircraft interior noisehas been increasingly emphasized, it has become critical to designacoustically-optimized honeycomb composite panels.
For the purpose of investigating various composite panels, ingeneral, it is required to consider “thin” panels as well as “thick”panels of which the thickness is comparable to the structural wavelength at the maximum frequency of interest. It is also necessaryto consider various waves, e.g., flexural, shear, and longitudinalwaves propagating though the panels. In addition, it is required totake into account the orthotropic material properties, e.g., fibermaterials are inserted to reinforce composite materials in particu-lar directions. Finally, “multiple” honeycomb core panels should
be investigated, although single honeycomb core panels havebeen extensively investigated.
In order to accommodate the aforementioned aspects, variousnumerical and analytical methods have been developed. Althoughanalytical methods can be used to analyze the acoustic character-istics of multilayered composite panels, their applications are re-stricted to a few composite panels that have simple layerconfigurations such as single core sandwich panels, thin panels, orpanels with isotropic or transverse-isotropic layers.
Kurtze and Watters developed an analytical model for singlecore panels, presented the asymptotic structural wave propagationcharacteristics, and described how to adjust the coincidence fre-quency to improve the sound transmission characteristics based onthe asymptotic behaviors [1]. Dym et al. estimated the transmissionloss (TL) through single isotropic core sandwich panels based ontheir symmetric and antisymmetric acoustic impedances [2,3].Moore et al. developed a single core sandwich panel model similarto the model in Refs. [2,3] that can be applied to either an isotropicor orthotropic honeycomb core [4,5]. In addition, Nilsson derivedan analytical model of three layered isotropic panels to predict theTL characteristics as functions of frequency, plate geometries, andmaterial parameters including the damping loss factor [6]. Kim andBolton developed a transfer function of anisotropic poroelasticlayers and applied this transfer function technique to modelinfinite-sized composite sandwich panels to predict their TL charac-teristics [7,8]. Zhou et al. analytically estimated the TL characteris-tics of asymmetric sandwich panels fabricated with orthotropicgraphite fiber face sheets and foam-filled honeycomb cores [9].
1Portions of this work are presented in “Identification of Sound Transmission Char-acteristics of Honeycomb Sandwich Panels Using Hybrid Analytical/One-DimensionalFinite Element Method,” Proceedings of Inter-Noise 2006, December 2006, Honolulu,HI and “Acoustical Characteristics of Honeycomb Sandwich Composite Panels,”161st Meeting of the Acoustical Society of America, May 2011, Seattle, Washington.
Contributed by the Noise Control and Acoustics Division of ASME for publica-tion in the JOURNAL OF VIBRATION AND ACOUSTICS. Manuscript received June 2, 2011;final manuscript received June 20, 2012; published online February 4, 2013. Assoc.Editor: Lonny Thompson.
Journal of Vibration and Acoustics FEBRUARY 2013, Vol. 135 / 011006-1Copyright VC 2013 by ASME
Downloaded 04 Feb 2013 to 165.91.12.182. Redistribution subject to ASME license or copyright; see http://www.asme.org/terms/Terms_Use.cfm

As for the numerical methods, finite element methods (FEMs)have been used to evaluate the TL characteristics of composite pan-els at relatively low frequencies (e.g., at the maximum frequency of2 kHz) [10–12]. Ramakrishnan et al. estimated the noise reductionof laminated composite plates up to the center frequency of 200 Hzin the 1/3 octave bands [10]. Papadopoulos calculated the TL ofisotropic panels such as steel, aluminum, and glass panels up to704 Hz by using HKS ABAQUS [11,12]. Tee et al. investigatedflexural wave propagation in auxetic tetrachiral honeycomb struc-tures by implementing a Bloch-wave-based FE model and themodal density estimated from the model was compared to themeasured model density by using a laser vibrometer [13]. In orderto improve the computational efficiency, the FEM, combined withthe boundary element method (BEM), has been widely used[14–16]. Pates estimated the TL of composite panels by using aFEM/BEM procedure [14] and Coyette used LMS SYSNOISE as aBEM tool to predict the TL of a three layered plate in which a mid-dle porous layer was modeled by using the Biot theory [15]. How-ever, these approaches are not always applicable to relatively highfrequency analyses that require to use a large number of FEM/BEM meshes, resulting in high computational costs.
In order to conduct high frequency analyses, statistical energyanalysis (SEA) approaches have been applied [17–20]. Price et al.predicted the TL and radiation resistance of double leaf panels withair gaps in the middle by using the SEA [17]. Minten et al. com-pared the experimental TL result and the SEA prediction of an iso-tropic panel [18]. These authors reduced the SEA prediction errorby applying the Waterhouse correction [19]. Wang et al. calculatedthe TL of a single core sandwich panel by considering both sym-metric and antisymmetric motions based on a SEA approach [20].The prediction accuracy of the SEA approaches depends on the va-lidity of the high modal density assumption and the accurate esti-mation of SEA model parameters such as dispersion characteristics,internal and coupling damping loss factors, and modal density. Inparticular, the damping loss factors are generally difficult to beaccurately estimated.
Here, a hybrid analytical/finite element method (HAFEM) isdescribed that uses a finite element approximation in the thicknessdirection while analytical solutions are used in the plane directions.Thus, it makes it possible to use a small number of finite elements,even for high frequency analyses in a computationally efficientmanner. When properly meshed with a sufficiently large number ofnodes, the HAFEM models of the composite panels also result inaccurate predictions at high frequencies while SEA approachesyield “statistically estimated” predictions. Cheung described ahybrid analytical/two-dimensional (2-D) finite element (FE) formu-lation that uses analytical mode shapes in an axial direction and 2-D finite stripe elements in the cross sectional directions [21]. Kimand Bolton analyzed the vibration responses of a tire by modelingthe tire using a hybrid model that uses an analytical wave solutionin the circumferential direction of the tire and 2-D finite shell ele-ments in the cross-sectional direction [22]. Dong and Nelson pro-posed a hybrid analytical/1-D FE model including only in-plane,2-D nodal displacements to calculate the displacements, stress dis-tributions, and dispersion relations of orthotropic composite plates[23,24]. Shorter improved the hybrid approach of Dong and Nelsonby considering the full 3-D nodal displacements of infinite-sizecomposite plates with linear viscoelastic layers to calculate theirdispersion relations with the assumption that there is no reflectivewave in the plane directions [25]. The dispersion relations are thenapplied to the SEA to calculate the damping loss factors of the com-posite plates.
In this paper, a hybrid analytical/1-D FE formulation, referredto as the HAFEM, is described that uses no assumption for analyt-ical solutions in the plane directions, which results in a partial dif-ferential system equation that can be used to consider theboundary conditions at the edges of “finite-size” panels [26,27].In this article, simply supported boundary conditions are appliedfor analyzing the structural responses and sound radiation charac-teristics of finite-sized honeycomb sandwich panels.
The proposed HAFEM is applied to analyze the structural wavepropagation characteristics, sound transmission characteristics, andsound radiation characteristics of two honeycomb sandwich panels.The proposed HAFEM can allow each layer of the panels to bemodeled by using a set of orthotropic material properties and thetotal panel thickness of each panel can be large compared to theminimum structural wavelength of interest. It is shown that theHAFEM can be used to accurately predict the coincident frequen-cies of the honeycomb sandwich panels that generally occur at atransition frequency region from flexural wave to core shear wavebehaviors (see Sec. 3.6). Most existing methods use the asymptoticdispersion curve of either flexural or core shear waves to predictcoincident frequencies, resulting in inaccurate predictions.
For the purpose of improving the acoustic performance of sand-wich composite structures, Denli and Sun investigated optimaldesigns of a sandwich composite beam [28], sandwich beams withcellular cores [29], and sandwich cylindrical shells [30]. In addi-tion, they studied the optimal boundary support conditions forimproving the acoustic performance [31] and summarized previ-ous research activities on sandwich composite panel modeling andoptimization methods in Ref. [32].
In this article, a new composite panel concept is proposed toimprove the acoustic performance of a honeycomb sandwich com-posite panel while satisfying its weight and strength requirements.The basic idea of the new concept originated from a double leafpanel of which the structure-borne energy path from one facesheet to the other is disconnected by replacing the core of the hon-eycomb sandwich panel with an air gap. Since the double leafpanel is not feasible in terms of its structural integrity, the devel-opment of a new double core sandwich panel that has two cores isproposed: One core is designed to be heavy and stiff to withstandstructural loads, while the other core is light and soft in order tohave the effect of disconnecting the structure-borne energy path.Although the double core concept that is mainly used to improvethe mechanical properties of the panel is not new, the attempt tomake use of the air gap effects for the purpose of improving theacoustic performances has not been reported, to the best knowl-edge of the authors.
2 Formulation of Hybrid Analytical/Finite Element
Method
For the HAFEM formulation, it is assumed that each layer ishomogeneous, i.e., each layer is assumed to be well representedby a single set of material properties. It is also assumed that eachlayer has a constant thickness. Figure 1 illustrates the HAFEMmodel of a double-layered panel. In this model, two elements are
Fig. 1 Illustration of the hybrid FE model of the double-layeredpanel
011006-2 / Vol. 135, FEBRUARY 2013 Transactions of the ASME
Downloaded 04 Feb 2013 to 165.91.12.182. Redistribution subject to ASME license or copyright; see http://www.asme.org/terms/Terms_Use.cfm

used to represent layer 1 and one element is used for layer 2. Sincethe displacements are approximated by the combination of nodaldisplacements and “linear” interpolation functions in the z-direc-tion, there are two nodes per one element. In the Sec. 2.1, theHAFEM formulation is first derived for a single hybrid element.The global equation of motion (EOM) for a multielement systemcan then be obtained by assembling the local EOMs of all of theelements.
2.1 Basic HAFEM Equation of Motion. The displacementsof a single hybrid element can be approximated in terms of itsnodal displacements that are the functions of x, y, and t, combinedwith the linear interpolation functions N1 and N2 in the z-direction,i.e.
uðx; y; z; tÞ
vðx; y; z; tÞ
wðx; y; z; tÞ
2664
3775 ¼
N1ðzÞ 0 0 N2ðzÞ 0 0
0 N1ðzÞ 0 0 N2ðzÞ 0
0 0 N1ðzÞ 0 0 N2ðzÞ
2664
3775
� u1 v1 w1 u2 v2 w2½ �T(1)
where the superscript T represents the transpose of a vector or ma-trix and N1 and N2 are the interpolation functions, defined as
N1ðzÞ ¼ 1� z
dand N2ðzÞ ¼
z
d(2)
When the deformation of the element is small enough, the strainscan be linearly related to the displacements, i.e.
eðx; y; z; tÞ ¼ @u
@x
@v
@y
@w
@z
@v
@xþ @u
@y
@w
@yþ @v
@z
@w
@xþ @u
@z
� �T
(3)
where e represents the strain vector. By using the stress-strainrelation (i.e., the constitutive relation) represented by a matrix C,the stress vector can be related to the strain vector as
s ¼ Ce (4)
where the matrix C, e.g., for an orthotropic material can beexpressed as
C ¼
C11 C12 C13 0 0 0
C12 C22 C23 0 0 0
C13 C23 C33 0 0 0
0 0 0 C44 0 0
0 0 0 0 C55 0
0 0 0 0 0 C66
2666666664
3777777775
(5)
The virtual work principle is expressed as
dðU � T �WÞ ¼ 0 (6)
where the potential energy U, kinetic energy T, and work W arerepresented as
U ¼ 1
2
ðt
ðx
ðy
ðz
eHCe� �
dx dy dz dt (7)
T ¼ 1
2
ðt
ðx
ðy
ðz
q _uT _udx dy dz dt (8)
and
W ¼ 1
2
ðt
ðx
ðy
ðz
uTf dx dy dz dt (9)
Then, the EOM of the single element can be derived by substitut-ing Eqs. (7)– (9) into Eq. (6), i.e.
Kxx@2u
@x2þKxy
@2u
@x@yþKyy
@2u
@y2þKxz
@u
@xþKyz
@u
@y
þKzzuþM@2u
@t2¼ f i þ fe (10)
where u is the nodal displacement vector (i.e., u¼ [u1 v1 w1 u2 v2
w2]T), K is the element stiffness matrix, and M represents the ele-ment mass matrix. In Eq. (10), fi and fe are the internal and exter-nal force vectors, respectively. A set of orthotropic materialproperties can be considered in Eq. (10) when the stiffness matri-ces are calculated by using the constitutive equation of an ortho-tropic material in Eq. (4). For a multielement system, all localelement matrices can be assembled into global matrices. For com-pact notation, the same symbols are used for both local and globalquantities from now on. Furthermore, the left-hand-side termsassociated with the stiffness matrices in Eq. (10) can be repre-sented as the linear operator defined by
L ¼ Kxx@2
@x2þKxy
@2
@x@yþKyy
@2
@y2þKxz
@
@xþKyz
@
@yþKzz
(11)
When the system is excited at a single angular frequency of x, theglobal EOM can be then expressed as
L vðxÞf g � x2MvðxÞ ¼ �jxfðxÞ (12)
where v is the nodal velocity vector (v¼ @u/@t) and x representsthe position vector in the x-y plane, i.e., x¼ (x, y). The internalforce vector in Eq. (10) is not shown in Eq. (12) since a pair of in-ternal forces facing each other at a node is cancelled during theglobal matrix assembly process. Since Eq. (12) is represented as apartial differential system equation with respect to the x- and y-coordinates, boundary conditions at the edges of finite-size panelscan be easily considered. In this article, for example, the simply-supported boundary conditions are applied when forced vibrationresponses are calculated (see Section 2.4).
2.2 Sound Transmission. When a plane wave is incident onthe bottom surface of a panel at a single frequency, the externalforce vector in Eq. (12) is represented as the combination of inci-dent, reflected, and transmitted sound pressures, i.e.
L vðxÞf g � x2MvðxÞ ¼ �jx s1ðpiðxÞ þ prðxÞÞ � sNptðxÞf g (13)
where pi, pr, and pt are the incident, reflected, and transmittedsound pressures, respectively, and s1 and sN represent the unit vec-tors normal to the bottom and top surfaces of the panel, respec-tively. For an infinite-size panel, a set of plane wave solutions cansatisfy Eq. (13), i.e.
vðxÞ ¼ v̂ expðikxxþ ikyyÞ (14)
piðxÞ ¼ p̂i expðikxxþ ikyyÞ (15)
prðxÞ ¼ p̂r expðikxxþ ikyyÞ (16)
and
ptðxÞ ¼ p̂t expðikxxþ ikyyÞ (17)
where the upper caret represents a complex magnitude. By substi-tuting Eqs. (14)– (17) into Eq. (13) and omitting the upper carets
Journal of Vibration and Acoustics FEBRUARY 2013, Vol. 135 / 011006-3
Downloaded 04 Feb 2013 to 165.91.12.182. Redistribution subject to ASME license or copyright; see http://www.asme.org/terms/Terms_Use.cfm

and the plane wave terms represented by the exponential func-tions, the velocity vector can be represented as
v ¼ �2jxpi K� x2M� jxðR1 þ RNÞ� ��1
s1 (18)
where
K ¼ �k2x Kxx � kxkyKxy � k2
y Kyy þ jkxKxz þ jkyKyz þKzz (19)
Zf ¼ q0c0
k
kz¼ q0c0
kffiffiffiffiffiffiffiffiffiffiffiffiffiffiffiffiffiffiffiffiffiffiffik � k2
x � k2y
q (20)
R1 ¼ Zf s1sT1 (21)
and
RN ¼ Zf sNsTN (22)
The last term, including R1 and RN expressed in Eqs. (21) and(22), represents the acoustic loadings on the top and bottom surfa-ces of the panel. In Eq. (19), the stiffness matrix K includes bothreal and imaginary parts, regardless of the presence of damping.Thus, spatially decaying waves (i.e., evanescent waves) are pres-ent in the panel although there is no sound radiation or structuraldamping. When the plane wave is incident at the angles of u andh, the wave numbers in Eqs. (14)–(22) can be representedas kx¼ k sin h cos u, ky¼ k sin h sin u, and kz¼ k cos h. Then, theintensity transmission coefficient is represented as a function ofu and h, i.e.
sðu; h;xÞ ¼ jptj2
jpij2¼ jZf _wN j2
jpij2(23)
where wN represents the normal displacement on the top surfaceand can be obtained from the velocity solution in Eq. (18),i.e.,� ixwN¼ (sN)Tv. By integrating the intensity transmissioncoefficient in Eq. (23) with respect to u and h, the diffuse fieldtransmission coefficient can be calculated as
sdðxÞ ¼
ð2p
0
ðp=2
0
sðu; h;xÞ cosðuÞ sinðuÞdudh
ð2p
0
ðp=2
0
cosðuÞ sinðuÞdudh
¼ 1
2p
ð2p
0
ðp=2
0
sðu; h;xÞ sinð2uÞdudh (24)
Then the TL is calculated by using
TL ¼ 10 log10
1
sd
(25)
In order to consider field incidence effects [33], the integral inter-val of the incidence angle, h in Eq. (24), that varies from 0� to 90�
for the diffused incident field, is limited to be hmax¼ 78� (i.e.,h¼ 0� to 78�) in the TL results presented in this article.
2.3 Structural Wave Propagation. In order to identify the“structural” wave propagation characteristics of a honeycombsandwich panel, it is assumed that there is no fluid loading on thepanel surfaces, e.g., the panel is placed in a vacuum where there isno sound radiation. When the panel is excited with a distributedharmonic force with specific wave numbers (kx, ky) and a fre-quency f on the bottom surface of the panel, its normal vibrationresponse can be found from Eq. (13) only with the pi term on theright hand side, i.e.
L vðxÞf g � x2MvðxÞ ¼ �jxs1piðxÞ (26)
After solving Eq. (26), the vibration response on the top surface isrepresented as
vðx; y; tÞ ¼ sTNvðx; y; tÞ ¼ Re½Vðkx; ky; f Þ expðikxxþ ikyy� i2pftÞ�
(27)
where V is the complex velocity amplitude. The amplitude of the
vibration response at a specific radial wave number kr ¼ffiffiffiffiffiffiffiffiffiffiffiffiffiffiffik2
x þ k2y
qcan then be defined as an integral of jV(kx, ky, f)j along the circleC(kr) with the radius of kr in the (kx, ky) domain, i.e.
�vðkr; f Þ ¼þ
CðkrÞVðkx; ky; f Þ�� ��dkr (28)
The resulting vibration response �v can be plotted in a (kr, f) con-tour plot, where the peak responses represent the dispersion rela-tions of the structural waves propagating in the panel. From thedispersion relation, the wave speed can be calculated by using
c ¼ 2pf
k(29)
In addition, the analytical dispersion curves of the sound wave,flexural wave, core shear waves, and skin flexural wave can beoverlaid on the top of the (kr, f) contour plot. The dispersion curveof the flexural wave is represented as
k ¼ffiffiffiffiffiffiffiffiffiffiffiffiffiffiffiffiffiffiffiffiffiffiffið2pf Þ2m=D
4
q(30)
where m is the mass per unit area and D is the equivalent flexuralstiffness, calculated based on the assumption of a “thin” compos-ite plate [34]. The core shear wave speed can be calculated byusing the following equation, i.e.
cC:S: ¼ffiffiffiffiG
m
r(31)
where G is the core shear modulus. For an orthotropic core thathas two different core shear moduli (e.g., Gzx and Gyz in Table 3),the core shear wave can have two different wave speeds, depend-ing on its wave propagation direction. The dispersion curve of theskin flexural wave is calculated as
k ¼ffiffiffiffiffiffiffiffiffiffiffiffiffiffiffiffiffiffiffiffiffiffiffiffiffiffiffiffiffiffiffið2pf Þ2m=ð2DSÞ
4
q(32)
where the mass per unit area is half of the total mass per unit aream of the panel [1]. In Eq. (32), the skin flexural stiffness DS isdefined as
DS ¼ESt3S
12ð1� l2SÞ
(33)
where ES, tS, and lS are the Young’s modulus, thickness, and Pois-son’s ratio of the skin, respectively [1].
2.4 Forced Responses. In order to consider structural damp-ing, the linear operator matrix L in Eq. (12) can be replaced byL(1� ig) where g is the structural loss factor. Then, the EOM isrepresented as
Lð1� igÞ vðxÞf g �M@2vðxÞ@t2
¼ �jxfðxÞ (34)
011006-4 / Vol. 135, FEBRUARY 2013 Transactions of the ASME
Downloaded 04 Feb 2013 to 165.91.12.182. Redistribution subject to ASME license or copyright; see http://www.asme.org/terms/Terms_Use.cfm

For finite-size panels, the velocity vector of (m,n) mode can bewritten as
vmnðx; y; tÞ ¼ bmnWmnðx; yÞumn expð�ixmntÞ (35)
where xmn is the natural frequency of the (m,n) mode, umn is themodal amplitude vector, and Wmn is the diagonal matrix of themode shapes determined from the boundary conditions along theedges of a finite-size panel. For example, the diagonal element ofWmn for the simply-supported boundary condition is defined as
wmnðx;yÞ
¼
cosðmpx=LxÞsinðnpy=LyÞ; for the x-direction nodal velocity
sinðmpx=LxÞcosðnpy=LyÞ; for the y-direction nodal velocity
sinðmpx=LxÞsinðnpy=LyÞ; for the z-direction nodal velocity
8>><>>:
(36)
where Lx and Ly are the x- and y-direction dimensions of the plate[34]. In Eq. (35), bmn is the mode normalization factor withrespect to the mass matrix M satisfying
ðLx
0
ðLy
0
b2mnuH
mnWHmnðx; yÞMWmnðx; yÞumndx dy ¼ 1 (37)
Equation (35) satisfies the undamped free vibration case ofEq. (34) with f¼ 0 and g¼ 0, i.e.
Smnumn � x2mnMumn ¼ 0 (38)
where
Smn ¼ LðWmnÞW�1mn (39)
Thus, the modal amplitude vector and the corresponding naturalfrequency are determined from the eigenvalue problem given inEq. (38). For a harmonic excitation at an angular frequency x theforced solution is expressed as the superposition of the modes, i.e.
vðx; y; tÞ ¼Xm;n
CmnbmnWmnumn expð�ixtÞ (40)
where Cmn is the modal contribution coefficient of the (m,n)mode. By substituting Eq. (40) into Eq. (34) and applying the or-thogonal property of the modes, the modal contribution coefficientcan be obtained as
Cmn ¼�ixfmn
x2mn � x2 � igx2
mn
(41)
where fmn is the modal force. In Eq. (41), the modal damping isconsidered in terms of the structural damping factor g.
2.5 Sound Radiation. In order to calculate the acoustic pres-sure radiated from the finite-size panel excited by the harmonicforce, it is assumed that the vibration response of the panel can befound without acoustic loadings on the surface of the panel. Theresulting surface vibration response is then used to calculate theacoustic pressure distribution on the surface. This analysis tech-nique is referred to as the weakly coupled vibroacoustic analysis.The latter approach is generally invalid when the panel is placed ina heavy fluid medium such as water. Additionally, the acousticloading effects on the vibration response cannot be ignored at lowfrequencies, even in a light fluid medium such as air.
For calculating the acoustic pressure distribution on the surfaceof the panel, the velocity spectrum V(kx,ky) is obtained after apply-
ing the spatial 2-D fast Fourier transform (FFT) to the complexsurface vibration velocity calculated from Eq. (40). Euler’s equa-tion is then applied to calculate the acoustic pressure spectrumfrom the velocity spectrum [35], i.e.
Pðkx; kyÞ ¼ q0c0
k
kzVðkx; kyÞ (42)
By applying the inverse spatial 2D FFT to the acoustic pressurespectrum, the acoustic pressure distribution p(x, y) can beobtained. The active intensity Iactive is then calculated by multiply-ing the acoustic pressure and velocity distributions, i.e.
Iactiveðx; yÞ ¼1
2Re½pðx; yÞv�ðx; yÞ� (43)
The radiated power P and the radiation efficiency r can beobtained by taking the spatial integral of the active intensity overthe panel surface as
P ¼ðLy
0
ðLx
0
Iactiveðx; yÞdx dy (44)
and
r ¼ P1
2q0c0LxLy jvj2
D E (45)
where h|v|2i is the spatially-averaged square velocity.In order to calculate the supersonic intensity (see Sec. 3.8) [36],
a wave number filter is applied to both the acoustic pressure andvelocity spectra to obtain Psupersonic(kx,ky) and Vsupersonic(kx,ky)from which all subsonic components are filtered out. The super-sonic intensity is then calculated by applying the inverse spatial2D FFT to the two spectra and multiplying the resulting super-sonic acoustic pressure and velocity distributions, i.e.
Isupersonicðx; yÞ ¼1
2Re½psupersonicðx; yÞv�supersonicðx; yÞ� (46)
3 Results and Discussion
The HAFEM models shown in this article consist of 20 or fewerhybrid elements. As a result, it usually takes less than 20 s to ana-lyze each of the following TL cases by using a computer with a3.07 GHz Intel Xeon processor and 6 GB RAM. It is usually take2-4 h to analyze a similar problem by using a full 3-D FEM/BEMmodel and the maximum frequency of this analysis (e.g., 2 kHz) ismuch lower than that of the HAFEM analyses.
In the following sections, two simple panels (i.e., an aluminumpanel and an aluminum-foam-aluminum sandwich panel) areinvestigated to validate the proposed HAFEM procedures beforeanalyzing the honeycomb sandwich panels.
3.1 Aluminum Panel. A 5 mm thick aluminum panel is ana-lyzed by using the proposed HAFEM. Table 1 shows the materialproperties of the aluminum panel. Fig. 2 shows the analytical andHAFEM TL results. It is shown that the HAFEM TL results agreewell with the analytical results.
3.2 Aluminum-Foam-Aluminum Sandwich Panel. An alu-minum-foam-aluminum sandwich panel is analyzed as anothervalidation case. The material properties and experimental TL dataof the panel are provided courtesy of Kim and Bolton [7,8]. Thematerial properties are shown in Table 2 and the TL results inFig. 3. The predicted HAFEM TL results agree well with themeasured TL results, although there are some discrepancies inboth the low and high frequency regions (e.g., below 200 Hz and
Journal of Vibration and Acoustics FEBRUARY 2013, Vol. 135 / 011006-5
Downloaded 04 Feb 2013 to 165.91.12.182. Redistribution subject to ASME license or copyright; see http://www.asme.org/terms/Terms_Use.cfm

above 2 kHz). In the low frequency region, the discrepancy maybe caused by the finite size effects of the experimental panel (i.e.,the effects of the boundary conditions) since an infinite-size panelmodel is used for the HAFEM TL analysis (see Section 2.2), whilethe experimental panel is a finite-size one. Since the HAFEMmodel uses only elastic properties for the foam core (i.e., theporoelastic properties such as flow resistivity, tortuosity, and po-rosity in Table 2 are not considered), the HAFEM model may notproperly represent the porous core, which results in the TL differ-ence between the predicted and measured TL results in the highfrequency region. In the future, the porous effects will be consid-ered by developing a poroelastic element.
3.3 Honeycomb Sandwich Panels. The material propertiesof two honeycomb sandwich panels are listed in Table 3 [24],where the two panels are referred to as Configurations 1 and 2.The HAFEM models of these two panels consist of two elementsfor each skin and six elements for each core. The HAFEM TLresults are compared with the experimental results in Figs. 4 and 5
[27]. The TL measurements are made with 72 in.� 72 in. panelsin a reverberant/anechoic chamber suite while the HAFEM mod-els use the assumption of infinite-size panels. The cut-off fre-quency of the reverberant room is approximately 250 Hz, i.e.,
Table 1 Material properties of aluminum panel
Air Density (q0) 1.21 kg/m3
Speed of sound (c0) 343 m/s
Aluminum panel(isotropic material)
Thickness (d) 0.005 mYoung’s modulus (E) 7.1� 1010 PaPoisson’s ratio (�) 0.3292Density (q) 2700 kg/m3
Structural loss factor (g) 0.03
Fig. 2 The TL results of the aluminum panel
Table 2 Material properties of aluminum-foam-aluminum sand-wich panel [26]
Aluminumface sheet(isotropicmaterial)
Thickness (d) 6� 10�4 mOther properties are same as those given in Table 1
Wiltec foam(isotropicmaterial)
Thickness (d) 2.54� 10�2 mDensity (q) 7.64 kg/m 3
Young’s modulus (E) 2.53� 10 5 PaPoisson’s ratio (�) 0.42
Structural loss factor (g) 0.2Flow resistivity 12,180 MKS Rayls/m
Tortuosity 1.5Porosity 0.99
Table 3 Material properties of honeycomb sandwich panels
Configuration 1 Configuration 2
Face sheet(isotropicmaterial)
Thickness (d) 5.842� 10�4 m 4.572� 10�4 mDensity (q) 1716 kg/m3 1778 kg/m3
Young’s modulus (E) 6.128� 1010 Pa 1.523� 1010 PaPoisson’s ratio (�) 0.143 0.142Loss factor (g) 0.05 0.05
Nomex core(orthotropicmaterial)
Thickness (d) 0.9017� 10�2 m 1.905� 10�2 mDensity (q) 128.1 kg/m3 48.1 kg/m3
Young’s modulus (Exx) 6.895� 105 Pa 6.895� 105 PaYoung’s modulus (Eyy) 6.895� 105 Pa 6.895� 105 PaYoung’s modulus (Ezz) 5.792� 108 Pa 1.310� 108 PaShear modulus (Gyz) 7.033� 107 Pa 2.550� 107 PaShear modulus (Gzx) 1.570� 108 Pa 4.900� 107 PaShear modulus (Gxy) 6.985� 105 Pa 6.985� 105 PaPoisson’s ratio (vyz) 0.01 0.01Poisson’s ratio (vzx) 0.01 0.01Poisson’s ratio (vxy) 0.50 0.50Loss factor (g) 0.05 0.05
Fig. 3 The TL results of the aluminum-foam-aluminum sand-wich panel [26]
Fig. 4 The TL results of the honeycomb sandwich panel (Con-figuration 1)
011006-6 / Vol. 135, FEBRUARY 2013 Transactions of the ASME
Downloaded 04 Feb 2013 to 165.91.12.182. Redistribution subject to ASME license or copyright; see http://www.asme.org/terms/Terms_Use.cfm

below the cut-off frequency, the incident sound field in the rever-berant room cannot be assumed to be perfectly reverberant. Below300 Hz in Fig. 4 (500 Hz for Configuration 2 in Fig. 5), the meas-ured TL values are higher than the predicted ones due to theboundary effects of the finite-size test panels and the imperfectreverberant conditions, e.g., the maximum TL difference isapproximately 7 dB for Configuration 1 (6 dB for Configuration2). In this frequency range, however, the HAFEM TL resultsagree well with the mass law represented by the red curve [27]. Inthe midfrequency region, e.g., where there are coincident frequen-cies around 1.2 kHz, the panels have the local minimum TL val-ues since the panels are assumed to be acoustically-transparent atthe coincident frequencies. In the high frequency region, theHAFEM and experimental TL results agree well with each otherwithin the TL difference of 1 dB for Configuration 1. For Configu-ration 2, these two results agree well with each other up to 4 kHz.In the frequency range from 4 kHz to 6.4 kHz, the discrepancybetween the hybrid FE and the experimental results may becaused by the inaccurate TL measurement. It may also be causedby the inaccurate prediction or measurement of the material prop-erties used for the HAFEM model.
3.4 Mass and Stiffness Tuned Honeycomb SandwichPanels. As shown in Figs. 4 and 5, the coincident phenomena de-grade the TL performance. Therefore, it is worthwhile to investi-gate the panel design parameters that control the locations of thecoincidence frequencies. For a thin plate whose the equivalentflexural stiffness is same as one of the two honeycomb sandwichpanels, the critical frequency (i.e., the lowest coincident fre-quency) can be represented as
xC ¼ c0
ffiffiffiffim
D
r(47)
where c0 is the speed of sound [33].In Fig. 6, the baseline panel is the honeycomb sandwich panel
of Configuration 1 and the stiffness and mass tuned panels areobtained by decreasing the Young’s modulus of the skin by 50%and increasing the skin mass by 50%, respectively.
When the mass per unit area of the panel remains unchanged,the critical frequency shifts to the right by decreasing its flexuralstiffness, e.g., as shown in Fig. 6(a). Although the stiffness tunedpanel performance is inferior to the baseline panel by 1 dB or lessat high frequencies, there are significant TL benefits at around thecritical frequency (see Fig. 6(a)). Thus, the mass law region canbe extended, which can result in improving the overall soundtransmission characteristics.
Similarly, the mass can be increased to improve the soundtransmission characteristics by shifting the coincident frequenciesto the right, e.g., as shown in Fig. 6(b). The increased skin massresults in uniformly improving the TL performance up to the coin-cident frequencies.
However, the decrease of the flexural stiffness is limited to a cer-tain amount to meet the strength requirement of the panel. The massincrease is also limited by the weight requirement of the panel.
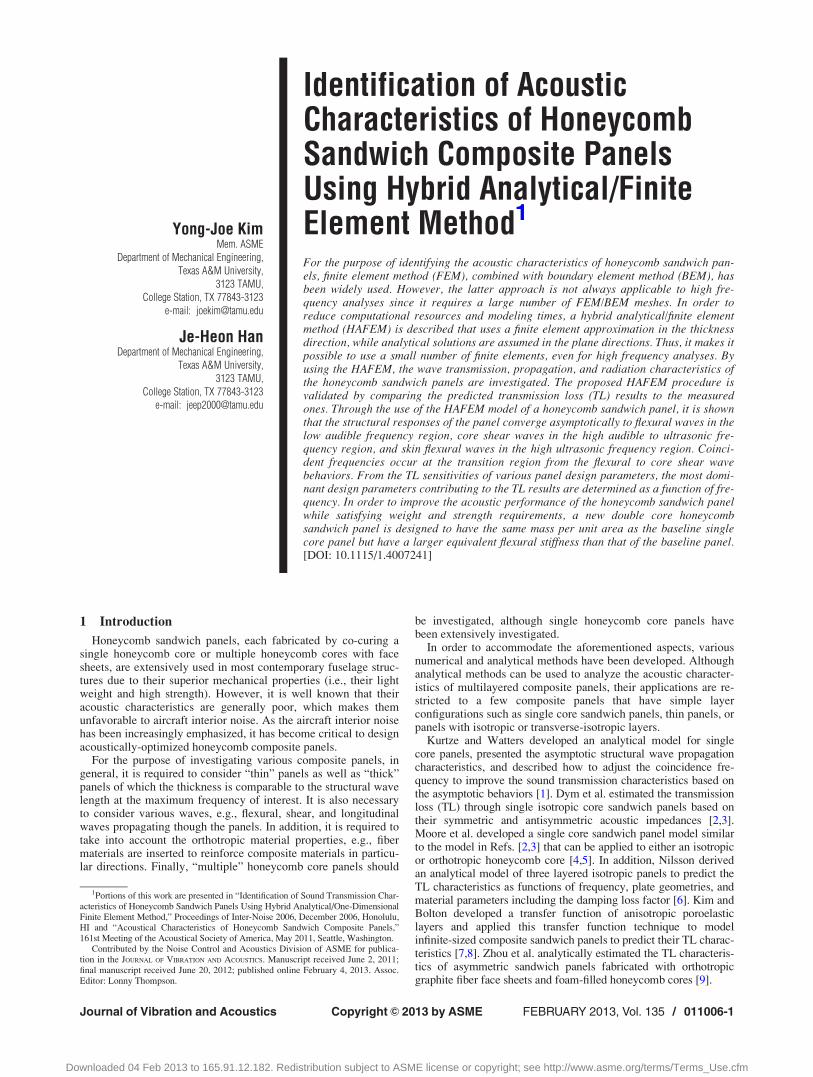
3.5 Transmission Loss Sensitivity. Figure 7 shows the TLsensitivities of the honeycomb sandwich panel (Configuration 1)with respect to its material properties. The TL sensitivity of a paneldesign parameter is defined here as the TL difference caused by the10% variation of the design parameter. In the low frequency region(i.e., below the critical frequency around 1.1 kHz), the TL is themost sensitive to the skin and core densities, while in the high fre-quency region it is the most sensitive to the core shear moduli andcore damping. Thus, the low frequency region can be referred to asthe mass controlled region while the high frequency region can bereferred to as the core shear stiffness controlled region. In the coin-cidence frequency region (i.e., the valley-shaped TL region around1.1 kHz in Fig. 4), all of the material properties except the coreYoung’s modulus in the z-direction are important in terms of theirTL sensitivities: The skin Young’s modulus is the most sensitive tothe TL in this critical frequency region.
3.6 Structural Wave Propagation Characteristics: DispersionRelations. In order to identify the structural wave propagationcharacteristics of the honeycomb sandwich panel (Configuration
Fig. 5 The TL results of the honeycomb sandwich panel(Configuration 2)
Fig. 6 The TL results of the stiffness and mass tuned panels:(a) panel with the skin stiffness decreased by 50%, and (b)panel with the skin mass increased by 50%
Journal of Vibration and Acoustics FEBRUARY 2013, Vol. 135 / 011006-7
Downloaded 04 Feb 2013 to 165.91.12.182. Redistribution subject to ASME license or copyright; see http://www.asme.org/terms/Terms_Use.cfm
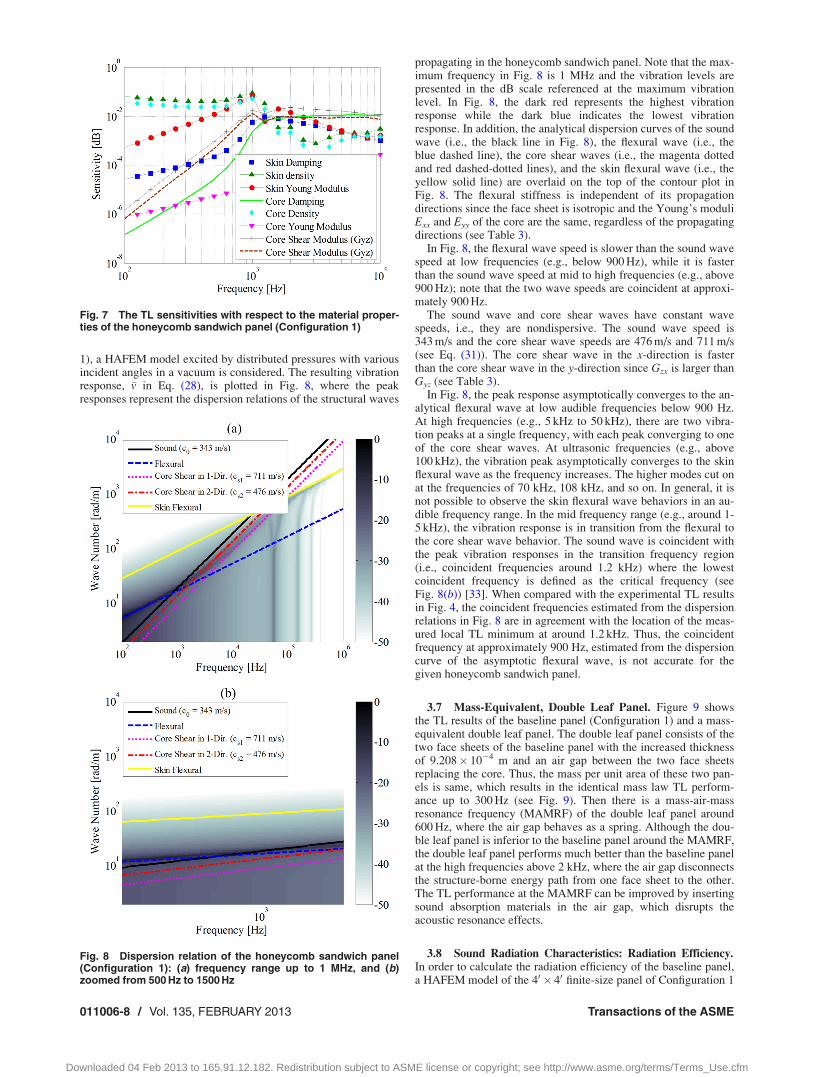
1), a HAFEM model excited by distributed pressures with variousincident angles in a vacuum is considered. The resulting vibrationresponse, �v in Eq. (28), is plotted in Fig. 8, where the peakresponses represent the dispersion relations of the structural waves
propagating in the honeycomb sandwich panel. Note that the max-imum frequency in Fig. 8 is 1 MHz and the vibration levels arepresented in the dB scale referenced at the maximum vibrationlevel. In Fig. 8, the dark red represents the highest vibrationresponse while the dark blue indicates the lowest vibrationresponse. In addition, the analytical dispersion curves of the soundwave (i.e., the black line in Fig. 8), the flexural wave (i.e., theblue dashed line), the core shear waves (i.e., the magenta dottedand red dashed-dotted lines), and the skin flexural wave (i.e., theyellow solid line) are overlaid on the top of the contour plot inFig. 8. The flexural stiffness is independent of its propagationdirections since the face sheet is isotropic and the Young’s moduliExx and Eyy of the core are the same, regardless of the propagatingdirections (see Table 3).
In Fig. 8, the flexural wave speed is slower than the sound wavespeed at low frequencies (e.g., below 900 Hz), while it is fasterthan the sound wave speed at mid to high frequencies (e.g., above900 Hz); note that the two wave speeds are coincident at approxi-mately 900 Hz.
The sound wave and core shear waves have constant wavespeeds, i.e., they are nondispersive. The sound wave speed is343 m/s and the core shear wave speeds are 476 m/s and 711 m/s(see Eq. (31)). The core shear wave in the x-direction is fasterthan the core shear wave in the y-direction since Gzx is larger thanGyz (see Table 3).
In Fig. 8, the peak response asymptotically converges to the an-alytical flexural wave at low audible frequencies below 900 Hz.At high frequencies (e.g., 5 kHz to 50 kHz), there are two vibra-tion peaks at a single frequency, with each peak converging to oneof the core shear waves. At ultrasonic frequencies (e.g., above100 kHz), the vibration peak asymptotically converges to the skinflexural wave as the frequency increases. The higher modes cut onat the frequencies of 70 kHz, 108 kHz, and so on. In general, it isnot possible to observe the skin flexural wave behaviors in an au-dible frequency range. In the mid frequency range (e.g., around 1-5 kHz), the vibration response is in transition from the flexural tothe core shear wave behavior. The sound wave is coincident withthe peak vibration responses in the transition frequency region(i.e., coincident frequencies around 1.2 kHz) where the lowestcoincident frequency is defined as the critical frequency (seeFig. 8(b)) [33]. When compared with the experimental TL resultsin Fig. 4, the coincident frequencies estimated from the dispersionrelations in Fig. 8 are in agreement with the location of the meas-ured local TL minimum at around 1.2 kHz. Thus, the coincidentfrequency at approximately 900 Hz, estimated from the dispersioncurve of the asymptotic flexural wave, is not accurate for thegiven honeycomb sandwich panel.
3.7 Mass-Equivalent, Double Leaf Panel. Figure 9 showsthe TL results of the baseline panel (Configuration 1) and a mass-equivalent double leaf panel. The double leaf panel consists of thetwo face sheets of the baseline panel with the increased thicknessof 9.208� 10�4 m and an air gap between the two face sheetsreplacing the core. Thus, the mass per unit area of these two pan-els is same, which results in the identical mass law TL perform-ance up to 300 Hz (see Fig. 9). Then there is a mass-air-massresonance frequency (MAMRF) of the double leaf panel around600 Hz, where the air gap behaves as a spring. Although the dou-ble leaf panel is inferior to the baseline panel around the MAMRF,the double leaf panel performs much better than the baseline panelat the high frequencies above 2 kHz, where the air gap disconnectsthe structure-borne energy path from one face sheet to the other.The TL performance at the MAMRF can be improved by insertingsound absorption materials in the air gap, which disrupts theacoustic resonance effects.
3.8 Sound Radiation Characteristics: Radiation Efficiency.In order to calculate the radiation efficiency of the baseline panel,a HAFEM model of the 40 � 40 finite-size panel of Configuration 1
Fig. 7 The TL sensitivities with respect to the material proper-ties of the honeycomb sandwich panel (Configuration 1)
Fig. 8 Dispersion relation of the honeycomb sandwich panel(Configuration 1): (a) frequency range up to 1 MHz, and (b)zoomed from 500 Hz to 1500 Hz
011006-8 / Vol. 135, FEBRUARY 2013 Transactions of the ASME
Downloaded 04 Feb 2013 to 165.91.12.182. Redistribution subject to ASME license or copyright; see http://www.asme.org/terms/Terms_Use.cfm

is analyzed. The panel that is simply supported at its edges isexcited by a harmonic point force with the amplitude of 1 N at (x,y)¼ (0.2,0.3) m.
Figure 10 shows the calculated sound radiation efficiency. At lowfrequencies below the critical frequency, the radiation efficiency isless than 1. In this frequency region, the noise radiation is predomi-nantly from the corners and edges of the panel [33]. For example,the active and supersonic acoustic intensities at 187 Hz are plottedin Fig. 11. The supersonic intensity is calculated by applying a wavenumber filter to remove the subsonic components in both the soundpressure and velocity spectra in the wavenumber domain (see Sec.2.5). Thus, the supersonic intensity represents the sound power perunit area radiating to the “farfield” of the panel [36]. Although thelargest acoustic power is radiated around the excitation point, asshown in Fig. 11(a), the sound power propagating to the farfield ispredominantly from the corners of the panel (see Fig. 11(b)). Fromthis viewpoint, the stiffeners applied to reinforce a panel structurecan increase the length of the edges and the number of corners at theinterfaces of the stiffeners and the panel. The total radiated noiselevel at low frequencies then increases due to the additional noisecomponents radiating from the increased edges.
3.9 Double Core Panel. For the purpose of improving theacoustic performance of the honeycomb sandwich panel while
satisfying the weight and strength requirements, a new compositepanel design is proposed here. The basic idea of the new conceptis based on the mass-equivalent double leaf panel. As noted inSec. 3.7, the TL performance of the baseline honeycomb sand-wich panel can be dramatically improved in high frequencies byreplacing its core with an air gap such as the mass-equivalent,double leaf panel. However, the double leaf panel is not feasiblein terms of its structural integrity. In order to take advantage ofthe air gap effects and make it possible to design a structurallyviable panel, a double core panel in which one core is designed tobe heavy and stiff to withstand structural loads and the other coreis light and soft to disconnect the structure-borne energy pathfrom one outer skin to the other is proposed. Table 4 shows a newdouble core panel design and Table 5 shows the equivalent flex-ural stiffness and masses per unit area of both the baseline paneland new double core panel. In Table 5, the flexural stiffness of thenew panel is increased, mainly due to the increased core thick-ness, while the mass per unit area is identical.
Figure 12 shows the TL characteristics of the two panels. TheTL characteristics of the new panel are much better than the base-line panel in high frequencies, e.g., the TL performance of thenew panel is 8 dB to 20 dB higher than the baseline panel above2 kHz. However, the new panel has 1-2 dB lower TL values thanthe baseline panel in a narrow frequency band around 1.2 kHz,
Fig. 9 The TL results of the baseline panel (Configuration 1)and the mass-equivalent double leaf panel
Fig. 10 Sound radiation efficiency of the 40by 40 baseline panel(Configuration 1) excited by the point force
Fig. 11 Acoustic intensities at 187 Hz radiated from the baselinepanel (Configuration 1) excited by the point force at (x, y) 5 (0.2,0.3) m: (a) active acoustic intensity, and (b) supersonic acousticintensity
Journal of Vibration and Acoustics FEBRUARY 2013, Vol. 135 / 011006-9
Downloaded 04 Feb 2013 to 165.91.12.182. Redistribution subject to ASME license or copyright; see http://www.asme.org/terms/Terms_Use.cfm

while their TL characteristics in low frequencies, e.g., belowapproximately 1 kHz, are almost identical.
4 Conclusions
In this article, a HAFEM is described that can be used to ana-lyze the sound transmission characteristics, structural wave propa-gation characteristics, and sound radiation characteristics of
multilayered composite panels whose layers are represented byorthotropic material properties. By comparing the HAFEM resultswith the analytical solutions and experimental results, it is shownthat the HAFEM can be successfully used to analyze various pan-els, up to the ultrasonic frequency region, in a computationally ef-ficient manner.
The TL characteristics of the two honeycomb sandwich panelsare identified by using the HAFEM models. The HAFEM TL pre-dictions agree well with the measured data. In order to improve theTL characteristics, the stiffness and mass tuned panels are sug-gested. In addition, the mass-equivalent double leaf panel is alsoproposed to further enhance the performance at high frequencies.For the purpose of identifying the dominant panel design parame-ters, the TL sensitivity with respect to each design variable is pre-sented that indicates how much each variable contributes to the TLresults. In the low frequency region, the skin and core density con-tribute the most significantly to the TL results, where it is referredto as the mass controlled region. The core Young’s modulus is theleast sensitive to the TL variation around the coincidence frequen-cies, while other properties have a relatively significant contributionto the TL variation. In the high frequency region, the core shearstiffness variation is the most sensitive to the TL variation.
The flexural, core shear, and skin flexural waves propagatingthrough the panels have been identified in the wave number/fre-quency domain, which is referred to as the dispersion relations.Through the dispersion relations of the honeycomb sandwichpanel, it is observed that in the low audible frequency region, theflexural wave dominates the structural wave propagation behav-iors of the honeycomb sandwich panel. In the high audible fre-quency region, the core shear wave mainly affects the wavepropagation characteristics. In the ultrasonic frequency region, theskin flexural wave (i.e., the flexural wave without the core) domi-nates the structural responses of the panel. Furthermore, the coin-cidence phenomenon is observed at the frequency band where thesound wave length is in agreement with the structural wavelength. In the Configuration 1 panel considered in this article, thecoincident phenomenon is observed at the transition region fromthe flexural to the core shear wave behavior.
In order to analyze the sound radiation characteristics, the radia-tion efficiency of the Configuration 1 panel is obtained. The radia-tion pattern at low frequencies below the critical frequency is alsoinvestigated by comparing the active and supersonic acoustic inten-sities. The supersonic acoustic intensity below the critical fre-quency is successfully used to visualize the corner radiation mode.
Finally, the new “double” core honeycomb sandwich panel thathas the same mass as the baseline “single” core panel is proposedin this paper. It is shown that the proposed panel has the high TLadvantage (i.e., 8–20 dB higher than that of the baseline) of theequivalent-mass double leaf panel in the broad high frequencyrange above the coincidence frequency at 1.2 kHz, while it has a1–2 dB lower TL than the baseline panel in the narrow band aroundthe coincidence frequency. Its TL characteristics in the low fre-quency range below 1 kHz are same as those of the baseline panel.
References[1] Kurtze, K., and Watters, B. G., 1959, “New Wall Design for High Transmission
Loss or High Damping,” J. Acoust. Soc. Am., 31(6), pp. 739–748.[2] Dym, C. L., and Lang, M. A., 1974, “Transmission of Sound Through Sand-
wich Panels,” J. Acoust. Soc. Am., 56(5), pp. 1523–1532.[3] Dym, C. L., Ventres, C. S., and Lang, M. A., 1976, “Transmission of Sound
Through Sandwich Panels: A Reconsideration,” J. Acoust. Soc. Am., 59(2), pp.364–367.
[4] Moore, J. A., 1975, “Sound Transmission Loss Characteristics of Three LayerComposite Wall Construction,” Ph.D. thesis, Massachusetts Institute of Tech-nology, Cambridge, MA.
[5] Moore, J. A., and Lyon, R. H., 1991, “Sound Transmission Loss Characteristicsof Sandwich Panel Constructions,” J. Acoust. Soc. Am., 89(2), pp. 777–791.
[6] Nilsson, A. C., 1990, “Wave Propagation In and Sound Transmission ThroughSandwich Plates,” J. Sound Vib., 138(1), pp. 73–94.
[7] Kim, Y. K., and Bolton, J. S., 2003, “Sound Transmission Through Lined,Composite Fuselage Structure: Formulation of Anisotropic Poroelastic Theory,”Proceedings of NOISE-CON 2003, Cleveland, OH, June 23–25.
Table 4 Material properties of double core panel
Bottomface sheet
Same as the face sheet of configuration 1 in Table 3
HeavyNomex core(orthotropicmaterial)
Thickness (d) 0.4508� 10�2 mDensity (q) 192.15 kg/m3
Young’s modulus (Exx) 1.379� 106 PaYoung’s modulus (Eyy) 1.379� 106 PaYoung’s modulus (Ezz) 1.158� 109 Pa
Shear modulus (Gyz) 1.407� 108 PaShear modulus (Gzx) 3.140� 108 PaShear modulus (Gxy) 1.379� 106 Pa
Other properties are same as the Nomex core shown in Table 3
Middlesheet
Thickness (d) 1.1684� 10�4 mSame as the face sheet in Table 3 (configuration 1)
LightNomex core(orthotropicmaterial)
Density (q) 32.03 kg/m3
Young’s modulus (Exx) 3.4475� 102 PaYoung’s modulus (Eyy) 3.4475� 102 PaYoung’s modulus (Ezz) 2.896� 105 Pa
Shear modulus (Gyz) 3.571� 104 PaShear modulus (Gzx) 7.850� 104 PaShear modulus (Gxy) 3.448� 102 Pa
Other properties are same as the Nomex core shown in Table 3
Upperface sheet
Thickness (d) 4.6736� 10�4 mSame as the face sheet of configuration 1 in Table 3
Table 5 Equivalent flexural stiffness and mass per unit area
Honeycomb sandwich panel(configuration I in Table 3)
New double core panel(shown in Table 4)
Equivalentflexural stiffness
0.8433� 103 N/m 3.3350� 103 N/m
Mass per unit area 3.1601 kg/m2 3.1601 kg/m2
Fig. 12 The TL results of the baseline panel (Configuration 1)and the mass-equivalent double core panel
011006-10 / Vol. 135, FEBRUARY 2013 Transactions of the ASME
Downloaded 04 Feb 2013 to 165.91.12.182. Redistribution subject to ASME license or copyright; see http://www.asme.org/terms/Terms_Use.cfm

[8] Kim, J. Y., and Bolton, J. S., 2003, “Sound Transmission Through Lined, Com-posite Fuselage Structure: Honeycomb Sandwich Panel and Lining Treatment,”Proceedings of Inter-Noise 2003, Seoul, Korea, August 25–28.
[9] Zhou, R., and Crocker, M. J., 2010, “Sound Transmission Characteristics ofAsymmetric Sandwich Panels,” ASME J. Vibr. Acoust., 132, p. 031012.
[10] Ramakrishnan, J. V., and Koval, L. R., 1987, “A Finite Element Model forSound Transmission Through Laminated Composite Plate,” J. Sound Vib.,112(3), pp. 433–446.
[11] Papadopoulos, C. I., 2002, “Development of an Optimized, Standard-CompliantProcedure to Calculate Sound Transmission Loss: Design of TransmissionRooms,” Appl. Acoust., 63(9), pp. 1003–1029.
[12] Papadopoulos, C. I., 2010, “Development of an Optimized, Standard CompliantProcedure to Calculate Sound Transmission Loss: Numerical Measurements,”Appl. Acoust., 64(11), pp. 1069–1085.
[13] Tee, K. F., Spadoni, A., Scarpa, F., and Ruzzene, M., 2010, “Wave Propagationin Auxetic Tetrachiral Honeycombs,” ASME J. Vibr. Acoust., 132, p. 031007.
[14] Pates, C. S., 1995, “Sound–Structure Interaction Analysis of Composite PanelsUsing Coupled Boundary and Finite Element Methods,” J. Acoust. Soc. Am.,98(2), pp. 1216–1221.
[15] Coyette, J. P., 1999, “The Use of Finite-Element and Boundary-Element Mod-els for Predicting the Vibro-Acoustic Behaviour of Layered Structures,” Adv.Eng.Software, 30, pp. 133–139.
[16] Cali, C., Citarella, R., and Galasso, A., 2001, “Transmission Loss Assessmentby Integrated FEM-BEM Methodology,” Proceedings of the Tenth InternationalConference on Computational Methods and Experimental Measurements, Ali-cante, Spain, June 4–6.
[17] Price, A. J., and Crocker, M. J., 1970, “Sound Transmission Through DoublePanels Using Statistical Energy Analysis,” J. Acoust. Soc. Am., 49(3A), pp.683–693.
[18] Minten, M., Cops, A., and Wijnants, F., 1987, “The Sound Transmission Lossof a Single Panel Measured With the Two-Microphone and the ConventionalMethod Comparison With the Statistical Energy Analysis Model,” Appl.Acoust., 22(4), pp. 281–295.
[19] Waterhouse, R. V., 1955, “Interference Patterns in Reverberant Sound Fields,”J. Acoust. Soc. Am., 27, pp. 247–258.
[20] Wang, T., Li, S., Rajaram, S., and Nutt, S. R., 2010, “Predicting the SoundTransmission Loss of Sandwich Panels by Statistical Energy AnalysisApproach,” ASME J. Vibr. Acoust., 132(1), p. 011004.
[21] Cheung, Y. K., 1976, Finite Strip Method in Structural Analysis, Pergamon,New York.
[22] Kim, Y.-J., and Bolton, J. S., 2003, “Analysis of Tire Vibration by Using aHybrid Two-Dimensional Finite Element Based on Composite Shell Theory,”Proceedings of Inter-Noise 2003, Seoul, Korea, August 25–28.
[23] Dong, S., and Nelson, R., 1972, “On Natural Vibrations and Waves in Lami-nated Orthotropic Plates,” J. Appl. Mech., 39, pp. 739–745.
[24] Nelson, R., and Dong, S., 1973, “High Frequency Vibrations and Waves inLaminated Orthotropic Plates,” ASME J. Vibr. Acoust., 30(1), pp. 33–44.
[25] Shorter, P., 2004, “Wave Propagation and Damping in Linear ViscoelasticLaminates,” J. Acoust. Soc. Am., 115(5), pp. 1917–1925.
[26] Kim, Y.-J., 2006, “Identification of Sound Transmission Characteristics of Hon-eycomb Sandwich Panels Using Hybrid Analytical/One-Dimensional Finite Ele-ment Method,” Proceedings of Inter-Noise 2006, Honolulu, HI, December 3–6.
[27] Kim, Y.-J., and Han, J. H., 2011, “Acoustical Characteristics of HoneycombSandwich Composite Panels,” 161st Meeting of the Acoustical Society ofAmerica, Seattle, WA, May 23–27.
[28] Denli, H., Sun, J. Q., and Chou, T. W., 2005, “Minimization of Acoustic Radia-tion From Composite Sandwich Beam Structures,” AIAA J., 43(11), pp.2337–2341.
[29] Denli, H, and Sun, J. Q., 2007, “Structural-Acoustic Optimization of SandwichStructures With Cellular Cores for Minimum Sound Radiation,” J. Sound Vib.,301, pp. 93–105.
[30] Denli, H., and Sun, J. Q., 2008, “Structural Acoustic Optimization of SandwichCylindrical Shells for Minimum Interior Sound Transmission,” J. Sound Vib.,316, pp. 32–49.
[31] Denli, H., and Sun, J. Q., 2008, “Optimization of Boundary Supports for SoundRadiation Reduction of Vibrating Structures,” ASME J. Vibr. Acoust., 130(1),p. 011007.
[32] Denli, H., and Sun, J. Q., 2007, “Structural-Acoustic Optimization ofComposite Sandwich Structures: A Review,” Shock Vib. Dig., 39(3), pp.189–200.
[33] Fahy, F., 1987, Sound and Structural Vibration, Academic, New York.[34] Soedel, W., 1993, Vibrations of Shells and Plates, Marcel Dekker, New York.[35] Williams, E. G., 1999, Fourier Acoustics: Sound Radiation and Nearfield
Acoustical Holography, Academic, London.[36] Williams, E. G., 1995, “Supersonic Acoustic Intensity,” J. Acoust. Soc. Am.,
97(1), pp. 121–127.
Journal of Vibration and Acoustics FEBRUARY 2013, Vol. 135 / 011006-11
Downloaded 04 Feb 2013 to 165.91.12.182. Redistribution subject to ASME license or copyright; see http://www.asme.org/terms/Terms_Use.cfm