Identification of accelerants, fuels and post...
7
Analyst PAPER Cite this: Analyst, 2015, 140, 5929 Received 24th April 2015, Accepted 15th July 2015 DOI: 10.1039/c5an00806a www.rsc.org/analyst Identification of accelerants, fuels and post-combustion residues using a colorimetric sensor array† Zheng Li, Minseok Jang, Jon R. Askim and Kenneth S. Suslick* A linear (1 × 36) colorimetric sensor array has been integrated with a pre-oxidation technique for detec- tion and identification of a variety of fuels and post-combustion residues. The pre-oxidation method permits the conversion of fuel vapor into more detectable species and therefore greatly enhances the sensitivity of the sensor array. The pre-oxidation technique used a packed tube of chromic acid on an oxide support and was optimized in terms of the support and concentration. Excellent batch to batch reproducibility was observed for preparation and use of the disposable pre-oxidation tubes. Twentyauto- motive fuels including gasolines and diesel from five gasoline retailers were individually identifiable with no confusions or misclassifications in quintuplicate trials. Limits of detection were at sub-ppm concen- trations for gasoline and diesel fuels. In addition, burning tests were performed on commonly used fire accelerants, and clear differentiation was achieved among both the fuels themselves and their volatile residues after burning. Introduction Fire incidents, both accidental and malicious, have become a pressing issue in modern life due to their threat to human life, property, and environmental safety. According to reports from the US Fire Administration, over 1.5 million fires occurred throughout the US in 2013 which caused over 3000 deaths, 17 000 injuries and $10 billion in property damage. 1 Automo- tive fuels and other petroleum products such as gasoline, diesel, and kerosene are commonly employed as accelerants in case of arson; rapid discrimination among accelerants is there- fore particularly important for fire scene investigation. 2–7 Additionally, the need for simple field-deployable quality control of automotive fuels has drawn great attention because of the negative effects caused by the adulteration of gasoline or diesel (e.g., engine damage and air pollution), 8,9 and the fuel oil industry has suffered from fraudulent mixing of low- priced reagents with higher-priced fuels. 10 Currently, the detection of fire accelerants is generally determined by standard analytical methods including electro- chemistry, 9,11 fluorescence, 12 Fourier transform infrared spec- troscopy (FTIR), 13–15 Raman spectroscopy, 2,16,17 GC 13,18 or GC– MS, 19–21 most of which demand non-portable and expensive instrumentation. Canine teams offer a more easily fielded approach for detecting accelerants in fire debris, though results are less reliable than traditional analytical methods as they are subject to human interpretation of a dog’s responses; in addition, training dogs requires substantial time and effort. 22 Some commercialized hydrocarbon gas analyzers can detect and quantify flammable accelerants by vapor sampling, but are unable to identify specifically which accelerant is present. 23,24 Numerous other detection methods still suffer from high cost, low sensitivity, lack of reproducibility, inter- ference from humidity, or changeable responses due to sensor aging. 25,26 For these reasons, the development a high-perform- ance portable sensor for the on-site analysis of fire accelerants or quality control of fuels remains an important goal. In the past decade, the use of disposable colorimetric sensor arrays (CSAs) has been developed for a variety of vapor analyses. 27–29 CSAs use strong chemical interactions between the analytes and a diverse set of cross-responsive chemo- responsive dyes; digital imaging of the arrays permits identifi- cation of a composite pattern of response as the “fingerprint” for a given odorant. 27–33 These arrays take advantage of plasti- cized films or organically modified siloxanes (ormosils) as matrices for colorants whose color changes are affected by polarity/dipolarity, Brønsted and Lewis acid–base interactions, redox reactions, and π–π interactions. 27–29 Although colorimetric sensor arrays perform well for a variety of gases and volatile liquids, 34–36 they have not shown high sensitivity to less-reactive analytes, such as aliphatic and † Electronic supplementary information (ESI) available. See DOI: 10.1039/ c5an00806a Department of Chemistry, University of Illinois at Urbana-Champaign, 600 South Mathews Avenue, Urbana, Illinois 61801, USA. E-mail: [email protected] This journal is © The Royal Society of Chemistry 2015 Analyst, 2015, 140, 5929–5935 | 5929 Published on 28 July 2015. Downloaded by University of Illinois - Urbana on 19/01/2016 20:13:57. View Article Online View Journal | View Issue
Transcript of Identification of accelerants, fuels and post...
Analyst
PAPER
Cite this: Analyst, 2015, 140, 5929
Received 24th April 2015,Accepted 15th July 2015
DOI: 10.1039/c5an00806a
www.rsc.org/analyst
Identification of accelerants, fuels andpost-combustion residues using a colorimetricsensor array†
Zheng Li, Minseok Jang, Jon R. Askim and Kenneth S. Suslick*
A linear (1 × 36) colorimetric sensor array has been integrated with a pre-oxidation technique for detec-
tion and identification of a variety of fuels and post-combustion residues. The pre-oxidation method
permits the conversion of fuel vapor into more detectable species and therefore greatly enhances the
sensitivity of the sensor array. The pre-oxidation technique used a packed tube of chromic acid on an
oxide support and was optimized in terms of the support and concentration. Excellent batch to batch
reproducibility was observed for preparation and use of the disposable pre-oxidation tubes. Twenty auto-
motive fuels including gasolines and diesel from five gasoline retailers were individually identifiable with
no confusions or misclassifications in quintuplicate trials. Limits of detection were at sub-ppm concen-
trations for gasoline and diesel fuels. In addition, burning tests were performed on commonly used fire
accelerants, and clear differentiation was achieved among both the fuels themselves and their volatile
residues after burning.
Introduction
Fire incidents, both accidental and malicious, have become apressing issue in modern life due to their threat to human life,property, and environmental safety. According to reports fromthe US Fire Administration, over 1.5 million fires occurredthroughout the US in 2013 which caused over 3000 deaths,17 000 injuries and $10 billion in property damage.1 Automo-tive fuels and other petroleum products such as gasoline,diesel, and kerosene are commonly employed as accelerants incase of arson; rapid discrimination among accelerants is there-fore particularly important for fire scene investigation.2–7
Additionally, the need for simple field-deployable qualitycontrol of automotive fuels has drawn great attention becauseof the negative effects caused by the adulteration of gasolineor diesel (e.g., engine damage and air pollution),8,9 and thefuel oil industry has suffered from fraudulent mixing of low-priced reagents with higher-priced fuels.10
Currently, the detection of fire accelerants is generallydetermined by standard analytical methods including electro-chemistry,9,11 fluorescence,12 Fourier transform infrared spec-troscopy (FTIR),13–15 Raman spectroscopy,2,16,17 GC13,18 or GC–MS,19–21 most of which demand non-portable and expensive
instrumentation. Canine teams offer a more easily fieldedapproach for detecting accelerants in fire debris, thoughresults are less reliable than traditional analytical methods asthey are subject to human interpretation of a dog’s responses;in addition, training dogs requires substantial time andeffort.22 Some commercialized hydrocarbon gas analyzers candetect and quantify flammable accelerants by vapor sampling,but are unable to identify specifically which accelerant ispresent.23,24 Numerous other detection methods still sufferfrom high cost, low sensitivity, lack of reproducibility, inter-ference from humidity, or changeable responses due to sensoraging.25,26 For these reasons, the development a high-perform-ance portable sensor for the on-site analysis of fire accelerantsor quality control of fuels remains an important goal.
In the past decade, the use of disposable colorimetricsensor arrays (CSAs) has been developed for a variety of vaporanalyses.27–29 CSAs use strong chemical interactions betweenthe analytes and a diverse set of cross-responsive chemo-responsive dyes; digital imaging of the arrays permits identifi-cation of a composite pattern of response as the “fingerprint”for a given odorant.27–33 These arrays take advantage of plasti-cized films or organically modified siloxanes (ormosils) asmatrices for colorants whose color changes are affected bypolarity/dipolarity, Brønsted and Lewis acid–base interactions,redox reactions, and π–π interactions.27–29
Although colorimetric sensor arrays perform well for avariety of gases and volatile liquids,34–36 they have not shownhigh sensitivity to less-reactive analytes, such as aliphatic and
†Electronic supplementary information (ESI) available. See DOI: 10.1039/c5an00806a
Department of Chemistry, University of Illinois at Urbana-Champaign, 600 South
Mathews Avenue, Urbana, Illinois 61801, USA. E-mail: [email protected]
This journal is © The Royal Society of Chemistry 2015 Analyst, 2015, 140, 5929–5935 | 5929
Publ
ishe
d on
28
July
201
5. D
ownl
oade
d by
Uni
vers
ity o
f Il
linoi
s -
Urb
ana
on 1
9/01
/201
6 20
:13:
57.
View Article OnlineView Journal | View Issue
aromatic hydrocarbons or halocarbons.30,37 A typical gasolineconsists of 30–50% alkanes, 5–10% alkenes and 20–40% aro-matics and therefore does not respond to a sensor arraydesigned for strong chemical interactions. We have previouslyshown that substantial improvements in the detection, identifi-cation, and quantitation of less-reactive volatiles can be madeby employing a pre-treatment technique in which the analytegas stream is subjected to partial oxidation and thus convertedinto more easily detected oxidation products (e.g., aldehydesand carboxylic acids).37 We demonstrate here that this tech-nique can be extended for the identification of complex fuelmixtures and have examined discrimination among a largenumber of commercial fuels, differentiating among both thefuels themselves and their volatile residues after burning.
ExperimentalChemicals and materials
For the gasolines used in these experiments, we provide theirbrand name and average octane number (ON = (R + M)/2, whereR is the research octane number and M is the motor octanenumber).38 Three different grades of gasoline (i.e., regular,ON87; plus, ON89; and premium, ON93) and diesel fuel werepurchased from five local gasoline distributors (i.e., Mobil, Mara-thon, Shell, BP and Schnucks). Ethanol, i-propanol, kerosene,mineral oil, aluminum oxides (Brockmann I, Sigma-Aldrich),silica gels (Davisil, Sigma-Aldrich) and all other reagents were ofanalytical-reagent grade and used without further purificationunless otherwise specified. Lubricant (WD-40 type 110071), vege-table oil (Great Value) and nylon carpet (Guardian, platinumseries) were purchased from a local supermarket.
Formulations, preparation and sensor array printing
Sol–gel pigments were prepared as previously described.39,40
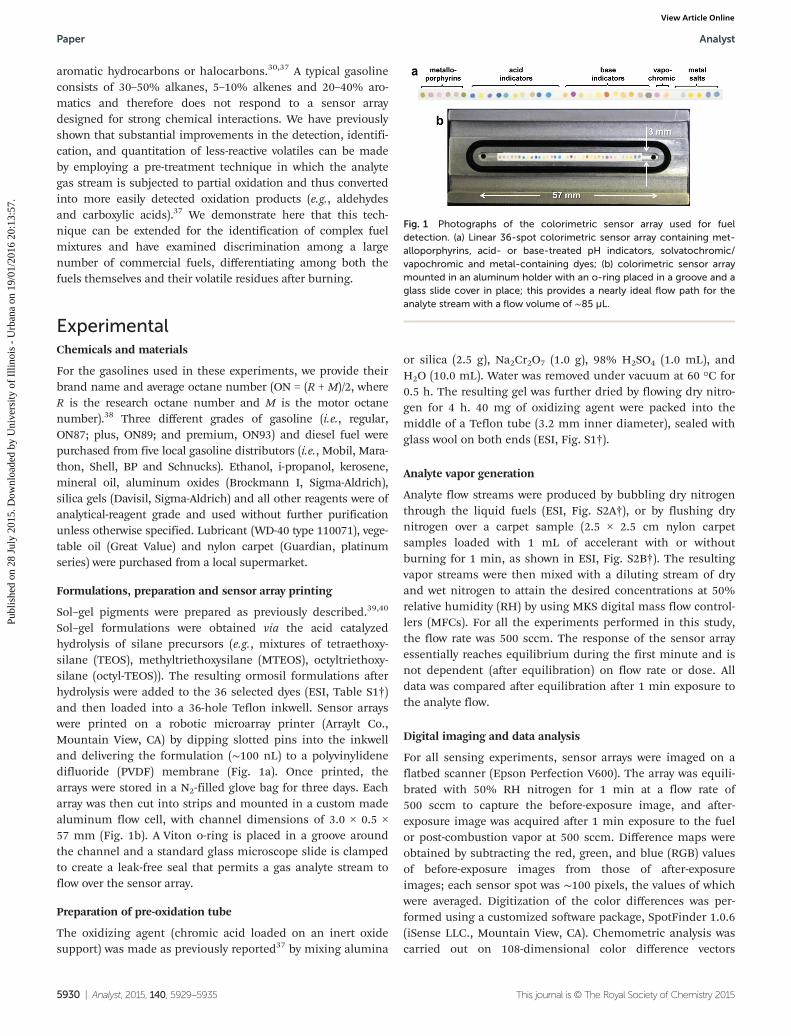
Sol–gel formulations were obtained via the acid catalyzedhydrolysis of silane precursors (e.g., mixtures of tetraethoxy-silane (TEOS), methyltriethoxysilane (MTEOS), octyltriethoxy-silane (octyl-TEOS)). The resulting ormosil formulations afterhydrolysis were added to the 36 selected dyes (ESI, Table S1†)and then loaded into a 36-hole Teflon inkwell. Sensor arrayswere printed on a robotic microarray printer (Arraylt Co.,Mountain View, CA) by dipping slotted pins into the inkwelland delivering the formulation (∼100 nL) to a polyvinylidenedifluoride (PVDF) membrane (Fig. 1a). Once printed, thearrays were stored in a N2-filled glove bag for three days. Eacharray was then cut into strips and mounted in a custom madealuminum flow cell, with channel dimensions of 3.0 × 0.5 ×57 mm (Fig. 1b). A Viton o-ring is placed in a groove aroundthe channel and a standard glass microscope slide is clampedto create a leak-free seal that permits a gas analyte stream toflow over the sensor array.
Preparation of pre-oxidation tube
The oxidizing agent (chromic acid loaded on an inert oxidesupport) was made as previously reported37 by mixing alumina
or silica (2.5 g), Na2Cr2O7 (1.0 g), 98% H2SO4 (1.0 mL), andH2O (10.0 mL). Water was removed under vacuum at 60 °C for0.5 h. The resulting gel was further dried by flowing dry nitro-gen for 4 h. 40 mg of oxidizing agent were packed into themiddle of a Teflon tube (3.2 mm inner diameter), sealed withglass wool on both ends (ESI, Fig. S1†).
Analyte vapor generation
Analyte flow streams were produced by bubbling dry nitrogenthrough the liquid fuels (ESI, Fig. S2A†), or by flushing drynitrogen over a carpet sample (2.5 × 2.5 cm nylon carpetsamples loaded with 1 mL of accelerant with or withoutburning for 1 min, as shown in ESI, Fig. S2B†). The resultingvapor streams were then mixed with a diluting stream of dryand wet nitrogen to attain the desired concentrations at 50%relative humidity (RH) by using MKS digital mass flow control-lers (MFCs). For all the experiments performed in this study,the flow rate was 500 sccm. The response of the sensor arrayessentially reaches equilibrium during the first minute and isnot dependent (after equilibration) on flow rate or dose. Alldata was compared after equilibration after 1 min exposure tothe analyte flow.
Digital imaging and data analysis
For all sensing experiments, sensor arrays were imaged on aflatbed scanner (Epson Perfection V600). The array was equili-brated with 50% RH nitrogen for 1 min at a flow rate of500 sccm to capture the before-exposure image, and after-exposure image was acquired after 1 min exposure to the fuelor post-combustion vapor at 500 sccm. Difference maps wereobtained by subtracting the red, green, and blue (RGB) valuesof before-exposure images from those of after-exposureimages; each sensor spot was ∼100 pixels, the values of whichwere averaged. Digitization of the color differences was per-formed using a customized software package, SpotFinder 1.0.6(iSense LLC., Mountain View, CA). Chemometric analysis wascarried out on 108-dimensional color difference vectors
Fig. 1 Photographs of the colorimetric sensor array used for fueldetection. (a) Linear 36-spot colorimetric sensor array containing met-alloporphyrins, acid- or base-treated pH indicators, solvatochromic/vapochromic and metal-containing dyes; (b) colorimetric sensor arraymounted in an aluminum holder with an o-ring placed in a groove and aglass slide cover in place; this provides a nearly ideal flow path for theanalyte stream with a flow volume of ∼85 µL.
Paper Analyst
5930 | Analyst, 2015, 140, 5929–5935 This journal is © The Royal Society of Chemistry 2015
Publ
ishe
d on
28
July
201
5. D
ownl
oade
d by
Uni
vers
ity o
f Il
linoi
s -
Urb
ana
on 1
9/01
/201
6 20
:13:
57.
View Article Online
(36 sets of ΔR, ΔG and ΔB values) using Multi-Variate Statisti-cal Package™ (MVSP v.3.1, Kovach Computing); minimum var-iance (i.e., “Ward’s Method”) was used for hierarchical clusteranalysis (HCA) in all cases. The full digital database of sensorarray responses is provided in the ESI (Tables S2, S3 and S4†).
Results and discussion
The chemical basis for discrimination among fuels is ofcourse due to differences in their chemical composition. Forgasolines and other complex fuel mixtures, there are threesources of such differences: (1) there are gross distinctions incomposition between gasoline and diesel fuels (gasolinescontain hydrocarbons that are generally lower molecularweight and more volatile); (2) composition depends on octanerating values (a relative measure of anti-knocking properties),which are sensitive to the concentrations of aromatic hydrocar-bons or alcohols; and (3) each brand of gasoline has specificadditives to the base gasoline that are brand specific andtreated as trade secrets.
Optimization of pre-oxidation method
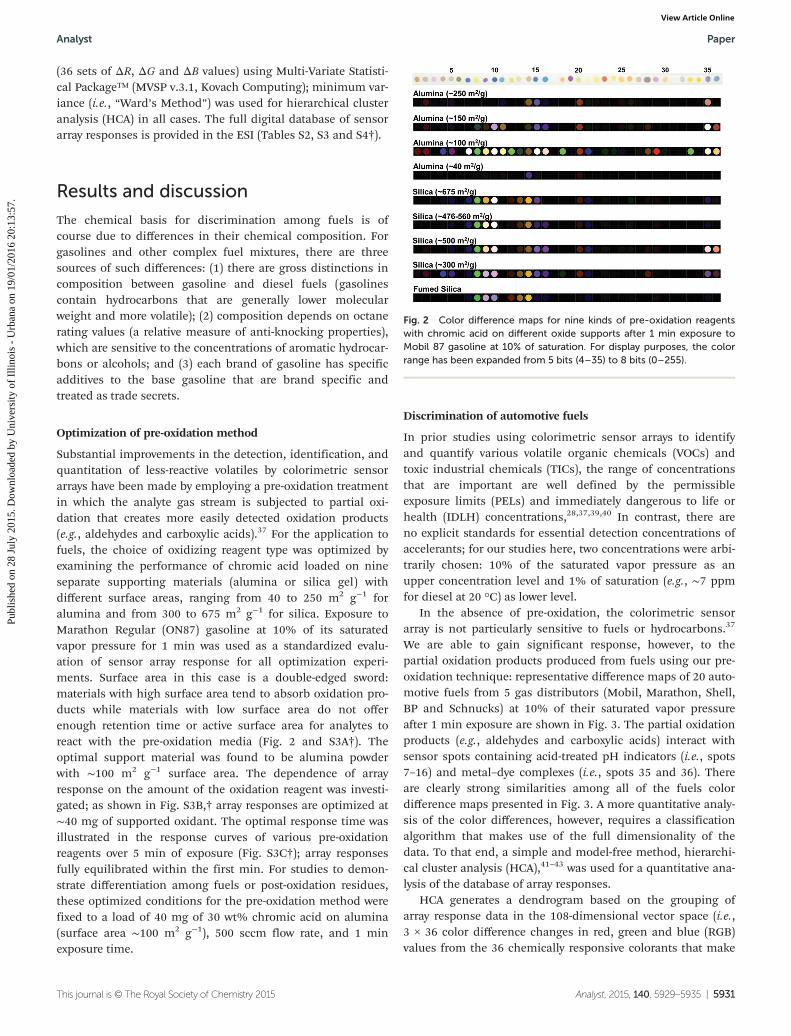
Substantial improvements in the detection, identification, andquantitation of less-reactive volatiles by colorimetric sensorarrays have been made by employing a pre-oxidation treatmentin which the analyte gas stream is subjected to partial oxi-dation that creates more easily detected oxidation products(e.g., aldehydes and carboxylic acids).37 For the application tofuels, the choice of oxidizing reagent type was optimized byexamining the performance of chromic acid loaded on nineseparate supporting materials (alumina or silica gel) withdifferent surface areas, ranging from 40 to 250 m2 g−1 foralumina and from 300 to 675 m2 g−1 for silica. Exposure toMarathon Regular (ON87) gasoline at 10% of its saturatedvapor pressure for 1 min was used as a standardized evalu-ation of sensor array response for all optimization experi-ments. Surface area in this case is a double-edged sword:materials with high surface area tend to absorb oxidation pro-ducts while materials with low surface area do not offerenough retention time or active surface area for analytes toreact with the pre-oxidation media (Fig. 2 and S3A†). Theoptimal support material was found to be alumina powderwith ∼100 m2 g−1 surface area. The dependence of arrayresponse on the amount of the oxidation reagent was investi-gated; as shown in Fig. S3B,† array responses are optimized at∼40 mg of supported oxidant. The optimal response time wasillustrated in the response curves of various pre-oxidationreagents over 5 min of exposure (Fig. S3C†); array responsesfully equilibrated within the first min. For studies to demon-strate differentiation among fuels or post-oxidation residues,these optimized conditions for the pre-oxidation method werefixed to a load of 40 mg of 30 wt% chromic acid on alumina(surface area ∼100 m2 g−1), 500 sccm flow rate, and 1 minexposure time.
Discrimination of automotive fuels
In prior studies using colorimetric sensor arrays to identifyand quantify various volatile organic chemicals (VOCs) andtoxic industrial chemicals (TICs), the range of concentrationsthat are important are well defined by the permissibleexposure limits (PELs) and immediately dangerous to life orhealth (IDLH) concentrations,28,37,39,40 In contrast, there areno explicit standards for essential detection concentrations ofaccelerants; for our studies here, two concentrations were arbi-trarily chosen: 10% of the saturated vapor pressure as anupper concentration level and 1% of saturation (e.g., ∼7 ppmfor diesel at 20 °C) as lower level.
In the absence of pre-oxidation, the colorimetric sensorarray is not particularly sensitive to fuels or hydrocarbons.37
We are able to gain significant response, however, to thepartial oxidation products produced from fuels using our pre-oxidation technique: representative difference maps of 20 auto-motive fuels from 5 gas distributors (Mobil, Marathon, Shell,BP and Schnucks) at 10% of their saturated vapor pressureafter 1 min exposure are shown in Fig. 3. The partial oxidationproducts (e.g., aldehydes and carboxylic acids) interact withsensor spots containing acid-treated pH indicators (i.e., spots7–16) and metal–dye complexes (i.e., spots 35 and 36). Thereare clearly strong similarities among all of the fuels colordifference maps presented in Fig. 3. A more quantitative analy-sis of the color differences, however, requires a classificationalgorithm that makes use of the full dimensionality of thedata. To that end, a simple and model-free method, hierarchi-cal cluster analysis (HCA),41–43 was used for a quantitative ana-lysis of the database of array responses.
HCA generates a dendrogram based on the grouping ofarray response data in the 108-dimensional vector space (i.e.,3 × 36 color difference changes in red, green and blue (RGB)values from the 36 chemically responsive colorants that make
Fig. 2 Color difference maps for nine kinds of pre-oxidation reagentswith chromic acid on different oxide supports after 1 min exposure toMobil 87 gasoline at 10% of saturation. For display purposes, the colorrange has been expanded from 5 bits (4–35) to 8 bits (0–255).
Analyst Paper
This journal is © The Royal Society of Chemistry 2015 Analyst, 2015, 140, 5929–5935 | 5931
Publ
ishe
d on
28
July
201
5. D
ownl
oade
d by
Uni
vers
ity o
f Il
linoi
s -
Urb
ana
on 1
9/01
/201
6 20
:13:
57.
View Article Online
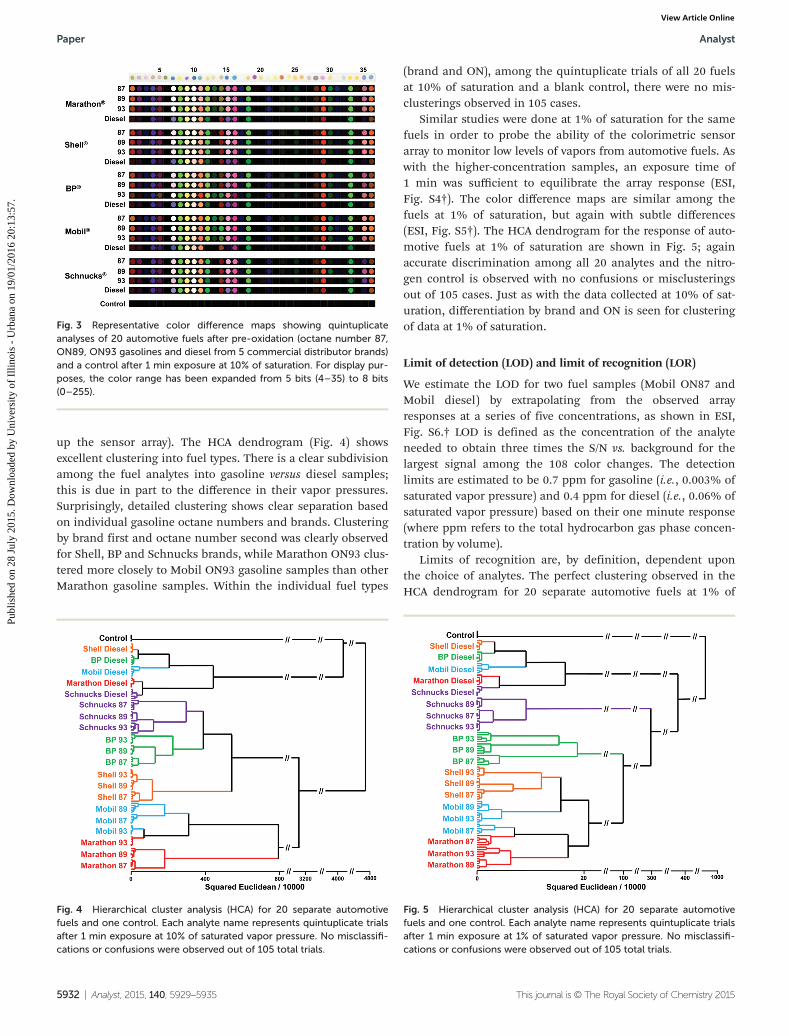
up the sensor array). The HCA dendrogram (Fig. 4) showsexcellent clustering into fuel types. There is a clear subdivisionamong the fuel analytes into gasoline versus diesel samples;this is due in part to the difference in their vapor pressures.Surprisingly, detailed clustering shows clear separation basedon individual gasoline octane numbers and brands. Clusteringby brand first and octane number second was clearly observedfor Shell, BP and Schnucks brands, while Marathon ON93 clus-tered more closely to Mobil ON93 gasoline samples than otherMarathon gasoline samples. Within the individual fuel types
(brand and ON), among the quintuplicate trials of all 20 fuelsat 10% of saturation and a blank control, there were no mis-clusterings observed in 105 cases.
Similar studies were done at 1% of saturation for the samefuels in order to probe the ability of the colorimetric sensorarray to monitor low levels of vapors from automotive fuels. Aswith the higher-concentration samples, an exposure time of1 min was sufficient to equilibrate the array response (ESI,Fig. S4†). The color difference maps are similar among thefuels at 1% of saturation, but again with subtle differences(ESI, Fig. S5†). The HCA dendrogram for the response of auto-motive fuels at 1% of saturation are shown in Fig. 5; againaccurate discrimination among all 20 analytes and the nitro-gen control is observed with no confusions or misclusteringsout of 105 cases. Just as with the data collected at 10% of sat-uration, differentiation by brand and ON is seen for clusteringof data at 1% of saturation.
Limit of detection (LOD) and limit of recognition (LOR)
We estimate the LOD for two fuel samples (Mobil ON87 andMobil diesel) by extrapolating from the observed arrayresponses at a series of five concentrations, as shown in ESI,Fig. S6.† LOD is defined as the concentration of the analyteneeded to obtain three times the S/N vs. background for thelargest signal among the 108 color changes. The detectionlimits are estimated to be 0.7 ppm for gasoline (i.e., 0.003% ofsaturated vapor pressure) and 0.4 ppm for diesel (i.e., 0.06% ofsaturated vapor pressure) based on their one minute response(where ppm refers to the total hydrocarbon gas phase concen-tration by volume).
Limits of recognition are, by definition, dependent uponthe choice of analytes. The perfect clustering observed in theHCA dendrogram for 20 separate automotive fuels at 1% of
Fig. 3 Representative color difference maps showing quintuplicateanalyses of 20 automotive fuels after pre-oxidation (octane number 87,ON89, ON93 gasolines and diesel from 5 commercial distributor brands)and a control after 1 min exposure at 10% of saturation. For display pur-poses, the color range has been expanded from 5 bits (4–35) to 8 bits(0–255).
Fig. 4 Hierarchical cluster analysis (HCA) for 20 separate automotivefuels and one control. Each analyte name represents quintuplicate trialsafter 1 min exposure at 10% of saturated vapor pressure. No misclassifi-cations or confusions were observed out of 105 total trials.
Fig. 5 Hierarchical cluster analysis (HCA) for 20 separate automotivefuels and one control. Each analyte name represents quintuplicate trialsafter 1 min exposure at 1% of saturated vapor pressure. No misclassifi-cations or confusions were observed out of 105 total trials.
Paper Analyst
5932 | Analyst, 2015, 140, 5929–5935 This journal is © The Royal Society of Chemistry 2015
Publ
ishe
d on
28
July
201
5. D
ownl
oade
d by
Uni
vers
ity o
f Il
linoi
s -
Urb
ana
on 1
9/01
/201
6 20
:13:
57.
View Article Online
their saturated vapor pressure and one control, as shown inFig. 5, establishes that our limits of recognition, for these ana-lytes, are well below those concentrations (e.g., roughly250 ppm for gasolines and 7 ppm for diesel).
Detection of pre- or post-combustion residues
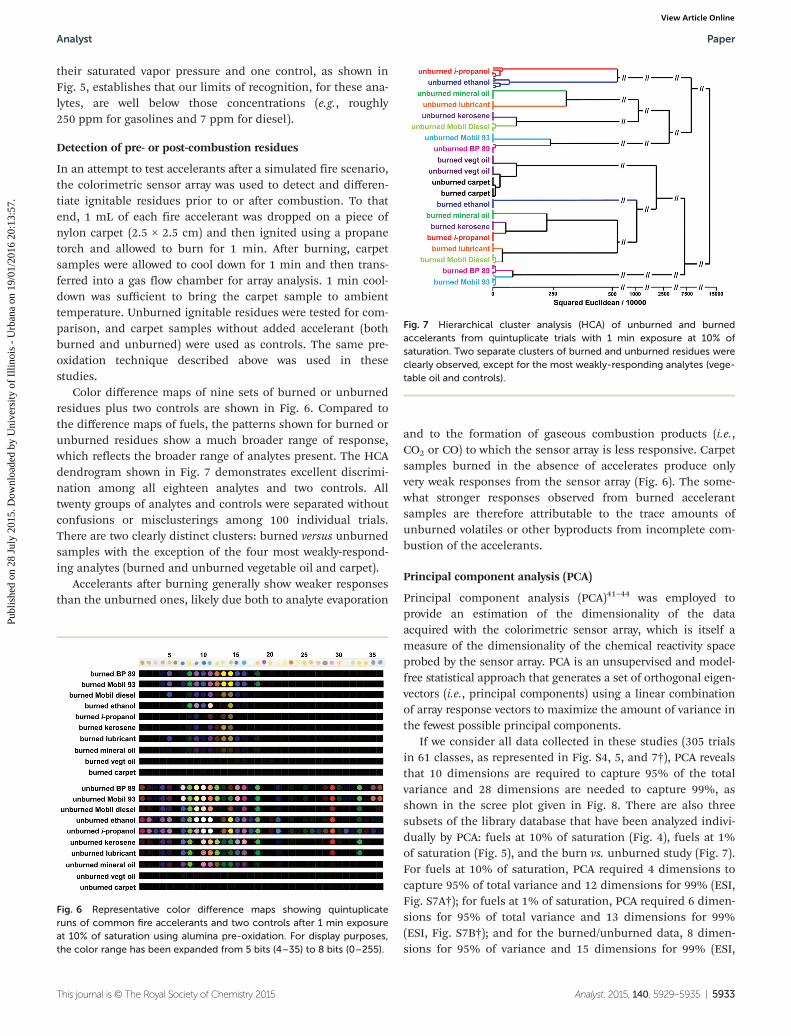
In an attempt to test accelerants after a simulated fire scenario,the colorimetric sensor array was used to detect and differen-tiate ignitable residues prior to or after combustion. To thatend, 1 mL of each fire accelerant was dropped on a piece ofnylon carpet (2.5 × 2.5 cm) and then ignited using a propanetorch and allowed to burn for 1 min. After burning, carpetsamples were allowed to cool down for 1 min and then trans-ferred into a gas flow chamber for array analysis. 1 min cool-down was sufficient to bring the carpet sample to ambienttemperature. Unburned ignitable residues were tested for com-parison, and carpet samples without added accelerant (bothburned and unburned) were used as controls. The same pre-oxidation technique described above was used in thesestudies.
Color difference maps of nine sets of burned or unburnedresidues plus two controls are shown in Fig. 6. Compared tothe difference maps of fuels, the patterns shown for burned orunburned residues show a much broader range of response,which reflects the broader range of analytes present. The HCAdendrogram shown in Fig. 7 demonstrates excellent discrimi-nation among all eighteen analytes and two controls. Alltwenty groups of analytes and controls were separated withoutconfusions or misclusterings among 100 individual trials.There are two clearly distinct clusters: burned versus unburnedsamples with the exception of the four most weakly-respond-ing analytes (burned and unburned vegetable oil and carpet).
Accelerants after burning generally show weaker responsesthan the unburned ones, likely due both to analyte evaporation
and to the formation of gaseous combustion products (i.e.,CO2 or CO) to which the sensor array is less responsive. Carpetsamples burned in the absence of accelerates produce onlyvery weak responses from the sensor array (Fig. 6). The some-what stronger responses observed from burned accelerantsamples are therefore attributable to the trace amounts ofunburned volatiles or other byproducts from incomplete com-bustion of the accelerants.
Principal component analysis (PCA)
Principal component analysis (PCA)41–44 was employed toprovide an estimation of the dimensionality of the dataacquired with the colorimetric sensor array, which is itself ameasure of the dimensionality of the chemical reactivity spaceprobed by the sensor array. PCA is an unsupervised and model-free statistical approach that generates a set of orthogonal eigen-vectors (i.e., principal components) using a linear combinationof array response vectors to maximize the amount of variance inthe fewest possible principal components.
If we consider all data collected in these studies (305 trialsin 61 classes, as represented in Fig. S4, 5, and 7†), PCA revealsthat 10 dimensions are required to capture 95% of the totalvariance and 28 dimensions are needed to capture 99%, asshown in the scree plot given in Fig. 8. There are also threesubsets of the library database that have been analyzed indivi-dually by PCA: fuels at 10% of saturation (Fig. 4), fuels at 1%of saturation (Fig. 5), and the burn vs. unburned study (Fig. 7).For fuels at 10% of saturation, PCA required 4 dimensions tocapture 95% of total variance and 12 dimensions for 99% (ESI,Fig. S7A†); for fuels at 1% of saturation, PCA required 6 dimen-sions for 95% of total variance and 13 dimensions for 99%(ESI, Fig. S7B†); and for the burned/unburned data, 8 dimen-sions for 95% of variance and 15 dimensions for 99% (ESI,
Fig. 6 Representative color difference maps showing quintuplicateruns of common fire accelerants and two controls after 1 min exposureat 10% of saturation using alumina pre-oxidation. For display purposes,the color range has been expanded from 5 bits (4–35) to 8 bits (0–255).
Fig. 7 Hierarchical cluster analysis (HCA) of unburned and burnedaccelerants from quintuplicate trials with 1 min exposure at 10% ofsaturation. Two separate clusters of burned and unburned residues wereclearly observed, except for the most weakly-responding analytes (vege-table oil and controls).
Analyst Paper
This journal is © The Royal Society of Chemistry 2015 Analyst, 2015, 140, 5929–5935 | 5933
Publ
ishe
d on
28
July
201
5. D
ownl
oade
d by
Uni
vers
ity o
f Il
linoi
s -
Urb
ana
on 1
9/01
/201
6 20
:13:
57.
View Article Online
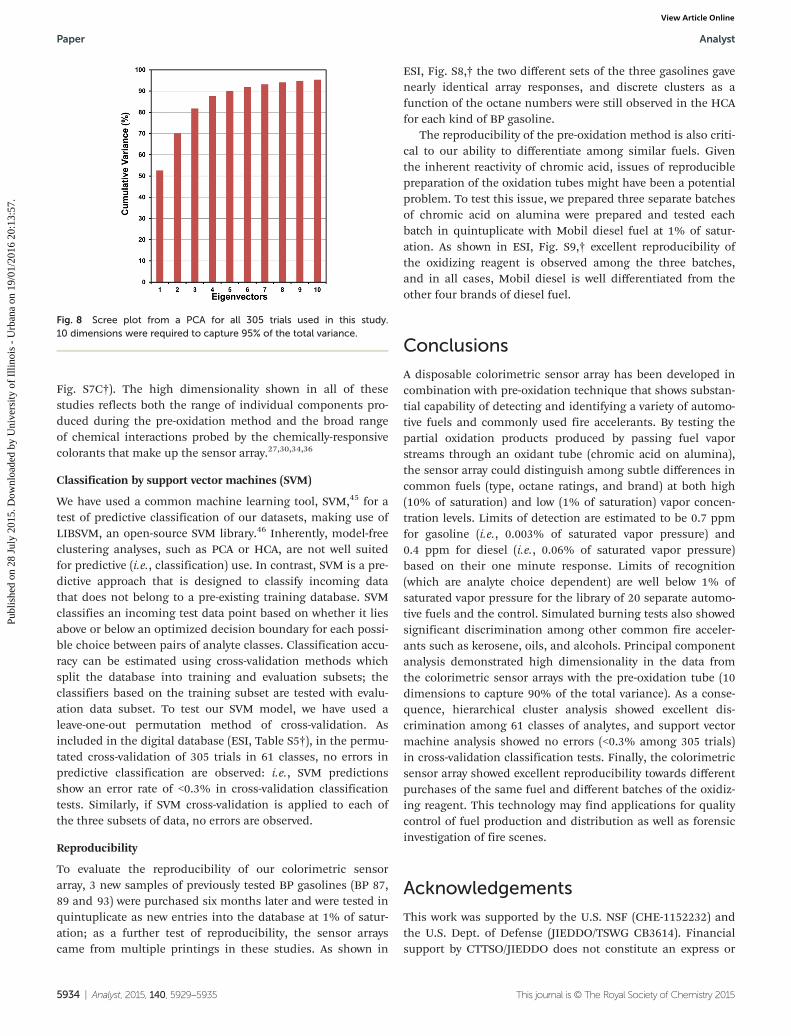
Fig. S7C†). The high dimensionality shown in all of thesestudies reflects both the range of individual components pro-duced during the pre-oxidation method and the broad rangeof chemical interactions probed by the chemically-responsivecolorants that make up the sensor array.27,30,34,36
Classification by support vector machines (SVM)
We have used a common machine learning tool, SVM,45 for atest of predictive classification of our datasets, making use ofLIBSVM, an open-source SVM library.46 Inherently, model-freeclustering analyses, such as PCA or HCA, are not well suitedfor predictive (i.e., classification) use. In contrast, SVM is a pre-dictive approach that is designed to classify incoming datathat does not belong to a pre-existing training database. SVMclassifies an incoming test data point based on whether it liesabove or below an optimized decision boundary for each possi-ble choice between pairs of analyte classes. Classification accu-racy can be estimated using cross-validation methods whichsplit the database into training and evaluation subsets; theclassifiers based on the training subset are tested with evalu-ation data subset. To test our SVM model, we have used aleave-one-out permutation method of cross-validation. Asincluded in the digital database (ESI, Table S5†), in the permu-tated cross-validation of 305 trials in 61 classes, no errors inpredictive classification are observed: i.e., SVM predictionsshow an error rate of <0.3% in cross-validation classificationtests. Similarly, if SVM cross-validation is applied to each ofthe three subsets of data, no errors are observed.
Reproducibility
To evaluate the reproducibility of our colorimetric sensorarray, 3 new samples of previously tested BP gasolines (BP 87,89 and 93) were purchased six months later and were tested inquintuplicate as new entries into the database at 1% of satur-ation; as a further test of reproducibility, the sensor arrayscame from multiple printings in these studies. As shown in
ESI, Fig. S8,† the two different sets of the three gasolines gavenearly identical array responses, and discrete clusters as afunction of the octane numbers were still observed in the HCAfor each kind of BP gasoline.
The reproducibility of the pre-oxidation method is also criti-cal to our ability to differentiate among similar fuels. Giventhe inherent reactivity of chromic acid, issues of reproduciblepreparation of the oxidation tubes might have been a potentialproblem. To test this issue, we prepared three separate batchesof chromic acid on alumina were prepared and tested eachbatch in quintuplicate with Mobil diesel fuel at 1% of satur-ation. As shown in ESI, Fig. S9,† excellent reproducibility ofthe oxidizing reagent is observed among the three batches,and in all cases, Mobil diesel is well differentiated from theother four brands of diesel fuel.
Conclusions
A disposable colorimetric sensor array has been developed incombination with pre-oxidation technique that shows substan-tial capability of detecting and identifying a variety of automo-tive fuels and commonly used fire accelerants. By testing thepartial oxidation products produced by passing fuel vaporstreams through an oxidant tube (chromic acid on alumina),the sensor array could distinguish among subtle differences incommon fuels (type, octane ratings, and brand) at both high(10% of saturation) and low (1% of saturation) vapor concen-tration levels. Limits of detection are estimated to be 0.7 ppmfor gasoline (i.e., 0.003% of saturated vapor pressure) and0.4 ppm for diesel (i.e., 0.06% of saturated vapor pressure)based on their one minute response. Limits of recognition(which are analyte choice dependent) are well below 1% ofsaturated vapor pressure for the library of 20 separate automo-tive fuels and the control. Simulated burning tests also showedsignificant discrimination among other common fire acceler-ants such as kerosene, oils, and alcohols. Principal componentanalysis demonstrated high dimensionality in the data fromthe colorimetric sensor arrays with the pre-oxidation tube (10dimensions to capture 90% of the total variance). As a conse-quence, hierarchical cluster analysis showed excellent dis-crimination among 61 classes of analytes, and support vectormachine analysis showed no errors (<0.3% among 305 trials)in cross-validation classification tests. Finally, the colorimetricsensor array showed excellent reproducibility towards differentpurchases of the same fuel and different batches of the oxidiz-ing reagent. This technology may find applications for qualitycontrol of fuel production and distribution as well as forensicinvestigation of fire scenes.
Acknowledgements
This work was supported by the U.S. NSF (CHE-1152232) andthe U.S. Dept. of Defense (JIEDDO/TSWG CB3614). Financialsupport by CTTSO/JIEDDO does not constitute an express or
Fig. 8 Scree plot from a PCA for all 305 trials used in this study.10 dimensions were required to capture 95% of the total variance.
Paper Analyst
5934 | Analyst, 2015, 140, 5929–5935 This journal is © The Royal Society of Chemistry 2015
Publ
ishe
d on
28
July
201
5. D
ownl
oade
d by
Uni
vers
ity o
f Il
linoi
s -
Urb
ana
on 1
9/01
/201
6 20
:13:
57.
View Article Online
implied endorsement of the results or conclusions of theproject by either CTTSO/JIEDDO or the U.S. Dept. of Defense.
Notes and references
1 U.S. Fire Administration, http://www.usfa.fema.gov/data/statistics accessed 04/10/2015.
2 K. M. Tan, I. Barman, N. C. Dingari, G. P. Singh, T. F. Chiaand W. L. Tok, Anal. Chem., 2012, 85, 1846–1851.
3 P. M. L. Sandercock, Forensic Sci. Int., 2008, 176, 93–110.4 S. Zhuiykov, Sens. Actuators, A, 2008, 141, 89–96.5 N. D. K. Petraco, M. Gil, P. A. Pizzola and T. A. Kubic,
J. Forensic Sci., 2008, 53, 1092–1101.6 T. A. Brettell, J. M. Butler and J. R. Almirall, Anal. Chem.,
2011, 83, 4539–4556.7 P. Vergeer, A. Bolck, L. J. C. Peschier, C. E. H. Berger and
J. N. Hendrikse, Sci. Justice, 2014, 54, 401–411.8 T. Sobański, A. Szczurek, K. Nitsch, B. W. Licznerski and
W. Radwan, Sens. Actuators, B, 2006, 116, 207–212.9 L. Bueno and T. R. L. C. Paixão, Talanta, 2011, 87, 210–215.10 S. Suwanprasop, T. Nhujak, S. Roengsumran and
A. Petsom, Ind. Eng. Chem. Res., 2004, 43, 4973–4978.11 N. K. L. Wiziack, A. Catini, M. Santonico, A. D’Amico,
R. Paolesse, L. G. Paterno, F. J. Fonseca and C. Di Natale,Sens. Actuators, B, 2009, 140, 508–513.
12 M. J. Aernecke and D. R. Walt, J. Forensic Sci., 2010, 55,178–184.
13 E. Scorsone, A. M. Pisanelli and K. C. Persaud, Sens. Actua-tors, B, 2006, 116, 55–61.
14 M. A. Al-Ghouti, Y. S. Al-Degs and M. Amer, Talanta, 2008,76, 1105–1112.
15 J. W. Diehl, J. W. Finkbeiner and F. P. DiSanzo, Anal.Chem., 1995, 67, 2015–2019.
16 M. Ahmadjian and C. W. Brown, Anal. Chem., 1976, 48,1257–1259.
17 J. B. Cooper, K. L. Wise, J. Groves and W. T. Welch, Anal.Chem., 1995, 67, 4096–4100.
18 M. E. Sigman, M. R. Williams and R. G. Ivy, Anal. Chem.,2007, 79, 3462–3468.
19 Y. Lu and P. B. Harrington, Anal. Chem., 2007, 79, 6752–6759.
20 M. Monfreda and A. Gregori, J. Forensic Sci., 2011, 56, 372–380.
21 N. A. Sinkov, P. M. L. Sandercock and J. J. Harynuk, ForensicSci. Int., 2014, 235, 24–31.
22 M. E. Kurz, S. Schultz, J. Griffith, K. Broadus, J. Sparks andG. Dabdoub, J. Forensic Sci., 1996, 41, 868–873.
23 M. D. Goldthorp and P. Lambert, J. Hazard. Mater., 2001,83, 135–152.
24 K.-H. Kim and R. Pal, Sens. Actuators, B, 2008, 134, 832–838.
25 F. Röck, N. Barsan and U. Weimar, Chem. Rev., 2008, 108,705–725.
26 R. A. Potyrailo, C. Surman, N. Nagraj and A. Burns, Chem.Rev., 2011, 111, 7315–7354.
27 J. R. Askim, M. Mahmoudi and K. S. Suslick, Chem. Soc.Rev., 2013, 42, 8649–8682.
28 S. H. Lim, L. Feng, J. W. Kemling, C. J. Musto andK. S. Suslick, Nat. Chem., 2009, 1, 562–567.
29 K. S. Suslick, MRS Bull., 2004, 29, 720–725.30 M. C. Janzen, J. B. Ponder, D. P. Bailey, C. K. Ingison and
K. S. Suslick, Anal. Chem., 2006, 78, 3591–3600.31 M. K. LaGasse, J. M. Rankin, J. R. Askim and K. S. Suslick,
Sens. Actuators, B, 2014, 197, 116–122.32 N. A. Rakow and K. S. Suslick, Nature, 2000, 406, 710–714.33 J. W. Kemling, A. J. Qavi, R. C. Bailey and K. S. Suslick,
J. Phys. Chem. Lett., 2011, 2, 2934–2944.34 B. A. Suslick, L. Feng and K. S. Suslick, Anal. Chem., 2010,
82, 2067–2073.35 C. Zhang and K. S. Suslick, J. Agric. Food Chem., 2007, 55,
237–242.36 J. R. Carey, K. S. Suslick, K. I. Hulkower, J. A. Imlay,
K. R. C. Imlay, C. K. Ingison, J. B. Ponder, A. Sen andA. E. Wittrig, J. Am. Chem. Soc., 2011, 133, 7571–7576.
37 H. Lin, M. Jang and K. S. Suslick, J. Am. Chem. Soc., 2011,133, 16786–16789.
38 W. Dabelstein, A. Reglitzky, A. Schütze and K. Reders, Auto-motive fuels, in Ullmann’s Encyclopedia of Industrial Chem-istry, Wiley-VCH, Weinheim, 2012.
39 L. Feng, C. J. Musto, J. W. Kemling, S. H. Lim andK. S. Suslick, Chem. Commun., 2010, 46, 2037–2039.
40 L. Feng, C. J. Musto, J. W. Kemling, S. H. Lim, W. Zhongand K. S. Suslick, Anal. Chem., 2010, 82, 9433–9440.
41 J. F. Hair, B. Black, B. Babin, R. E. Anderson andR. L. Tatham, Multivariate Data Analysis, Prentice Hall,New York, 6th edn, 2005.
42 J. Janata, Principles of Chemical Sensors, Springer,New York, 2nd edn, 2009.
43 R. A. Johnson and D. W. Wichern, Applied Multivariate Stat-istical Analysis, Prentice Hall, New York, 6th edn, 2007.
44 S. Stewart, M. A. Ivy and E. V. Anslyn, Chem. Soc. Rev., 2014,43, 70–84.
45 I. Steinwart and A. Christmann, Support Vector Machines,Springer, New York, 2008.
46 C.-C. Chang and C.-J. Lin, ACM Trans. Intell. Syst. Technol.,2011, 2, 1–27.
Analyst Paper
This journal is © The Royal Society of Chemistry 2015 Analyst, 2015, 140, 5929–5935 | 5935
Publ
ishe
d on
28
July
201
5. D
ownl
oade
d by
Uni
vers
ity o
f Il
linoi
s -
Urb
ana
on 1
9/01
/201
6 20
:13:
57.
View Article Online