Top ranking supplier print and promotional products North ...
Journal of Modern Processes in Manufacturing and Production, Vol. 5, No. 1, Winter 2016
53
Identification and Ranking Green Supplier Selection Criteria Using One-Sample T-Test and FANP Methods: A Case Study for
Petrochemical Industry
Pirouz Sayfi1, Merdad Nikbakht1*
1Department of Industrial Engineering, Najafabad Branch, Islamic Azad University, Najafabad, Iran *Email of Corresponding Author: [email protected]
Received: Februray 7, 2016 ;Accepted: March 14, 2016
Abstract Increasing global notices in environmental protection, green supply chain management (GSCM) has received much attention by researchers and managers more than the past. Commonly, firms have considered cost criteria to select their suppliers. Despite the fact that there are various papers considering the formal criteria in supplier selection, there is a few limited numbers considering the environmental issues. This study will use both traditional and environmental criteria and will offer a combined approach to identify and ranking of the criteria for green supplier selection in petrochemical industry. The One-Sample T-Test is to be used to identify the appropriate criteria, using the Pareto principle the relationships between the criteria are obtained and the Fuzzy Analytic Network Process (FANP) is to be used to calculate weights of green supplier selection’s criteria considering the criteria interdependencies in petrochemical industry. Also, triangular fuzzy numbers are used to express linguistic values of experts’ subjective preference in ANP stage. Keywords Green Supply Chain Management, Petrochemical Industry, One-Sample T-Test, Analytic Network Process
1. Introduction Todays, most of the reputable companies and grand purchasers, besides claiming competitive price, excepted quality and delivery on time, want to make sure that the efficacies of the product and production process, supplying and consumption of the product on environment would be identified and under control. Although, the variety studies have been done in supply chain management and criteria of selecting suppliers [1-6], but the literature regarding green supplier evaluation or works that consider environmental criteria are rather limited [7-13]. Environmental challenges, such as global warming, air and water pollution, acid rains, etc., have demanded great concern by organizations regarding their environmental management [7]. Some of the major issues in environmental sustainability relate to a product’s life cycle environmental burdens. For organizations to manage these burdens effectively they need to expand their vision of environmentally sound practices to go beyond their organizational boundaries. The one way they can fully accomplish this task from strategic and operational perspectives is through green supply chain management (GSCM) practices and programs. In order to reap the greatest benefits from environmental management, firms must integrate all members in the green supply chain. Among these expectations, increasing attention is devoted to suppliers’ social responsibility with a particular focus on fair and legal use of natural resources. Hence, strategic partnership with environmentally, socially and Traditionally powerful suppliers should be integrated within the GSC

Identification and Ranking Green Supplier Selection Criteria Using One-Sample T-Test and FANP …….…, pp. 53-67
54
for improving the performance in many directions including reducing costs and lead time, eliminating wastages, improving quality and flexibility to meet the needs of the customers, etc [10]. This study attempt to, identify and rank the supplier selection criteria in petrochemical industry using of the linguistic preferences. The presented approach, inclusive eight ranking criteria in two traditional and environmental categories which are identified by expert opinions and One-Sample T-Test and their relative ranksare calculated by using Fuzzy Analytical Network Process (FANP) with considering the interdependency between them. Meanwhile, in order to remove the waste calculation in FANP method, the relationships of criteria are specified by expert opinions and Pareto principle. The rest of the paper is organized as follows: in Section 2 the literature review would be presented. The methodology of research would present in sections 3 and a numerical application of the proposed approach will present in section 4 and finally conclusion and future works would be presented in section 5. 2. Literature Review Nowadays, the outsourcing, contracting out a business process to a third-party, is one of the most important strategies to avoid certain costs in a supply chain management such as production or labor costs [14]. In other view, with the changing environmental requirements, affecting the manufacturing operations, increasing attention is also required to be given to develop effective environmental management strategies for the supply chain [15]. Srivastava presented a definition for GSCM as: Integrating environmental thinking into supply chain management, including product design, material sourcing and selection, manufacturing processes, delivery of the final product to the consumers, as well as end-of-life management of the product after its useful life [16]. Some characteristic differences between traditional supply chain management (SCM) and green SCM presented by Deshmukh and Vasudevan are shown in Table 1.
Table 1. Traditional SCM vs Green SCM- Deshmukh and Vasudevan Item Characteristics Convectional SCM Green SCM
1 Objectives and values Economic Economic and Ecological
2 Ecologicaloptimization Integrated Approach High Ecological Impacts
3 Supplier Selection Criteria Price Switching Supplier Short Term
Relations Ecological Aspects Logical Terms
Relations
4 Cost Prices Low High
5 Speed and Flexibility High Low
Since 1960s, the supplier selection criteria and performance evaluation of suppliers have been a focal point of many researchers. While the traditional supplier evaluation methods primarily considered Traditional criteria in the decision-making process, more recent emphasis points to the incorporation of multiple suppliers’ criteria into the evaluation process [17]. Location, additional value added capability, scope of resources, quality, cost, flexibility in contracts, on time delivery, reputation, culture and existing relationship are the top10 factors considered in supplier selection according to a survey [18]. Weber et al. (1991) presented a review of 74 articles that represented the supplier selection literature available since the year 1966. Capacity, quality, on time delivery and net price, were the criteria that appeared most often in articles [19]. Ho et al. (2009), suggested that flexibility, finance, risk, research & development, manufacturing capability, technology, management, service, relationship, reputation, price, delivery, safety and environment are followed after quality management, safety and environment [20].

Journal of Modern Processes in Manufacturing and Production, Vol. 5, No. 1, Winter 2016
55
Several decision-making approaches for supplier selection have been introduced in the past three to four decades, including AHP, ANP, the matrix method, artificial neural networks (ANN), case based reasoning (CBR), data envelopment analysis (DEA), fuzzy set theory, the genetic algorithm (GA), mathematical programming (MP), the simple multi-attribute rating technique (SMART), GRA, and their hybrids [21]. Extensive single model approaches have been proposed for supplier selection, such as the Analytical Hierarchical Process (AHP) by [22]. Bhutta and Huq analyzed as to how AHP provides a framework to cope up with multiple criteria situations, involving supplier selection, while total cost of ownership is a methodology and philosophy [23]. Analytic Network Process (ANP) is used as a decision tool to solve multi criteria decision making tool as also proposed by [24]. Lee et al. proposed a model for manufacturers to have a better understanding of the capabilities that a green supplier must possess that can evaluate and select the most suitable green supplier for cooperation and accordingly used Delphi and fuzzy extended AHP [9]. Hsu and Hu presented ANP as a new criterion of supplier selection to hazardous substance management including green purchasing, green materials coding & recording, capability of green design, inventory of hazardous substances, and management for hazardous substances, legal compliance competency and environmental management systems [25]. 3.Material and methods 3.1 One-Sample T-Test One-Sample T-Test is a statistical tools, which used to examine the mean difference between the sample (n<30) and the known value of the population mean. In One-Sample t-test, the population mean was known. We select a random sample from the population and then compare the sample mean with the population mean and make a statistical decision as to whether or not the sample mean is different from the population mean [26].
The statistical hypothesis for One-Sample T-Test is:� �·: � � ���: � �� (1)
Where, “a” is a numerical value. The examination statistic equal to: � � ����
√� (2)
Hypothesis testing: In hypothesis testing, statistical decisions are made to decide whether or not the population mean and the sample mean are different. Here, we will compare the calculated value with the table value. If the calculated value is greater than the table value, then we will reject the null hypothesis, and accept the alternative hypothesis [26]. 3.2 Pareto Principle A principle, named after economist Vilfredo Pareto that specifies an unequal relationships between inputs and outputs. The principle states that, for many phenomena, 20% of invested input is responsible for 80% of the results obtained. Put another way, 80% of consequences stem from 20% of the causes [27]. 3.3 Fuzzy Analytic Network Process (FANP) ANP is a general form of the Analytical Hierarchy Process (AHP) which was proposed by Saaty for extending the AHP to address restrictions of the hierarchical structure where criteria are independent from each other. In FANP, pair-wise comparison matrices are formed between various attributes of each level with the help of triangular fuzzy numbers. The FANP can easily accommodate the interrelationships existing among the functional activities [28]. Önüt et al. proposed the following four main steps of FANP as follows [28].
Identification and Ranking Green Supplier Selection Criteria Using One-Sample T-Test and FANP …….…, pp. 53-67
56
Step 1: Model problem structuring: The problem should be clearly defined and decomposed in to a logical system like a network. Step 2: Pair wise comparison matrices and priority vectors: the geometric mean is used to aggregate the expert opinions and to obtain Eigenvectors of each pair wise tables, the logarithmic least squares method can be used as follows:
��� � ���� , ���, ���� � � 1,2,3, … , " (3)
Where
��#=$∏ &'(��()* +
* �,
∑ $∏ &.(/�()* +* �,�()*
0 1 23, 4, "5 (4)
Step 3: Forming the super-matrix (wij): These matrixes include the eigenvectors which obtained from step 2. Step 4: calculating final weighs of levels: final weights of elements for each level (�67) are calculated using Eq. 4:
�67 � �66 8 �696��: 8 �6��7 (5)
3.4 Methodology Our proposed combined approach for identification and ranking of criteria for green supplier selection in petrochemical industry consists of four steps, as shown in Figure1. In the first step, traditional and environmental supplier selection criteria are specified by reviewing the literature. In the second step, a structured questionnaire which its validity confirmed by companies experts and its Reliability is equal to 0.822 according to Cronbach's Alpha method, is used to select the relevant supplier selection’s criteria based upon those suggested by the literature. The experts are asked to provide their opinions in linguistic terms on whether a criteria was relevant or not for supplier selection in petrochemical industry. Next, the relevant criteria are selected by One-Sample T-Test and using SPSS Software. In step third, the experts are asked in a structured questionnaire which its validity confirmed by companies experts and its Reliability is equal to 0.743 according to the Cronbach's Alpha method, to determine the relationship between the criteria. After receipt of the filled out questionnaire, number 1 will be inserted in case there is a relationship between two selected criteria and 0 if no relationship is assumed and the related Pareto chart is drawn. Relations between the pair of criteria that are covered by 80 percent of the expert opinions frequency are accepted and elected as the relationships among criteria. Finally, using pairwise comparisons in order to determine the relative importance of the criteria, ranks of the criteria using a super-matrix which is part of the FANP are calculated.

Journal of Modern Processes in Manufacturing and Production, Vol. 5, No. 1, Winter 2016
57
Figure 1. Diagram for proposed approach

Identification and Ranking Green Supplier Selection Criteria Using One-Sample T-Test and FANP …….…, pp. 53-67
58
Table 2. Suppliers Selection Criteria
Author / Authors
Criteria Traditional Criteria Environment Criteria
Co
st
Qu
ality
Tech
no
logy
Cu
stom
er Satisfactio
n
Delivery R
eliability
Service
Cu
lture
Org
anizatio
n
Pro
fitability
Flexib
ility
Lo
cation
Qu
ality Man
agem
ent S
ystem
Man
agem
ent C
om
mitm
ent
Eco
Tech
nolog
y
Eco
Ro
w M
aterial
En
viron
men
tal Train
ing
of S
taff
En
viron
men
t Man
agem
ent S
ystem
Po
llution
Co
ntro
l
Green
Imag
e
Green
Desig
n
Green
Pro
duct
Reso
urce C
on
sum
ption
Shen et al. (2013) � � � � � � � � �
Bai and Sarkis(2010) � � � � � � � �
Lee et al. (2009) � � � � � � � � � � �
Awasthi et al. (2010) � � � � � � � � Büyüközkan and
Çifçi(2012) � � � � � � � � �
Bali et al. (2013) � � � � � � � � �
Shu and Wub(2009) � � � � � �
Tuzkaya et al.(2013) � � � � � � � � �
Yeh and Chuang(2013) � � � � Ashraf Bakeshlu et
al.(2014) � � � � � � �
Hashemi et al.(2015) � � � � � �
Amin and Zhang(2012) � � � � � � �
Tseng and Chiu(2013) � � � � � � � � � � � �
3.5 Numerical example The National Petrochemical Company (NPC), a subsidiary to the Iranian Petroleum Ministry, is owned by the government of the Islamic Republic of Iran. It is responsible for the development and operation of petrochemical facilities in the country. Founded in 1964, NPC began its activities by operating a small fertilizer plant. Over the years, it has not only expanded the range and volume of its products, but has also taken steps in the areas such as research and technology to achieve more self-sufficiency. Simultaneous with issuing environment management system in collection of international management system and despite general imagine of the craftsmen in chemical industries that due to the nature of the activities of these industries, not assumed clean product. National Petrochemical Company’s management trusting on experienced workers, followed implementation of ISO 140001 and in 1998 as the first petrochemical company in Iran, Esfahan Petrochemical Company obtained the certificate of implementation of the environmental management system. These days, the green supply chain is identified as a tool to gain a competitive advantage in the international level. Therefore, the NPC, like other organizations, need to move toward a GSCM. In this study, in order to identification and ranking criteria of green supplier selection and with respect to distribution of petrochemical companies in Iran and lack of access to all companies, the expert opinions of top ten petrochemical companies with highest ranking in 100 premier companies of Iran in 2013 suggested by industrial management company (i.e.: Nouri, Jam, Bandar Emam, Maroon, Pars, BoualiSina, Shazand, Zagros, Amir Kabir and Esfahan Petrochemical Companies) are utilized.
Journal of Modern Processes in Manufacturing and Production, Vol. 5, No. 1, Winter 2016
59
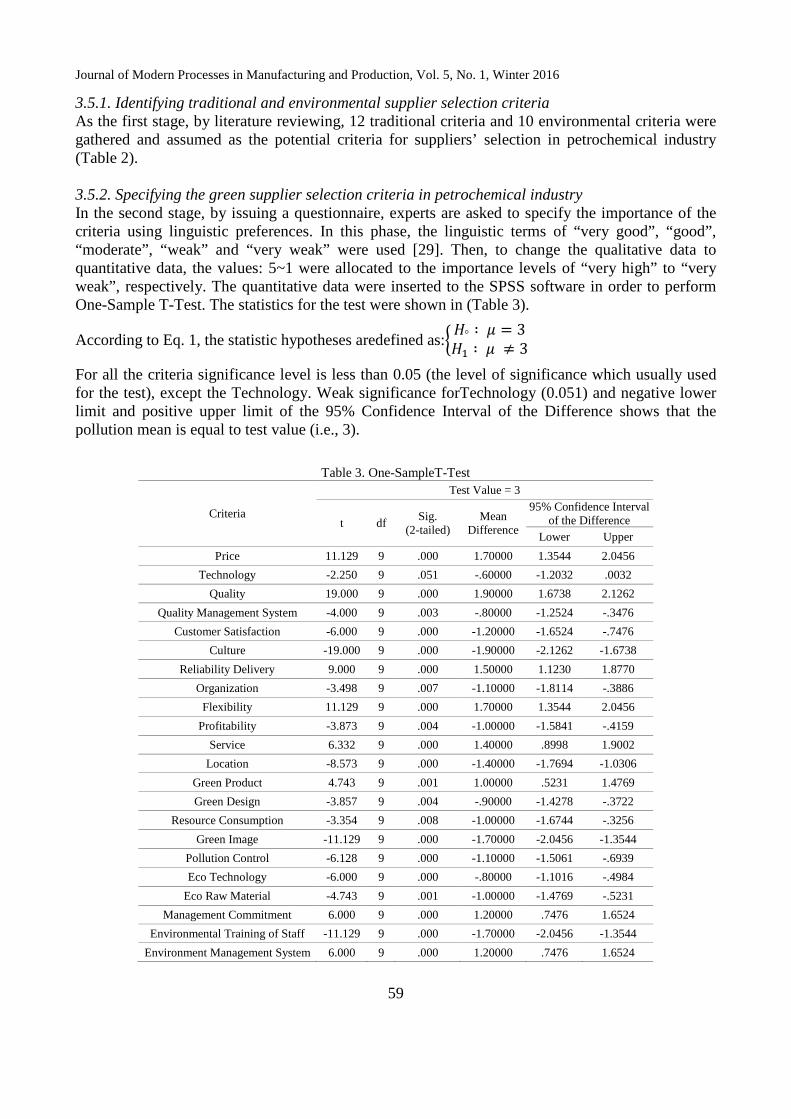
3.5.1. Identifying traditional and environmental supplier selection criteria As the first stage, by literature reviewing, 12 traditional criteria and 10 environmental criteria were gathered and assumed as the potential criteria for suppliers’ selection in petrochemical industry (Table 2). 3.5.2. Specifying the green supplier selection criteria in petrochemical industry In the second stage, by issuing a questionnaire, experts are asked to specify the importance of the criteria using linguistic preferences. In this phase, the linguistic terms of “very good”, “good”, “moderate”, “weak” and “very weak” were used [29]. Then, to change the qualitative data to quantitative data, the values: 5~1 were allocated to the importance levels of “very high” to “very weak”, respectively. The quantitative data were inserted to the SPSS software in order to perform One-Sample T-Test. The statistics for the test were shown in (Table 3).
According to Eq. 1, the statistic hypotheses aredefined as:� �° ; � � 3�� ; � 3�
For all the criteria significance level is less than 0.05 (the level of significance which usually used for the test), except the Technology. Weak significance forTechnology (0.051) and negative lower limit and positive upper limit of the 95% Confidence Interval of the Difference shows that the pollution mean is equal to test value (i.e., 3).
Table 3. One-SampleT-Test
Criteria
Test Value = 3
t df Sig.
(2-tailed) Mean
Difference
95% Confidence Interval of the Difference
Lower Upper
Price 11.129 9 .000 1.70000 1.3544 2.0456
Technology -2.250 9 .051 -.60000 -1.2032 .0032
Quality 19.000 9 .000 1.90000 1.6738 2.1262
Quality Management System -4.000 9 .003 -.80000 -1.2524 -.3476
Customer Satisfaction -6.000 9 .000 -1.20000 -1.6524 -.7476
Culture -19.000 9 .000 -1.90000 -2.1262 -1.6738
Reliability Delivery 9.000 9 .000 1.50000 1.1230 1.8770
Organization -3.498 9 .007 -1.10000 -1.8114 -.3886
Flexibility 11.129 9 .000 1.70000 1.3544 2.0456
Profitability -3.873 9 .004 -1.00000 -1.5841 -.4159
Service 6.332 9 .000 1.40000 .8998 1.9002
Location -8.573 9 .000 -1.40000 -1.7694 -1.0306
Green Product 4.743 9 .001 1.00000 .5231 1.4769
Green Design -3.857 9 .004 -.90000 -1.4278 -.3722
Resource Consumption -3.354 9 .008 -1.00000 -1.6744 -.3256
Green Image -11.129 9 .000 -1.70000 -2.0456 -1.3544
Pollution Control -6.128 9 .000 -1.10000 -1.5061 -.6939
Eco Technology -6.000 9 .000 -.80000 -1.1016 -.4984
Eco Raw Material -4.743 9 .001 -1.00000 -1.4769 -.5231
Management Commitment 6.000 9 .000 1.20000 .7476 1.6524
Environmental Training of Staff -11.129 9 .000 -1.70000 -2.0456 -1.3544
Environment Management System 6.000 9 .000 1.20000 .7476 1.6524
Identification and Ranking Green Supplier Selection Criteria Using
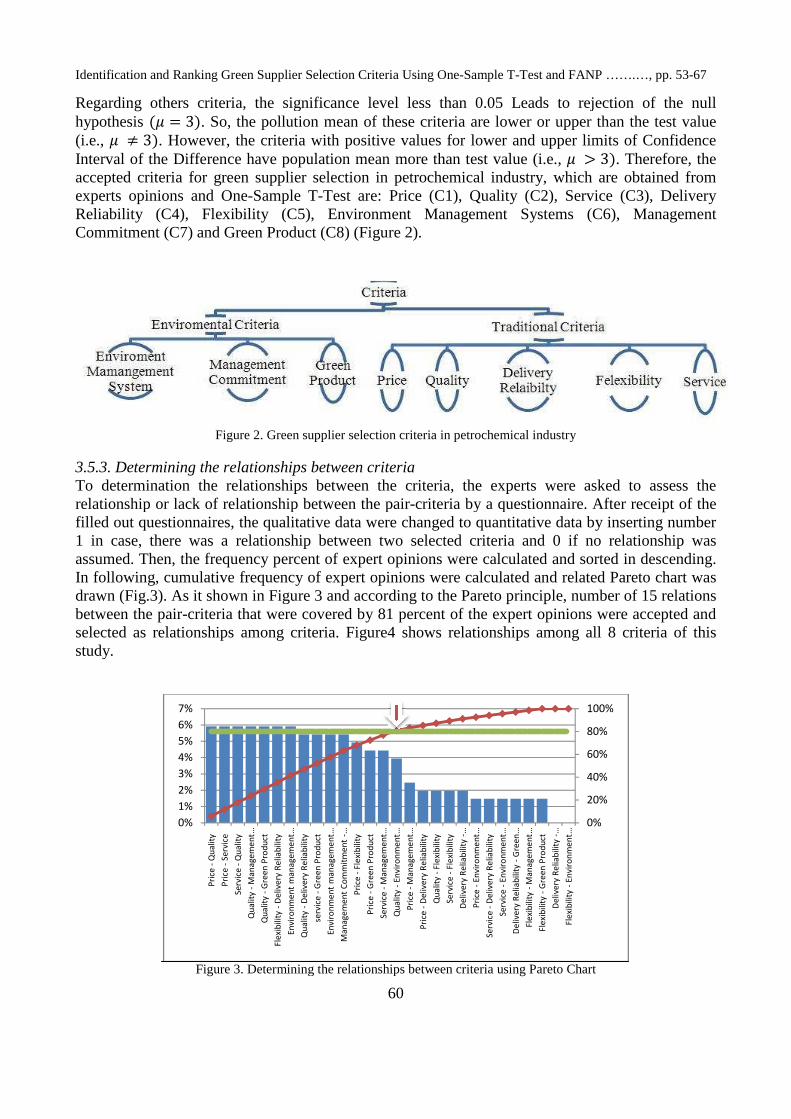
Regarding others criteria, the significance level less than hypothesis 9� � 3:. So, the pollution mean of these criteria are lower or upper than(i.e., � 3:. However, the criteria with positive values forInterval of the Difference have population mean more than test value (i.e., accepted criteria for green supplier selection in petrochemical industry, which are obtainedexperts opinions and One-SampleReliability (C4), Flexibility (Commitment (C7) and Green Product
Figure 2. Green supplier selection criteria in p
3.5.3. Determining the relationships between criteriaTo determination the relationships between the criteria, the expertsrelationship or lack of relationship between the pairfilled out questionnaires, the qualitative data were changed to quantitative data by inserting number 1 in case, there was a relationship between two selected criteria and assumed. Then, the frequency percent oIn following, cumulative frequency of expert opinions were calculated and related Pareto chart was drawn (Fig.3). As it shown in Figure between the pair-criteria that were covered by selected as relationships among criteriastudy.
Figure 3. Determining the relationships
0%
1%
2%
3%
4%
5%
6%
7%
Pri
ce -
Qu
ality
Pri
ce -
Se
rvic
e
Se
rvic
e -
Qu
ality
Qu
ality
-M
an
ag
em
en
t …
Qu
ality
-G
ree
n P
rod
uct
Fle
xib
ilit
y -
De
live
ry R
elia
bilit
y
En
vir
on
me
nt
ma
na
ge
me
nt …
Identification and Ranking Green Supplier Selection Criteria Using One-Sample T-Test and FANP ……
60
the significance level less than 0.05 Leads to rejection of the null . So, the pollution mean of these criteria are lower or upper than
. However, the criteria with positive values for lower and upper limits of Confidence have population mean more than test value (i.e., �
accepted criteria for green supplier selection in petrochemical industry, which are obtainedSample T-Test are: Price (C1), Quality (C2), Service
(C5), Environment Management Systems and Green Product (C8) (Figure 2).
Green supplier selection criteria in petrochemical industry
Determining the relationships between criteria To determination the relationships between the criteria, the experts were asked to assess the relationship or lack of relationship between the pair-criteria by a questionnaire. filled out questionnaires, the qualitative data were changed to quantitative data by inserting number
there was a relationship between two selected criteria and 0 if no relationship was assumed. Then, the frequency percent of expert opinions were calculated and sorted in descending. In following, cumulative frequency of expert opinions were calculated and related Pareto chart was
shown in Figure 3 and according to the Pareto principle, number of criteria that were covered by 81 percent of the expert opinions
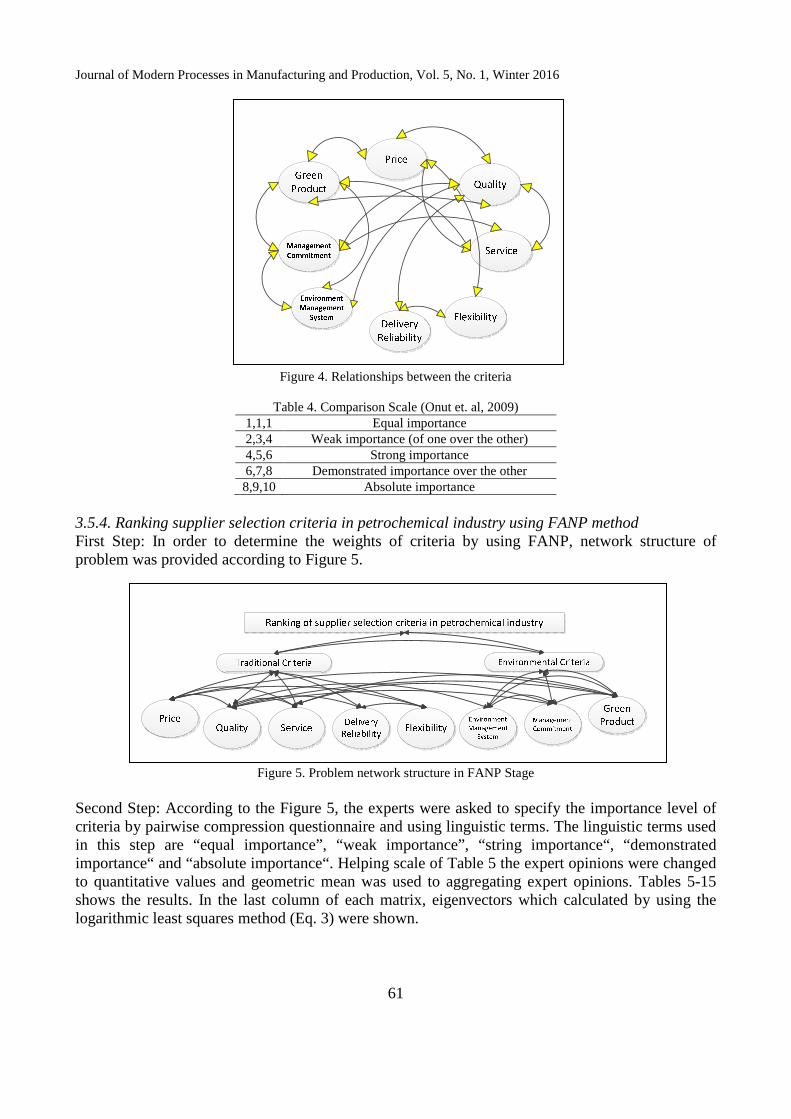
selected as relationships among criteria. Figure4 shows relationships among all
Determining the relationships between criteria using Pareto Chart
En
vir
on
me
nt
ma
na
ge
me
nt …
Qu
ality
-D
elive
ry R
elia
bilit
y
serv
ice
-G
ree
n P
rod
uct
En
vir
on
me
nt
ma
na
ge
me
nt …
Ma
na
ge
me
nt
Co
mm
itm
en
t -…
Pri
ce -
Fle
xib
ilit
y
Pri
ce -
Gre
en
Pro
du
ct
Se
rvic
e -
Ma
na
ge
me
nt …
Qu
ality
-E
nvir
on
me
nt …
Pri
ce -
Ma
na
ge
me
nt …
Pri
ce -
De
live
ry R
elia
bilit
y
Qu
ality
-F
lexi
bilit
y
Se
rvic
e -
Fle
xib
ilit
y
De
live
ry R
elia
bilit
y -
…
Pri
ce -
En
vir
on
me
nt …
Se
rvic
e -
De
live
ry R
elia
bilit
y
Se
rvic
e -
En
vir
on
me
nt …
De
live
ry R
elia
bilit
y -
Gre
en
…
Fle
xib
ilit
y -
Ma
na
ge
me
nt …
Fle
xib
ilit
y -
Gre
en
Pro
du
ct
De
live
ry R
elia
bilit
y -
…
Fle
xib
ilit
y -
En
vir
on
me
nt …
Test and FANP …….…, pp. 53-67
Leads to rejection of the null . So, the pollution mean of these criteria are lower or upper than the test value
lower and upper limits of Confidence � < 3:. Therefore, the
accepted criteria for green supplier selection in petrochemical industry, which are obtained from Service (C3), Delivery
Environment Management Systems (C6), Management
etrochemical industry
were asked to assess the criteria by a questionnaire. After receipt of the
filled out questionnaires, the qualitative data were changed to quantitative data by inserting number if no relationship was
f expert opinions were calculated and sorted in descending. In following, cumulative frequency of expert opinions were calculated and related Pareto chart was
number of 15 relations percent of the expert opinions were accepted and shows relationships among all 8 criteria of this
Pareto Chart
0%
20%
40%
60%
80%
100%
Fle
xib
ilit
y -
En
vir
on
me
nt …
Journal of Modern Processes in Manufacturing and Production, Vol. 5, No. 1, Winter 2016
61
Figure 4. Relationships between the criteria
Table 4. Comparison Scale (Onut et. al, 2009) 1,1,1 Equal importance 2,3,4 Weak importance (of one over the other) 4,5,6 Strong importance 6,7,8 Demonstrated importance over the other 8,9,10 Absolute importance
3.5.4. Ranking supplier selection criteria in petrochemical industry using FANP method First Step: In order to determine the weights of criteria by using FANP, network structure of problem was provided according to Figure 5.
Figure 5. Problem network structure in FANP Stage
Second Step: According to the Figure 5, the experts were asked to specify the importance level of criteria by pairwise compression questionnaire and using linguistic terms. The linguistic terms used in this step are “equal importance”, “weak importance”, “string importance“, “demonstrated importance“ and “absolute importance“. Helping scale of Table 5 the expert opinions were changed to quantitative values and geometric mean was used to aggregating expert opinions. Tables 5-15 shows the results. In the last column of each matrix, eigenvectors which calculated by using the logarithmic least squares method (Eq. 3) were shown.

Identification and Ranking Green Supplier Selection Criteria Using One-Sample T-Test and FANP …….…, pp. 53-67
62
Table 5. Mean on pair wise comparison base on goal Goal Traditional Criteria Environmental Criteria Eigenvector
Traditional Criteria (1,1,1) (1.782,2.265,2.696) (0.615,0.694,0.757)
Environmental Criteria
(0.371,0.442,0.561) (1,1,1) (0.281,0.306,0.345)
Table 6. Mean of pair wise comparison base on Traditional Criteria C1 C2 C3 C4 C5 Eigenvector
C1 (1,1,1) (0.525,0.637,0.794) (1.049,1.442,1.906) (3.634,4.718,5.769) (3.026,3.714,4.53) (0.22,0.268,0.32)
C2 (1.26,1.57,1.906) (1,1,1) (2.828,3.873,4.899) (5.769,6.804,7.83) (5.14,6.169,7.191) (0.39,0.465,0.538)
C3 (0.525,0.693,0.953)
(0.204,0.258,0.354) (1,1,1) (0.661,0.809,1) (0.849,1.014,1.26) (0.088,0.105,0.129)
C4 (0.173,0.212,0.275)
(0.128,0.147,0.173) (1,1.236,1.513) (1,1,1) (1.049,1.442,1.906) (0.072,0.086,0.103)
C5 (0.221,0.269,0.33) (0.139,0.162,0.195) (0.794,0.986,1.178) (0.525,0.693,0.953) (1,1,1) (0.064,0.076,0.091)
CRm =0.044CRg =0.028
Table 7. Mean of pairwise comparison based on Environmental Criteria
C6 C7 C8 Eigenvector C6 (1,1,1) (0.354,0.417,0.525) (0.437,0.53,0.674) (0.167,0.188,0.22) C7 (1.906,2.396,2.828) (1,1,1) (1.178,1.442,1.763) (0.408,0.471,0.532) C8 (1.484,1.886,2.289) (0.567,0.693,0.849) (1,1,1) (0.294,0.341,0.389)
CRm =0.002CRg =0.006
Table 8. Mean of pairwise comparison based on Price C2 C3 C5 C8 Eigenvector
C2 (1,1,1) (3.026,4.096,5.14) (2.57,3.004,3.525) (1.906,2.365,2.884) (0.425,0.503,0.582)
C3 (0.195,0.244,0.33) (1,1,1) (0.55,0.674,0.849) (0.794,1.058,1.414) (0.117,0.14,0.172)
C5 (0.284,0.333,0.389) (1.178,1.485,1.817) (1,1,1) (1.26,1.661,2.14) (0.174,0.206,0.24)
C8 (0.347,0.423,0.525) (0.707,0.945,1.26) (0.467,0.602,0.794) (1,1,1) (0.126,0.152,0.184)
CRm =0.025CRg =0.072
Table 9. Mean of pairwise comparison based on Service
C1 C2 C7 C8 Eigenvector
C1 (1,1,1) (0.208,0.241,0.289) (2.402,3.093,3.888) (0.849,1.044,1.348) (0.167,0.194,0.229)
C2 (3.464,4.155,4.804) (1,1,1) (4.579,5.666,6.721) (1.587,1.886,2.14) (0.462,0.533,0.595)
C7 (0.257,0.323,0.416) (0.149,0.177,0.218) (1,1,1) (0.891,1.119,1.414) (0.089,0.104,0.124)
C8 (0.742,0.958,1.178) (0.467,0.53,0.63) (0.707,0.894,1.122) (1,1,1) (0.145,0.169,0.197)
CRm =0.018CRg =0.054
Table 10. Mean of pairwise comparison based on Quality
C1 C3 C4 C6 C7 C8 Eigenvector
C1 (1,1,1) (0.794,1,1.26) (3.17,4.28,5.248) (3.81,4.86,5.88) (2.24,2.96,3.63) (1.26,1.51,1.82) (0.26,0.32,0.38)
C3 (0.79,1,1.26) (1,1,1) (1,1.29,1.73) (3.24,3.93,4.58) (1.20,1.51,1.91) (0.53,0.66,0.89) (0.16,0.2,0.24)
C4 (0.19,0.24,0.31) (0.58,0.775,1) (1,1,1) (0.74,0.97,1.26) (0.93,1.201,1.51) (0.49,0.64,0.85) (0.09,0.11,0.14)
C6 (0.17,0.21,0.26) (0.22,0.25,0.31) (0.79,1.029,1.35) (1,1,1) (0.33,0.38,0.47) (1.48,1.89,2.29) (0.07,0.09,0.11)
C7 (0.27,0.34,0.44) (0.52,0.66,0.83) (0.66,0.83,1.07) (2.14,2.61,3.03) (1,1,1) (1.32,1.71,2.18) (0.12,0.15,0.18)
C8 (0.55,0.66,0.79) (1.12,1.50,1.87) (1.18,1.57,2.04) (0.4,0.53,0.67) (0.46,0.58,0.76) (1,1,1) (0.11,0.13,0.16)
CRm =0.031CRg =0.025

Journal of Modern Processes in Manufacturing and Production, Vol. 5, No. 1, Winter 2016
63
Table 11. Mean of pairwise comparison based on Delivery Reliability
C2 C5 Eigenvector
C2 (1,1,1) (2.884,3.608,4.28) (0.7,0.783,0.853)
C5 (0.234,0.277,0.347) (1,1,1) (0.199,0.217,0.243)
Table 12. Mean of pairwise comparison based on Flexibility
C1 C4 Eigenvector
C1 (1,1,1) (6.172,7.197,8.214) (0.813,0.878,0.938)
C4 (0.122,0.139,0.162) (1,1,1) (0.114,0.122,0.132)
Table 13. Mean of pairwise comparison based on Environment management system
C2 C7 C8 Eigenvector
C2 (1,1,1) (0.33,0.405,0.525) (0.289,0.372,0.5) (0.135,0.157,0.189)
C7 (1.906,2.466,3.026) (1,1,1) (2,2.466,2.994) (0.461,0.539,0.616)
C8 (2,2.685,3.464) (0.334,0.405,0.5) (1,1,1) (0.258,0.304,0.355)
CRm =0.013CRg =0.006
Table 14. Mean of pairwise comparison based on Management commitment C2 C3 C6 C8 Eigenvector
C2 (1,1,1) (2.14,2.84,3.634) (0.257,0.323,0.416) (0.294,0.368,0.5) (0.135,0.162,0.199)
C3 (0.275,0.352,0.467) (1,1,1) (0.25,0.315,0.408) (0.294,0.383,0.525) (0.08,0.097,0.12)
C6 (2.402,3.093,3.888) (2.449,3.177,4) (1,1,1) (1.698,1.969,2.289) (0.379,0.447,0.521) C8 (2,2.72,3.397) (1.906,2.608,3.397) (0.437,0.508,0.589) (1,1,1) (0.242,0.294,0.344)
CRm =0.075CRg =0.014
Table 15. Mean of pairwise comparison based on Green product C1 C2 C3 C6 C7 Eigenvector
C1 (1,1,1) (0.14,0.17,0.20) (0.315,0.4,0.56) (0.27,0.35,0.46) (0.24,0.29,0.37) (0.05,0.06,0.08)
C2 (4.9,5.916,6.93) (1,1,1) (2.14,2.87,3.56) (1.12,1.442,1.78) (0.39,0.49,0.63) (0.23,0.28,0.33)
C3 (1.78,2.5,3.17) (0.28,0.35,0.47) (1,1,1) (0.27,0.352,0.47) (0.4,0.52,0.69) (0.1,0.12,0.15)
C6 (2.14,2.84,3.63) (0.56,0.69,0.89) (2.14,2.84,3.63) (1,1,1) (0.89,1.04,1.18) (0.20,0.25,0.29)
C7 (2.7,3.41,4.08) (1.59,2.05,2.57) (1.44,1.91,2.52) (0.85,0.96,1.12) (1,1,1) (0.24,0.29,0.34)
CRm =0.053CRg =0.048
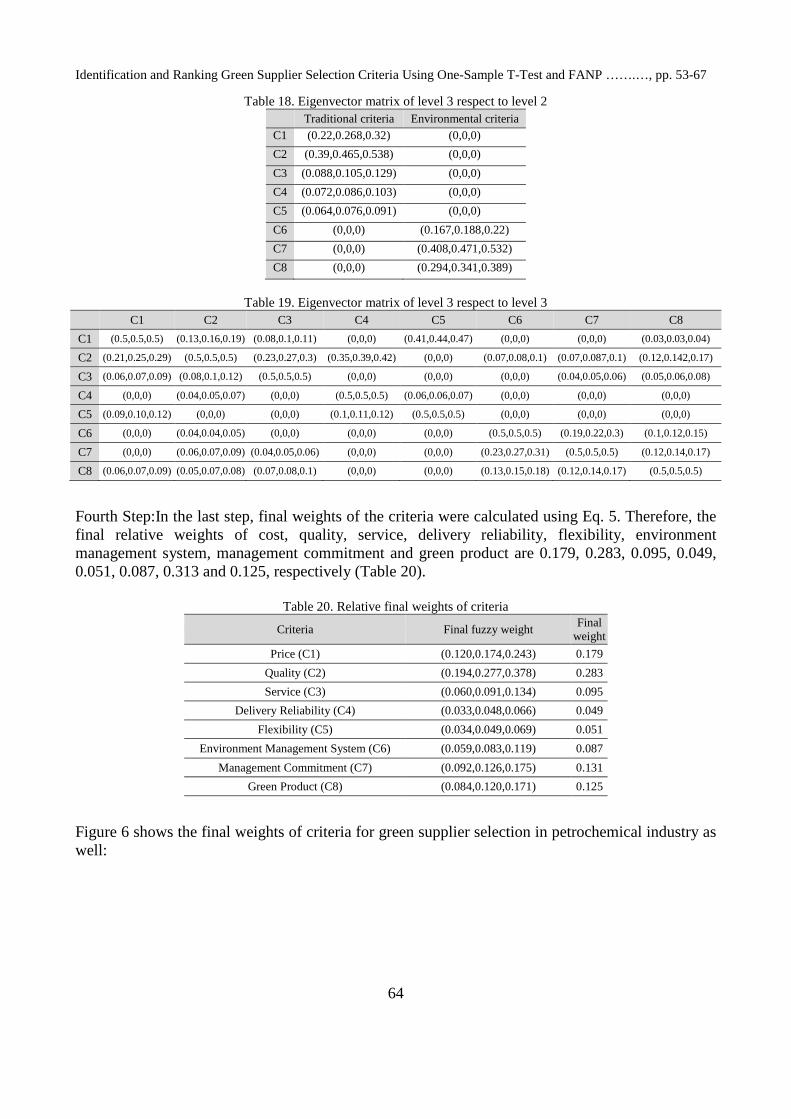
Third Step: In this step, as it shown in Table 16~19, eigenvector matrixes were constructed including eigenvectors of the previous step.
Table 16. Eigenvector matrix of level 2 respect to level 1
Research goal
Traditional criteria (0.615,0.694,0.757)
Environmental criteria (0.281,0.306,0.345)
Table 17. Eigenvector matrix of level 2 respect to level 2
Traditional criteria Environmental criteria
Traditional criteria (1,1,1) (0,0,0)
Environmental criteria (0,0,0) (1,1,1)
Identification and Ranking Green Supplier Selection Criteria Using One-Sample T-Test and FANP …….…, pp. 53-67
64
Table 18. Eigenvector matrix of level 3 respect to level 2 Traditional criteria Environmental criteria C1 (0.22,0.268,0.32) (0,0,0)
C2 (0.39,0.465,0.538) (0,0,0)
C3 (0.088,0.105,0.129) (0,0,0)
C4 (0.072,0.086,0.103) (0,0,0)
C5 (0.064,0.076,0.091) (0,0,0)
C6 (0,0,0) (0.167,0.188,0.22)
C7 (0,0,0) (0.408,0.471,0.532)
C8 (0,0,0) (0.294,0.341,0.389)
Table 19. Eigenvector matrix of level 3 respect to level 3
C1 C2 C3 C4 C5 C6 C7 C8
C1 (0.5,0.5,0.5) (0.13,0.16,0.19) (0.08,0.1,0.11) (0,0,0) (0.41,0.44,0.47) (0,0,0) (0,0,0) (0.03,0.03,0.04)
C2 (0.21,0.25,0.29) (0.5,0.5,0.5) (0.23,0.27,0.3) (0.35,0.39,0.42) (0,0,0) (0.07,0.08,0.1) (0.07,0.087,0.1) (0.12,0.142,0.17)
C3 (0.06,0.07,0.09) (0.08,0.1,0.12) (0.5,0.5,0.5) (0,0,0) (0,0,0) (0,0,0) (0.04,0.05,0.06) (0.05,0.06,0.08)
C4 (0,0,0) (0.04,0.05,0.07) (0,0,0) (0.5,0.5,0.5) (0.06,0.06,0.07) (0,0,0) (0,0,0) (0,0,0)
C5 (0.09,0.10,0.12) (0,0,0) (0,0,0) (0.1,0.11,0.12) (0.5,0.5,0.5) (0,0,0) (0,0,0) (0,0,0)
C6 (0,0,0) (0.04,0.04,0.05) (0,0,0) (0,0,0) (0,0,0) (0.5,0.5,0.5) (0.19,0.22,0.3) (0.1,0.12,0.15)
C7 (0,0,0) (0.06,0.07,0.09) (0.04,0.05,0.06) (0,0,0) (0,0,0) (0.23,0.27,0.31) (0.5,0.5,0.5) (0.12,0.14,0.17)
C8 (0.06,0.07,0.09) (0.05,0.07,0.08) (0.07,0.08,0.1) (0,0,0) (0,0,0) (0.13,0.15,0.18) (0.12,0.14,0.17) (0.5,0.5,0.5)
Fourth Step:In the last step, final weights of the criteria were calculated using Eq. 5. Therefore, the final relative weights of cost, quality, service, delivery reliability, flexibility, environment management system, management commitment and green product are 0.179, 0.283, 0.095, 0.049, 0.051, 0.087, 0.313 and 0.125, respectively (Table 20).
Table 20. Relative final weights of criteria
Final weight
Final fuzzy weight Criteria
0.179 (0.120,0.174,0.243) Price (C1)
0.283 (0.194,0.277,0.378) Quality (C2)
0.095 (0.060,0.091,0.134) Service (C3)
0.049 (0.033,0.048,0.066) Delivery Reliability (C4)
0.051 (0.034,0.049,0.069) Flexibility (C5)
0.087 (0.059,0.083,0.119) Environment Management System (C6)
0.131 (0.092,0.126,0.175) Management Commitment (C7)
0.125 (0.084,0.120,0.171) Green Product (C8)
Figure 6 shows the final weights of criteria for green supplier selection in petrochemical industry as well:

Journal of Modern Processes in Manufacturing and Production, Vol. 5, No. 1, Winter 2016
65
Figure 6. Final weights of criteria
5. Result and Conclusion GSCM has appeared as a tools to decrees negative consequences of business operations on the environment. This paper, present a combined approach including One-Sample T-Test, Pareto principle and Fuzzy ANP methods, in order to identification and ranking criteria of green supplier in petrochemical industry. Appropriate criteria were determined by aggregating the expert opinions regarding the importance level of the submitted criteria and using One-Sample T-Test. One-Sample T-Test is a statistical procedure used to examine the mean difference between the sample (n<30) and the known value of the population mean. The Pareto principle was applied to determine the relationships between the criteria as well. At least, the Fuzzy ANP method was used to obtain relative weights of criteria considering the criteria interdependences. The results shows that quality is the most important criteria and then the criteria of cost, management commitment, green product, service, environment management service, flexibility, and delivery reliability have higher relative weights, respectively in process of suppliers selection of petrochemical industry. One of the advantages of the presented approach is using of the One-Sample T-Test to determine the suitable criteria for green supplier selection in petrochemical industry, the others are: determination of relationships between criteria Led to the removal of waste calculations in Fuzzy ANP stages, considering the interdependences between criteria in determination of criteria relative weights using fuzzy ANP method. In summary, this study contributes to literature by: (i) offering a GSCM combined approach that integrates environmental and traditional criteria in a framework; (ii) developing valid and reliable criteria for the GSCM based on expert’s opinions and using linguistic terms. (iii) Developing a hybrid approach to solve the supplier’s criteria ranking problem. 6. References [1] Amin, S.H. and Zhang, G. 2012. An integerated model for closed-loop supply chain
configuration and supplier selection: multi-objective approach. Expert Syst Appl, 39, 6782-6791.
0.179
0.283
0.095
0.049 0.051
0.087
0.1310.125
0
0.05
0.1
0.15
0.2
0.25
0.3
Price
(C1
)
Qu
ality
(C2
)
Se
rvice
(C3
)
De
live
ry R
elia
bility
(C4
)
Fle
xibility
(C5
)
En
viro
nm
en
t Ma
na
ge
me
nt S
yste
m
(C6
)
Ma
na
ge
me
nt C
om
mitm
en
t (C7
)
Gre
en
Pro
du
ct (C8
)
Identification and Ranking Green Supplier Selection Criteria Using One-Sample T-Test and FANP …….…, pp. 53-67
66
[2] Jolai, F, Yazdian, S.A, Shahanaghi, K. and Azari khojasteh, M. 2011. Integrating fuzzy TOPSIS and multi-period goal programming for purchasing multiple products from multiple suppliers. Journal of Purchasing and Supply Management, 17(1), 42-53.
[3] Kull, T. J. and Talluri, S. 2008. A supply risk reduction model using integrated multicriteria decision making. IEEE Transactions on Engineering Management, 55(3), 409-419.
[4] Rezaei, J. and Davoodi, M. 2011. Multi-objective models for lot-sizing with supplier selection. Int. J. Production Economics, 130, 77-86.
[5] Kannan, G. and Murugesan, P. 2011. Selection of third party reverse logistics provider using Fuzzy extent analysis. Bench Marking: An International Journal, 18(1), 149-167.
[6] Yeh, W-C. and Chuang, M-C. 2011. Using multi-objective genetic algorithm for partner selection in green supply chain problems. Expert Systems with Applications, 38, 4244-4253.
[7] Shen, L, Olfat, L, Govidan, K, Khodaverdi, R. and Diabat, A. 2013. A fuzzy multi criteria approach for evaluating green supplier’s performance in green supply chain with linguistic preferences. Resources, Conservation and Recycling(74), 170-179.
[8] Bai, C. and Sarkis, J. 2010. Green supplier development analytical evaluation using rough set theory. Cleaner Production(18), 1200-1210.
[9] Lee, H.I. A, Kang, H.Y., Hsu, C-F. and Hung, H-C. 2009. A green supplier selection model for high-tech industry. Expert Systems with Applications: An International Journal, 36(4), 7917-7927.
[10] Büyüközkan, G. and Çifçi, G. 2012. A novel hybrid MCDM approach based on fuzzy DEMATEL, fuzzy ANP and fuzzy TOPSIS to evaluate green suppliers. Expert Systems with Applications(39), 3000-3011.
[11] Tuzkaya,G, Ozgen, A., Ozgen, D. and Tuzkaya, U.R. 2009. Environmental performance evaluation of suppliers A hybrid fuzzy. Int. J. Environ. Sci. Tech., 6(3), 477-490.
[12] Bali, O., Kose, E. and Gumus, S. 2013. Green supplier selection based on IFS and GRA. Grey Systems: Theory and Application, 3(2), 158-176.
[13] Tseng, M-L. and Chiu, A. SF. 2013. Evaluating firm’s green supply chain management in linguistic preferences. Journal of Cleaner Production, 40, 22-31.
[14] Afshar Bakeshlou, E., Arshadi Khameseh, A., Goudarzian Asl, M. A., Sadeghi, J. and Abbaszadeh, M. 2014. Evaluating a green supplier selection problem using a hybrid MODM algorithm. J Intell Manuf, 1-15.
[15] Deshmukh, A.J. and Vasudevan, H. 2014. Emerging supplier selection criteria in the contex of traditional vs green supply chain management. International Journal of Managing Value and Supply Chains (IJMVSC), 5(1), 19-33.
[16] Srivastava, S. K. 2007. Green supply-chain management: a state-of the-art literature review. International Journal of Management Review, 9(1), 53-80.
[17] Talluri, S. and Narasimhan, R. 2007. A methodology for strategic sourcing. European Journal of Operational Research, 154(1), 236–250.
[18] Shu, M-H. and Wub, H-CH. 2009. Quality-based supplier selection and evaluation using fuzzy data. Computers and Industrial Engineering, Pergamon Press, Inc, 57(3), 1072-1079.
[19] Weber, C. A., Current, J. R. and Benton, W. C. 1991. Vendor selection criteria and methods. European Journal of Operational Research, 50, 2-18.
[20] Ho, W., Xu, X. and Dey, P. 2009. Multi-criteria decision making approaches for supplier evaluation and selection: A literature review. European Journal of Operational Research, 201(1), 16-24.
[21] Hashemi, S.H., Karimi, A. and Tavana, M. 2015. An integrated green supplier selection approach with analytic network process and improved Grey relational analysis, Int. J. Production Economics, 159, 178-191.

Journal of Modern Processes in Manufacturing and Production, Vol. 5, No. 1, Winter 2016
67
[22] Bayazit, O. 2005. Use of AHP in decision-making for flexible manufacturing system. Journal of Manufacturing Technology Management, 16, 808-819.
[23] Bhutta, K.S. and Huq, F. 2002. Supplier selection problem: a comparison of total cost of ownershipand analytic hierarchy provess approaches. Supply Chain Management: An International Journal(7(3)), 126-135.
[24] Gencer, C. and Grpinar, D. 2007. Analytic network process in supplier selection: A case study in an electronic firm. Appl. Math. Model, 31(11), 2475-2486.
[25] Hsu, C.W. and Hu, A.H. 2009. Applying hazardous substance management to supplier selection using analytic network process. Journal of Cleaner Production, 17(2), 255-264.
[26] Winter, J.C.F., 2013. Using the student’s t-test with extremely small sample sizes, Practical Assessment, Research & Evaluation, 18(10).
[27] Bi, G., Feng, C., Ding, J. and Khan, K. R. 2012. Estimating relative efficiency of DMU: Pareto Principle and Monte Carlo oriented DEA approach. Infor, 50(1), 44-57.
[28] Önüt, S, Kara, S. S. and Isik, E. 2009. Long term supplier selection using a combined fuzzy MCDM approach: A casestudy for a telecommunication company. Export System with Applications, 36, 3887-3895.
[29] Awasthi, A, Chauhan, S. S. and Goyal, S.K. 2010. A fuzzy multicriteria approach for evaluating environmental performance of suppliers. Int. J. Production Economics, 126, 370-371.