IDEA Cost Estimating Model User's Guide -...
53
United States Region 5 EPA 905-B-00-002 Environmental Protection 77 West Jackson Boulevard June 2000 Agency Chicago, Illinois IDEA Cost Estimating Model User’s Guide Cost Estimating Model Version 1.2
Transcript of IDEA Cost Estimating Model User's Guide -...

United States Region 5 EPA 905-B-00-002 Environmental Protection 77 West Jackson Boulevard June 2000 Agency Chicago, Illinois
IDEA Cost Estimating Model
User’s Guide
Cost Estimating Model
Version 1.2
For further information on using the IDEA model or implementing illegal dumping prevention programs, please contact:
Paul Ruesch
U.S. Environmental Protection Agency Region 5 77 West Jackson Boulevard (DW-8J)
Chicago, IL 60604 (312) 886-7598
e-mail: [email protected]
Jack Brunner Jeff Swano
Tetra Tech EM Inc. Enviro Impact Solutions 200 East Randolph Drive, Suite 4700 8738 Washington Avenue
Chicago, IL 60601 Brookfield, IL 60513 (312) 856-8788 (708) 485-4190
e-mail: [email protected] e-mail: [email protected]
Contents i
CONTENTS Section Page
CHAPTER 1 INTRODUCTION...................................................................................... 1
CHAPTER 2 SCOPE OF THE MODEL...................................................................... 3
ASSUMPTIONS AND COST SOURCES.................................................................. 4 PARAMETERS INCLUDED........................................................................................ 5 PARAMETERS NOT INCLUDED............................................................................... 5
Lost Hauling and Disposal Revenues of Legitimate Businesses ......................... 5 Age of an Illegal Dump Site ................................................................................ 6 Migration of Waste ............................................................................................. 6 Hazardous Waste ............................................................................................... 6
USING MODEL DEFAULT VALUES OR USER-SUPPLIED VALUES.................. 6 CLEANUP CREW PROCESS RATE......................................................................... 7
CHAPTER 3 USING THE MODEL............................................................................... 8
HARDWARE AND SOFTWARE REQUIREMENTS ................................................ 8 GETTING STARTED................................................................................................... 8 USING THE MODEL INPUT WORKSHEET............................................................. 9 Schedule A. Identify Illegal Dump Site Features .......................................................... 10
Limitations ........................................................................................................ 11 Schedule B. Select Values for Waste Type, Quantity, and Disposal Method ............... 11 Schedule C. Estimate Site Cleanup Costs ................................................................... 13
Default Labor.................................................................................................... 13 Default Process Equipment .............................................................................. 14 Term Equipment ............................................................................................... 14 Per-Unit Equipment .......................................................................................... 15 Default Process Rates ...................................................................................... 15 Changing Process Rates .................................................................................. 16 Changing Default Values .................................................................................. 20 Manual Mode.................................................................................................... 21 Limitations ........................................................................................................ 22
Schedule D. Estimate Waste Transport Costs.............................................................. 22 Schedule E. Estimate Disposal Costs.......................................................................... 23
Limitations ........................................................................................................ 23 Schedule F. Estimate Site Restoration and Security Costs.......................................... 24
Limitations ........................................................................................................ 25 Schedule G. Estimate Site Surveillance Costs............................................................. 25
Limitations ........................................................................................................ 26 Schedule H. Assess Property Liabilities....................................................................... 26 Schedule I. Estimate Program Administrative Costs .................................................... 27
Limitations ........................................................................................................ 27 Schedule J. Estimate Offsetting Costs......................................................................... 27 Schedule K. Adjustments to Default Cost Values ........................................................ 28

CONTENTS (Continued) Section Page
Contents ii
USING THE ADJUSTING DEFAULT VALUES WORKSHEET ............................ 28 USING THE COST SUMMARY WORKSHEET...................................................... 29 USING THE TOOLS WORKSHEET........................................................................ 29 THE DO NOT ALTER WORKSHEET...................................................................... 30
INDEX........................................................................................................31
Appendix APPENDIX A MODEL INPUT WORKSHEET APPENDIX B ADJUSTING DEFAULT VALUES WORKSHEET APPENDIX C COST SUMMARY WORKSHEET APPENDIX D EXAMPLE DATA COLLECTION FORM APPENDIX E MODEL INPUT WORKSHEET FLOW CHART
TABLES AND FIGURES Table B-1. Standard Waste Types and Weight and Volume Conversions Used in Model... 12 Table C-2. Default Process Equipment Types and Hourly Costs ........................................ 14 Table C-3. Calculation of Default Process Rates by Waste Type ....................................... 16 Figure C-1. Illustration of the Default Cleanup Crews and Cleanup Processes for the
Standard Waste Types...................................................................................... 18 Table C-4. Changes in Default Process Rates Based on Equipment Bucket Sizes ............ 19 Table C-5. Changes to Process Rate Based on Multiple Mobilizations ............................... 20 Table D-1. Calculation of Default Waste Transport Costs................................................... 22 Table E-1. Default Disposal Facility Costs .......................................................................... 23 Table F-1. Calculation of Default Site Restoration and Security Costs ............................... 24

Chapter 1 1 Introduction
CHAPTER 1 INTRODUCTION
Illegal dumping is a major problem in many urban and rural communities throughout the United States.
For many communities, the financial and social impacts of illegal dumping activities are understood only in
a general sense. It is widely accepted that illegal dumping affects public health and safety, decreases
property values, discourages economic development, increases municipal operating costs, increases
property taxes and service fees, and results in lost revenues. Furthermore, local governments and private
property owners incur significant capital and operation and maintenance costs associated with the need to
continuously clean up, haul, and dispose of illegally dumped wastes. For many municipalities, these costs
are inadequately measured by current accounting practices. As a result, the true costs of illegal dumping
activities have yet to be fully realized, and no effective means for cost recovery have been identified.
The Illegal Dumping Economic Assessment (IDEA) model was developed to provide community leaders
with a tool for assessing and measuring the costs of illegal dumping activities. Use of the model can be a
first step in quantifying such costs, thereby supporting cost management and policy-making decisions
associated with illegal dumping prevention programs. Intended users of the IDEA model include state,
tribal, and local government authorities; municipal departments; community groups; and civic
organizations. The model is a tool for assembling baseline and ongoing cost data for prevention program
measurement, cost recovery, and enforcement efforts and for calculating cleanup cost estimates. The
information generated by the model can be used to publicize prevention program results, which are
necessary to obtain continued support from high-level authorities as well as to maintain cooperation
between municipal authorities and community groups.
As discussed in the U.S. Environmental Protection Agency’s (EPA) Illegal Dumping Prevention Guidebook
(http://www.epa.gov/region5/dmpguide.htm), an effective illegal dumping prevention approach requires
integration of several strategies that complement one another, including site maintenance and controls,
community outreach and involvement, targeted enforcement, and program measurement. Use of the
IDEA model provides summary data not only for evaluating prevention program efforts but also for cost-
benefit analyses, budget hearings, and grant program accountability.
The IDEA model is designed to be intuitive for ease of use. This user's guide presents the background
information used to develop the IDEA model and provides general instructions and helpful tips for using
the model to assess illegal dump site costs.

Chapter 1 2 Introduction
Specifically, Chapter 2 focuses on the scope of the model and its underlying structure, including:
• Suggested uses of the model
• Underlying assumptions
• Cost sources
• Parameters relevant to illegal dumping activities included in the model
• Parameters considered but not included in the model
• Model default values
• The illegal dump site cleanup process
Chapter 3 provides additional specific assumptions used in developing the model and general instructions,
tips, and examples for using the IDEA model spreadsheet, including:
• Data to collect for model input
• How to input data into the model
• How to adjust default cost values included in the model or override them with actual cost
values
• The flexibility of the model
Before continuing through this document, either upload the IDEA model on your computer to become
familiar with it or review the worksheets, data collection form, and flowchart included in Appendices A
through E of this document.

Chapter 2 3 Scope of the Model
CHAPTER 2 SCOPE OF THE MODEL
The formulas of the IDEA model and its option buttons, macros, and other features are embedded in
several worksheets of a Microsoft Excel spreadsheet. This format makes the model an easy-to-use cost
analysis tool that is available in a popular software platform.
Intended users of the IDEA model include state, tribal, and local government authorities; municipal
departments; community groups; and civic organizations. As indicated below, the model can be used to
assess a variety of costs associated with illegal dumping activities in urban and rural areas.
You can use the IDEA model in a variety of ways.
Estimate the costs of cleanup activities for
• An individual illegal dump site
• A specific group of illegal dump sites
• All the illegal dump sites in a given community
Assess indirect costs for
• Site surveillance activities
• Property liabilities and impairment factors
• Illegal dumping prevention activities
Conduct cost analyses for
• Comparison of different cleanup methods, what-if scenarios, and varying productivity rates
• Capital equipment investment decisions
• Evaluation of the costs and benefits of illegal dumping prevention activities
• Proposed site surveillance operations
Compile or accrue actual cleanup costs for
• Cleanup cost recovery actions
• Enforcement efforts
• Historical and trend analyses
• Budget development, goal setting, and performance measurement
A summary of the costs can be printed out in a financial statement format (see Using the Cost Summary
Worksheet in Chapter 3). This statement can be used to inform decision-makers or to give notice to
responsible parties during cost recovery actions. In addition, the financial statement allows the model
user to analyze costs and adjust them by conducting what-if analyses of specific parameters or variables.
Chapter 2 4 Scope of the Model
Before making the IDEA model available to the public, its underlying assumptions, parameters, layout, and
usability as well as the spreadsheet’s formulas and calculations were tested using actual illegal dump site
cleanup data gathered from several municipalities. The rest of this chapter discusses assumptions and
cost sources used in the model, parameters included and not included in the model, the difference
between using the model’s default values and user-supplied values, and cleanup crew process rates.
ASSUMPTIONS AND COST SOURCES
Several key assumptions used throughout the model are discussed below. Additional assumptions are
presented in specific sections of Chapter 3.
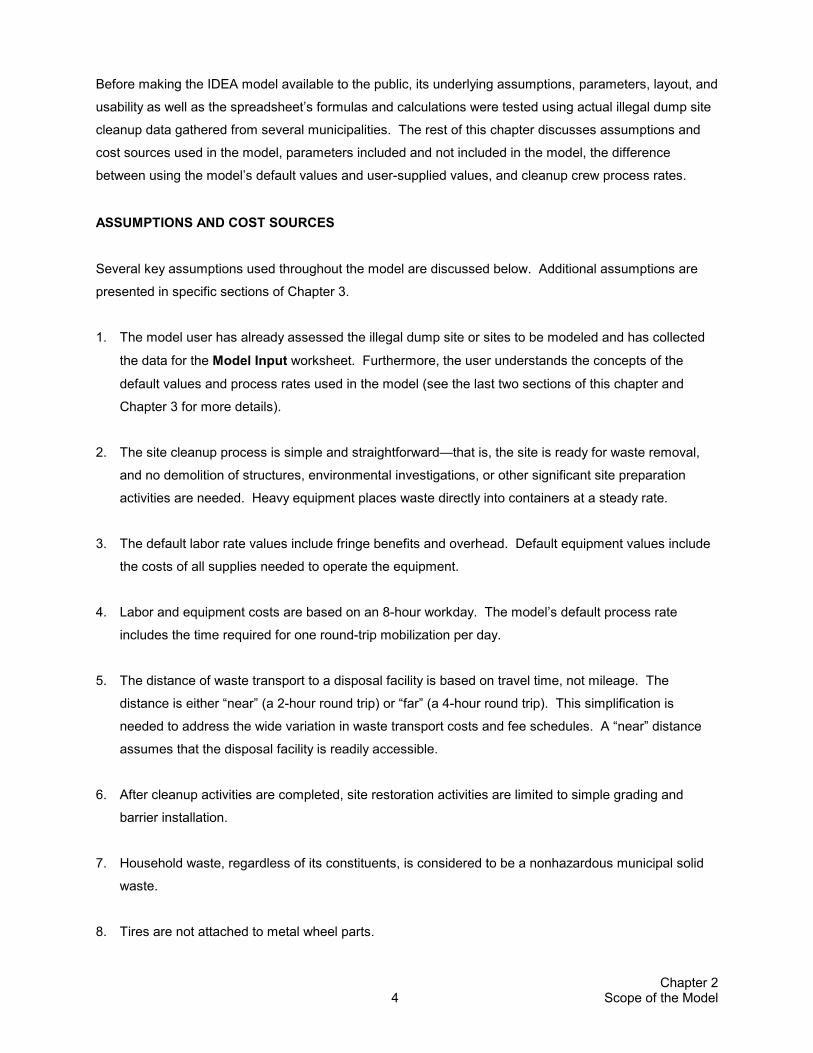
1. The model user has already assessed the illegal dump site or sites to be modeled and has collected
the data for the Model Input worksheet. Furthermore, the user understands the concepts of the
default values and process rates used in the model (see the last two sections of this chapter and
Chapter 3 for more details).
2. The site cleanup process is simple and straightforward—that is, the site is ready for waste removal,
and no demolition of structures, environmental investigations, or other significant site preparation
activities are needed. Heavy equipment places waste directly into containers at a steady rate.
3. The default labor rate values include fringe benefits and overhead. Default equipment values include
the costs of all supplies needed to operate the equipment.
4. Labor and equipment costs are based on an 8-hour workday. The model’s default process rate
includes the time required for one round-trip mobilization per day.
5. The distance of waste transport to a disposal facility is based on travel time, not mileage. The
distance is either “near” (a 2-hour round trip) or “far” (a 4-hour round trip). This simplification is
needed to address the wide variation in waste transport costs and fee schedules. A “near” distance
assumes that the disposal facility is readily accessible.
6. After cleanup activities are completed, site restoration activities are limited to simple grading and
barrier installation.
7. Household waste, regardless of its constituents, is considered to be a nonhazardous municipal solid
waste.
8. Tires are not attached to metal wheel parts.
Chapter 2 5 Scope of the Model
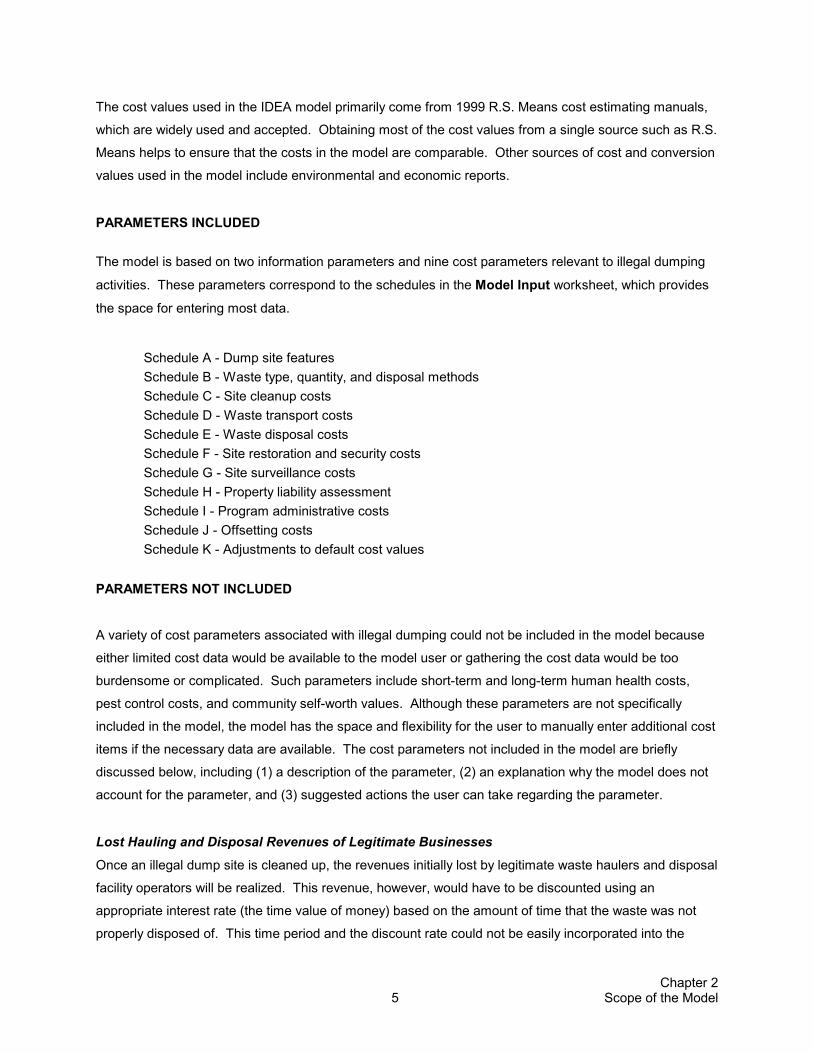
The cost values used in the IDEA model primarily come from 1999 R.S. Means cost estimating manuals,
which are widely used and accepted. Obtaining most of the cost values from a single source such as R.S.
Means helps to ensure that the costs in the model are comparable. Other sources of cost and conversion
values used in the model include environmental and economic reports.
PARAMETERS INCLUDED The model is based on two information parameters and nine cost parameters relevant to illegal dumping
activities. These parameters correspond to the schedules in the Model Input worksheet, which provides
the space for entering most data.
Schedule A - Dump site features Schedule B - Waste type, quantity, and disposal methods Schedule C - Site cleanup costs Schedule D - Waste transport costs Schedule E - Waste disposal costs Schedule F - Site restoration and security costs Schedule G - Site surveillance costs Schedule H - Property liability assessment Schedule I - Program administrative costs Schedule J - Offsetting costs Schedule K - Adjustments to default cost values
PARAMETERS NOT INCLUDED
A variety of cost parameters associated with illegal dumping could not be included in the model because
either limited cost data would be available to the model user or gathering the cost data would be too
burdensome or complicated. Such parameters include short-term and long-term human health costs,
pest control costs, and community self-worth values. Although these parameters are not specifically
included in the model, the model has the space and flexibility for the user to manually enter additional cost
items if the necessary data are available. The cost parameters not included in the model are briefly
discussed below, including (1) a description of the parameter, (2) an explanation why the model does not
account for the parameter, and (3) suggested actions the user can take regarding the parameter.
Lost Hauling and Disposal Revenues of Legitimate Businesses Once an illegal dump site is cleaned up, the revenues initially lost by legitimate waste haulers and disposal
facility operators will be realized. This revenue, however, would have to be discounted using an
appropriate interest rate (the time value of money) based on the amount of time that the waste was not
properly disposed of. This time period and the discount rate could not be easily incorporated into the

Chapter 2 6 Scope of the Model
model. However, users are encouraged to explore the value of foregone revenues to better understand
the economic impacts associated with this cost parameter.
Age of an Illegal Dump Site Time plays a critical role in the accumulation of wastes at an illegal dump site. This consideration is
important because an illegal dump site often serves as a magnet for additional dumping activities;
therefore, costs may increase between the time when the model is used and the time when the site is
actually cleaned up and secured. The model, however, does not consider the effects of time. Instead, the
model provides for evaluation of costs at only one moment in time: the date of the cost assessment.
Model users are encouraged to consider the effects of time and the potential for accumulation of
additional wastes. Of particular concern is the time that passes between conducting the cost assessment
and initiating removal of wastes and securing the dump site.
Migration of Waste The effects of waste located in a body of water, absorbed into soil, or migrating away from a site is not
considered in the IDEA model. The model assumes that waste is located in one easily accessible area.
Users should understand the effects of migrating wastes on the cleanup crew’s efficiency and the need for
special equipment. Users can then either make the appropriate adjustments to the model’s default values
or use the additional line item spaces in the model to estimate additional labor and equipment costs
associated with special circumstances.
Hazardous Waste Hazardous waste at illegal dump sites poses greater health risks and cleanup and disposal costs than
nonhazardous waste. In addition, hazardous waste is regulated under federal and state laws and involves
a different cleanup and cost recovery process than nonhazardous solid wastes. These issues make it
difficult to assess the costs of hazardous waste cleanup in a simplified model.
If hazardous or industrial liquid waste is encountered or suspected at an illegal dump site, the city or state
environmental protection office should be immediately contacted. No unqualified person should attempt to
determine the constituents of a hazardous liquid or waste, as this could have serious health
consequences.
USING MODEL DEFAULT VALUES OR USER-SUPPLIED VALUES
Cost estimates can be calculated using the IDEA model’s default values, user-entered actual values that
override the default values, or a combination of default and actual values. Dump site cleanup costs can
be quickly estimated by completing the two information parameters (Schedules A and B) and allowing the
model’s default values to calculate cleanup, transport, and disposal costs (Schedules C, D, and E). More
Chapter 2 7 Scope of the Model
accurate cost estimates can be generated by collecting and entering actual cost data specific to a site or
geographic location. In general, the more data that are gathered and entered in the model, the more
accurate its output will be. For this reason, the model user is encouraged to (1) identify and measure
wastes as accurately as possible; (2) gather specific information on local labor, equipment, and material
costs; and (3) become familiar with the scope of local illegal dumping prevention and enforcement
programs.
Techniques for overriding or adjusting the default values are discussed in detail in Chapter 3 under
Schedule C. An example data collection form is provided in Appendix D.
CLEANUP CREW PROCESS RATE
The cleanup crew process rate is the most important variable in the site cleanup cost estimate. A process
rate represents the amount of waste that can be cleaned up by a cleanup crew in 1 hour. The model uses
an hourly process rate to determine the total length of time that equipment and labor will be employed to
clean up the total amount of waste estimated to be present at a dump site.
The IDEA model assumes a straightforward cleanup process with no adverse conditions. Therefore, the
default process rate should be considered an “ideal” process rate, the use of which tends to
underestimate costs. All “real world” impediments to the actual cleanup process, such as restricted site
access, would act to reduce the rate.
In reality, a process rate reflects the productivity of an entire cleanup crew, which depends on the size,
quantity, and efficiency of the heavy equipment used and the types and total amount of waste to be
removed.
The various process rates used in the model and ways to make adjustments to them are discussed in
detail in Chapter 3 under Schedule C.

Chapter 3 8 Using the Model
CHAPTER 3 USING THE MODEL
This chapter presents background information and general guidance for using the IDEA model. The
chapter is divided into the following major sections: (1) hardware and software requirements, (2) getting
started, (3) using the Model Input worksheet, (4) using the Adjusting Default Values worksheet,
(5) using the Cost Summary worksheet, (6) using the Tools worksheet, and (7) the Do Not Alter worksheet.
HARDWARE AND SOFTWARE REQUIREMENTS
To operate the IDEA model, you will need to have an IBM-compatible personal computer and Microsoft
Excel for Windows 97, Version 5.0 or higher.
The model is in an electronic spreadsheet. You enter information (numbers, equations, or text) into yellow
data entry cells. Using an equal (=) sign, you can do quick calculations directly in a data entry cell. For
example, if you know that a lot size is 300 by 300 feet, you can quickly enter the square footage in a cell
that requests such data. Simply type the following: = 300 * 300 (then press Enter)
GETTING STARTED
Open the Excel software on your computer. Then open the file titled IDEA Model. Before the model is
completely operable, an option box will automatically pop up. At this point, you should press the “Enable
Macros” button. The spreadsheet will now be open and available for use.

Chapter 3 9 Using the Model
Immediately save this spreadsheet under a different name so that
you always have an unchanged copy. Give the new copy a
descriptive name, such as the name of the dump site or
community you are going to evaluate. Each time you assess a
new site, save the spreadsheet under a new file name to avoid
overwriting or loss of data on the last site you assessed using the
model.
The spreadsheet has five tabs at the bottom titled Model Input, Adjusting Default Values, Cost
Summary, Tools, and Do Not Alter. Clicking on a tab will open a worksheet in which data can be
entered or reviewed. Each worksheet is discussed in detail below. Blank copies of the Model Input,
Adjusting Default Values, and Cost Summary worksheets are provided in Appendices A through C,
respectively.
USING THE MODEL INPUT WORKSHEET
The Model Input worksheet provides the space in which you will enter most of your data. This worksheet
is divided into schedules that correspond to the model’s parameters (see Chapter 2). The schedules
consist of drop-down menus, data entry cells, and color-coded text to help you move through them as
follows:
• Drop-down menus allow you to push a button to select one of several options, usually a variable, or to switch between the default and manual modes.
Don’t forget to IMMEDIATELY save your spreadsheet under a different name. Then frequently save your spreadsheet when entering data.

Chapter 3 10 Using the Model
• Data entry cells are the only cells in which you can enter data and are colored yellow. All other cells are write-protected, so you don’t have to worry about accidentally deleting default values or formulas.
• Instructions are provided in purple to help guide you through certain sections. Error messages and important information are provided in red text. Total and subtotal costs are highlighted in green cells.
For easy reference, the tab(s) along the right margin of the page indicate the schedule(s) discussed on
that page.
Schedule A. Identify Illegal Dump Site Features
Schedule A collects general information about the site or sites that you are about to evaluate. This
schedule consists of drop-down menus and data entry cells. The general dump site feature information
entered here is used in the Cost Summary worksheet as well as in several other schedules of the Model
Input worksheet. If you are using the model’s original default values, you must enter your dump site’s zip
code in Schedule A to automatically adjust the model’s “national average” values to your geographic area.
The Model Input worksheet is designed to be intuitive for ease of use. All you need to do is look for the words “Start Here” at the top of Schedule A. Then follow the instructions and enter data as you work your way down through each schedule of the worksheet.

Chapter 3 11 Using the Model
Limitations The first question in Schedule A asks how you intend to use the model. Your options are to use the model
to (1) estimate costs of an individual site, (2) estimate costs of several sites, or (3) compile actual costs.
Using the model to estimate costs or compile actual costs for an individual site is fairly straightforward.
However, to assess multiple sites, you will need to complete some work outside of the spreadsheet. Your
options include the following:
1. Run the model for each individual site and add up the costs (this option is best if you are
evaluating only a few sites, or if you are compiling actual costs of several sites):
• Input data, adjust default values if necessary, and run the model separately for each site
• Print out the 1-page Cost Summary (or the 8-page Model Input worksheet) for each site
• Check the results for double counting of costs among the sites
• Add up each schedule’s total by hand and then input the sums in a separate model for the group of sites
2. Run the model using aggregate waste volume (this option is best if you are assessing a large number of sites):
• Add up the total waste volume (by type) estimated to be present at all the sites you are
evaluating by hand (see note below regarding data collection at multiple sites)
• Enter the aggregated information in Schedules A and B and review the other schedules for accuracy or additional data input
• Make necessary adjustments to the process rates to account for smaller sites or multiple mobilizations in a single workday (see Schedule C, Table C-5) and run the model
Schedule B. Select Values for Waste Type, Quantity, and Disposal Method
Schedule B shows the standard waste types that
the model assesses. Hazardous wastes are not
assessed by the model but are included in this
schedule as a precaution so users can be
alerted to the actions to take if hazardous wastes
are encountered.
This schedule consists of data entry cells for the
waste volume and various drop-down menus for
selecting the unit of measure, disposal method,
and distance to the disposal facility. Purple text
guides you through the data entry process.
It is assumed that you have estimated the volume of the waste during an inspection of the illegal dump site or group of sites. You should use a data collection form in the field to organize illegal dump site information.
An example data collection form is provided in Appendix D. However, you are encouraged to create your own data collection form based on the information in the Model Input worksheet flow chart in Appendix E in order to meet your particular needs.

Chapter 3 12 Using the Model
The model allows you to enter the unit of measure that you used when estimating the waste quantity in the
field. In Schedule C, the model converts the unit of measure entered to a standard or default unit that is
used to calculate costs. Table B-1 shows the values used to convert standard waste types to an average
unit.
Table B-1. Standard Waste Types and Weight and Volume Conversions Used in Model
Standard Waste Types Standard or Default Unit
Conversion to an Average Unit Reference
Mixed or Unknown cubic yards 700 pounds per cubic yard 1 Appliances units 177 pounds per appliance 2 Tires units 21 pounds per car tire, 70 pounds per
truck tire, or 45.5 pounds for a variety of tires (the average for car and truck tires)
3
Brush or Landscape cubic yards 300 pounds per cubic yard 4 Household cubic yards 225 pounds per cubic yard 5 Construction and Demolition (C&D)—Building Materials
cubic yards 750 pounds per cubic yard 6
C&D—Concrete cubic yards 2,000 pounds per cubic yard 7 Hazardous not applicable See Chapter 2 for a discussion of
hazardous wastes. not applicable
References:
1. CalRecovery, Inc. 1993. “Conversion Factor Study In-Vehicle and In-Place Waste Densities.” Report No.
1310. Average of in-truck densities for commercial sector wastes. 2. EPA. 1997. “Measuring Recycling, A Guide for State and Local Governments.” Office of Solid Waste and
Emergency Response. EPA530-R-97-011. Average weight of a washing machine, clothes dryer, oven/range, refrigerator, and water heater tank.
3. EPA. 1997. Reported values, no averages. 4. EPA. 1997. Rounded average of a weight range for uncompacted grass clippings and leaves. 5. EPA. 1997. Middle of a weight range for uncompacted residential wastes. 6. CalRecovery, Inc. 1993. Average of midrange of in-truck densities for nonconcrete C&D wastes. 7. CalRecovery, Inc. 1993. Reported value, not an average.
C&D waste can vary widely in its weight depending on the specific material
involved. The model allows for this variation by providing two C&D categories.
C&D—Building Materials assumes that the waste is composed of roofing, siding,
wood, or similar “lighter” materials. C&D—Concrete assumes that the waste is
composed of concrete, brick, asphalt, metal, or similar “heavier” materials.
Some wastes that may be encountered at an illegal dump site are not included among the model's
standard waste types. In general, however, you can include most nonstandard waste types with the Mixed
or Unknown waste type. Or you can use your judgment and include a nonstandard waste type with a
Use the Tools worksheet to make volume, area, and weight conversions.

Chapter 3 13 Using the Model
standard waste type that has a similar weight (see Table B-1). Just be sure that the nonstandard waste
type will be disposed of in the same way as the standard waste type you decided to include it with.
Schedule C. Estimate Site Cleanup Costs
All you need to do in order to quickly estimate site cleanup costs is enter the dump site's zip code in
Schedule A and complete Schedule B. You can do this because Schedule C uses a standardized site
cleanup method based on the waste type. The model standardizes the heavy equipment, containers,
process rate, and labor needed to clean up a site and provides default values for the quantities, time rates,
and costs of these items. Drop-down menus and purple text will guide you through Schedule C and its
four parts.
Schedule C is divided into four parts. Part 1 allows you to enter a lump sum value for the site cleanup
cost (for example, a contractor’s estimate) and then go on to Schedule D. Part 2 estimates cleanup costs
for the Mixed or Unknown, Household, C&D—Building Materials, C&D—Concrete, and Brush or
Landscape waste types. These wastes are assumed to be cleaned up using the same method and at the
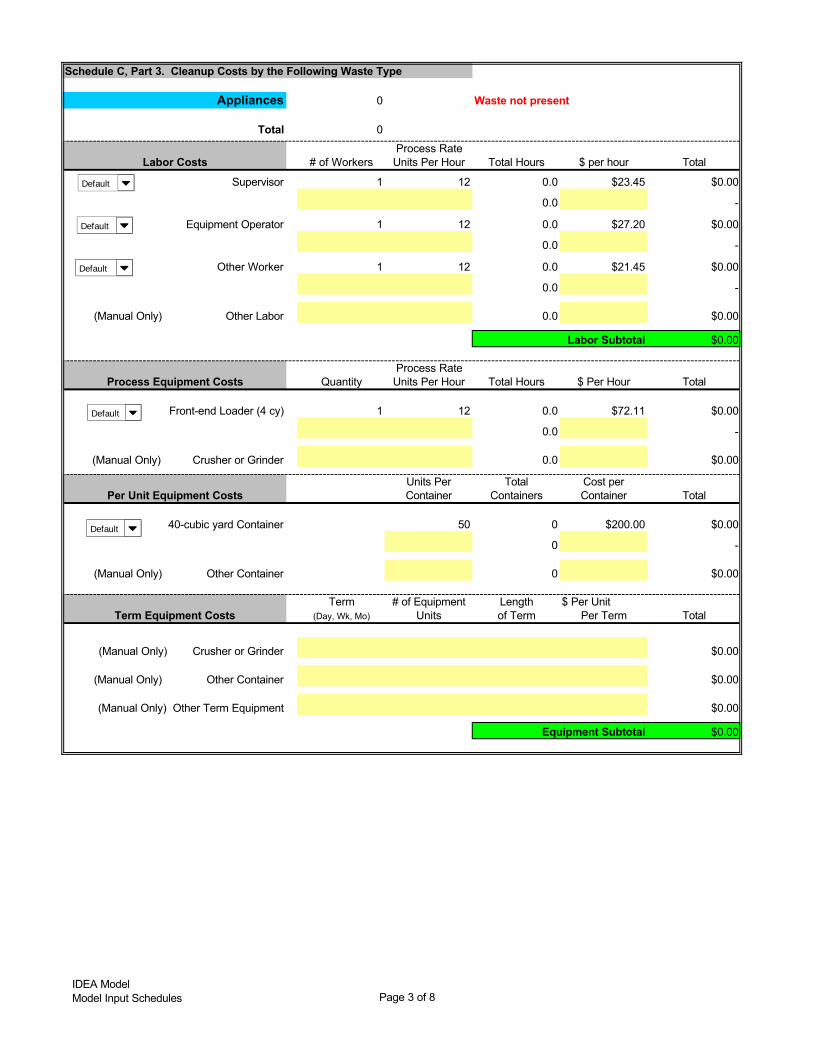
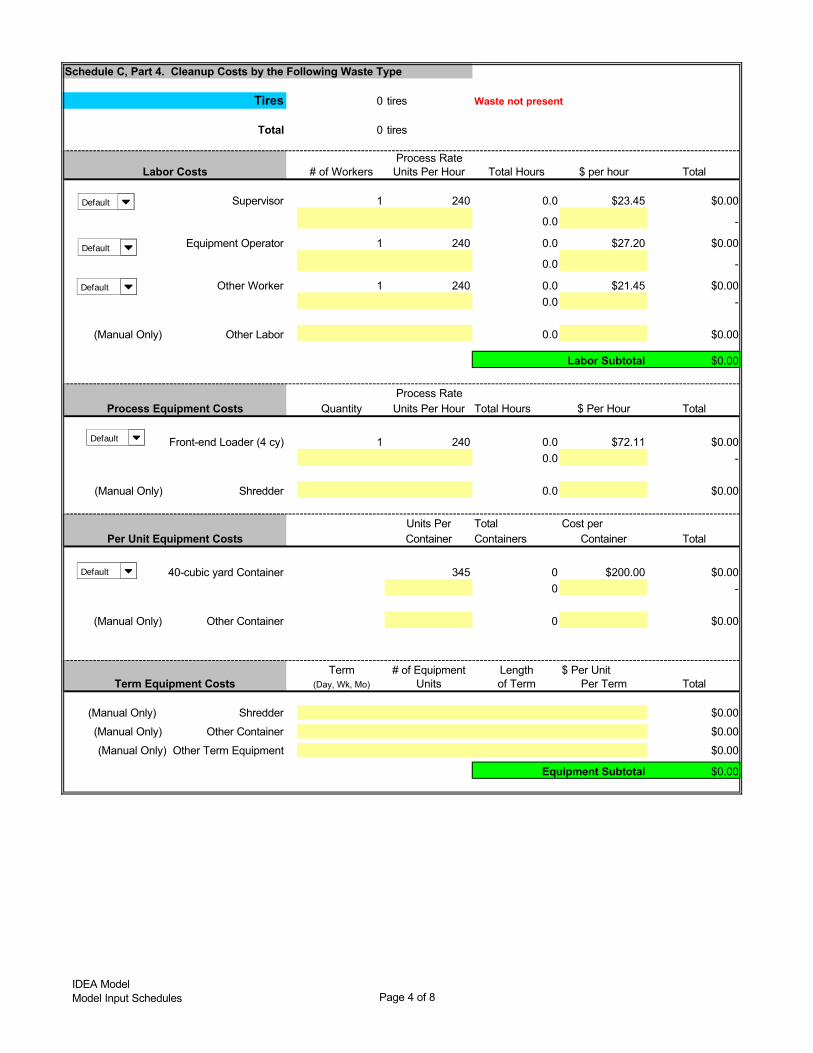
same process rate. Part 3 estimates cleanup costs for Appliances, and Part 4 estimates cleanup costs for
Tires. These wastes are addressed in separate parts because the model uses either different default
labor, equipment, or process rate values to calculate cleanup costs for them.
The following sections discuss the default labor, process equipment, term equipment, per unit equipment
and process rates used in the model; how to calculate and make changes to the default process rates;
how to change default values; how to add just cost values on a line-by-line basis using the manual mode;
and some of the limitations of Schedule C.
Default Labor The model assumes that all cleanup crew members regardless of their duties will be at a site for the same
amount of time. The total hours that labor will be needed at a site is a function of the default process rate
and the type and volume of waste present. Labor wage rates include direct pay plus any required fringe
benefits and overhead but not profit. The model’s default labor types and hourly wage rates are
summarized in Table C-1.

Chapter 3 14 Using the Model
Table C-1. Default Labor Types and Hourly Wage Rates
Waste Type Number of Personnel Labor Type Hourly Wage
Rate 1 Supervisor $23.45 1 Front-end loader operator $27.20
Mixed or Unknown, Household, C&D, and Brush or Landscape 2 Dump truck driver $22.10
1 Supervisor $23.45 1 Front-end loader operator $27.20
Appliances and Tires
1 Other worker $21.45
Be sure to compare your actual cleanup crew labor makeup to the model’s default labor types. If they are
similar, you know that the cost estimate will be reasonable. If they are very different in terms of the
numbers, types, costs, or efficiencies of personnel, make the necessary spreadsheet modifications using
the methods described in the sections of this chapter titled Changing Process Rates, Changing Default
Values, and Manual Mode.
Default Process Equipment Process equipment consists of the heavy equipment that will be used to clean up an illegal dump site.
The model assumes that all process equipment will be at a site for the same amount of time. The total
time that equipment will be needed at a site is a function of the default process rate and the type and
volume of waste present. The model’s default process equipment types and hourly costs are summarized
in Table C-2.
Table C-2. Default Process Equipment Types and Hourly Costs
Waste Type Number of Equipment Units
Equipment Type Hourly Cost
1 Front-end loader $72.11 Mixed or Unknown, Household, C&D, and Brush or Landscape
2 20-cubic-yard dump truck $59.06
Appliances and Tires 1 Front-end loader $72.11
Be sure to compare your actual process equipment types to the model’s default equipment types. If they
are similar, you know that the cost estimate will be reasonable. If they are very different in terms of the
numbers, types, costs, or efficiencies of equipment units, make the necessary spreadsheet modifications
using the methods described in the sections of this chapter titled Changing Process Rates, Changing
Default Values, and Manual Mode.
Term Equipment Some equipment used during a cleanup will be available only on a daily, weekly, or monthly basis.
Equipment that is priced based on the duration of its use is referred to as “term equipment” because it is

Chapter 3 15 Using the Model
used for a specific term or period of time. The model allows you to manually enter the term (such as day,
week, or month), the number of equipment units, the length of term (as a number), and the costs of
several term equipment options.
Per-Unit Equipment Per-unit equipment (such as roll-off boxes and other containers) is based on waste volume, or the number
of units (such as tires or appliances) that will fit into it, rather than the duration of a cleanup. This
equipment is assumed to be at a dump site until it is full at which point it is transported to a disposal facility
and another empty unit immediately replaces it.
The default per-unit equipment consists of 40-cubic-yard roll-off containers that are used to accumulate
Appliances and Tires. Each container is assumed to cost $200 and to hold either 50 individual appliance
units or 345 tires. The model calculates the number of containers needed based on this assumption. The
labor and roll-off truck equipment costs relevant to the drop-off and pick-up of a container is assumed to
be included in the waste transport costs of Schedule D.
Default Process Rates As mentioned in Chapter 2, process rates are the most
important variables in the site cleanup cost estimate. The
model uses the process rate to determine the length of time
that equipment and labor will be needed to clean up the total
amount of waste at a dump site. The model converts the
amount of waste indicated in Schedule B into a default unit.
This value is then divided by the process rate to determine the
value in the “Total Hours” column of Schedule C.
The default process rate is calculated based on the waste
type and an assumed cleanup process. The Mixed or
Unknown, Household, C&D—Building Materials, C&D—
Concrete, and Brush or Landscape waste types are assumed to be cleaned up using the same process.
Appliances and tires are cleaned up using different processes.
Regardless of the waste type, the default cleanup process is dependent on the type of heavy equipment
used to remove wastes at a dump site. Each heavy equipment type is assumed to have a particular
capacity that determines the amount of waste that it can handle in one “trip.” A single trip consists of
using the equipment to reshape a waste pile, scoop up wastes, transport them to a disposal container,
and then return to the waste pile. The model assumes that either a 20-cubic-yard dump truck or a roll-off
truck leaves the site as soon as it is full and that an empty 20-cubic-yard dump truck or roll-off container is
The process rate is essentially the productivity of your cleanup crew. This productivity is a function of numerous variables, including heavy equipment bucket size, the number of mobilizations made during an 8-hour workday, and dump site logistics. Adjusting the process rate greatly affects the cost estimate, so understanding how this variable changes in the “real world” will allow you to generate better cost estimates.
Chapter 3 16 Using the Model
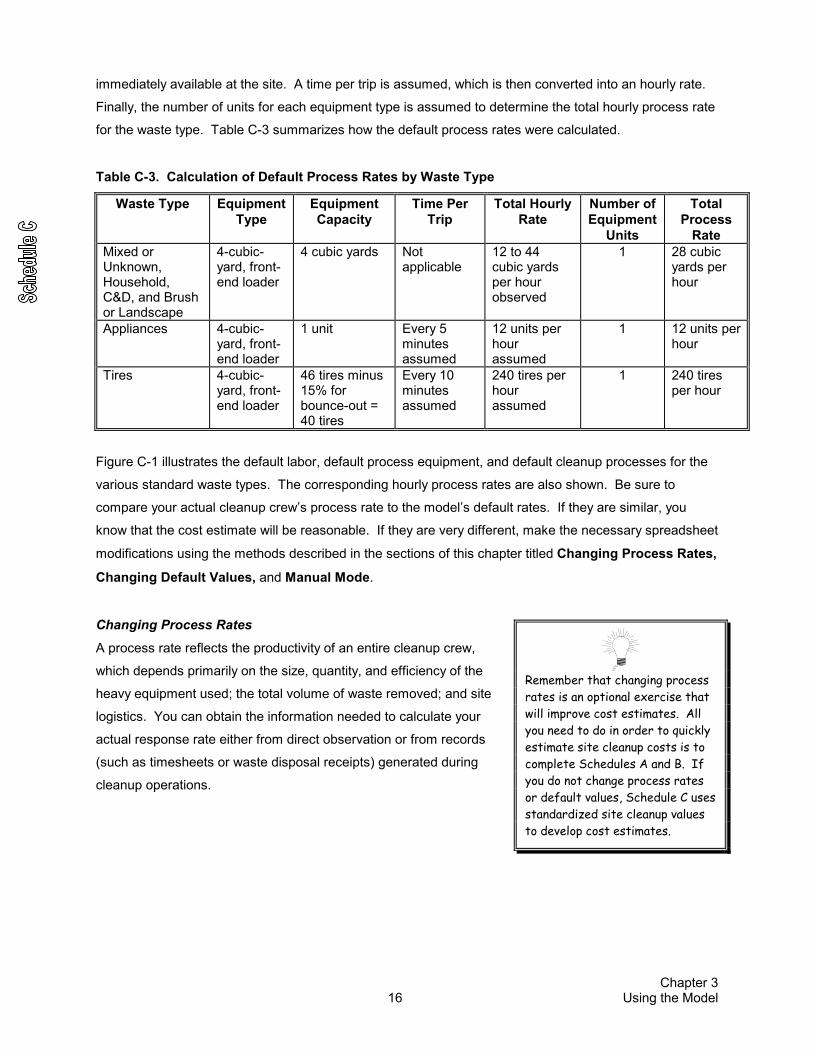
immediately available at the site. A time per trip is assumed, which is then converted into an hourly rate.
Finally, the number of units for each equipment type is assumed to determine the total hourly process rate
for the waste type. Table C-3 summarizes how the default process rates were calculated.
Table C-3. Calculation of Default Process Rates by Waste Type
Waste Type Equipment Type
Equipment Capacity
Time Per Trip
Total Hourly Rate
Number of Equipment
Units
Total Process
Rate Mixed or Unknown, Household, C&D, and Brush or Landscape
4-cubic-yard, front-end loader
4 cubic yards Not applicable
12 to 44 cubic yards per hour observed
1 28 cubic yards per hour
Appliances 4-cubic-yard, front-end loader
1 unit Every 5 minutes assumed
12 units per hour assumed
1 12 units per hour
Tires 4-cubic-yard, front-end loader
46 tires minus 15% for bounce-out = 40 tires
Every 10 minutes assumed
240 tires per hour assumed
1 240 tires per hour
Figure C-1 illustrates the default labor, default process equipment, and default cleanup processes for the
various standard waste types. The corresponding hourly process rates are also shown. Be sure to
compare your actual cleanup crew’s process rate to the model’s default rates. If they are similar, you
know that the cost estimate will be reasonable. If they are very different, make the necessary spreadsheet
modifications using the methods described in the sections of this chapter titled Changing Process Rates,
Changing Default Values, and Manual Mode.
Changing Process Rates A process rate reflects the productivity of an entire cleanup crew,
which depends primarily on the size, quantity, and efficiency of the
heavy equipment used; the total volume of waste removed; and site
logistics. You can obtain the information needed to calculate your
actual response rate either from direct observation or from records
(such as timesheets or waste disposal receipts) generated during
cleanup operations.
Remember that changing process rates is an optional exercise that will improve cost estimates. All you need to do in order to quickly estimate site cleanup costs is to complete Schedules A and B. If you do not change process rates or default values, Schedule C uses standardized site cleanup values to develop cost estimates.
Chapter 3 17 Using the Model
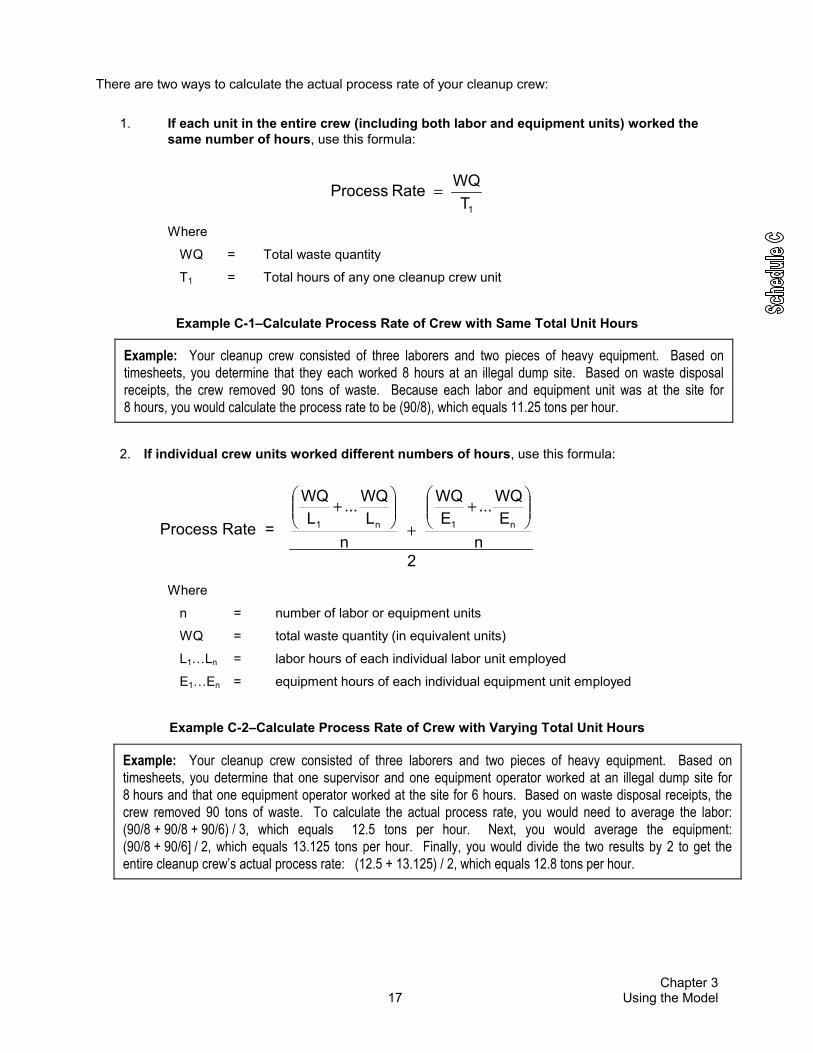
There are two ways to calculate the actual process rate of your cleanup crew:
1. If each unit in the entire crew (including both labor and equipment units) worked the same number of hours, use this formula:
1TWQRateProcess =
Where
WQ = Total waste quantity
T1 = Total hours of any one cleanup crew unit
Example C-1–Calculate Process Rate of Crew with Same Total Unit Hours
2. If individual crew units worked different numbers of hours, use this formula:
2
nEWQ...
EWQ
nL
WQ...L
WQn1n1���
����
�+
+���
����
�+
Where
n = number of labor or equipment units
WQ = total waste quantity (in equivalent units)
L1…Ln = labor hours of each individual labor unit employed
E1…En = equipment hours of each individual equipment unit employed
Example C-2–Calculate Process Rate of Crew with Varying Total Unit Hours
Example: Your cleanup crew consisted of three laborers and two pieces of heavy equipment. Based on timesheets, you determine that they each worked 8 hours at an illegal dump site. Based on waste disposal receipts, the crew removed 90 tons of waste. Because each labor and equipment unit was at the site for 8 hours, you would calculate the process rate to be (90/8), which equals 11.25 tons per hour.
Example: Your cleanup crew consisted of three laborers and two pieces of heavy equipment. Based on timesheets, you determine that one supervisor and one equipment operator worked at an illegal dump site for 8 hours and that one equipment operator worked at the site for 6 hours. Based on waste disposal receipts, the crew removed 90 tons of waste. To calculate the actual process rate, you would need to average the labor: (90/8 + 90/8 + 90/6) / 3, which equals 12.5 tons per hour. Next, you would average the equipment: (90/8 + 90/6] / 2, which equals 13.125 tons per hour. Finally, you would divide the two results by 2 to get the entire cleanup crew’s actual process rate: (12.5 + 13.125) / 2, which equals 12.8 tons per hour.
Process Rate =

18Chapter 3
Using the Model
Figu
re C
-1.
Illus
trat
ion
of th
e D
efau
lt C
lean
up C
rew
s, a
nd C
lean
up P
roce
sses
and
Pro
cess
Rat
es fo
r the
Sta
ndar
d W
aste
Typ
es.
Dis
po
sal
Faci
lity
Dis
po
sal
Faci
lity
Lab
or
and
Eq
uip
men
t
Tire
s @
240
Tire
s pe
r ho
ur28
cub
ic y
ards
per
hou
rA
pplia
nces
@ 1
2 U
nits
per
hou
r
Lab
or
and
Eq
uip
men
t
Illeg
al D
um
p S
ite
TIR
ES
AN
D A
PP
LIA
NC
ES
MIX
ED
OR
UN
KN
OW
N,
HO
US
EH
OL
D, C
&D
, AN
DB
RU
SH
OR
LA
ND
SC
AP
E W
AS
TE
S
DE
FAU
LT P
RO
CE
SS
RAT
ED
EFA
ULT
PR
OC
ES
S R
ATE
Chapter 3 19 Using the Model
If you take the time to measure cleanup crew efficiencies, you will be able to observe their overall
productivity and gain a better understanding of the significance of this variable. In addition, you will be
able to determine how site conditions and other factors affect productivity, which will allow you to generate
better cost estimates.
Based on limited observations of the efficiencies of cleanup crews during model development, the process
rate has been found to be affected by three specific variables:
• The bucket size and quantity of the heavy equipment used to load waste into containers
• The number of mobilizations required in an 8-hour workday
• Dump site logistics such as ease of site access, equipment maneuverability, and accessibility
of wastes
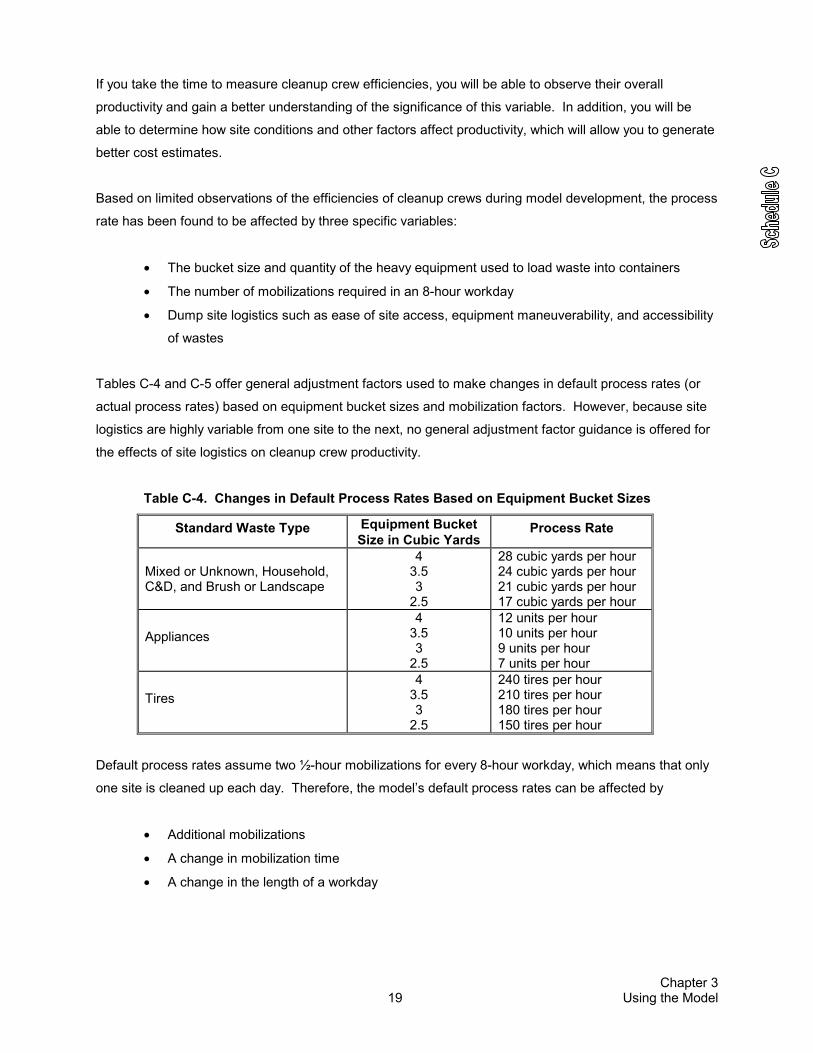
Tables C-4 and C-5 offer general adjustment factors used to make changes in default process rates (or
actual process rates) based on equipment bucket sizes and mobilization factors. However, because site
logistics are highly variable from one site to the next, no general adjustment factor guidance is offered for
the effects of site logistics on cleanup crew productivity.
Table C-4. Changes in Default Process Rates Based on Equipment Bucket Sizes
Standard Waste Type Equipment Bucket Size in Cubic Yards
Process Rate
Mixed or Unknown, Household, C&D, and Brush or Landscape
4 3.5 3
2.5
28 cubic yards per hour 24 cubic yards per hour 21 cubic yards per hour 17 cubic yards per hour
Appliances 4
3.5 3
2.5
12 units per hour 10 units per hour 9 units per hour 7 units per hour
Tires 4
3.5 3
2.5
240 tires per hour 210 tires per hour 180 tires per hour 150 tires per hour
Default process rates assume two ½-hour mobilizations for every 8-hour workday, which means that only
one site is cleaned up each day. Therefore, the model’s default process rates can be affected by
• Additional mobilizations
• A change in mobilization time
• A change in the length of a workday

Chapter 3 20 Using the Model
The percentages presented in Table C-5 can be applied to your actual process rate as well as the model's
default process rate.
Table C-5. Changes to Process Rate Based on Multiple Mobilizations
Number of Sites Cleaned Up per 8-Hour Workday
Lower the Process Rate by
1 13% * 2 19% 3 25% 4 31% 5 38%
Note: * For actual process rates only. Do not apply this to the default process rate
because it already assumes one site cleanup per day.
This section offers general guidelines for adjusting default and actual process rates. Once you have a
process rate that you want to use in place of the default process rate, you can make the necessary
spreadsheet modifications using the methods described in the next two sections of this chapter titled
Changing Default Values and Manual Mode.
Changing Default Values You can generate more accurate cost estimates and
conduct cost analyses by collecting and entering actual
cost data specific to a site and location. In general, the
more data you gather and enter in the model, the more
accurate the output will be. For this reason, you are
encouraged to (1) identify and measure wastes as
accurately as possible; (2) gather specific information on
local labor, equipment, and material costs; and (3) become
familiar with the extent and characteristics of local illegal
dumping prevention and enforcement programs.
Techniques for overriding or changing default values include the following:
• In Schedule A, localize the “national average” default cost values by entering the illegal dump
site’s zip code.
• In the manual mode (see the next section), enter specific costs on a line-by-line basis.
In the Adjusting Default Values worksheet, enter the process rate and the labor, equipment, disposal, and other costs you have knowledge of, and then save the file. Now when you open the model, your actual values will be available.

Chapter 3 21 Using the Model
• In the Adjusting Default Values worksheet, enter your actual cost values for any or all of the
process rate labor, equipment, material, or disposal site default values. This will change the
default values used throughout the model, thereby customizing it to your specific circumstances
(see the Using the Adjusting Default Values Worksheet section later in this chapter).
• For cost estimates generated after 1999, all values can be adjusted using price-inflator indices
such as the consumer price index or producer price index (which are available from the U.S.
Department of Labor or at various financial web sites). Enter the percentage change in the
appropriate data entry cell in Schedule K.
• Use a combination of default and actual costs, depending on which costs are available to you.
Manual Mode You can adjust cost values on a line-by-line basis using the manual
mode. A drop-down menu allows you to select either the default or
manual mode for calculating a particular line item value. In the drop-
down menu, select Manual. The default value disappears, and an
instruction line appears that says “enter manual #s here�.” The
arrow points to a yellow-shaded data entry cell.
For line items that have a default or manual option, you can use either the default values or the manual
values in the calculation but not a mixture of the two types. This prevents double counting and allows you
to switch between the two modes in order to see differences, compare alternatives, and conduct what-if
analyses.
If you want to zero out a particular default item, select Manual and then do not enter any data.
Chapter 3 22 Using the Model
Limitations As a result of the model’s incorporation of a
standardized cleanup method, all waste is assumed to
be managed by the labor and equipment at a
standardized process rate. Thus, the model does not
allow for varying rates of processing or for
percentages of a particular waste volume being
processed at different rates. In reality, the process
rate is affected by numerous site-specific and
unpredictable variables.
For manual entries, the model does not calculate the “length of term” values for term equipment. This is
the case because the basis for the term can depend on more than one variable (such as the length of time
needed for waste cleanup and the waste volume).
Schedule D. Estimate Waste Transport Costs
Waste transport typically involves a per load charge,
may involve a per mile charge, and can involve other
fees when the waste is handled by hauling and cartage
companies. However, the model assumes that waste
transport will incur labor costs and equipment charges
based on the time required for a round trip from the
illegal dump site to the disposal facility.
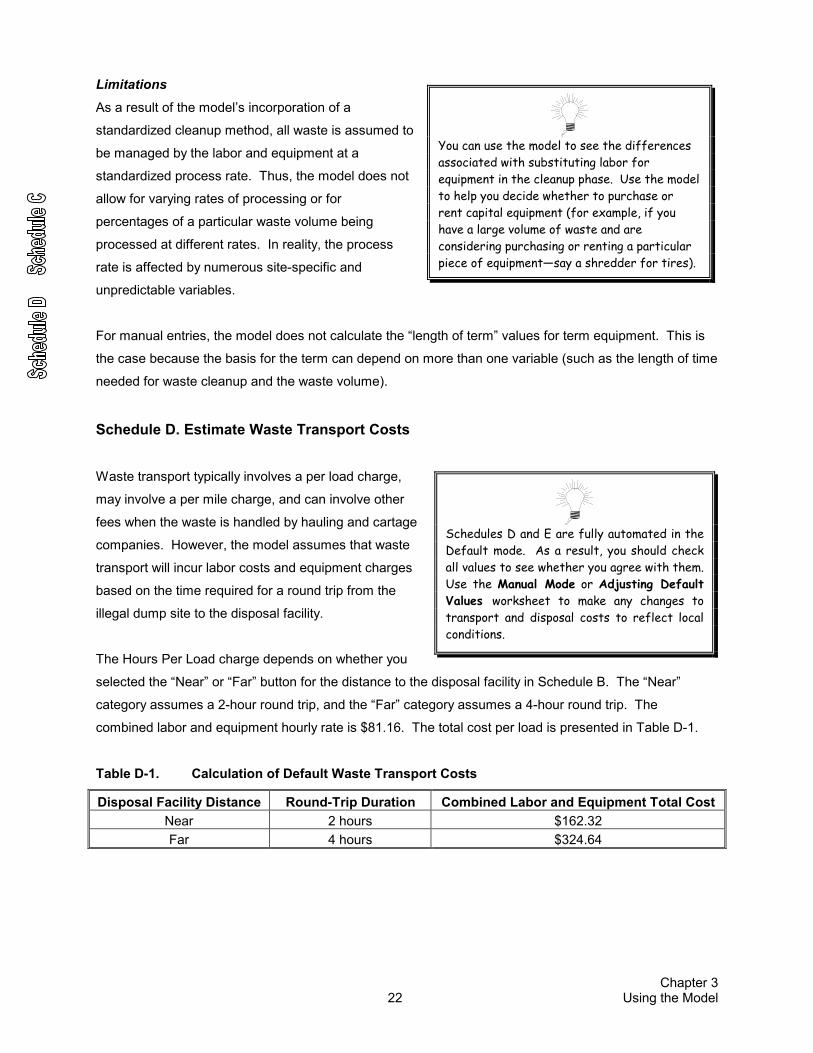
The Hours Per Load charge depends on whether you
selected the “Near” or “Far” button for the distance to the disposal facility in Schedule B. The “Near”
category assumes a 2-hour round trip, and the “Far” category assumes a 4-hour round trip. The
combined labor and equipment hourly rate is $81.16. The total cost per load is presented in Table D-1.
Table D-1. Calculation of Default Waste Transport Costs
Disposal Facility Distance Round-Trip Duration Combined Labor and Equipment Total Cost Near 2 hours $162.32 Far 4 hours $324.64
You can use the model to see the differences associated with substituting labor for equipment in the cleanup phase. Use the model to help you decide whether to purchase or rent capital equipment (for example, if you have a large volume of waste and are considering purchasing or renting a particular piece of equipment—say a shredder for tires).
Schedules D and E are fully automated in the Default mode. As a result, you should check all values to see whether you agree with them. Use the Manual Mode or Adjusting Default Values worksheet to make any changes to transport and disposal costs to reflect local conditions.

Chapter 3 23 Using the Model
Schedule E. Estimate Disposal Costs
Disposal costs are based on either the total weight or total volume of the wastes being disposed of and
the disposal method you selected in Schedule B. The model calculates disposal costs as indicated in
Table E-1.
Table E-1. Default Disposal Facility Costs
Disposal Facility Cost per Ton Solid waste landfill or transfer station $37.00 Solid waste incinerator $40.00 C&D landfill $42.00 C&D recycler $28.00 Compost landfill $20.00 Metal recycler $22.00 Tire recycler $26.00 Tire incinerator $31.00
A column titled “Waste Total (in cu yds)” is provided for manual entries.
Limitations You cannot divide the amount of a single waste type among different disposal methods (for example, half
the tires at a site go to a recycler and the other half to an incinerator).
If you do not expect to incur disposal costs for wastes that have been cleaned up, you can adjust the
waste totals using the manual mode. To do this, look at the Waste Total amount calculated by the model
and subtract the value of the materials not disposed of. Then enter the new Waste Total value and the
disposal costs using the manual mode.
The model allows you to change the amount of waste present at an illegal dump site in order to see the impact on costs. To do this, when you have completed all the schedules, save your work and print out the Cost Summary. Then vary the amount of waste or select a different disposal facility and print out a new Cost Summary. If you do not want to lose your original data, do not save the new information unless you do so under a new file name.

Chapter 3 24 Using the Model
Schedule F. Estimate Site Restoration and Security Costs
After a site has been cleaned up, the model can estimate certain site restoration and security costs.
However, the model does not automatically calculate such costs. Most of the variables needed to
calculate these costs must be entered manually because the variables are highly site-specific. However,
the model does provide a few default unit cost values, which are presented in Table F-1.
Table F-1. Calculation of Default Site Restoration and Security Costs
Activity User Input Needed Model Default Cost
Grading square feet (area) Costs of front-end loader labor ($32.40) and equipment ($46.65) operating at a rate of 3,000 square feet per hour
Fencing linear feet
number of gates
$30 per linear foot of fencing
$250 per gate
Barrier installation (as an alternative to fencing)
linear feet $28 per linear foot
Sign installation linear feet 1 sign for every 100 linear feet at $48 per sign
Police surveillance (short-term) hours None
Grading of a site would be required after removal of wastes if uneven terrain or soil piles existed and you
think it would be desirable to level the terrain in order to make the property more salable or less attractive
as an illegal dump site. This activity is assumed to consist of using a front-end loader (assumed to be
already on site) to level the site at a rate of 10 minutes per 300 square feet (or for rough grading, at a rate
of 190 square yards per hour). Using the front-end loader default values, the model calculates the labor
and equipment costs if a square-foot area is provided. You can also manually enter additional activities
associated with site restoration such as seeding, demolition, or infrastructure improvement.
Fencing of a site would be required to completely limit access to the site. The fencing is assumed to
consist of posts, 10-foot-tall cyclone fencing, and a number of 10-foot-wide gates selected by the user.
The model calculates the labor and equipment costs if the linear feet of fencing needed to surround the
site is provided.
As an alternative to fencing, solid barriers could be installed across site access points. These barriers are
assumed to consist of concrete barricades typically used at highway construction sites. The model
assumes that users will incur barrier purchase, transport, and installation costs, and the model calculates
the costs if the linear feet to be covered is provided.
Signs are needed to indicate that no dumping is allowed at a site. If you have estimated costs for fencing
or barriers, the model assumes installation of one sign per 100 linear feet covered. The model applies this

Chapter 3 25 Using the Model
rate to the total linear feet value that you provided. The model calculates the costs of the labor and
materials needed to install signs. To bypass the automatic assumption of one sign every 100 linear feet,
you can manually input the total number of signs desired.
Limitations Default values do not reflect economies of scale that are likely to apply at larger sites. During an actual
large-scale cleanup, the cost per unit tends to decrease as more units are purchased. The model,
however, calculates the site restoration costs regardless of site size.
Schedule G. Estimate Site Surveillance Costs
Site surveillance costs are future direct costs that may be incurred. You should estimate these costs if
police surveillance is desired to catch illegal dumpers at heavily used sites or if you want to quantify the
value of community surveillance.
The model will calculate site surveillance costs if you provide the term, labor rate, equipment rate, and
material costs applicable to this activity. Costs can be estimated depending on the term (the duration of
the surveillance in either hourly, daily, or total terms). The model does not automatically calculate these
costs and does not provide default cost values.
You can estimate the total number of hours (manhours) or the number of days using the Total Hours
Scratch Pad imbedded in the model. Here you can enter the number of people to be used, the number of
hours per day that they will work, and the number of days that they will work to calculate the hourly term
total. You can also enter only the number of people and the hours to be worked per day to get a daily term
total.

Chapter 3 26 Using the Model
Once the term total is calculated, you can apply an appropriate loaded labor dollar rate and an equipment
dollar rate in the hourly or daily term rows. Types of surveillance equipment used may include video and
night vision cameras. Your equipment rate is a rental, lease, or operating expense rate. If equipment rates
are available only on a daily or lump sum basis, enter these costs in the corresponding row.
Limitations Schedule G is best used to estimate site surveillance costs for a single illegal dump site. If you wish to
calculate such costs for a number of sites, you should enter the data in Schedule I.
Only two lines are provided for each term. Therefore, if you have a variety of dollar rates, you should use
the model scratch pad to calculate the total number of hourly, daily, or lump sum terms one at a time.
Once you have several totals, add them together, enter the sum in the appropriate column of the lump
sum row, and enter a 1 in the “Term Total” column.
Example G-1—Using the Site Surveillance Scratch Pad
Schedule H. Assess Property Liabilities
One of the greatest impacts of illegal dumping is on the
value of real estate, and estimating its effects on a
property’s value is highly desirable. The real estate
market, however, is extremely intricate and is affected by
numerous economic, geographic, and aesthetic factors.
Thus, it is difficult to simplify the estimation process and still
produce significant results. Therefore, the model should be
used to make comparative analyses in order to assess how
an illegal dump site may affect property values as well as to
tally any other identified liabilities.
Schedule H summarizes certain property and waste information entered earlier in the Model Input
worksheet and allows you to compile comparable real estate values. Because of the real estate market’s
intricacies, you should consult real estate professionals as you assess property value effects and draw
conclusions.
Example: You might have four people monitoring a site, each with a different labor rate and a different term total. Calculate the “$ Total” for each person individually, and jot down the value on a piece of paper. Then add up the “$ Total” values, enter this lump sum value in the “Labor Rate” cell, and enter a 1 in the “Term Total” cell.
Generating an estimate in Schedule H does not constitute fulfillment of general obligations to identify impairments, liens, or other liabilities associated with a particular property (known as due diligence). However, if you have conducted due diligence, enter your findings in this schedule, and type “Yes” in the appropriate data entry box.

Chapter 3 27 Using the Model
Schedule I. Estimate Program Administrative Costs
Program administrative costs include the labor,
equipment not covered in other schedules, and
material costs incurred in an effort to combat illegal
dumping. Typical program administrative costs
include costs for salaried staff, dedicated equipment,
office space, printed materials, and the time to run
the model. The model allows you to provide lump
sum values for up to seven individual costs.
Type in a name for the cost item being estimated. Enter a quantity value for the item. Then enter the cost
value in the appropriate columns. The model provides sums broken down by labor, equipment, and
material costs and also calculates the total dollar value for all costs.
Limitations The specific values that you enter in Schedule I will depend on how you answered the first question in
Schedule A. For example, if you are using the model to estimate costs for a single illegal dump site, you
should enter prorated administrative costs or specific hourly administrative costs relevant to the site. Keep
this in mind to avoid double counting of program administrative costs.
Schedule J. Estimate Offsetting Costs
Certain factors associated with illegal dump sites can offset their costs. These factors include (1) civil
penalties collected, (2) public grants and private donations aimed at reducing illegal dumping, and (3)
efforts of the community or volunteers. The model allows you to provide lump sum values for these
factors. The model considers any value calculated in Schedule J to be a debit against the total costs
estimated in the Model Input worksheet and will subtract this value from the total cost.
Civil Penalties: The dollar value of civil penalties can be entered if you know that the offending party has
been identified and the fines have been paid. Community service hours can also be considered if the
service performed involved litter removal or anti-illegal dumping activities.
Grants and Private Donations: Funds are available to support illegal dumping programs and can be
from either public or private sources.
The actual dollar values that you enter in Schedule I will depend on whether you are using the model to (1) estimate costs for an individual site, (2) estimate costs for several sites, or (3) compile actual costs. You will have made this determination in answering the first question in Schedule A.

Chapter 3 28 Using the Model
Community and Volunteer Efforts: Volunteers provide
community service that is not always valued in dollar terms.
The model allows you to consider the hours that volunteers
provide as offsetting labor costs associated with site
cleanup or as a lump sum offsetting administrative costs.
Schedule K. Adjustments to Default Cost Values
Default cost values reflect national averages of prices in 1999 dollars. As such, they are geographically
neutral, and they are subject to inflation.
Default cost values will be automatically adjusted for your geographic location if you entered a zip code in
Schedule A.
To adjust default cost values for inflation, look up the implicit price deflator figures (or other applicable
inflation rates) published by the U.S. Department of Labor available on line at
http://stats.bls.gov:80/eag/eag.map.htm. Enter the percent increase that you want to use in the available
data entry cell and the corresponding year. The model will update all default values accordingly. You can
also use this area of Schedule K to adjust default costs by a specific percentage in order to conduct a
contingency analysis.
USING THE ADJUSTING DEFAULT VALUES WORKSHEET
The default cost values used in the IDEA model are considered to
be national averages and should be adjusted to reflect local
conditions whenever possible.
The Adjusting Default Values worksheet provides tables of all
the default values used in the model categorized by process
rates, labor costs, equipment costs, material costs, and disposal
facility costs (see Appendix B). The tables allow you to enter your
own values in the yellow data entry cells, and your values then
replace the default values in the appropriate Model Input schedules and formulas. This process allows you to customize the model according to your local labor
and equipment costs and process rates.
You can assess the economic impact of volunteer efforts in dollar terms based on costs avoided.
Once you have entered your actual costs in the Adjusting Default Values worksheet, save the file before entering specific illegal dump site information. Now when you use the IDEA model, you will have a customized model that better reflects local labor and equipment costs and process rates.
Chapter 3 29 Using the Model
In addition, the model’s default cost values can be changed if you enter a value in the Annual Inflation
Rate cell in Schedule K. You would do so to update default values for the years beyond 1999. The price
inflator feature applies only to the model’s original default values and will not affect any actual values
entered by you.
USING THE COST SUMMARY WORKSHEET
The Cost Summary worksheet is a financial statement of the costs entered in the Model Input worksheet,
and no user input to this worksheet is necessary. When you have worked completely through the Model
Input worksheet, press the Cost Summary tab to view and print the Cost Summary worksheet (see
Appendix C).
The Cost Summary worksheet may display error messages if your Model Input worksheet has simple
errors. For example, if you indicated that a lump sum is available for transport costs but you do not enter
a lump sum in the correct data entry cell, an error message will describe the error and where to go in order
to view or fix it.
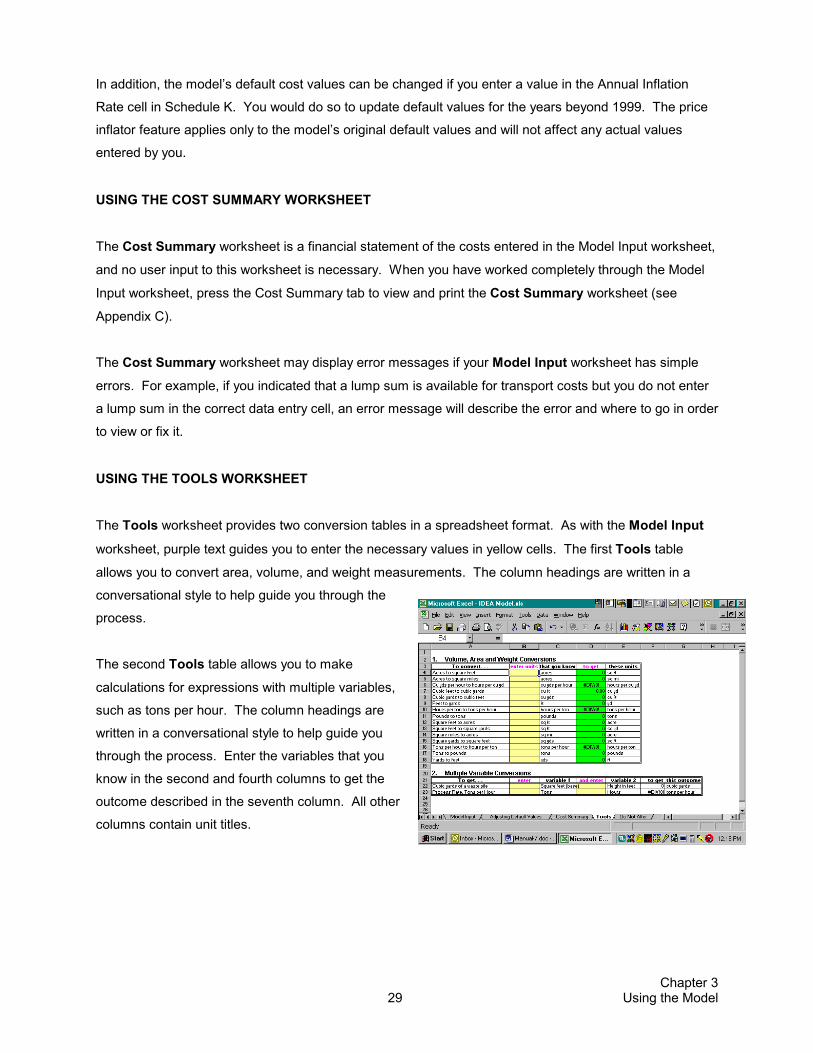
USING THE TOOLS WORKSHEET
The Tools worksheet provides two conversion tables in a spreadsheet format. As with the Model Input
worksheet, purple text guides you to enter the necessary values in yellow cells. The first Tools table
allows you to convert area, volume, and weight measurements. The column headings are written in a
conversational style to help guide you through the
process.
The second Tools table allows you to make
calculations for expressions with multiple variables,
such as tons per hour. The column headings are
written in a conversational style to help guide you
through the process. Enter the variables that you
know in the second and fourth columns to get the
outcome described in the seventh column. All other
columns contain unit titles.
Chapter 3 30 Using the Model
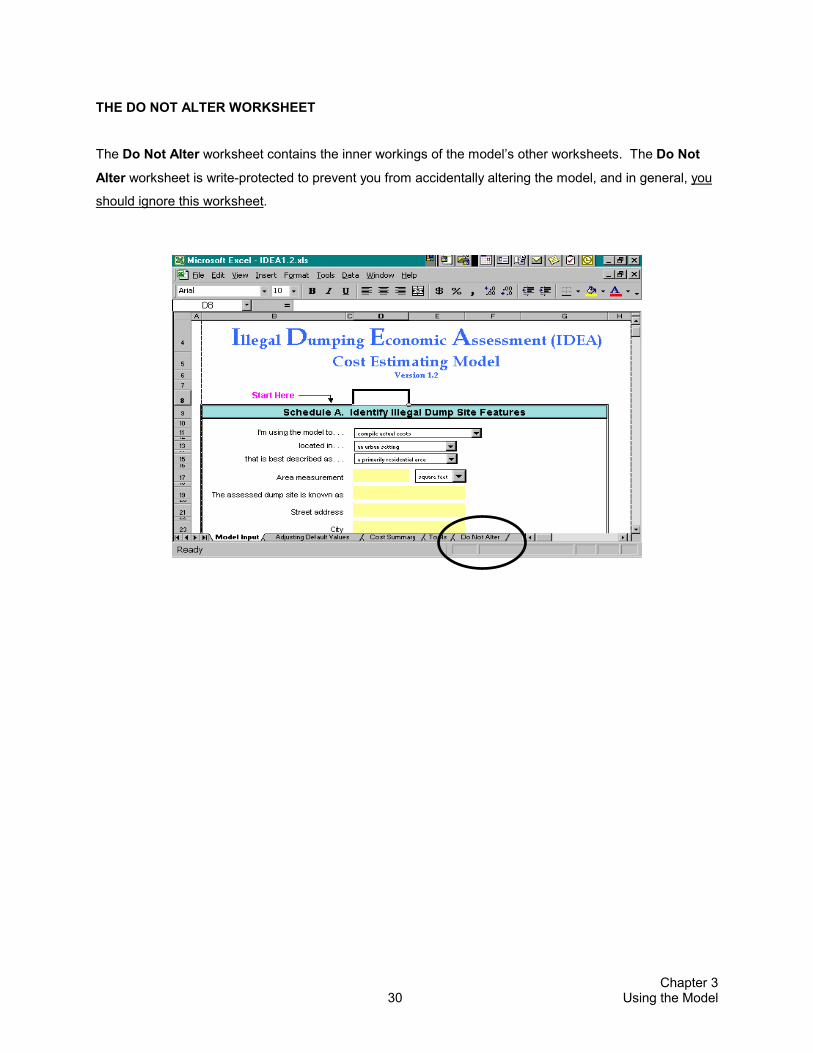
THE DO NOT ALTER WORKSHEET
The Do Not Alter worksheet contains the inner workings of the model’s other worksheets. The Do Not
Alter worksheet is write-protected to prevent you from accidentally altering the model, and in general, you
should ignore this worksheet.

Index 31
INDEX actual costs, 11, 21, 27, 28 actual process rate, 19, 20 Adjusting Default Values worksheet, 8, 20, 21,
28, Appendix B assumptions, 2, 4 barriers, 24 brush or landscape, 15 civil penalties, 27 cleanup costs, 3, 5, 13 cleanup crew process rate, 4, 7 cleanup process, 2, 4, 7, 15, 16 concrete, 12, 24 conversion tables, 29 cost sources, 4 Cost Summary worksheet, 8, 9, 10, 29,
Appendix C data entry cells, 8, 9, 10, 11, 28 default labor, 4, 13, 14, 16 default process equipment, 14, 16 default process rates, 13, 16, 19 default values, 2, 4, 6, 7, 10, 13, 20, 21, 24, 28,
29 disposal costs, 5, 6, 23 disposal facility, 4, 5, 11, 22, 23, 28 disposal method, 5, 11, 23 Do Not Alter worksheet, 8, 30 donations, 27 drop-down menus, 9, 10, 11 due diligence, 26 example data collection form, Appendix D fencing, 24 flow chart, Appendix E grading, 4, 24 grants, 27 hazardous waste, 6, 11, 12 input, 2, 11, 25, 29 labor rate, 25, 26 limitations, 11, 22, 23, 25, 26, 27 lump sum, 13, 26, 27, 28, 29
manual mode, 9, 13, 20, 21, 23 mixed or unknown, 15 mobilization, 4, 19 Model Input worksheet, 4, 5, 8, 9, 10, 11, 26,
27, 29, Appendix A output, 7, 20 parameters, 3, 4, 5, 6, 9 process rate, 4, 7, 11, 13, 14, 15, 16, 18, 19, 20,
21, 22, 28 program administrative costs, 27 property values, 1, 26 Schedule A, 5, 10, 11, 13, 20, 27, 28 Schedule B, 5, 11, 13, 15, 22, 23 Schedule C, 5, 7, 12, 13, 15 Schedule D, 5, 13, 22 Schedule E, 5, 23 Schedule F, 5, 24 Schedule G, 5, 25, 26 Schedule H, 5, 26 Schedule I, 5, 26, 27 Schedule J, 5, 27 Schedule K, 5, 21, 28, 29 security costs, 5, 24 signs, 25 site cleanup costs, 6, 13 site restoration, 4, 24, 25 software requirements, 8 standard waste types, 11, 12, 16 surveillance, 3, 5, 24, 25, 26 term equipment, 13, 14, 15, 22 tires, 12, 15, 16, 19, 22, 23 Tools worksheet, 8, 12, 29 variable, 7, 9, 15, 19, 22 volunteers, 27, 28 waste quantity, 12, 17 waste transport, 4, 22 waste type, 12, 13, 15, 18, 23 zip code, 10, 13, 20, 28

APPENDIX A
MODEL INPUT WORKSHEET
(Eight Pages)

Illegal Dumping Economic Assessment (IDEA)Cost Estimating Model
Version 1.2
Start Here
Schedule A. Identify Illegal Dump Site Features
I'm using the model to. . .
located in. . .
that is best described as. . .
Area measurement
The assessed dump site is known as
Street address
City
County
State
Zip Code
Date Evaluated
Schedule B. Select Values for Waste Type, Quantity, and Disposal Methods1. 2. 3. 4.
distance toFor each waste type: Enter Select unit Select a disposal the disposal
how much method and… facility
Mixed or unknown
Household
C&D--Building Materials
C&D--Concrete
Brush or landscape
Appliances
Tires
Hazardous waste
near
S.W. landfill/transfer
various tires Tires recycler near
cu yd Compost landfill near
cu yd S.W. landfill/transfer near
ton C&D landfill near
drums
S.W. landfill/transfercu yd
units near
estimate costs of an individual site
an urban setting
an abandonned/vacant lot
square feet
cu yd C&D landfill near
IDEA ModelModel Input Schedules Page 1 of 8

Schedule C. Estimate Site Cleanup CostsSchedule C, Part 1 (for lump sum)
1. Do you have a lump sum for the cleanup? Then go on to Part 2 of this Schedule
Schedule C, Part 2. Cleanup Costs for the Following Waste Types
Mixed or unknown 0.0 Waste not presentHousehold 0.0 Waste not present
C&D--Building Materials 0.0 Waste not presentC&D--Concrete 0.0 Waste not present
Brush or landscape 0.0 Waste not present
Total 0.0 cubic yardsProcess Rate
Labor Costs # of Workers Cu Yd/Hour Total Hours $ per hour Total
Supervisor 1 28 0.0 $23.45 $0.00
0.0 -
Equipment Operator 1 28 0.0 $27.20 $0.00
0.0 -
Drivers 2 28 0.0 $22.10 $0.00
0.0 -
(Manual Only) Other Labor 0.0 -
Labor Subtotal $0.00
Process RateProcess Equipment Costs Quantity Cu Yd/Hour Total Hours $ Per Hour Total
Dump Truck 2 28 0.0 $59.06 $0.00
0.0 -
Front-end Loader (4 cy) 1 28 0.0 $72.11 $0.00
0.0 -
(Manual Only) Compactor 0.0 $0.00
(Manual Only) Other Equipment 0.0 $0.00
Term # of Equipment Length $ Per UnitTerm Equipment Costs (Day, Wk, Mo) Units of Term Per Term Total
(Manual Only) Compactor $0.00
(Manual Only) Shredding Equipment $0.00
(Manual Only) 40-cu yd Container $0.00
(Manual Only) Other Term Equipment $0.00
Equipment Subtotal $0.00
no
Default
Default
Default
Default
Default
IDEA ModelModel Input Schedules Page 2 of 8
Schedule C, Part 3. Cleanup Costs by the Following Waste Type
Appliances 0 Waste not present
Total 0Process Rate
Labor Costs # of Workers Units Per Hour Total Hours $ per hour Total
Supervisor 1 12 0.0 $23.45 $0.00
0.0 -
Equipment Operator 1 12 0.0 $27.20 $0.00
0.0 -
Other Worker 1 12 0.0 $21.45 $0.00
0.0 -
(Manual Only) Other Labor 0.0 $0.00
Labor Subtotal $0.00
Process RateProcess Equipment Costs Quantity Units Per Hour Total Hours $ Per Hour Total
Front-end Loader (4 cy) 1 12 0.0 $72.11 $0.00
0.0 -
(Manual Only) Crusher or Grinder 0.0 $0.00
Units Per Total Cost perPer Unit Equipment Costs Container Containers Container Total
40-cubic yard Container 50 0 $200.00 $0.00
0 -
(Manual Only) Other Container 0 $0.00
Term # of Equipment Length $ Per UnitTerm Equipment Costs (Day, Wk, Mo) Units of Term Per Term Total
(Manual Only) Crusher or Grinder $0.00
(Manual Only) Other Container $0.00
(Manual Only) Other Term Equipment $0.00
Equipment Subtotal $0.00
Default
Default
Default
Default
Default
IDEA ModelModel Input Schedules Page 3 of 8
Schedule C, Part 4. Cleanup Costs by the Following Waste Type
Tires 0 tires Waste not present
Total 0 tires
Process RateLabor Costs # of Workers Units Per Hour Total Hours $ per hour Total
Supervisor 1 240 0.0 $23.45 $0.00
0.0 -
Equipment Operator 1 240 0.0 $27.20 $0.00
0.0 -
Other Worker 1 240 0.0 $21.45 $0.000.0 -
(Manual Only) Other Labor 0.0 $0.00
Labor Subtotal $0.00
Process RateProcess Equipment Costs Quantity Units Per Hour Total Hours $ Per Hour Total
Front-end Loader (4 cy) 1 240 0.0 $72.11 $0.000.0 -
(Manual Only) Shredder 0.0 $0.00
Units Per Total Cost perPer Unit Equipment Costs Container Containers Container Total
40-cubic yard Container 345 0 $200.00 $0.000 -
(Manual Only) Other Container 0 $0.00
Term # of Equipment Length $ Per UnitTerm Equipment Costs (Day, Wk, Mo) Units of Term Per Term Total
(Manual Only) Shredder $0.00(Manual Only) Other Container $0.00(Manual Only) Other Term Equipment $0.00
Equipment Subtotal $0.00
Default
Default
Default
Default
Default
IDEA ModelModel Input Schedules Page 4 of 8

Schedule D. Estimate Waste Transport Costs(for lump sum)
Review this Schedule for accuracy.Do you have a lump sum for waste transport costs?
Hourly HourlyWaste Type # of Loads Hours per Load Labor Equipment Total
Mixed or unknown 0 2.0 $22.10 $59.06 $0.00
-
Household 0 2.0 $22.10 $59.06 $0.00
-
C&D--Building Materials 0 2.0 $22.10 $59.06 $0.00
-
C&D--Concrete 0 2.0 $22.10 $59.06 $0.00
-
Brush or landscape 0 2.0 $22.10 $59.06 $0.00
-
Appliances 0 2.0 $22.10 $59.06 $0.00
-
Tires 0 2.0 $22.10 $59.06 $0.00
-
Total Transport Costs $0.00
Schedule E. Estimate Disposal Costs
(for lump sum)
Do you have a lump sum for disposal costs? Review this Schedule for accuracy.
Waste Total Waste Total $ PerDisposal Method (in cu yds) (in tons) Unit Total
Solid Waste Landfill 0.0 $37.00 $0-
Solid Waste Incinerator 0.0 $40.00 $0-
C&D Landfill 0.0 $42.00 $0-
C&D Recycler 0.0 $28.00 $0-
Compost Landfill 0.0 $20.00 $0-
Metals Recycler 0.0 $22.00 $0-
Tire Recycler 0.0 $26.00 $0-
Tire Incinerator 0.0 $31.00 $0-
Total Disposal Costs $0
no
Default
Default
Default
Default
Default
Default
Default
Default
Default
Default
Default
Default
Default
Default
Default
no
IDEA ModelModel Input Schedules Page 5 of 8

Schedule F. Estimate Site Restoration and Security Costs
Area in Square Feet Equipment Labor Site Restoration Square Feet Per Hour $ Per Hour $ Per Hour Total
Grading 3,000 $46.65 $32.40 $0.00-
(Manual Only) Reseeding $0.00(Manual Only) Infrastructure Improvements $0.00
Barrier $ PerSite Security # of Gates $ per Gate Linear Feet Linear Foot Total
Fencing $250.00 $30.00 $0.00-
Concrete Traffic Barrier $28.00 $0.00-
(Manual Only) Other Barrier $0.00
Signs and Other Items # Automatic # Manual $ Per Unit Total
Signs 0 48.00$ $0.00Other Items (quantity and price) $0.00
Total Site Restoration and Security Costs $0.00
Schedule G. Estimate Site Surveillance Costs
Total Hours Scratch Pad# of People Hours Per Day # of Days Term Total
000
EquipmentTerm Term Total Labor Rate Rate Materials $ Total
Hours $0.00Hours $0.00Days $0.00Days $0.00
Lump Sum $0.00Lump Sum $0.00
Subtotals $0.00 $0.00 $0.00
Total Site Surveillance Costs $0.00
Default
Default
Default
IDEA ModelModel Input Schedules Page 6 of 8

Schedule H. Assess Property Liabilities
Property Characterization an urban settingan abandonned/vacant lot
Size 0 square feetAmount of Wastes Present 0 tons
Estimated Cleanup and Disposal Costs $0.00Is the property tax delinquent?
Has due diligence been conducted?Other Property Liability (in $)Other Property Liability (in $)
Nearby NetProperty in Lot Value Lot Value Difference* Total*
Real Estate Comparable Values Square Feet $ Per Sq Ft $ Per Sq Ft $ Per Sq FtUse the two lines if you are comparing several properties
Line 1 $0.00 $0Line 2 $0.00 $0
*A negative number implies a depressed market value due to presence of dump.
Total Property Liabilities $0
Schedule I. Estimate Program Administrative Costs
Cost Item Quantity Labor Equipment Materials $ TotalType in a name for each cost item below
Item 1 $0.00Item 2 $0.00Item 3 $0.00Item 4 $0.00Item 5 $0.00Item 6 $0.00Item 7 $0.00
$0.00 $0.00 $0.00
Total Program Administrative Costs $0.00
Schedule J. Estimate Offsetting CostsLump Sum
$ ValueCivil Fines Paid
Grants or DonationsCommunity/Volunteer Support
Total Offsetting Costs $0.00
no
IDEA ModelModel Input Schedules Page 7 of 8
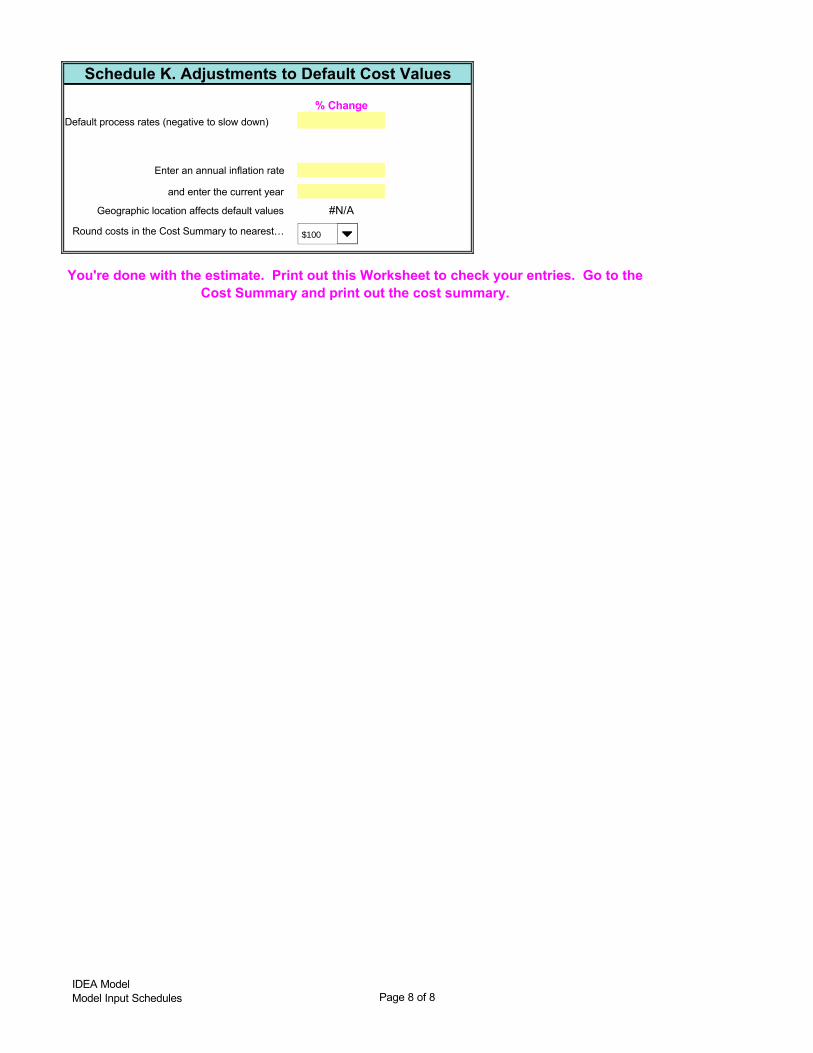
Schedule K. Adjustments to Default Cost Values
% ChangeDefault process rates (negative to slow down)
Enter an annual inflation rate
and enter the current year
Geographic location affects default values #N/A
Round costs in the Cost Summary to nearest…
You're done with the estimate. Print out this Worksheet to check your entries. Go to the Cost Summary and print out the cost summary.
$100
IDEA ModelModel Input Schedules Page 8 of 8

APPENDIX B
ADJUSTING DEFAULT VALUES WORKSHEET
(One Page)
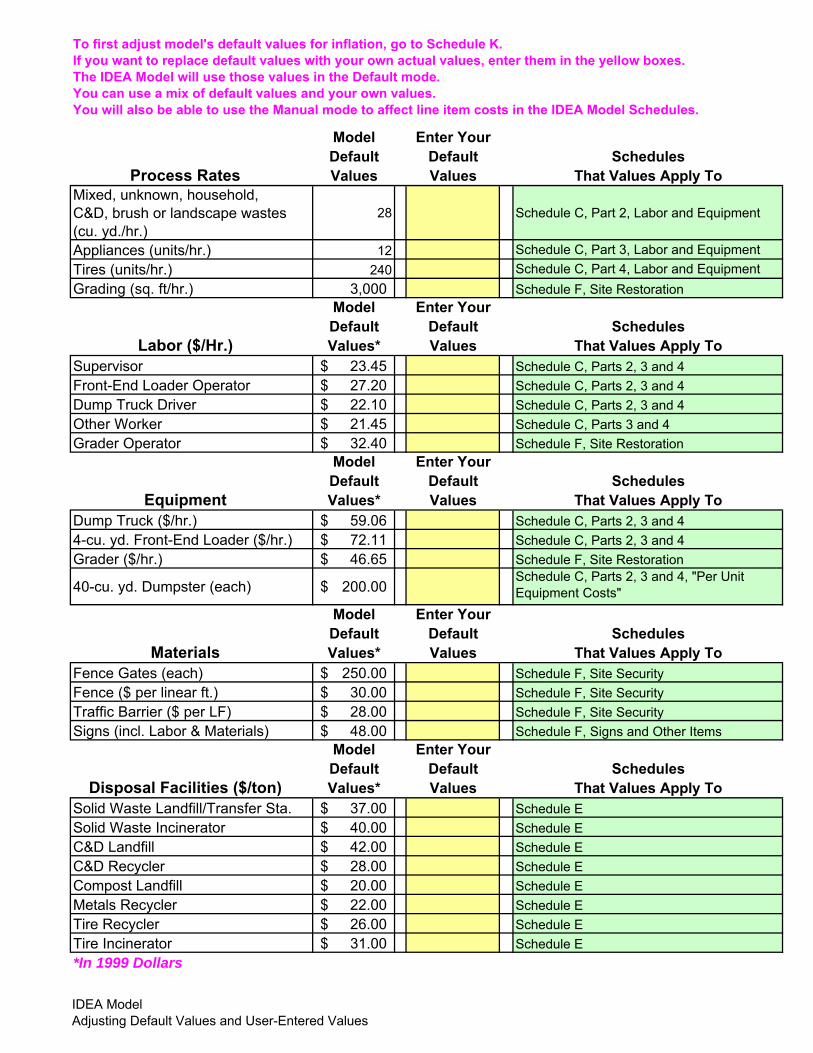
To first adjust model's default values for inflation, go to Schedule K.If you want to replace default values with your own actual values, enter them in the yellow boxes.The IDEA Model will use those values in the Default mode.You can use a mix of default values and your own values.You will also be able to use the Manual mode to affect line item costs in the IDEA Model Schedules.
Model Enter YourDefault Default Schedules
Process Rates Values Values That Values Apply ToMixed, unknown, household, C&D, brush or landscape wastes (cu. yd./hr.)
28 Schedule C, Part 2, Labor and Equipment
Appliances (units/hr.) 12 Schedule C, Part 3, Labor and EquipmentTires (units/hr.) 240 Schedule C, Part 4, Labor and EquipmentGrading (sq. ft/hr.) 3,000 Schedule F, Site Restoration
Model Enter YourDefault Default Schedules
Labor ($/Hr.) Values* Values That Values Apply ToSupervisor 23.45$ Schedule C, Parts 2, 3 and 4Front-End Loader Operator 27.20$ Schedule C, Parts 2, 3 and 4Dump Truck Driver 22.10$ Schedule C, Parts 2, 3 and 4Other Worker 21.45$ Schedule C, Parts 3 and 4Grader Operator 32.40$ Schedule F, Site Restoration
Model Enter YourDefault Default Schedules
Equipment Values* Values That Values Apply ToDump Truck ($/hr.) 59.06$ Schedule C, Parts 2, 3 and 44-cu. yd. Front-End Loader ($/hr.) 72.11$ Schedule C, Parts 2, 3 and 4Grader ($/hr.) 46.65$ Schedule F, Site Restoration
40-cu. yd. Dumpster (each) 200.00$ Schedule C, Parts 2, 3 and 4, "Per Unit Equipment Costs"
Model Enter YourDefault Default Schedules
Materials Values* Values That Values Apply ToFence Gates (each) 250.00$ Schedule F, Site SecurityFence ($ per linear ft.) 30.00$ Schedule F, Site SecurityTraffic Barrier ($ per LF) 28.00$ Schedule F, Site SecuritySigns (incl. Labor & Materials) 48.00$ Schedule F, Signs and Other Items
Model Enter YourDefault Default Schedules
Disposal Facilities ($/ton) Values* Values That Values Apply ToSolid Waste Landfill/Transfer Sta. 37.00$ Schedule ESolid Waste Incinerator 40.00$ Schedule EC&D Landfill 42.00$ Schedule EC&D Recycler 28.00$ Schedule ECompost Landfill 20.00$ Schedule EMetals Recycler 22.00$ Schedule ETire Recycler 26.00$ Schedule ETire Incinerator 31.00$ Schedule E*In 1999 Dollars
IDEA ModelAdjusting Default Values and User-Entered Values

APPENDIX C
COST SUMMARY WORKSHEET
(One Page)

Cost Estimate of an Individual Site*Date Printed 8/28/00
Date Evaluated 01/00/00Unknown County,
Illegal Dump Site Features
Unknown square feet of an abandonned/vacant lot in an urban setting.Waste Quantities and Types
- Mixed or unknown 0 Brush or landscape- Household 0 Appliances- C&D--Building Materials 0 Tires- C&D--Concrete
Cleanup, Waste Transport, and Disposal Costs:Cleanup Costs
Total Labor Costs $0Total Equipment Costs $0
Subtotal $0
Waste Transport Costs $0
Disposal Costs $0
Total Cleanup, Transport, and Disposal Costs $0
Post-Cleanup Costs:Site Restoration and Security Costs $0
Site Monitoring Costs
Labor $0Equipment $0Materials $0
Subtotal $0
Total Post-Cleanup Costs $0
Other Direct and Indirect Costs:
Net Property Liabilities1 $0
Program Administrative Costs
Labor $0Equipment $0Materials $0
Subtotal $0
Total Other Direct and Indirect Costs $0
Offsetting Costs2: $0
Total Illegal Dumping Cost Estimate $0
* Costs rounded to the nearest $1001 These costs are highly variable; completion of this section does not constitute due diligence.2 This value from Schedule J is treated as a debit against total costs.
ILLEGAL DUMPING ECONOMIC ASSESSMENT (IDEA) MODEL
Page 1 of 1
APPENDIX D
EXAMPLE DATA COLLECTION FORM
(One Page)

Data Collector_________________ Date__________________
Site Location___________________________________________________________________________
Property is accessible on (circle one) 1 2 3 4 sides
Property area_________________________ Percentage requiring grading and restoration_____%
Estimated number of tires_______________ Estimated number of appliances_________________
Estimated waste quantity (circle one) 1-5 5-40 40-240 >240 cy
Percentages of waste quantity
Mixed or unknown _______________%
Household _______________%
C&D – Building materials _______________%
C&D – Concrete _______________%
Brush or Landscape _______________%

APPENDIX E
MODEL INPUT WORKSHEET FLOW CHART
(Two Pages)
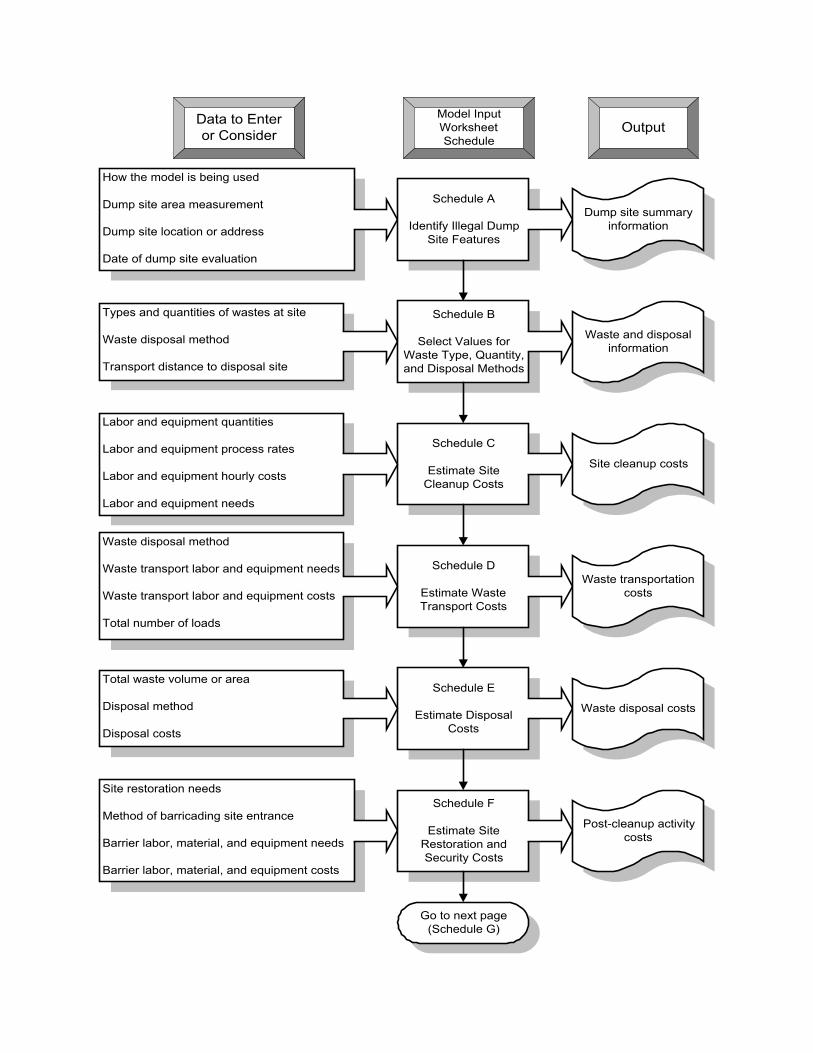
How the model is being used
Dump site area measurement
Dump site location or address
Date of dump site evaluation
Types and quantities of wastes at site
Waste disposal method
Transport distance to disposal site
Schedule B
Select Values forWaste Type, Quantity,and Disposal Methods
Waste and disposalinformation
Schedule C
Estimate SiteCleanup Costs
Labor and equipment quantities
Labor and equipment process rates
Labor and equipment hourly costs
Labor and equipment needs
Site cleanup costs
Schedule A
Identify Illegal DumpSite Features
Dump site summaryinformation
Model InputWorksheetSchedule
Output
Schedule D
Estimate WasteTransport Costs
Waste transportationcosts
Schedule E
Estimate DisposalCosts
Total waste volume or area
Disposal method
Disposal costs
Waste disposal costs
Waste disposal method
Waste transport labor and equipment needs
Waste transport labor and equipment costs
Total number of loads
Go to next page(Schedule G)
Site restoration needs
Method of barricading site entrance
Barrier labor, material, and equipment needs
Barrier labor, material, and equipment costs
Schedule F
Estimate SiteRestoration andSecurity Costs
Post-cleanup activitycosts
Data to Enteror Consider

Labor, equipment, and material needs forconducting surveillance of dump site
Surveillance labor, equipment, andmaterial costs
Schedule G
Estimate SiteSurveillance Costs
Site surveillance costs
Schedule H
Assess PropertyLiabilities
Dump site property liabilities
Dump site and nearby property values
Dump site characteristics
Local real estate market issues
Total property liabilitycosts
Schedule I
Estimate ProgramAdministrative Costs
Program costsattributable to dump
site(s) evaluated
Schedule J
Estimate OffsettingCosts
Civil fines paid
Value of volunteer efforts
Grants or donations
Offsetting costsattributable to dump
site(s) evaluated
Labor, equipment, and materialsassociated with local illegal dumpingprevention program administrative costs
Continued fromSchedule F
Go on toCost Summary Worksheet
Schedule K
Adjustments toDefault Cost Values
Default cleanup process rates
Actual cleanup process rates
Default weight values for waste categories
Annual inflation rate since 1999
Key default valuesadjusted
Model InputWorksheetSchedule
OutputData to Enteror Consider