
IDEA CELLULAR LIMITED - Vodafone Idea · 2020-04-01 · 2 Disclaimer This presentation does not...
35
IDEA CELLULAR LIMITED INVESTOR PRESENTATION
Transcript of IDEA CELLULAR LIMITED - Vodafone Idea · 2020-04-01 · 2 Disclaimer This presentation does not...

IDEA CELLULAR LIMITED
INVESTOR PRESENTATION
2
Disclaimer
This presentation does not constitute a prospectus, offering circular or offering memorandum or an offer, or a solicitation of any offer, to purchase or sell any securities.This presentation should not be considered as a recommendation that any investor should subscribe for or purchase any securities of Idea Cellular Limited or itssubsidiaries or joint venture (together, the “Company”) and should not be used as a basis for any investment decision.
The information contained in this presentation is only current as of its date and has not been independently verified. No express or implied representation or warranty ismade as to, and no reliance should be placed on, the accuracy, fairness or completeness of the information presented or contained in this presentation. Thispresentation contains certain currency exchange rates and the same have been provided only for the convenience of readers. No representation is made that theRupee amounts actually represent such USD amounts or could have been, or could be, converted into USD at the indicated rates.
None of the Company or any of its affiliates, advisers or representatives accepts any liability whatsoever for any loss howsoever arising from any information presentedor contained in this presentation. Please note that the past performance of the Company is not, and should not be considered as, indicative of future results.Furthermore, no person is authorized to give any information or make any representation which is not contained in, or is inconsistent with, this presentation. Any suchextraneous or inconsistent information or representation, if given or made, should not be relied upon as having been authorized by or on behalf of the Company.
The Company may alter, modify or otherwise change in any manner the contents of this presentation, without obligation to notify any person of such revision orchanges.
These materials are confidential, are being given solely for your information and for your use, and may not be copied, reproduced or redistributed to any other person inany manner. The distribution of this presentation in certain jurisdictions may be restricted by law. Accordingly, any persons in possession of this presentation shouldinform themselves about and observe any such restrictions.
This presentation contain certain statements of future expectations and other forward-looking statements, including those relating to our general business plans andstrategy, our future financial condition and growth prospects, and future developments in our sector and our competitive and regulatory environment. In addition tostatements which are forward looking by reason of context, the words‘may’, ‘will’, ‘should’, ‘expects’, ‘plans’, ‘intends’, ‘anticipates’, ‘believes’, ‘estimates’, ‘predicts’, ‘potential’ or ‘continue’ and similar expressions identify forward lookingstatements. All forward looking statements are subject to risks, uncertainties and assumptions that could cause actual results, performances or events to differmaterially from the results contemplated by the relevant forward looking statement. The factors which may affect the results contemplated by the forward lookingstatements could include, amongst others, future changes or developments in (i) the Company’s business, (ii) the Company’s competitive environment, (iii)telecommunications technology and application, and (iv) political, economic, legal and social conditions in India.
The information contained herein does not constitute an offer of securities for sale in the United States or in any other jurisdiction. Securities may not be offered or soldin the United States absent registration or an exemption from registration under the U.S. Securities Act of 1933, as amended.
3
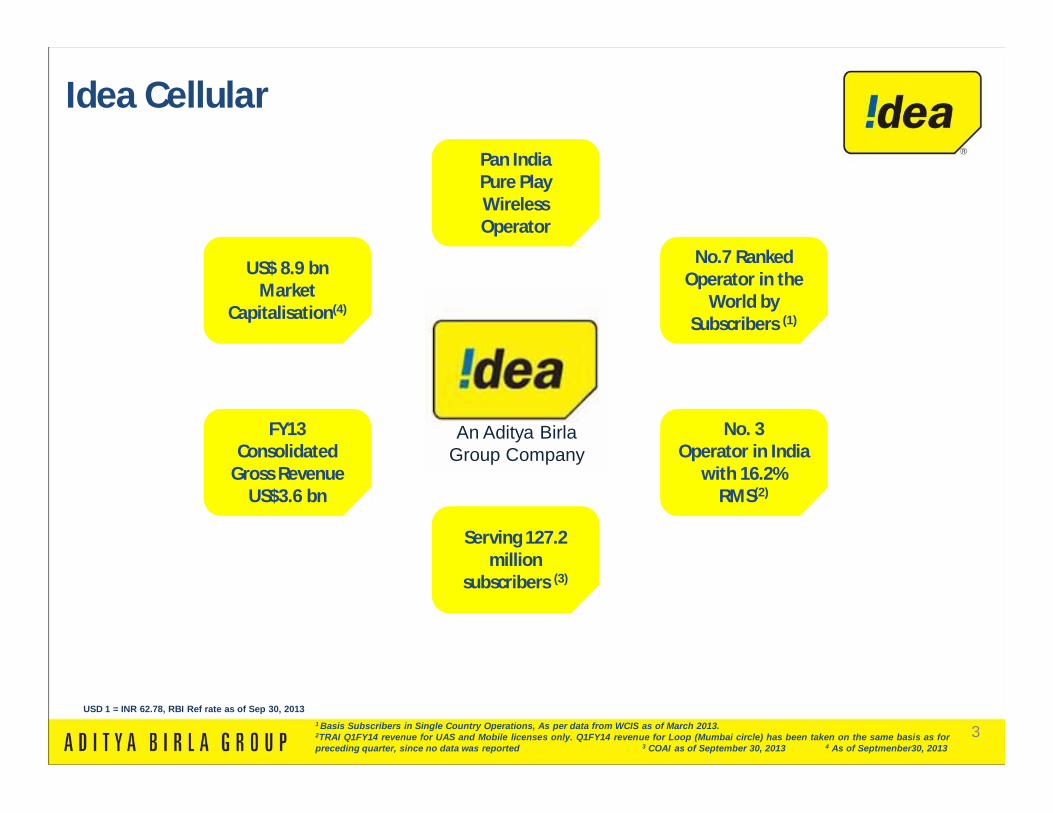
Serving 127.2 million
subscribers (3)
Pan India Pure Play Wireless Operator
FY13 Consolidated
Gross Revenue US$3.6 bn
US$ 8.9 bnMarket
Capitalisation(4)
No.7 Ranked Operator in the
World by Subscribers (1)
No. 3Operator in India
with 16.2% RMS(2)
An Aditya Birla Group Company
Idea Cellular
1 Basis Subscribers in Single Country Operations, As per data from WCIS as of March 2013.2TRAI Q1FY14 revenue for UAS and Mobile licenses only. Q1FY14 revenue for Loop (Mumbai circle) has been taken on the same basis as forpreceding quarter, since no data was reported 3 COAI as of September 30, 2013 4 As of Septmenber30, 2013
USD 1 = INR 62.78, RBI Ref rate as of Sep 30, 2013
4
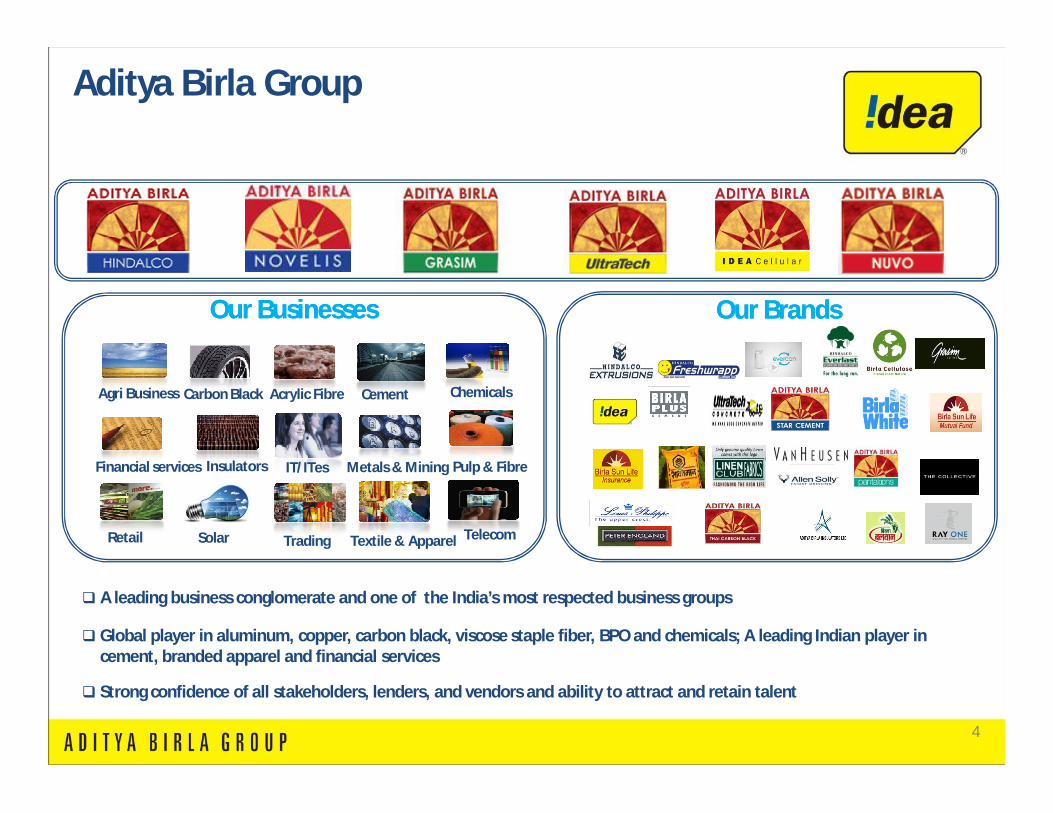
Aditya Birla Group
Acrylic FibreAgri Business Carbon Black Cement Chemicals
Financial services Insulators IT/ITes Metals & Mining
Retail Solar Trading Textile & Apparel Telecom
Our BusinessesOur Businesses
Pulp & Fibre
Our BrandsOur Brands
A leading business conglomerate and one of the India’s most respected business groups
Global player in aluminum, copper, carbon black, viscose staple fiber, BPO and chemicals; A leading Indian player in cement, branded apparel and financial services
Strong confidence of all stakeholders, lenders, and vendors and ability to attract and retain talent
5
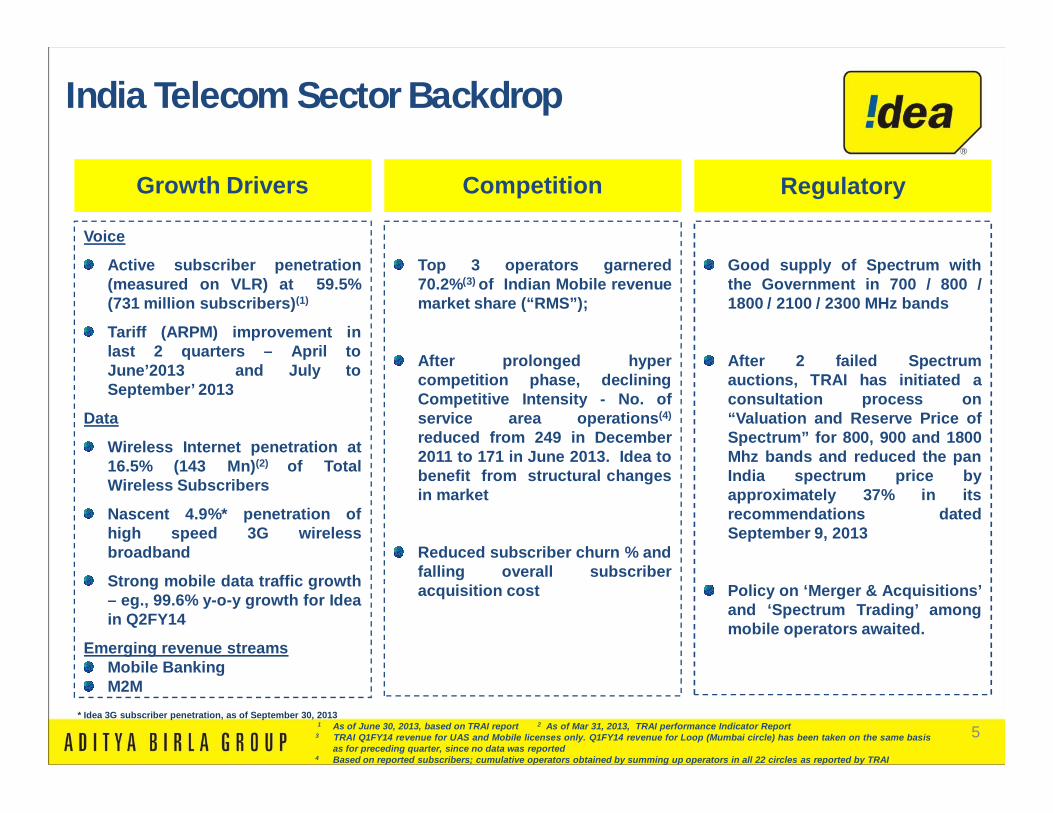
Growth Drivers Competition Regulatory
Voice
Active subscriber penetration(measured on VLR) at 59.5%(731 million subscribers)(1)
Tariff (ARPM) improvement inlast 2 quarters – April toJune’2013 and July toSeptember’ 2013
Data
Wireless Internet penetration at16.5% (143 Mn)(2) of TotalWireless Subscribers
Nascent 4.9%* penetration ofhigh speed 3G wirelessbroadband
Strong mobile data traffic growth– eg., 99.6% y-o-y growth for Ideain Q2FY14
Emerging revenue streamsMobile BankingM2M
Top 3 operators garnered70.2%(3) of Indian Mobile revenuemarket share (“RMS”);
After prolonged hypercompetition phase, decliningCompetitive Intensity - No. ofservice area operations(4)
reduced from 249 in December2011 to 171 in June 2013. Idea tobenefit from structural changesin market
Reduced subscriber churn % andfalling overall subscriberacquisition cost
Good supply of Spectrum withthe Government in 700 / 800 /1800 / 2100 / 2300 MHz bands
After 2 failed Spectrumauctions, TRAI has initiated aconsultation process on“Valuation and Reserve Price ofSpectrum” for 800, 900 and 1800Mhz bands and reduced the panIndia spectrum price byapproximately 37% in itsrecommendations datedSeptember 9, 2013
Policy on ‘Merger & Acquisitions’and ‘Spectrum Trading’ amongmobile operators awaited.
1 As of June 30, 2013, based on TRAI report 2 As of Mar 31, 2013, TRAI performance Indicator Report3 TRAI Q1FY14 revenue for UAS and Mobile licenses only. Q1FY14 revenue for Loop (Mumbai circle) has been taken on the same basis
as for preceding quarter, since no data was reported4 Based on reported subscribers; cumulative operators obtained by summing up operators in all 22 circles as reported by TRAI
* Idea 3G subscriber penetration, as of September 30, 2013
India Telecom Sector Backdrop
6
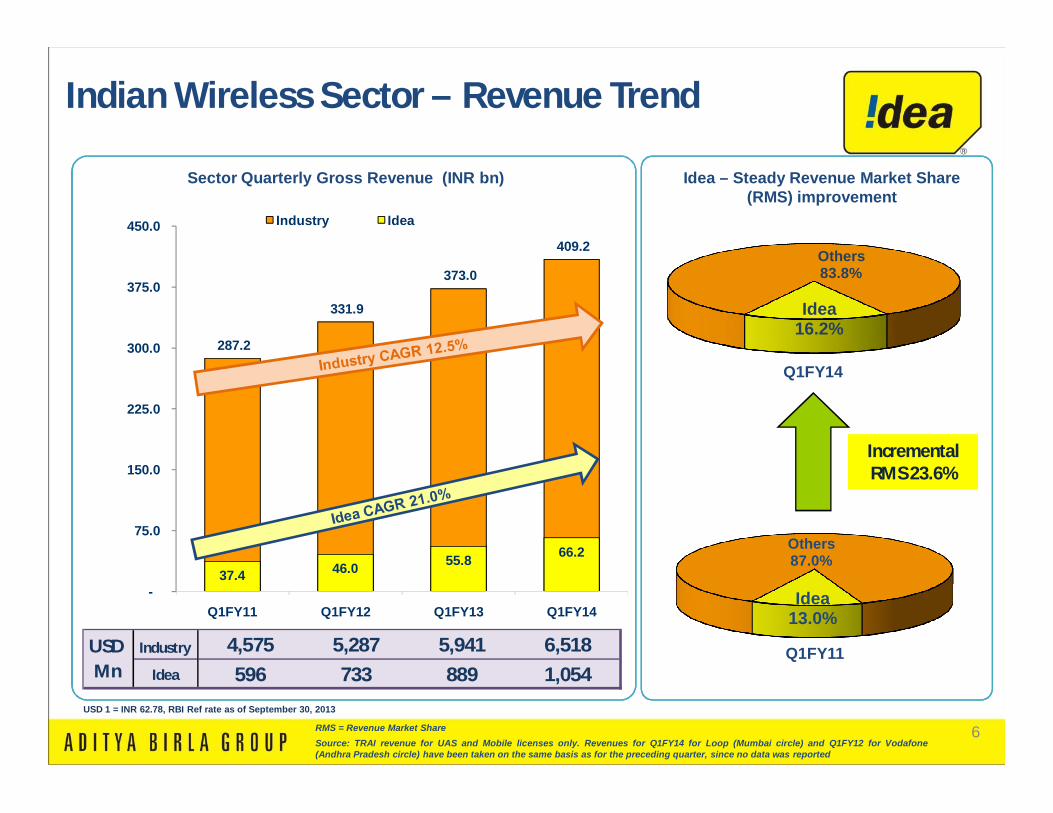
287.2
331.9
373.0
409.2
37.4 46.0 55.8 66.2
-
75.0
150.0
225.0
300.0
375.0
450.0
Q1FY11 Q1FY12 Q1FY13 Q1FY14
Industry Idea
Idea16.2%
Others 83.8%
Idea13.0%
Others87.0%
Q1FY11
Q1FY14
Sector Quarterly Gross Revenue (INR bn) Idea – Steady Revenue Market Share (RMS) improvement
Incremental RMS 23.6%Incremental RMS 23.6%
RMS = Revenue Market ShareSource: TRAI revenue for UAS and Mobile licenses only. Revenues for Q1FY14 for Loop (Mumbai circle) and Q1FY12 for Vodafone(Andhra Pradesh circle) have been taken on the same basis as for the preceding quarter, since no data was reported
Indian Wireless Sector – Revenue Trend
USD 1 = INR 62.78, RBI Ref rate as of September 30, 2013
Industry 4,575 5,287 5,941 6,518
Idea 596 733 889 1,054
USD Mn
7
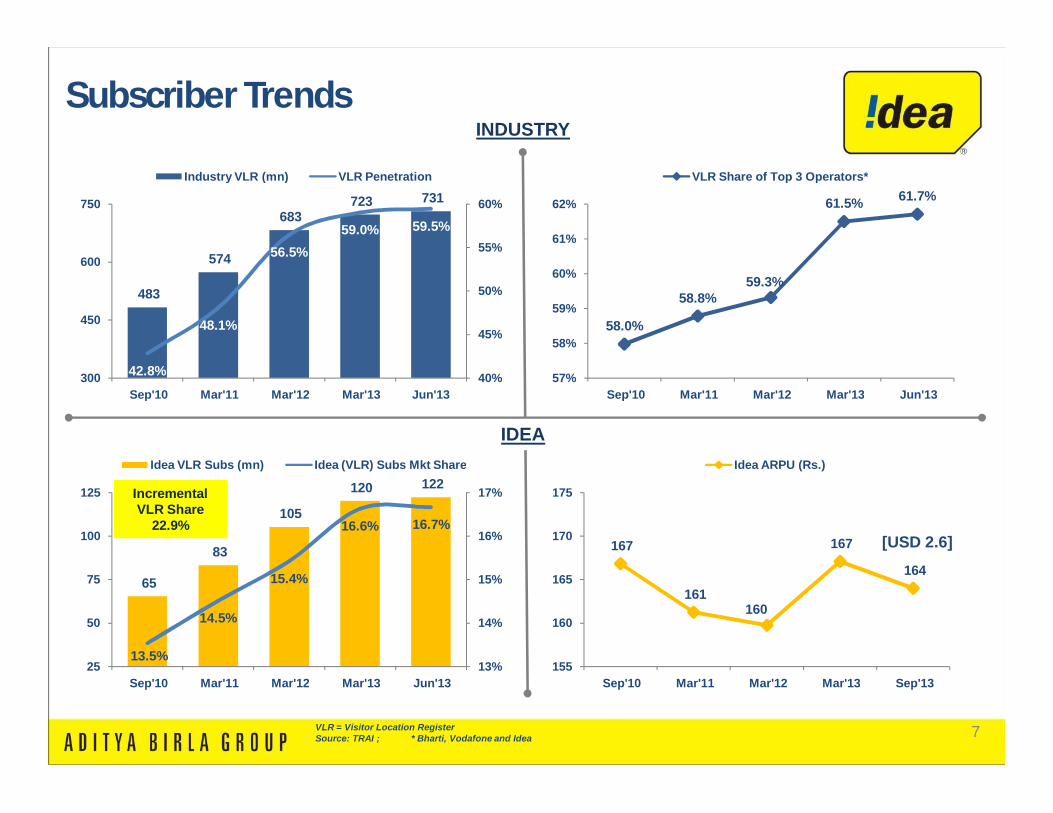
167
161 160
167
164
155
160
165
170
175
Sep'10 Mar'11 Mar'12 Mar'13 Sep'13
Idea ARPU (Rs.)
VLR = Visitor Location RegisterSource: TRAI ; * Bharti, Vodafone and Idea
INDUSTRY
IDEA
[USD 2.6]
Subscriber Trends
483
574
683 723 731
42.8%
48.1%
56.5%59.0% 59.5%
40%
45%
50%
55%
60%
300
450
600
750
Sep'10 Mar'11 Mar'12 Mar'13 Jun'13
Industry VLR (mn) VLR Penetration
58.0%
58.8%59.3%
61.5% 61.7%
57%
58%
59%
60%
61%
62%
Sep'10 Mar'11 Mar'12 Mar'13 Jun'13
VLR Share of Top 3 Operators*
65
83
105
120 122
13.5%
14.5%
15.4%
16.6% 16.7%
13%
14%
15%
16%
17%
25
50
75
100
125
Sep'10 Mar'11 Mar'12 Mar'13 Jun'13
Idea VLR Subs (mn) Idea (VLR) Subs Mkt Share
Incremental VLR Share
22.9%
Incremental VLR Share
22.9%
8
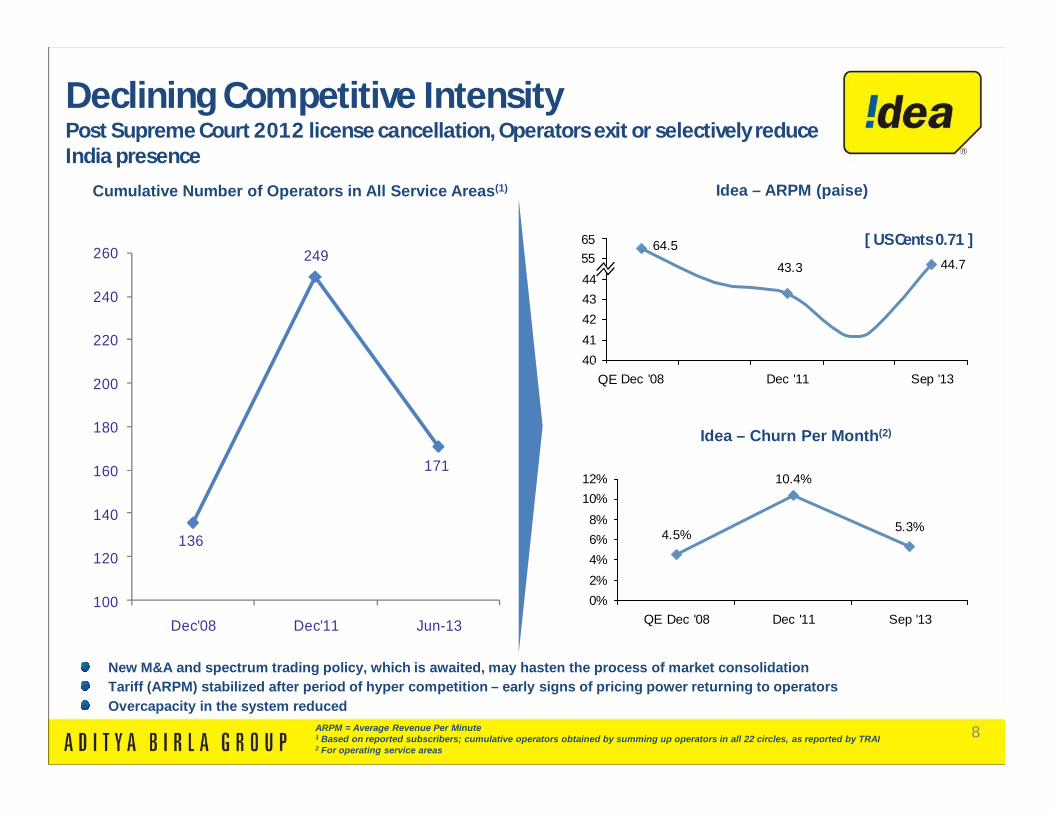
44.743.3
64.5
40414243444546
Dec '08 Dec '11 Sep '13
6555
Cumulative Number of Operators in All Service Areas(1)
Idea – Churn Per Month(2)
136
249
171
100
120
140
160
180
200
220
240
260
Dec'08 Dec'11 Jun-13
ARPM = Average Revenue Per Minute1 Based on reported subscribers; cumulative operators obtained by summing up operators in all 22 circles, as reported by TRAI2 For operating service areas
New M&A and spectrum trading policy, which is awaited, may hasten the process of market consolidationTariff (ARPM) stabilized after period of hyper competition – early signs of pricing power returning to operatorsOvercapacity in the system reduced
Idea – ARPM (paise)
[ US Cents 0.71 ]
Declining Competitive IntensityPost Supreme Court 2012 license cancellation, Operators exit or selectively reduce India presence
QE
4.5%
10.4%
5.3%
0%2%4%6%8%
10%12%
QE Dec '08 Dec '11 Sep '13
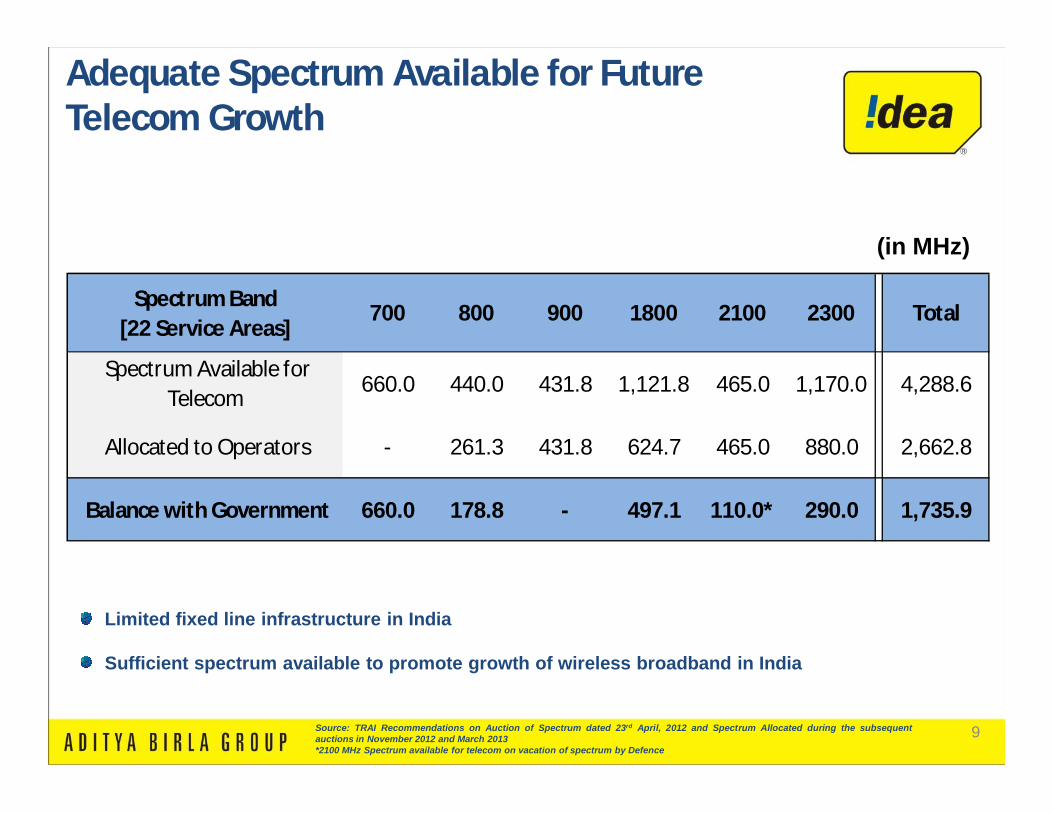
9Source: TRAI Recommendations on Auction of Spectrum dated 23rd April, 2012 and Spectrum Allocated during the subsequentauctions in November 2012 and March 2013*2100 MHz Spectrum available for telecom on vacation of spectrum by Defence
(in MHz)
Adequate Spectrum Available for Future Telecom Growth
Limited fixed line infrastructure in India
Sufficient spectrum available to promote growth of wireless broadband in India
Spectrum Band[22 Service Areas]
700 800 900 1800 2100 2300 Total
Spectrum Available for Telecom
660.0 440.0 431.8 1,121.8 465.0 1,170.0 4,288.6
Allocated to Operators - 261.3 431.8 624.7 465.0 880.0 2,662.8
Balance with Government 660.0 178.8 - 497.1 110.0* 290.0 1,735.9
10
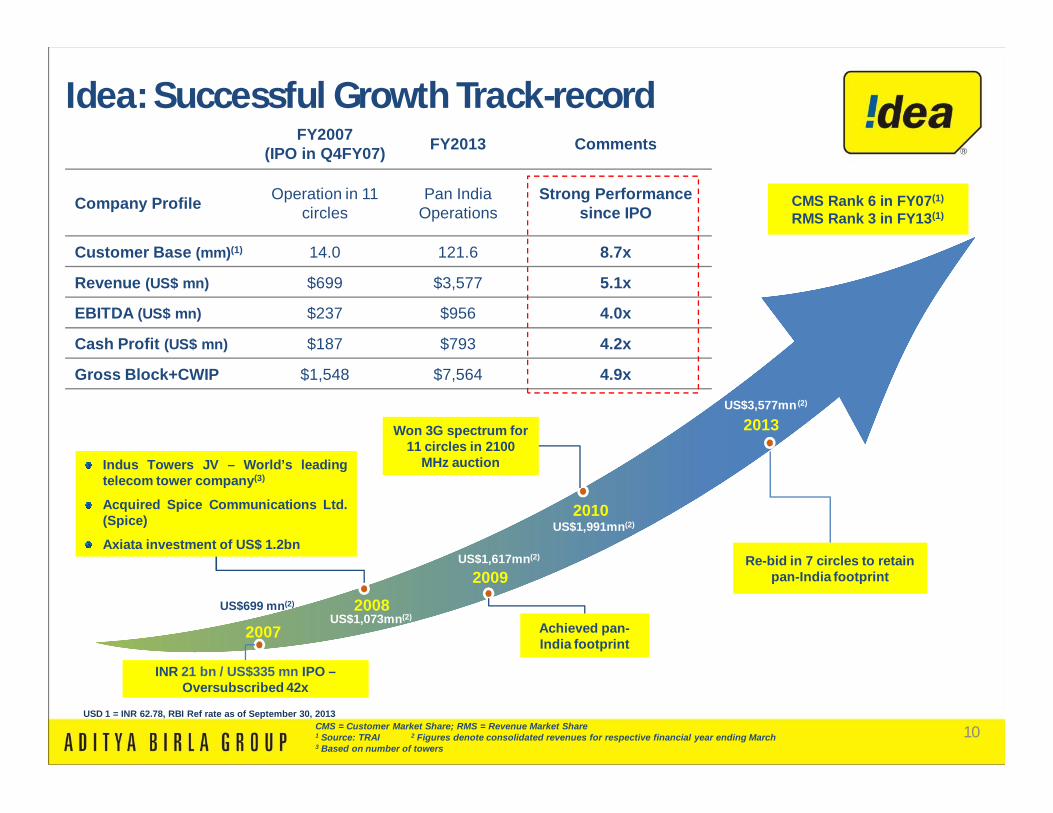
INR 21 bn / US$335 mn IPO –Oversubscribed 42x
Achieved pan-India footprint
2007
2009
2013
Re-bid in 7 circles to retain pan-India footprint
FY2007(IPO in Q4FY07) FY2013 Comments
Company Profile Operation in 11 circles
Pan India Operations
Strong Performance since IPO
Customer Base (mm)(1) 14.0 121.6 8.7x
Revenue (US$ mn) $699 $3,577 5.1x
EBITDA (US$ mn) $237 $956 4.0x
Cash Profit (US$ mn) $187 $793 4.2x
Gross Block+CWIP $1,548 $7,564 4.9x
2008
Indus Towers JV – World’s leadingtelecom tower company(3)
Acquired Spice Communications Ltd.(Spice)
Axiata investment of US$ 1.2bn
2010
Won 3G spectrum for 11 circles in 2100
MHz auction
US$699 mn(2)
US$1,073mn(2)
US$1,617mn(2)
US$1,991mn(2)
US$3,577mn (2)
CMS Rank 6 in FY07(1)
RMS Rank 3 in FY13(1)
CMS = Customer Market Share; RMS = Revenue Market Share1 Source: TRAI 2 Figures denote consolidated revenues for respective financial year ending March3 Based on number of towers
Idea: Successful Growth Track-record
USD 1 = INR 62.78, RBI Ref rate as of September 30, 2013
11
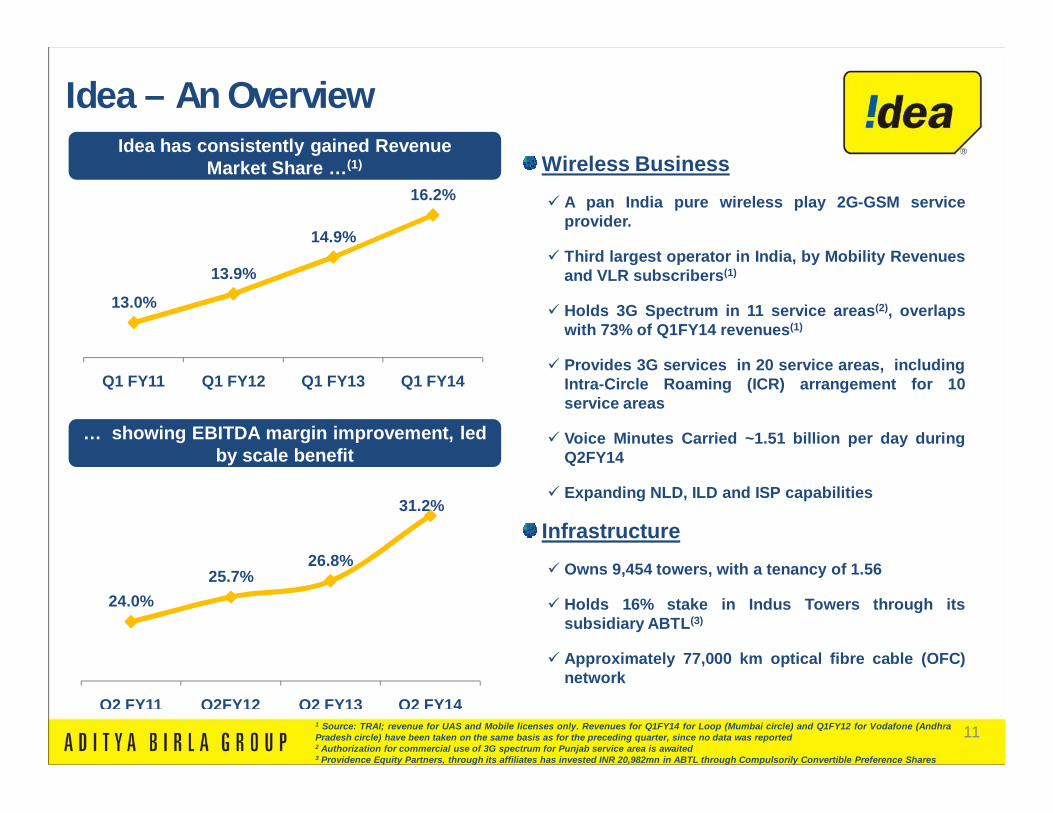
Wireless Business A pan India pure wireless play 2G-GSM service
provider.
Third largest operator in India, by Mobility Revenuesand VLR subscribers(1)
Holds 3G Spectrum in 11 service areas(2), overlapswith 73% of Q1FY14 revenues(1)
Provides 3G services in 20 service areas, includingIntra-Circle Roaming (ICR) arrangement for 10service areas
Voice Minutes Carried ~1.51 billion per day duringQ2FY14
Expanding NLD, ILD and ISP capabilities
Infrastructure Owns 9,454 towers, with a tenancy of 1.56
Holds 16% stake in Indus Towers through itssubsidiary ABTL(3)
Approximately 77,000 km optical fibre cable (OFC)network
1 Source: TRAI; revenue for UAS and Mobile licenses only. Revenues for Q1FY14 for Loop (Mumbai circle) and Q1FY12 for Vodafone (AndhraPradesh circle) have been taken on the same basis as for the preceding quarter, since no data was reported2 Authorization for commercial use of 3G spectrum for Punjab service area is awaited3 Providence Equity Partners, through its affiliates has invested INR 20,982mn in ABTL through Compulsorily Convertible Preference Shares
Idea has consistently gained Revenue Market Share …(1)
… showing EBITDA margin improvement, led by scale benefit
13.0%
13.9%
14.9%
16.2%
Q1 FY11 Q1 FY12 Q1 FY13 Q1 FY14
24.0%25.7%
26.8%
31.2%
Q2 FY11 Q2FY12 Q2 FY13 Q2 FY14
Idea – An Overview
12
# 1 Player# 2 Player# 3 Player
# 4 Player# 5 Player
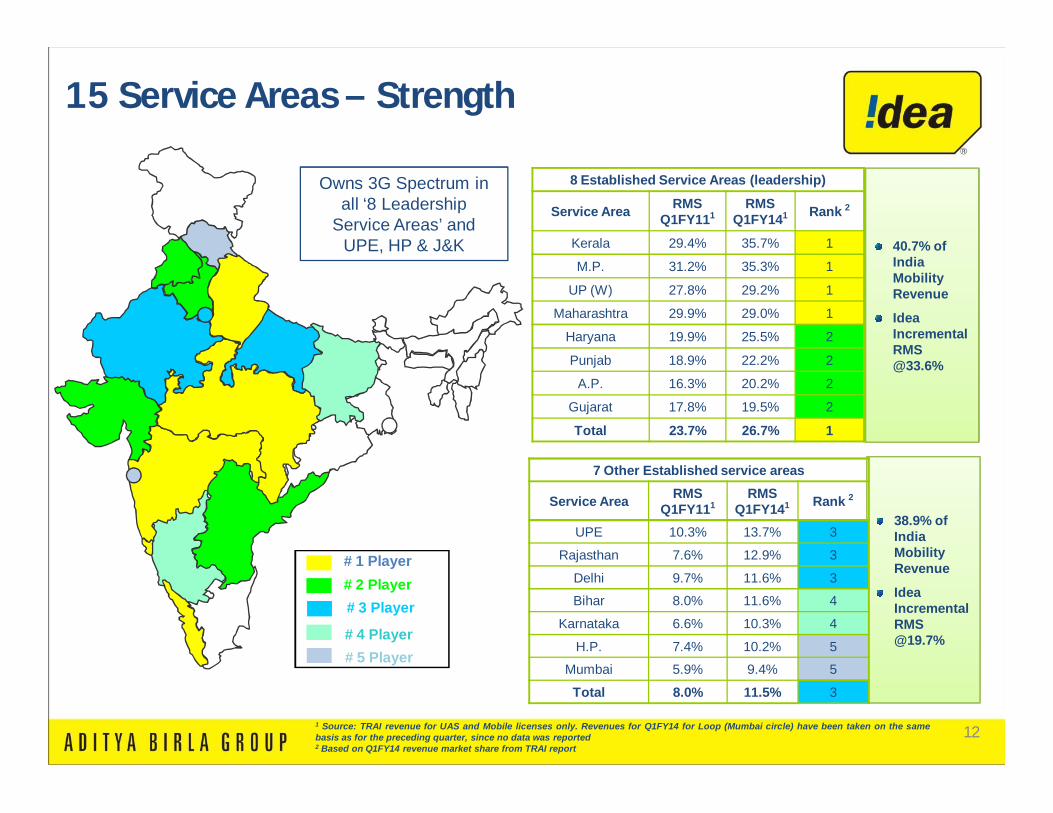
40.7% of India Mobility Revenue
Idea Incremental RMS @33.6%
38.9% of India Mobility Revenue
Idea Incremental RMS @19.7%
Owns 3G Spectrum in all ‘8 Leadership
Service Areas’ and UPE, HP & J&K
15 Service Areas – Strength
1 Source: TRAI revenue for UAS and Mobile licenses only. Revenues for Q1FY14 for Loop (Mumbai circle) have been taken on the samebasis as for the preceding quarter, since no data was reported2 Based on Q1FY14 revenue market share from TRAI report
8 Established Service Areas (leadership)
Service Area RMS Q1FY111
RMS Q1FY141 Rank 2
Kerala 29.4% 35.7% 1
M.P. 31.2% 35.3% 1
UP (W) 27.8% 29.2% 1
Maharashtra 29.9% 29.0% 1
Haryana 19.9% 25.5% 2
Punjab 18.9% 22.2% 2
A.P. 16.3% 20.2% 2
Gujarat 17.8% 19.5% 2
Total 23.7% 26.7% 1
7 Other Established service areas
Service Area RMS Q1FY111
RMS Q1FY141 Rank 2
UPE 10.3% 13.7% 3
Rajasthan 7.6% 12.9% 3
Delhi 9.7% 11.6% 3
Bihar 8.0% 11.6% 4
Karnataka 6.6% 10.3% 4
H.P. 7.4% 10.2% 5
Mumbai 5.9% 9.4% 5
Total 8.0% 11.5% 3
13
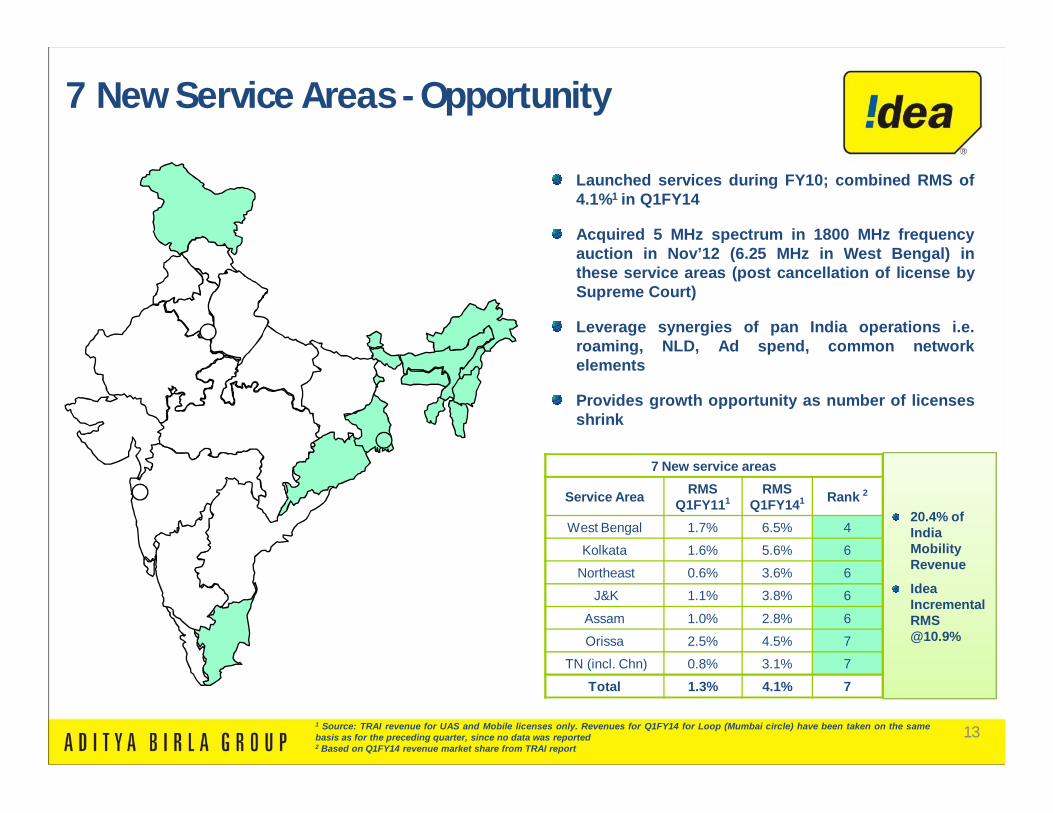
Launched services during FY10; combined RMS of4.1%1 in Q1FY14
Acquired 5 MHz spectrum in 1800 MHz frequencyauction in Nov’12 (6.25 MHz in West Bengal) inthese service areas (post cancellation of license bySupreme Court)
Leverage synergies of pan India operations i.e.roaming, NLD, Ad spend, common networkelements
Provides growth opportunity as number of licensesshrink
20.4% of India Mobility Revenue
Idea Incremental RMS @10.9%
7 New Service Areas - Opportunity
1 Source: TRAI revenue for UAS and Mobile licenses only. Revenues for Q1FY14 for Loop (Mumbai circle) have been taken on the samebasis as for the preceding quarter, since no data was reported2 Based on Q1FY14 revenue market share from TRAI report
7 New service areas
Service Area RMS Q1FY111
RMS Q1FY141 Rank 2
West Bengal 1.7% 6.5% 4
Kolkata 1.6% 5.6% 6
Northeast 0.6% 3.6% 6
J&K 1.1% 3.8% 6
Assam 1.0% 2.8% 6
Orissa 2.5% 4.5% 7
TN (incl. Chn) 0.8% 3.1% 7
Total 1.3% 4.1% 7
14
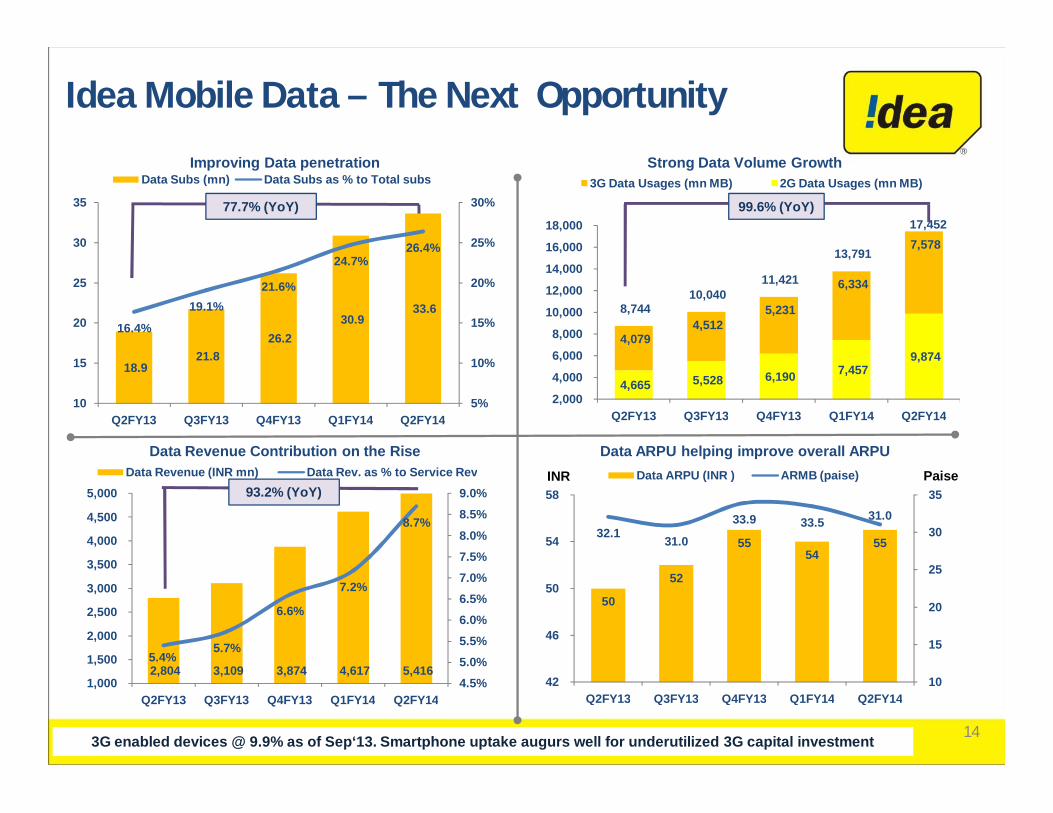
4,665 5,528 6,190 7,457 9,874
4,079 4,512
5,231
6,334
7,578
8,744 10,040
11,421
13,791
17,452
2,000
4,000
6,000
8,000
10,000
12,000
14,000
16,000
18,000
Q2FY13 Q3FY13 Q4FY13 Q1FY14 Q2FY14
3G Data Usages (mn MB) 2G Data Usages (mn MB)
2,804 3,109 3,874 4,617 5,416 5.4%
5.7%
6.6%
7.2%
8.7%
4.5%
5.0%
5.5%
6.0%
6.5%
7.0%
7.5%
8.0%
8.5%
9.0%
1,000
1,500
2,000
2,500
3,000
3,500
4,000
4,500
5,000
Q2FY13 Q3FY13 Q4FY13 Q1FY14 Q2FY14
Data Revenue (INR mn) Data Rev. as % to Service Rev
18.9 21.8
26.2 30.9
33.6 16.4%
19.1%21.6%
24.7%26.4%
5%
10%
15%
20%
25%
30%
10
15
20
25
30
35
Q2FY13 Q3FY13 Q4FY13 Q1FY14 Q2FY14
Data Subs (mn) Data Subs as % to Total subs
50
52
5554
5532.1 31.0
33.9 33.5 31.0
10
15
20
25
30
35
42
46
50
54
58
Q2FY13 Q3FY13 Q4FY13 Q1FY14 Q2FY14
Data ARPU (INR ) ARMB (paise)
3G enabled devices @ 9.9% as of Sep‘13. Smartphone uptake augurs well for underutilized 3G capital investment
Improving Data penetration Strong Data Volume Growth
Data Revenue Contribution on the Rise Data ARPU helping improve overall ARPU
99.6% (YoY)77.7% (YoY)
93.2% (YoY)
Idea Mobile Data – The Next Opportunity
INR Paise
15
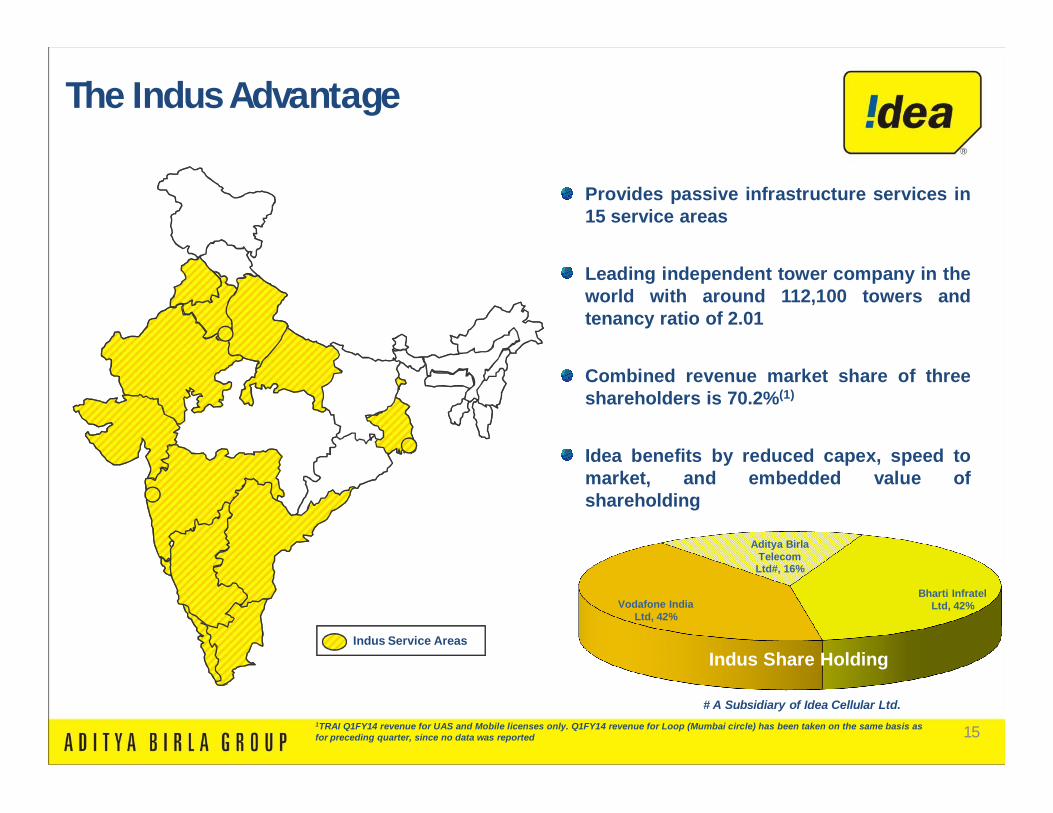
Indus Service Areas
Indus Share Holding
Provides passive infrastructure services in15 service areas
Leading independent tower company in theworld with around 112,100 towers andtenancy ratio of 2.01
Combined revenue market share of threeshareholders is 70.2%(1)
Idea benefits by reduced capex, speed tomarket, and embedded value ofshareholding
Bharti Infratel Ltd, 42%Vodafone India
Ltd, 42%
Aditya Birla Telecom Ltd#, 16%
Indus Share Holding
# A Subsidiary of Idea Cellular Ltd.
The Indus Advantage
1TRAI Q1FY14 revenue for UAS and Mobile licenses only. Q1FY14 revenue for Loop (Mumbai circle) has been taken on the same basis asfor preceding quarter, since no data was reported
16
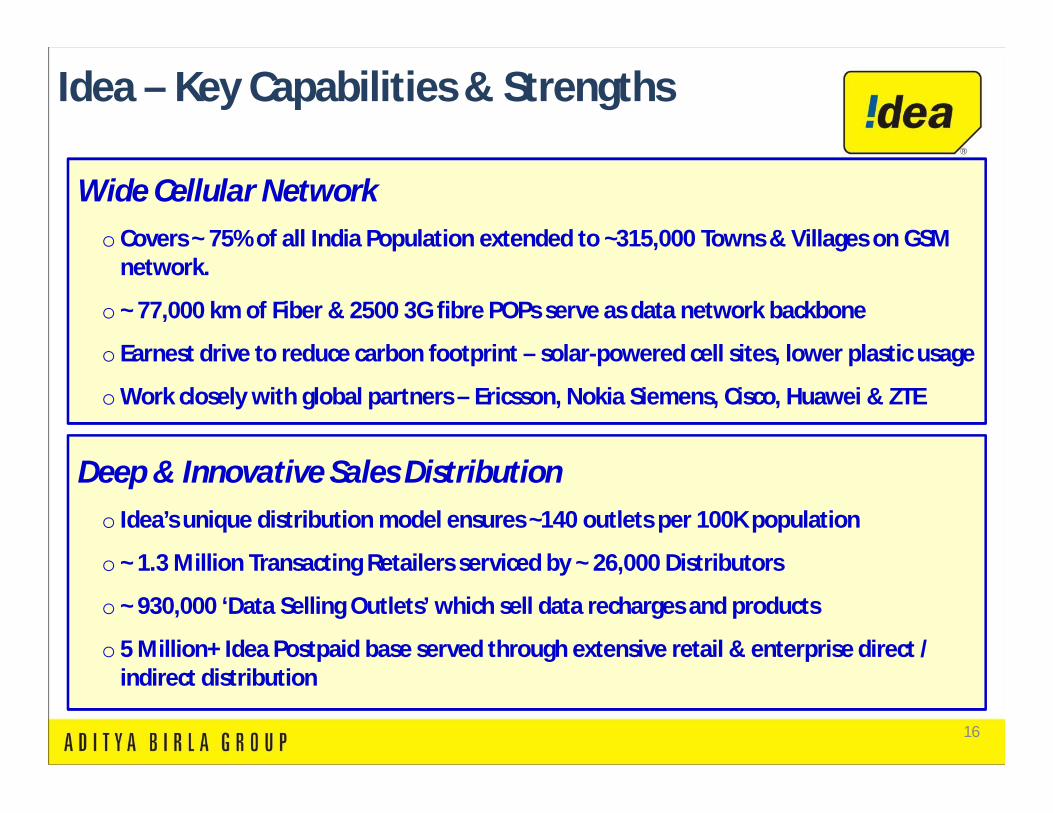
Idea – Key Capabilities & Strengths
Wide Cellular Networko Covers ~ 75% of all India Population extended to ~315,000 Towns & Villages on GSM
network.
o ~ 77,000 km of Fiber & 2500 3G fibre POPs serve as data network backbone
o Earnest drive to reduce carbon footprint – solar-powered cell sites, lower plastic usage
oWork closely with global partners – Ericsson, Nokia Siemens, Cisco, Huawei & ZTE
Deep & Innovative Sales Distributiono Idea’s unique distribution model ensures ~140 outlets per 100K population
o ~ 1.3 Million Transacting Retailers serviced by ~ 26,000 Distributors
o ~ 930,000 ‘Data Selling Outlets’ which sell data recharges and products
o 5 Million+ Idea Postpaid base served through extensive retail & enterprise direct / indirect distribution
17
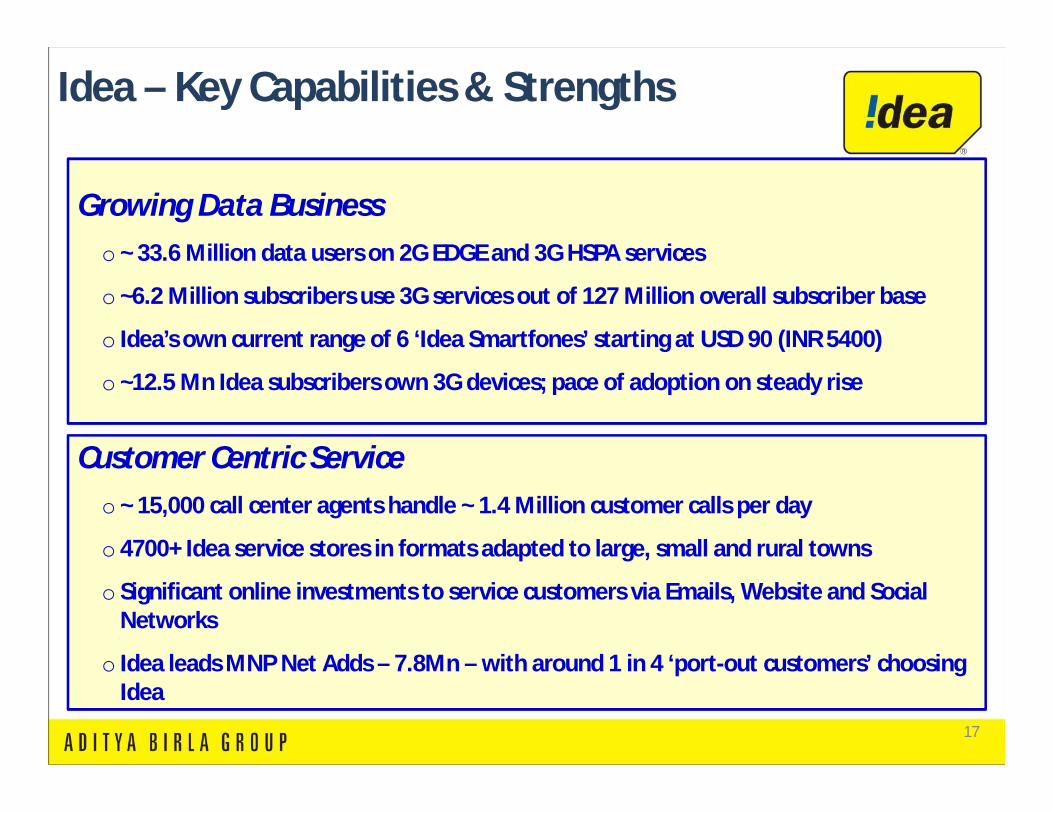
Idea – Key Capabilities & Strengths
Growing Data Businesso ~ 33.6 Million data users on 2G EDGE and 3G HSPA services
o ~6.2 Million subscribers use 3G services out of 127 Million overall subscriber base
o Idea’s own current range of 6 ‘Idea Smartfones’ starting at USD 90 (INR 5400)
o ~12.5 Mn Idea subscribers own 3G devices; pace of adoption on steady rise
Customer Centric Serviceo ~ 15,000 call center agents handle ~ 1.4 Million customer calls per day
o 4700+ Idea service stores in formats adapted to large, small and rural towns
o Significant online investments to service customers via Emails, Website and Social Networks
o Idea leads MNP Net Adds – 7.8Mn – with around 1 in 4 ‘port-out customers’ choosing Idea
18
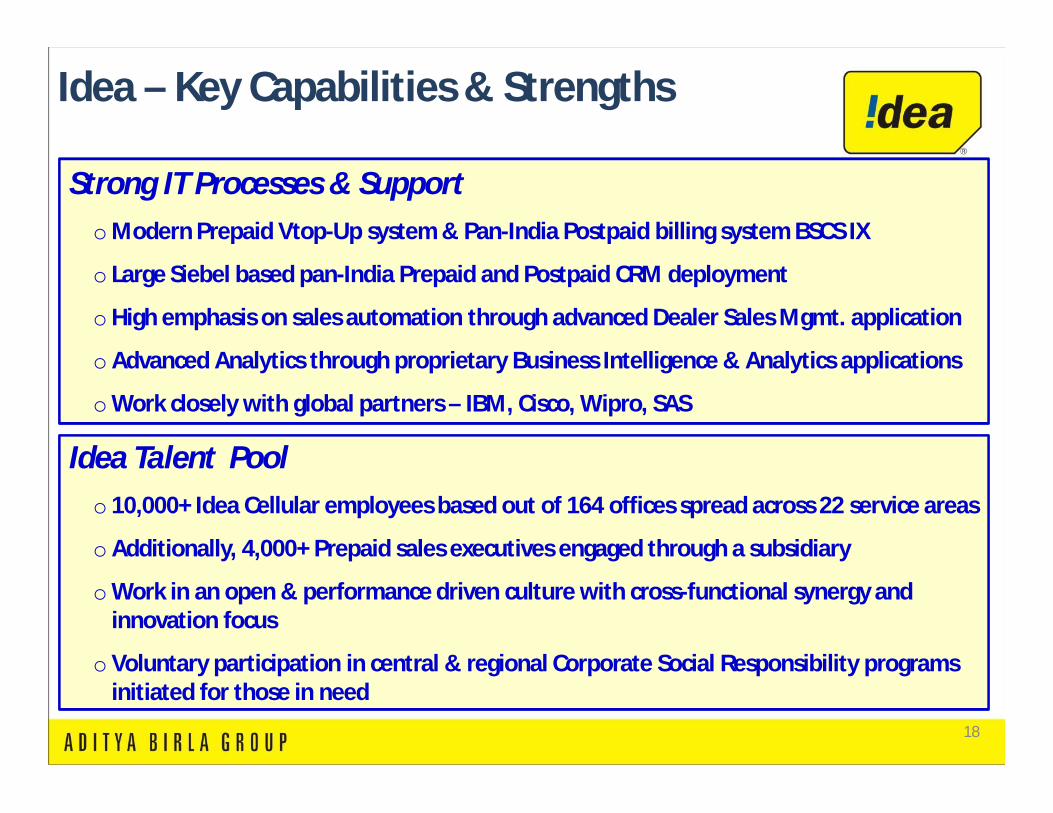
Idea – Key Capabilities & Strengths
Strong IT Processes & SupportoModern Prepaid Vtop-Up system & Pan-India Postpaid billing system BSCS IX
o Large Siebel based pan-India Prepaid and Postpaid CRM deployment
oHigh emphasis on sales automation through advanced Dealer Sales Mgmt. application
oAdvanced Analytics through proprietary Business Intelligence & Analytics applications
oWork closely with global partners – IBM, Cisco, Wipro, SAS
Idea Talent Poolo 10,000+ Idea Cellular employees based out of 164 offices spread across 22 service areas
oAdditionally, 4,000+ Prepaid sales executives engaged through a subsidiary
oWork in an open & performance driven culture with cross-functional synergy and innovation focus
oVoluntary participation in central & regional Corporate Social Responsibility programs initiated for those in need
19
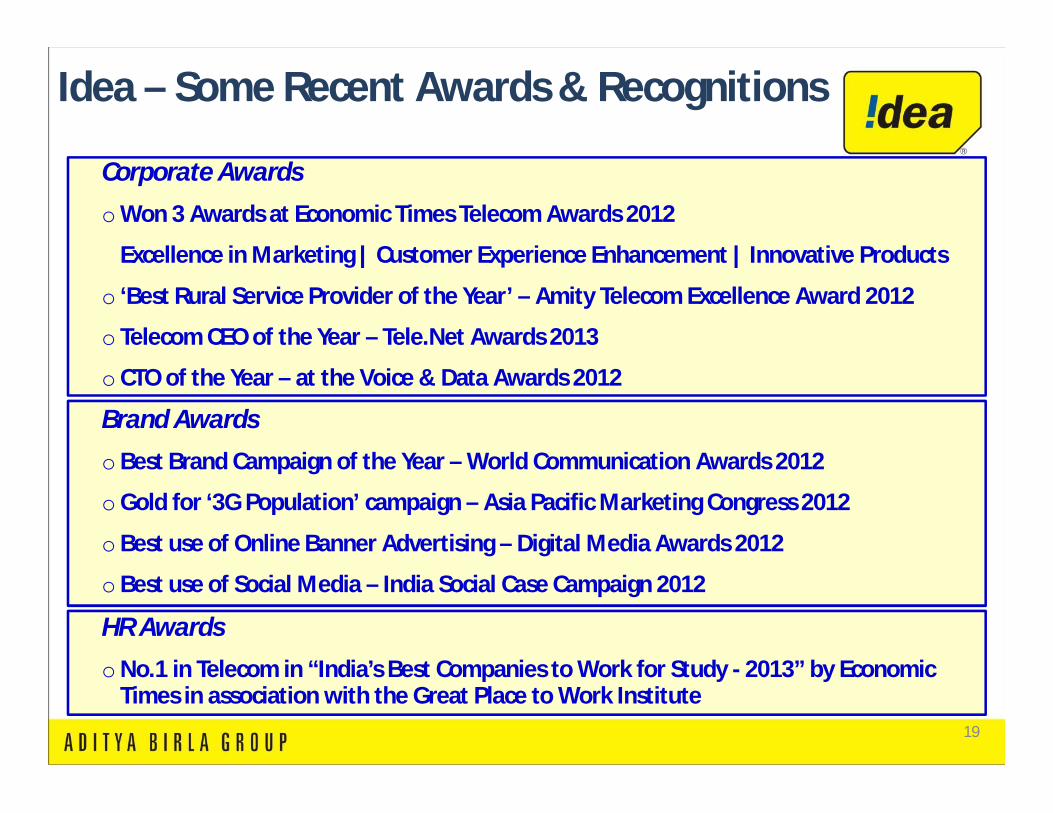
Idea – Some Recent Awards & Recognitions
Brand Awards
o Best Brand Campaign of the Year – World Communication Awards 2012
oGold for ‘3G Population’ campaign – Asia Pacific Marketing Congress 2012
o Best use of Online Banner Advertising – Digital Media Awards 2012
o Best use of Social Media – India Social Case Campaign 2012
Corporate Awards
oWon 3 Awards at Economic Times Telecom Awards 2012
Excellence in Marketing | Customer Experience Enhancement | Innovative Products
o ‘Best Rural Service Provider of the Year’ – Amity Telecom Excellence Award 2012
o Telecom CEO of the Year – Tele.Net Awards 2013
o CTO of the Year – at the Voice & Data Awards 2012
HR Awards
oNo.1 in Telecom in “India’s Best Companies to Work for Study - 2013” by Economic Times in association with the Great Place to Work Institute

20
India’s No. 21 ‘Most Valuable Brand’ as per ‘Best Indian Brands 2013’ study by Interbrand, a leading global branding consultancy
Idea Brand PhilosophyTransforming Indian consumers’ life through Mobile Telephony
21
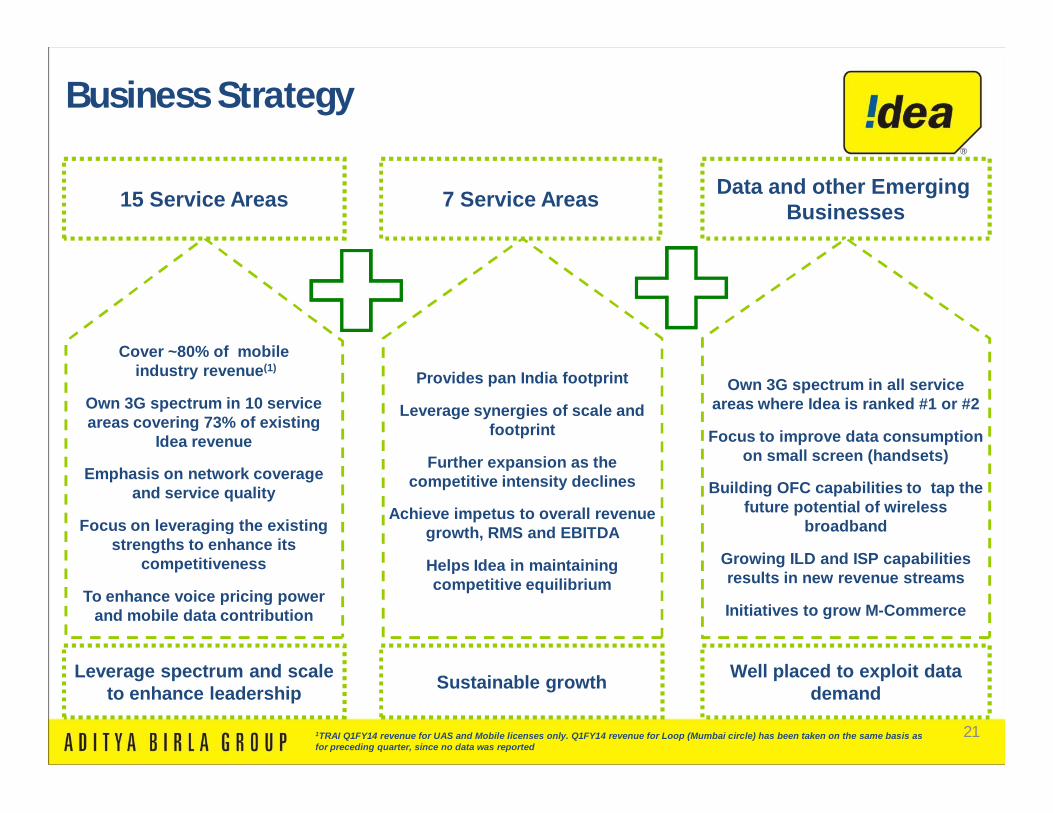
Cover ~80% of mobileindustry revenue(1)
Own 3G spectrum in 10 service areas covering 73% of existing
Idea revenue
Emphasis on network coverage and service quality
Focus on leveraging the existing strengths to enhance its
competitiveness
To enhance voice pricing power and mobile data contribution
15 Service Areas
Leverage spectrum and scale to enhance leadership
Provides pan India footprint
Leverage synergies of scale and footprint
Further expansion as the competitive intensity declines
Achieve impetus to overall revenue growth, RMS and EBITDA
Helps Idea in maintaining competitive equilibrium
7 Service Areas
Sustainable growth
Data and other Emerging Businesses
Own 3G spectrum in all service areas where Idea is ranked #1 or #2
Focus to improve data consumption on small screen (handsets)
Building OFC capabilities to tap the future potential of wireless
broadband
Growing ILD and ISP capabilities results in new revenue streams
Initiatives to grow M-Commerce
Well placed to exploit data demand
Business Strategy
1TRAI Q1FY14 revenue for UAS and Mobile licenses only. Q1FY14 revenue for Loop (Mumbai circle) has been taken on the same basis asfor preceding quarter, since no data was reported
22
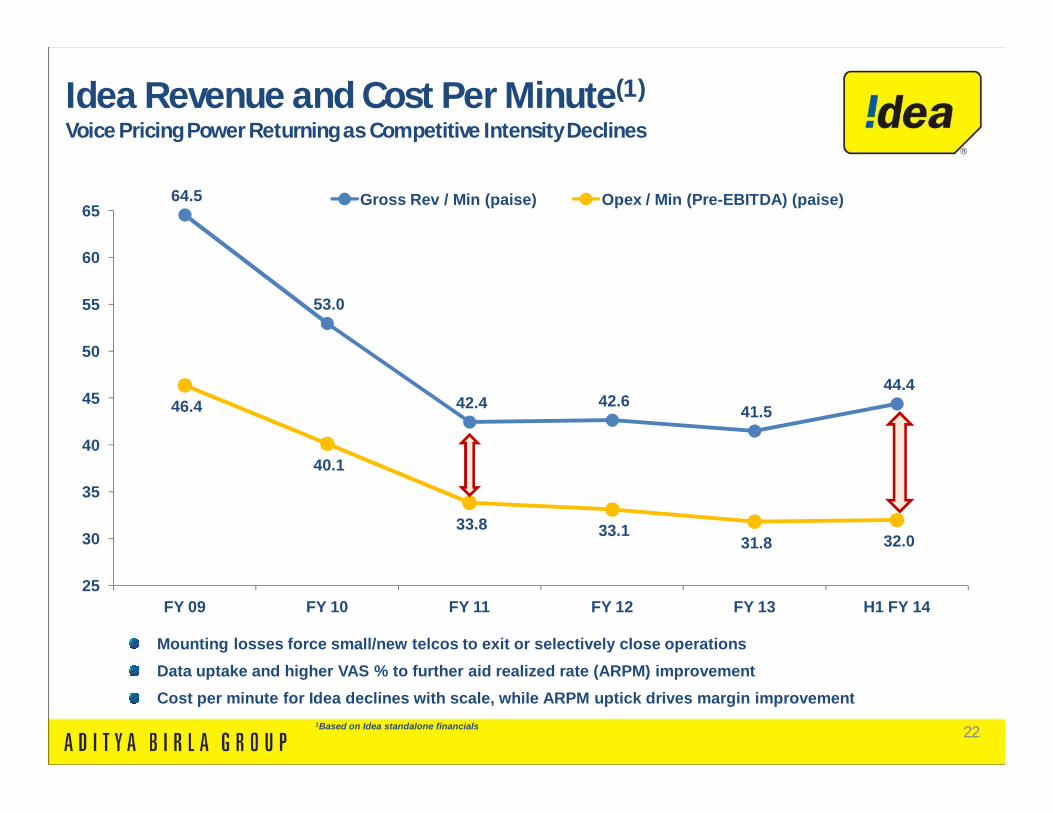
64.5
53.0
42.4 42.6 41.5 44.4
46.4
40.1
33.8 33.1 31.8 32.0
25
30
35
40
45
50
55
60
65
FY 09 FY 10 FY 11 FY 12 FY 13 H1 FY 14
Gross Rev / Min (paise) Opex / Min (Pre-EBITDA) (paise)
Mounting losses force small/new telcos to exit or selectively close operationsData uptake and higher VAS % to further aid realized rate (ARPM) improvementCost per minute for Idea declines with scale, while ARPM uptick drives margin improvement
Idea Revenue and Cost Per Minute(1)
Voice Pricing Power Returning as Competitive Intensity Declines
1Based on Idea standalone financials
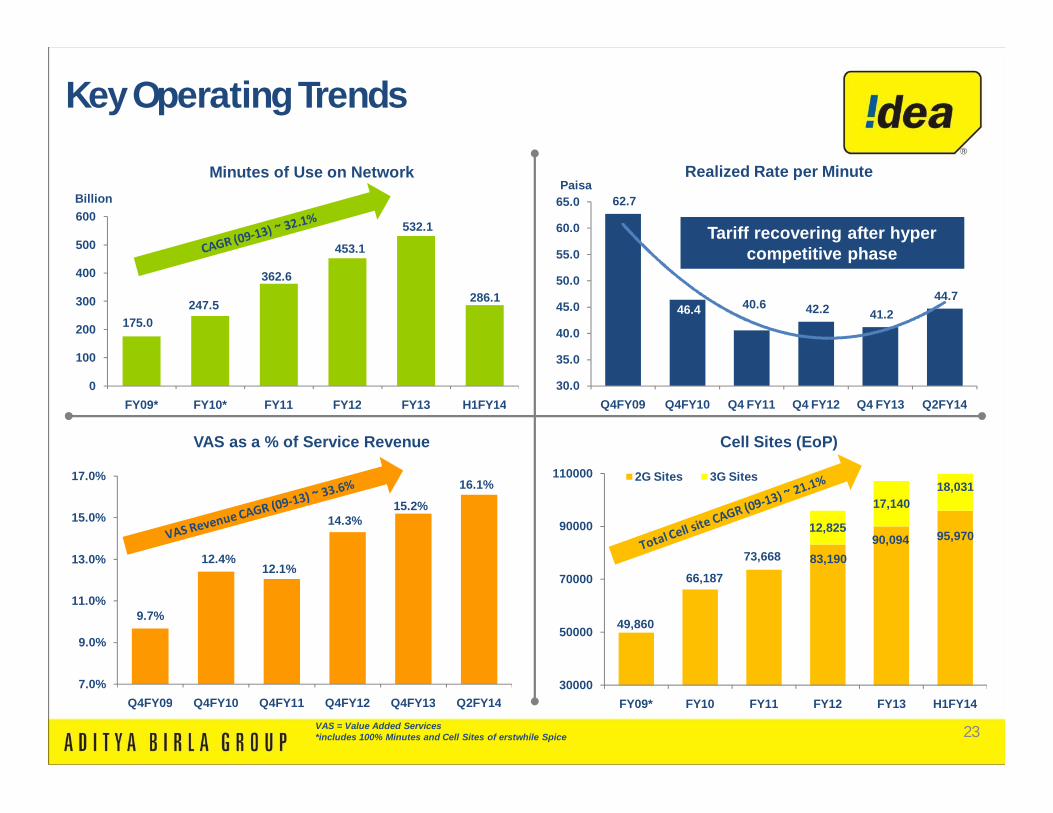
23
VAS as a % of Service Revenue
Realized Rate per Minute
62.7
46.4 40.6 42.2 41.2 44.7
30.0
35.0
40.0
45.0
50.0
55.0
60.0
65.0
Q4FY09 Q4FY10 Q4 FY11 Q4 FY12 Q4 FY13 Q2FY14
PaisaBillion
Cell Sites (EoP)
49,860
66,187
73,668 83,19090,094 95,97012,825
17,14018,031
30000
50000
70000
90000
110000
FY09* FY10 FY11 FY12 FY13 H1FY14
2G Sites 3G Sites
9.7%
12.4%12.1%
14.3%15.2%
16.1%
7.0%
9.0%
11.0%
13.0%
15.0%
17.0%
Q4FY09 Q4FY10 Q4FY11 Q4FY12 Q4FY13 Q2FY14
VAS = Value Added Services*includes 100% Minutes and Cell Sites of erstwhile Spice
Tariff recovering after hyper competitive phase
Key Operating Trends
Minutes of Use on Network
175.0247.5
362.6
453.1
532.1
286.1
0
100
200
300
400
500
600
FY09* FY10* FY11 FY12 FY13 H1FY14

24
8.8 9.5
9.0
7.2
10.1 9.1
0
2
4
6
8
10
12
FY09 FY10 FY11 FY12 FY13 H1FY14
101.5 125.0
155.0
195.4
224.6
128.6
0
40
80
120
160
200
240
FY09 FY10 FY11 FY12 FY13 H1FY14
23.5 31.2
34.1 40.3
49.8
34.4
15.0%
20.0%
25.0%
30.0%
35.0%
0
10
20
30
40
50
60
FY09 FY10 FY11 FY12 FY13 H1FY14
Growth in Revenue
28.4 34.6
37.9
50.960.0
40.527.9% 27.7%
24.5%
26.1%
26.7%
31.5%
20%
22%
24%
26%
28%
30%
32%
34%
0
8
16
24
32
40
48
56
64
FY09 FY10 FY11 FY12 FY13 H1FY14
Growth in EBITDA
Net ProfitsGrowth in Cash Profits(1)
INR Bn
$ 3,
577
Mn $
2,04
9 M
n
$ 95
6 M
n
$ 64
5 M
n
$ 16
1 M
n
$ 14
5Mn
$ 79
3 M
n
$ 54
8 M
n
Financial Trending (Consolidated)
1 Cash profit is calculated as sum of PAT, Depreciation, charge on account of ESOPs and Deferred Tax, for the relevant periodUSD 1 = INR 62.78, RBI Ref rate as of September 30, 2013
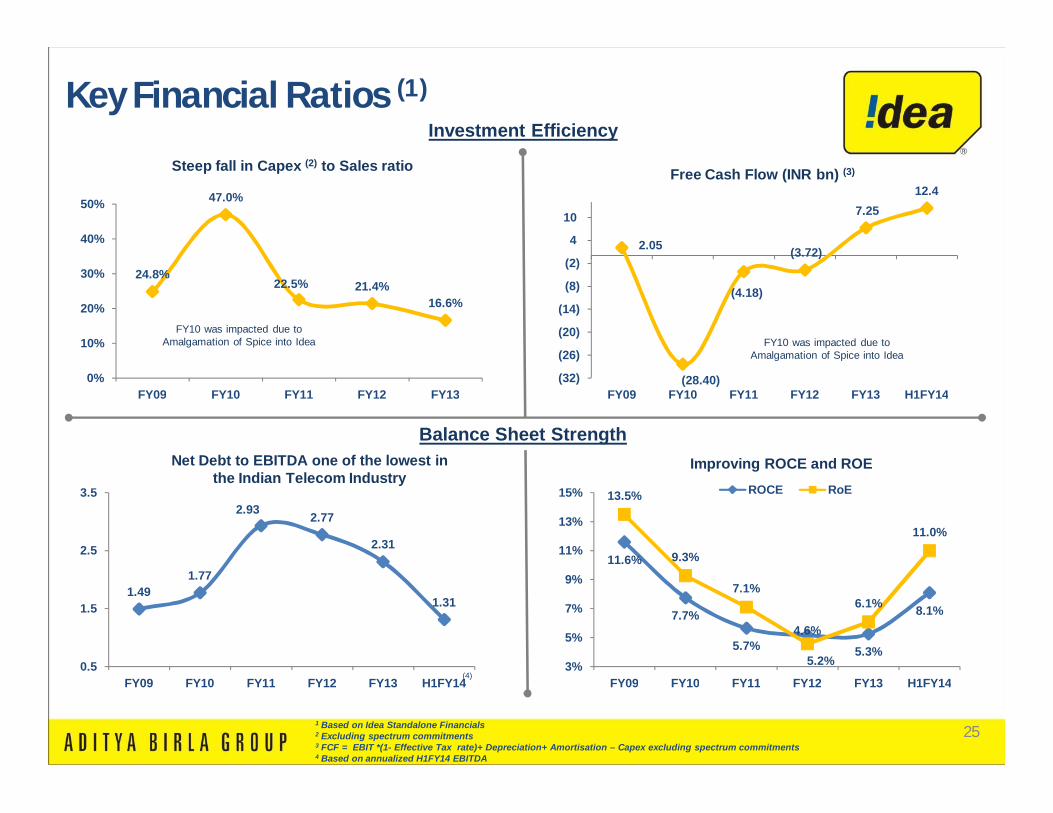
251 Based on Idea Standalone Financials2 Excluding spectrum commitments3 FCF = EBIT *(1- Effective Tax rate)+ Depreciation+ Amortisation – Capex excluding spectrum commitments4 Based on annualized H1FY14 EBITDA
Key Financial Ratios (1)
Balance Sheet Strength
2.05
(28.40)
(4.18)
(3.72)
7.25 12.4
(32)
(26)
(20)
(14)
(8)
(2)
4
10
FY09 FY10 FY11 FY12 FY13 H1FY14
11.6%
7.7%
5.7%5.2%
5.3%
8.1%
13.5%
9.3%
7.1%
4.6%
6.1%
11.0%
3%
5%
7%
9%
11%
13%
15%
FY09 FY10 FY11 FY12 FY13 H1FY14
ROCE RoE
Investment Efficiency
24.8%
47.0%
22.5% 21.4%16.6%
0%
10%
20%
30%
40%
50%
FY09 FY10 FY11 FY12 FY13
1.491.77
2.93 2.77
2.31
1.31
0.5
1.5
2.5
3.5
FY09 FY10 FY11 FY12 FY13 H1FY14
Improving ROCE and ROE
Steep fall in Capex (2) to Sales ratio
Net Debt to EBITDA one of the lowest in the Indian Telecom Industry
Free Cash Flow (INR bn) (3)
FY10 was impacted due to Amalgamation of Spice into Idea FY10 was impacted due to
Amalgamation of Spice into Idea
(4)
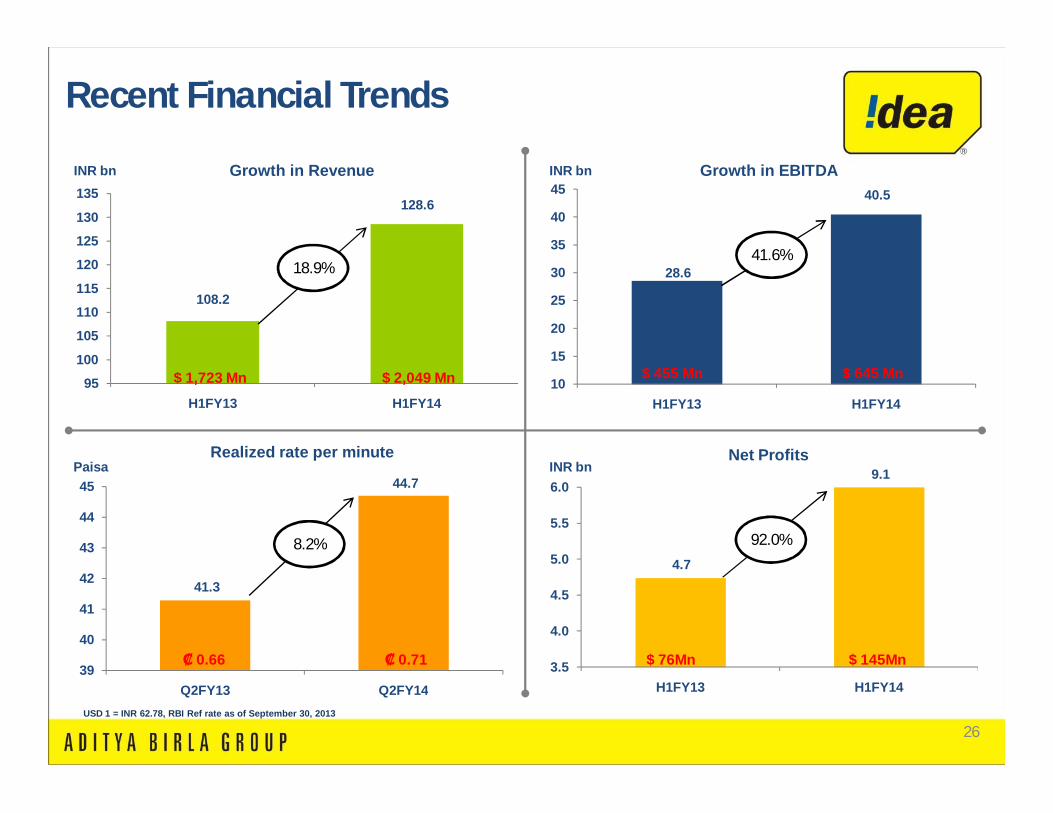
26
108.2
128.6
95
100
105
110
115
120
125
130
135
H1FY13 H1FY14
Growth in RevenueINR bn
28.6
40.5
10
15
20
25
30
35
40
45
H1FY13 H1FY14
Growth in EBITDAINR bn
Net Profits
4.7
9.1
3.5
4.0
4.5
5.0
5.5
6.0
H1FY13 H1FY14
18.9%41.6%
92.0%
Realized rate per minute
41.3
44.7
39
40
41
42
43
44
45
Q2FY13 Q2FY14
8.2%
$ 1,723 Mn $ 2,049 Mn $ 455 Mn $ 645 Mn
$ 76Mn $ 145Mn₡ 0.66 ₡ 0.71
Recent Financial Trends
INR bnPaisa
USD 1 = INR 62.78, RBI Ref rate as of September 30, 2013
27
Appendix
28
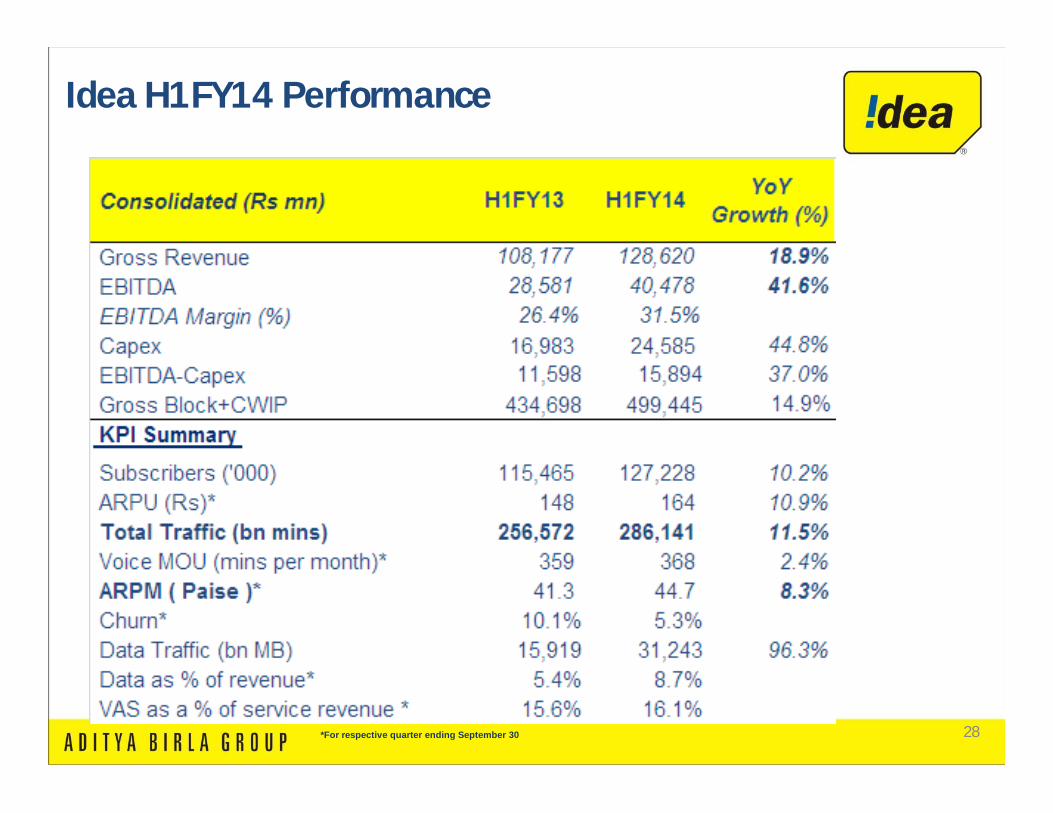
Idea H1FY14 Performance
*For respective quarter ending September 30
29
Board Members
PIC[Smt.
Rajashree Birla]
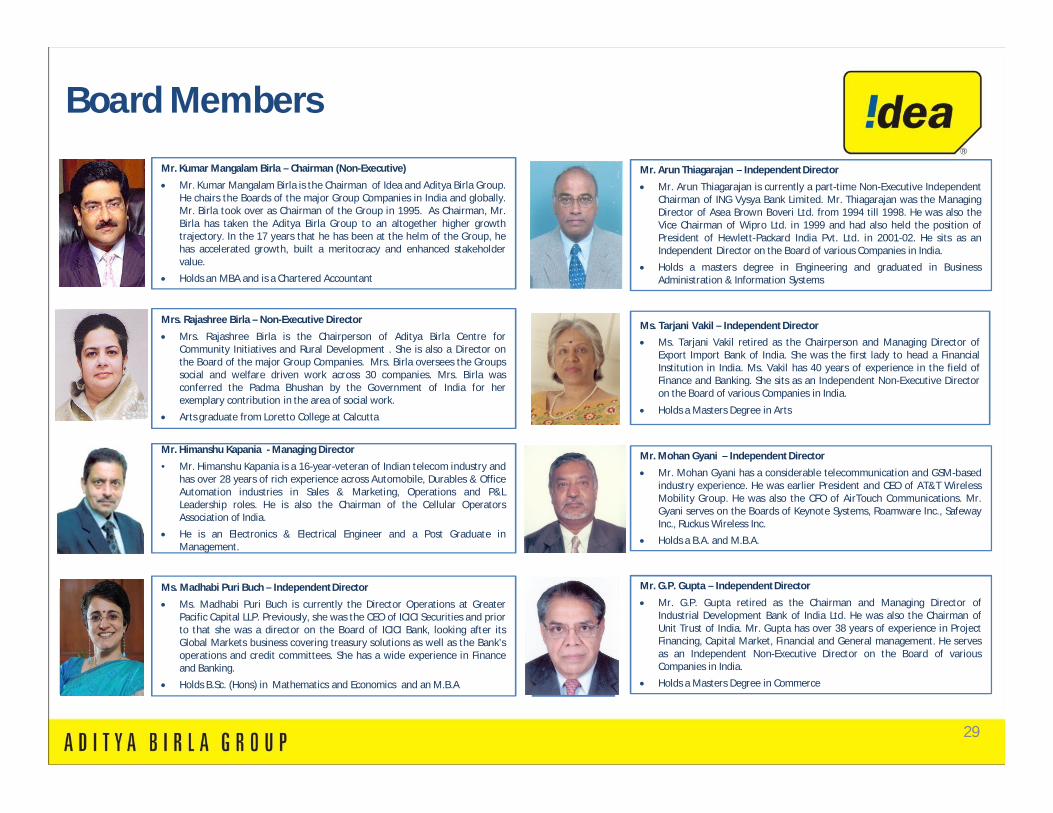
Mrs. Rajashree Birla – Non-Executive Director
Mrs. Rajashree Birla is the Chairperson of Aditya Birla Centre forCommunity Initiatives and Rural Development . She is also a Director onthe Board of the major Group Companies. Mrs. Birla oversees the Groupssocial and welfare driven work across 30 companies. Mrs. Birla wasconferred the Padma Bhushan by the Government of India for herexemplary contribution in the area of social work.
Arts graduate from Loretto College at Calcutta
PIC[Himanshu Kapania]
Mr. Himanshu Kapania - Managing Director
• Mr. Himanshu Kapania is a 16-year-veteran of Indian telecom industry andhas over 28 years of rich experience across Automobile, Durables & OfficeAutomation industries in Sales & Marketing, Operations and P&LLeadership roles. He is also the Chairman of the Cellular OperatorsAssociation of India.
He is an Electronics & Electrical Engineer and a Post Graduate inManagement.
PIC[Madhabi Puri
Buch]
Mr. Arun Thiagarajan – IndependentDirector
Mr. Arun Thiagarajan is currently a part-time Non-Executive IndependentChairman of ING Vysya Bank Limited. Mr. Thiagarajan was the ManagingDirector of Asea Brown Boveri Ltd. from 1994 till 1998. He was also theVice Chairman of Wipro Ltd. in 1999 and had also held the position ofPresident of Hewlett-Packard India Pvt. Ltd. in 2001-02. He sits as anIndependent Director on the Board of various Companies in India.
Holds a masters degree in Engineering and graduated in BusinessAdministration & Information Systems
Ms. Tarjani Vakil – Independent Director
Ms. Tarjani Vakil retired as the Chairperson and Managing Director ofExport Import Bank of India. She was the first lady to head a FinancialInstitution in India. Ms. Vakil has 40 years of experience in the field ofFinance and Banking. She sits as an Independent Non-Executive Directoron the Board of various Companies in India.
Holds a Masters Degree in Arts
Mr. Mohan Gyani – Independent Director
Mr. Mohan Gyani has a considerable telecommunication and GSM-basedindustry experience. He was earlier President and CEO of AT&T WirelessMobility Group. He was also the CFO of AirTouch Communications. Mr.Gyani serves on the Boards of Keynote Systems, Roamware Inc., SafewayInc., Ruckus Wireless Inc.
Holds a B.A. and M.B.A.
Mr. G.P. Gupta – IndependentDirector
Mr. G.P. Gupta retired as the Chairman and Managing Director ofIndustrial Development Bank of India Ltd. He was also the Chairman ofUnit Trust of India. Mr. Gupta has over 38 years of experience in ProjectFinancing, Capital Market, Financial and General management. He servesas an Independent Non-Executive Director on the Board of variousCompanies in India.
Holds a Masters Degree in Commerce
Mr. Kumar Mangalam Birla – Chairman (Non-Executive)
Mr. Kumar Mangalam Birla is the Chairman of Idea and Aditya Birla Group.He chairs the Boards of the major Group Companies in India and globally.Mr. Birla took over as Chairman of the Group in 1995. As Chairman, Mr.Birla has taken the Aditya Birla Group to an altogether higher growthtrajectory. In the 17 years that he has been at the helm of the Group, hehas accelerated growth, built a meritocracy and enhanced stakeholdervalue.
Holds an MBA and is a Chartered Accountant
PIC[Tarjani Vakil]
PIC[Mohan Gyani]
PIC[Gian Prakash
Gupta]
PIC[Mr. Arun
Thiagarajan]
Ms. Madhabi Puri Buch – IndependentDirector
Ms. Madhabi Puri Buch is currently the Director Operations at GreaterPacific Capital LLP. Previously, she was the CEO of ICICI Securities and priorto that she was a director on the Board of ICICI Bank, looking after itsGlobal Markets business covering treasury solutions as well as the Bank’soperations and credit committees. She has a wide experience in Financeand Banking.
Holds B.Sc. (Hons) in Mathematics and Economics and an M.B.A
30
Board Members
PIC[P. Murari]
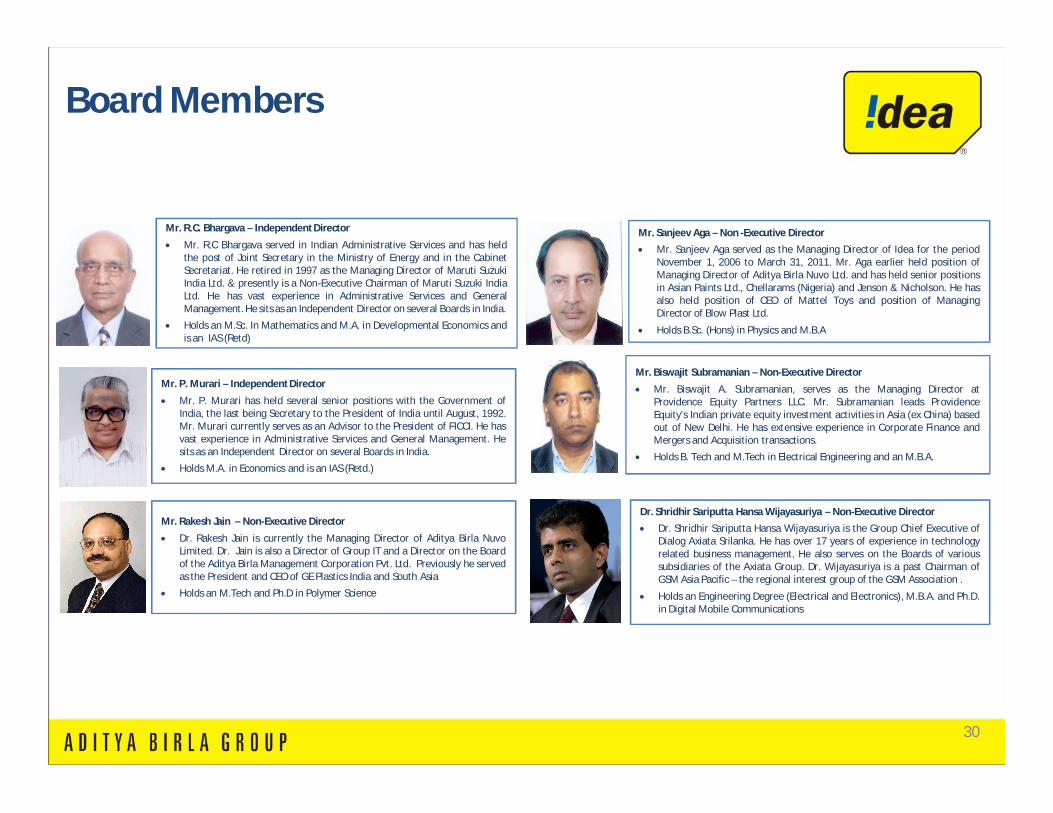
Mr. P. Murari – Independent Director
Mr. P. Murari has held several senior positions with the Government ofIndia, the last being Secretary to the President of India until August, 1992.Mr. Murari currently serves as an Advisor to the President of FICCI. He hasvast experience in Administrative Services and General Management. Hesits as an Independent Director on several Boards in India.
Holds M.A. in Economics and is an IAS (Retd.)
PIC[Rakesh Jain]
Dr. Shridhir Sariputta Hansa Wijayasuriya – Non-Executive Director
Dr. Shridhir Sariputta Hansa Wijayasuriya is the Group Chief Executive ofDialog Axiata Srilanka. He has over 17 years of experience in technologyrelated business management. He also serves on the Boards of varioussubsidiaries of the Axiata Group. Dr. Wijayasuriya is a past Chairman ofGSM Asia Pacific – the regional interest group of the GSM Association .
Holds an Engineering Degree (Electrical and Electronics), M.B.A. and Ph.D.in Digital Mobile Communications
PIC[Dr. Hansa
Wijayasuriya]
PIC[Biswajit
Subramanian]
Mr. R.C. Bhargava – Independent Director
Mr. R.C Bhargava served in Indian Administrative Services and has heldthe post of Joint Secretary in the Ministry of Energy and in the CabinetSecretariat. He retired in 1997 as the Managing Director of Maruti SuzukiIndia Ltd. & presently is a Non-Executive Chairman of Maruti Suzuki IndiaLtd. He has vast experience in Administrative Services and GeneralManagement. He sits as an Independent Director on several Boards in India.
Holds an M.Sc. In Mathematics and M.A. in Developmental Economics andis an IAS (Retd)
PIC[R.C.
Bhargava]
PIC[Sanjeev Aga]
Mr. Biswajit Subramanian – Non-Executive Director
Mr. Biswajit A. Subramanian, serves as the Managing Director atProvidence Equity Partners LLC. Mr. Subramanian leads ProvidenceEquity's Indian private equity investment activities in Asia (ex China) basedout of New Delhi. He has extensive experience in Corporate Finance andMergers and Acquisition transactions.
Holds B. Tech and M.Tech in Electrical Engineering and an M.B.A.
Mr. Sanjeev Aga – Non -Executive Director
Mr. Sanjeev Aga served as the Managing Director of Idea for the periodNovember 1, 2006 to March 31, 2011. Mr. Aga earlier held position ofManaging Director of Aditya Birla Nuvo Ltd. and has held senior positionsin Asian Paints Ltd., Chellarams (Nigeria) and Jenson & Nicholson. He hasalso held position of CEO of Mattel Toys and position of ManagingDirector of Blow Plast Ltd.
Holds B.Sc. (Hons) in Physics and M.B.A
Mr. Rakesh Jain – Non-Executive Director
Dr. Rakesh Jain is currently the Managing Director of Aditya Birla NuvoLimited. Dr. Jain is also a Director of Group IT and a Director on the Boardof the Aditya Birla Management Corporation Pvt. Ltd. Previously he servedas the President and CEO of GE Plastics India and South Asia
Holds an M.Tech and Ph.D in Polymer Science
31
Management Team
Akshaya Moondra
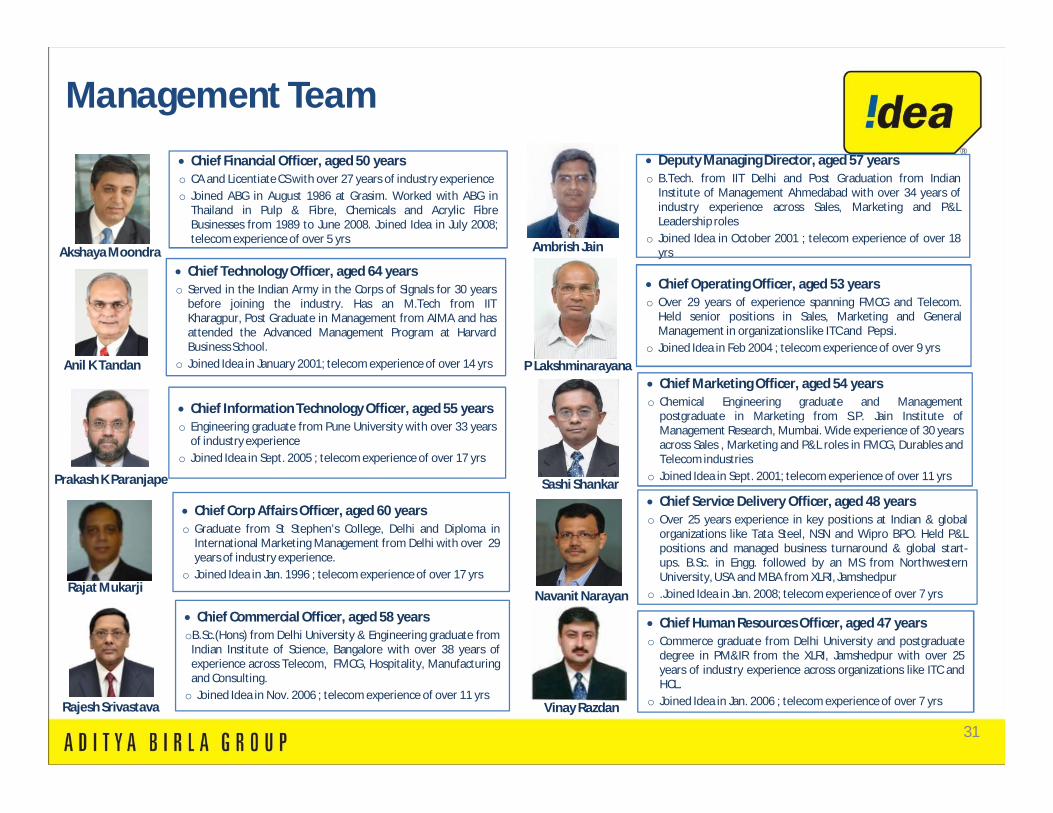
Deputy Managing Director, aged 57 yearso B.Tech. from IIT Delhi and Post Graduation from Indian
Institute of Management Ahmedabad with over 34 years ofindustry experience across Sales, Marketing and P&LLeadership roles
o Joined Idea in October 2001 ; telecom experience of over 18yrs
Chief Financial Officer, aged 50 yearso CA and Licentiate CS with over 27 years of industry experienceo Joined ABG in August 1986 at Grasim. Worked with ABG in
Thailand in Pulp & Fibre, Chemicals and Acrylic FibreBusinesses from 1989 to June 2008. Joined Idea in July 2008;telecom experience of over 5 yrs
Chief Operating Officer, aged 53 yearso Over 29 years of experience spanning FMCG and Telecom.
Held senior positions in Sales, Marketing and GeneralManagement in organizations like ITC and Pepsi.
o Joined Idea in Feb 2004 ; telecom experience of over 9 yrs
Chief Technology Officer, aged 64 yearso Served in the Indian Army in the Corps of Signals for 30 years
before joining the industry. Has an M.Tech from IITKharagpur, Post Graduate in Management from AIMA and hasattended the Advanced Management Program at HarvardBusiness School.
o Joined Idea in January 2001; telecom experience of over 14 yrs
Chief Marketing Officer, aged 54 yearso Chemical Engineering graduate and Management
postgraduate in Marketing from S.P. Jain Institute ofManagement Research, Mumbai. Wide experience of 30 yearsacross Sales , Marketing and P&L roles in FMCG, Durables andTelecom industries
o Joined Idea in Sept. 2001; telecom experience of over 11 yrs
Chief Information Technology Officer, aged 55 yearso Engineering graduate from Pune University with over 33 years
of industry experienceo Joined Idea in Sept. 2005 ; telecom experience of over 17 yrs
Chief Service Delivery Officer, aged 48 yearso Over 25 years experience in key positions at Indian & global
organizations like Tata Steel, NSN and Wipro BPO. Held P&Lpositions and managed business turnaround & global start-ups. B.Sc. in Engg. followed by an MS from NorthwesternUniversity, USA and MBA from XLRI, Jamshedpur
o .Joined Idea in Jan. 2008; telecom experience of over 7 yrs
Chief Corp Affairs Officer, aged 60 yearso Graduate from St Stephen’s College, Delhi and Diploma in
International Marketing Management from Delhi with over 29years of industry experience.
o Joined Idea in Jan. 1996 ; telecom experience of over 17 yrs
Chief Human Resources Officer, aged 47 yearso Commerce graduate from Delhi University and postgraduate
degree in PM&IR from the XLRI, Jamshedpur with over 25years of industry experience across organizations like ITC andHCL.
o Joined Idea in Jan. 2006 ; telecom experience of over 7 yrs
Chief Commercial Officer, aged 58 yearsoB.Sc.(Hons) from Delhi University & Engineering graduate from
Indian Institute of Science, Bangalore with over 38 years ofexperience across Telecom, FMCG, Hospitality, Manufacturingand Consulting.o Joined Idea in Nov. 2006 ; telecom experience of over 11 yrs
Anil K Tandan
Prakash K Paranjape
Rajat Mukarji
Rajesh Srivastava
Ambrish Jain
P Lakshminarayana
Sashi Shankar
Navanit Narayan
Vinay Razdan
32
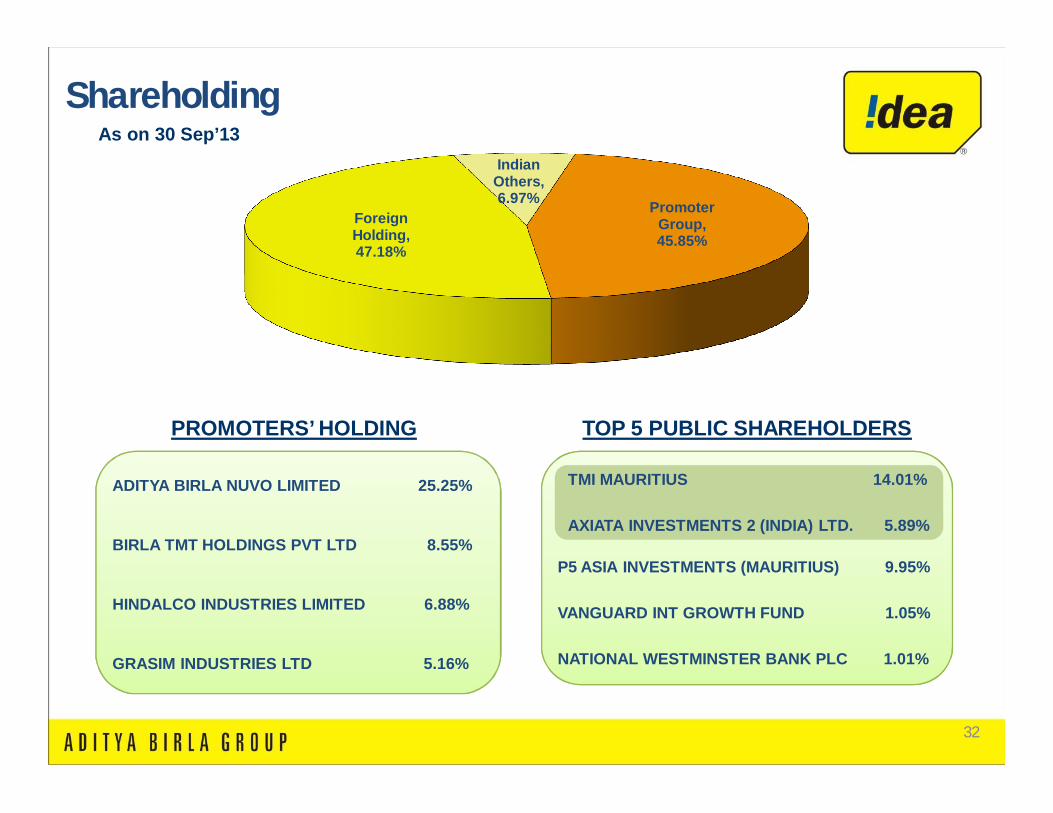
Promoter Group, 45.85%
Foreign Holding, 47.18%
Indian Others, 6.97%
As on 30 Sep’13
PROMOTERS’ HOLDING
ADITYA BIRLA NUVO LIMITED 25.25%
BIRLA TMT HOLDINGS PVT LTD 8.55%
HINDALCO INDUSTRIES LIMITED 6.88%
GRASIM INDUSTRIES LTD 5.16%
TOP 5 PUBLIC SHAREHOLDERS
TMI MAURITIUS 14.0%
AXIATA INVESTMENTS 2 (INDIA) LTD. %
P5 ASIA INVESTMENTS (MAURITIUS) 9.95%
VANGUARD INT GROWTH FUND 1.05%
NATIONAL WESTMINSTER BANK PLC 1.01%
TMI MAURITIUS 14.01%
AXIATA INVESTMENTS 2 (INDIA) LTD. 5.89%
Shareholding
33
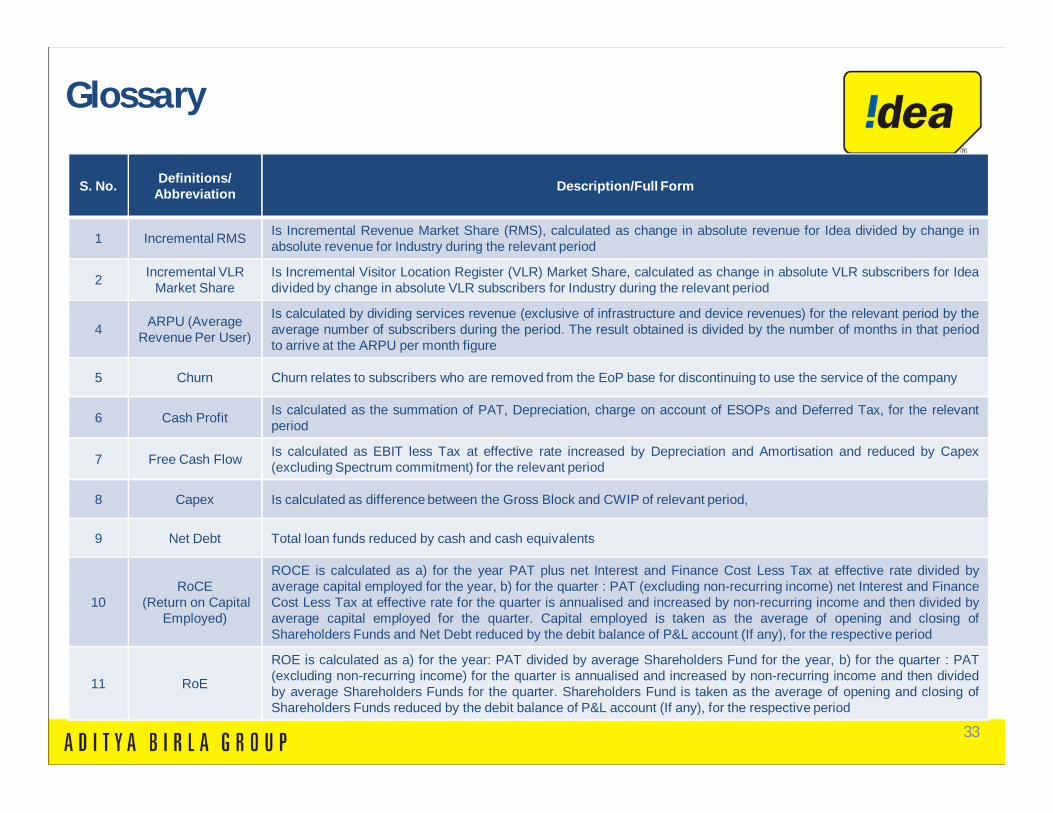
S. No. Definitions/ Abbreviation Description/Full Form
1 Incremental RMS Is Incremental Revenue Market Share (RMS), calculated as change in absolute revenue for Idea divided by change inabsolute revenue for Industry during the relevant period
2 Incremental VLR Market Share
Is Incremental Visitor Location Register (VLR) Market Share, calculated as change in absolute VLR subscribers for Ideadivided by change in absolute VLR subscribers for Industry during the relevant period
4 ARPU (Average Revenue Per User)
Is calculated by dividing services revenue (exclusive of infrastructure and device revenues) for the relevant period by theaverage number of subscribers during the period. The result obtained is divided by the number of months in that periodto arrive at the ARPU per month figure
5 Churn Churn relates to subscribers who are removed from the EoP base for discontinuing to use the service of the company
6 Cash Profit Is calculated as the summation of PAT, Depreciation, charge on account of ESOPs and Deferred Tax, for the relevantperiod
7 Free Cash Flow Is calculated as EBIT less Tax at effective rate increased by Depreciation and Amortisation and reduced by Capex(excluding Spectrum commitment) for the relevant period
8 Capex Is calculated as difference between the Gross Block and CWIP of relevant period,
9 Net Debt Total loan funds reduced by cash and cash equivalents
10RoCE
(Return on CapitalEmployed)
ROCE is calculated as a) for the year PAT plus net Interest and Finance Cost Less Tax at effective rate divided byaverage capital employed for the year, b) for the quarter : PAT (excluding non-recurring income) net Interest and FinanceCost Less Tax at effective rate for the quarter is annualised and increased by non-recurring income and then divided byaverage capital employed for the quarter. Capital employed is taken as the average of opening and closing ofShareholders Funds and Net Debt reduced by the debit balance of P&L account (If any), for the respective period
11 RoE
ROE is calculated as a) for the year: PAT divided by average Shareholders Fund for the year, b) for the quarter : PAT(excluding non-recurring income) for the quarter is annualised and increased by non-recurring income and then dividedby average Shareholders Funds for the quarter. Shareholders Fund is taken as the average of opening and closing ofShareholders Funds reduced by the debit balance of P&L account (If any), for the respective period
Glossary
34
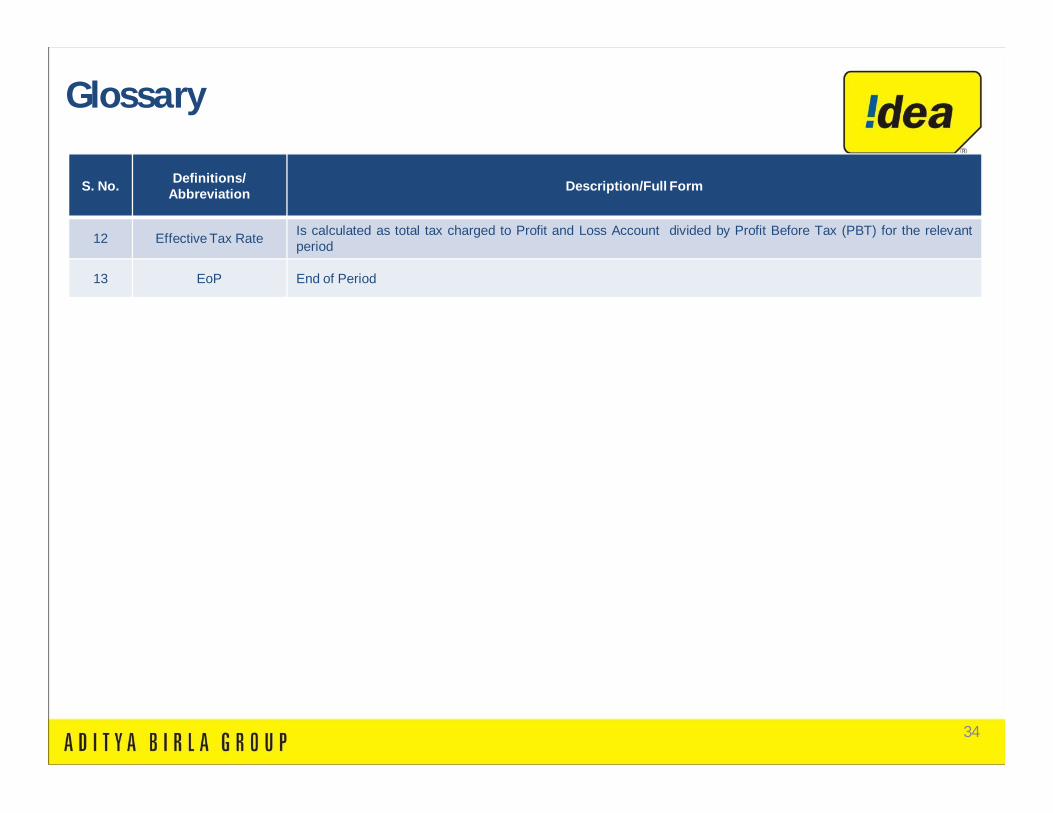
S. No. Definitions/ Abbreviation Description/Full Form
12 Effective Tax Rate Is calculated as total tax charged to Profit and Loss Account divided by Profit Before Tax (PBT) for the relevantperiod
13 EoP End of Period
Glossary

3535
Thank You