IDC study on the Salesforce Economy · October 2017, IDC #US43158917 White Paper The Salesforce...
25
October 2017, IDC #US43158917 White Paper The Salesforce Economy Forecast: 3.3 Million New Jobs and $859 Billion New Business Revenue to Be Created from 2016 to 2022 Sponsored by: Salesforce John F. Gantz October 2017 IN THIS WHITE PAPER This White Paper forecasts the economic contribution of Salesforce and its ecosystem of partners and customers to local economies in terms of jobs and business revenue. The study relies on IDC's forecasts of job creation from organizational use of cloud computing, IDC's understanding of Salesforce's market share, IDC's published research on the number of ancillary products and services that accompany cloud computing implementations, and a custom economic model that estimates the size of the Salesforce ecosystem. This White Paper updates earlier editions published in 2016 and 2015. EXECUTIVE SUMMARY ▪ Worldwide, Salesforce and its ecosystem are expected to enable the creation of 3.3 million jobs within the Salesforce customer base from the use of cloud computing between the end of 2016 and the end of 2022. ▪ Over the same period, the benefits of cloud computing accruing to Salesforce customers will add $859 billion in new business revenue to their local economies and help drive growth in gross domestic product (GDP). ▪ Cloud computing generates these benefits primarily by permitting an increase in IT innovation, which in turn supports business innovation that leads to accelerated development schedules, faster project completion, shorter time to market for new products, and lower operational costs. ▪ Because organizations that spend on cloud computing subscriptions also spend on ancillary products and services, from additional cloud subscription and professional services to supporting software, hardware, and managed services, the Salesforce ecosystem in 2017 is nearly four times bigger than Salesforce itself. By 2022, it will be more than five times bigger. ▪ The United States, because of its large share of cloud computing implementations and Salesforce's global revenue, will generate about half of the world's financial gain from the Salesforce customer set, but many more jobs will be created in emerging markets where labor costs are low. ▪ Between 2016 and 2022, the Salesforce economy's largest impacts on industries will be in finance, with the forecast creation of $164 billion in new business revenue and 585,000 new jobs, and manufacturing, with $159 billion in new business revenue and 638,000 in new jobs.
Transcript of IDC study on the Salesforce Economy · October 2017, IDC #US43158917 White Paper The Salesforce...

October 2017, IDC #US43158917
White Paper
The Salesforce Economy Forecast: 3.3 Million New Jobs and $859 Billion New Business Revenue to Be Created from 2016 to 2022
Sponsored by: Salesforce
John F. Gantz
October 2017
IN THIS WHITE PAPER
This White Paper forecasts the economic contribution of Salesforce and its ecosystem of partners and
customers to local economies in terms of jobs and business revenue.
The study relies on IDC's forecasts of job creation from organizational use of cloud computing, IDC's
understanding of Salesforce's market share, IDC's published research on the number of ancillary
products and services that accompany cloud computing implementations, and a custom economic
model that estimates the size of the Salesforce ecosystem.
This White Paper updates earlier editions published in 2016 and 2015.
EXECUTIVE SUMMARY
▪ Worldwide, Salesforce and its ecosystem are expected to enable the creation of 3.3 million
jobs within the Salesforce customer base from the use of cloud computing between the end of
2016 and the end of 2022.
▪ Over the same period, the benefits of cloud computing accruing to Salesforce customers will
add $859 billion in new business revenue to their local economies and help drive growth in
gross domestic product (GDP).
▪ Cloud computing generates these benefits primarily by permitting an increase in IT innovation,
which in turn supports business innovation that leads to accelerated development schedules,
faster project completion, shorter time to market for new products, and lower operational costs.
▪ Because organizations that spend on cloud computing subscriptions also spend on ancillary
products and services, from additional cloud subscription and professional services to
supporting software, hardware, and managed services, the Salesforce ecosystem in 2017 is
nearly four times bigger than Salesforce itself. By 2022, it will be more than five times bigger.
▪ The United States, because of its large share of cloud computing implementations and
Salesforce's global revenue, will generate about half of the world's financial gain from the
Salesforce customer set, but many more jobs will be created in emerging markets where labor
costs are low.
▪ Between 2016 and 2022, the Salesforce economy's largest impacts on industries will be in
finance, with the forecast creation of $164 billion in new business revenue and 585,000 new
jobs, and manufacturing, with $159 billion in new business revenue and 638,000 in new jobs.

©2017 IDC #US43158917 2
ECONOMIC BENEFITS SUMMARY
Tables 1 and 2 show the summary of the impact of Salesforce as well as its ecosystem of partners and
its customers in the countries and industries studied. Detailed definitions are provided in Appendix B.
TABLE 1
Economic Benefits Summary by Country
Business Revenue
Created ($M),
YE2016–YE2022
Direct Jobs
Created,
YE2016–YE2022
Indirect/Induced
Jobs Created,
YE2016–YE2022
Ecosystem
Revenue/
Salesforce
Revenue,
2016
Ecosystem
Revenue/
Salesforce
Revenue,
2022
Canada 17,072 28,208 47,699 3.7 5.9
United States 411,343 408,760 582,361 3.4 5.0
France 24,346 37,115 108,923 3.6 5.7
Germany 17,024 26,291 43,669 3.3 5.4
Netherlands 7,399 9,651 15,735 3.4 5.5
Spain 2,916 6,877 8,788 4.3 6.6
United Kingdom 65,605 114,545 214,615 3.3 5.4
Rest of Western
Europe
26,145 53,424 100,048 3.3 5.3
Australia 29,563 26,559 52,680 3.2 5.3
India 17,292 363,110 723,866 3.5 5.6
Japan 108,425 153,387 195,102 3.8 6.0
Singapore 2,962 3,810 7,805 3.6 5.7
Brazil 26,958 195,683 330,448 3.9 5.9
Mexico 10,954 81,069 105,415 5.1 7.3
Rest of World 91,224 1,819,284 2,356,688 3.5 5.6
Worldwide 859,228 3,327,773 4,893,842 3.4 5.2
Source: IDC's Salesforce Economic Impact Model, 2017

©2017 IDC #US43158917 3
TABLE 2
Economic Benefits Summary by Industry
Business Revenue
Created ($M),
YE2016–YE2022
Direct Jobs
Created,
YE2016–
YE2022
Indirect/Induced
Jobs Created,
YE2016–YE2022
Ecosystem
Revenue/
Salesforce
Revenue,
2016
Ecosystem
Revenue/
Salesforce
Revenue,
2022
Finance 163,769 584,995 860,164 3.1 4.7
Manufacturing 159,055 638,296 938,548 3.8 5.7
Retail/wholesale 92,612 401,355 590,171 3.4 5.2
Communications and
media
89,847 360,451 529,761 4.3 5.2
Government 50,931 221,640 326,048 3.8 5.7
Health and life sciences* 68,241 244,096 359,219 3.1 4.7
Other 234,774 876,940 1,289,931 3.4 5.2
Worldwide 859,228 3,327,773 4,893,842 3.4 5.2
* Includes private health insurance
Source: IDC's Salesforce Economic Impact Model, 2017
CLOUD COMPUTING: A SOFTWARE ENGINE FOR IT GROWTH
When Salesforce released its first product in 2000, cloud computing was in its infancy, an unproven
computing technique. In fact, cloud computing didn't surpass 1% of IT spending until 2009. Even
today, public cloud computing accounts for less than 6% of IT spending and only 20% of spending on
software.
But despite its small share of the $2.1 trillion IT market, public cloud computing has been a major
contributor to growth in IT spending, as shown in Figure 1.

©2017 IDC #US43158917 4
FIGURE 1
The Rapid Growth of Cloud Computing Software, 2016–2022
Note: SaaS stands for software as a service, including applications and infrastructure software; PaaS stands for platform as a
service, or application development software. Not included is infrastructure as a service, which is basically storage and server
capacity sold as a service.
Source: IDC's Salesforce Economic Impact Model, 2017
HOW SALESFORCE CLOUD OFFERINGS DRIVE BENEFITS
IDC has been tracking and predicting the impact of cloud computing on local economies since 2009.
That research, along with research by other academics, shows that the economic impact of cloud
computing is much larger than just the efficiencies it can bring to an IT organization.
The leverage from cloud computing comes from the fact that so much of traditional IT is tied up with
maintenance of legacy systems and routine upgrades — in fact, 71% according to a survey conducted
by IDC in 2015.
By outsourcing these routine, low-value-add tasks to cloud providers, IT organizations can shift budget
and personnel to innovation to support new business opportunities, which in turn drives new business
revenue. In fact, IDC estimates that for 2017, public and private IT cloud services will account for
$1.2 trillion in business revenue — in a global economy of $180 trillion in revenue.
Because Salesforce represents nearly 10% of the public cloud software market, and its ecosystem
even more, a not insubstantial share of all that revenue will accrue to Salesforce customers.
In fact, IDC estimates that from the end of 2016 to the end of 2022, the use of cloud computing will add
$859 billion in revenue — nearly $140 billion a year — to the ongoing revenue streams of Salesforce
customers (see Figure 2). The revenue and growth will help drive the gross domestic product of their
economies.
$80
$97
$116
$136
$158
$185
$216
2016 2017 2018 2019 2020 2021 2022
Worldwide Spending on Public Cloud IT Services (SaaS and PaaS), $B
Cloud Computing: Average Compound Growth, YE2017-YE2022, 17%Total IT Spending: Average Compound Growth, YE2017-YE2022, 4%

©2017 IDC #US43158917 5
FIGURE 2
$859 Billion in Net-New* Global Revenue from Cloud Computing by Salesforce
Customers, 2016–2022
Source: IDC's Salesforce Economic Impact Model, 2017
That revenue in turn generates employment — someone has to design, market, sell, produce, and
services the products and services driving revenue.
IDC estimates a net increase in jobs produced in the Salesforce economy of 3.3 million from the end of
2016 to the end of 2022, as shown in Figure 3.
FIGURE 3
3.3 Million in Net-New* Global Jobs from Cloud Computing by Salesforce
Customers, 2016–2022
Source: IDC's Salesforce Economic Impact Model, 2017
$0$28
$64
$103
$157
$218
$290
2016 2017 2018 2019 2020 2021 2022
* Net-New Revenue = difference from 2016 ($B)
-
302,252
692,099
1,140,407
1,761,956
2,533,171
3,327,773
2016 2017 2018 2019 2020 2021 2022
* Difference from Cloud-Related Jobs in 2016

©2017 IDC #US43158917 6
There are also additional jobs created in the supply and distribution chains serving those Salesforce
customers and from new company employees spending money in the general economy. These jobs,
called indirect or induced jobs by economists, are not calculated here, but economists generally
estimate that every direct job creates more than 1–2 indirect or induced jobs.
The distribution of the impact on business revenue can be seen in Figure 4, which compares the share
of spending on public cloud computing with the business revenue generated by the use of cloud
computing.
The aggregate business revenue in the emerging economies captured in Rest of World is higher as a
share of cloud spending than in developed economies because they are dealing with less existing IT
infrastructure to hamper IT innovation and are just beginning their journey to the cloud.
FIGURE 4
Share of Aggregate Revenue Creation, 2016–2022
Source: IDC's Salesforce Economic Impact Model, 2017
50%
17%
33%
61%
21% 19%
North America Western Europe Rest of World
Cloud revenue creation
Spending on cloud

©2017 IDC #US43158917 7
The impact of the ecosystem by industry is shown in Figure 5. The distribution of business revenue
created roughly tracks spending on cloud computing, with some differences by industry. For instance,
while finance is forecast to create more revenue than manufacturing, it will create fewer jobs — a
function of the higher salaries in finance.
Note that healthcare includes private health insurance and life sciences, which harvest spending from
pharmaceuticals and biotech (manufacturing), government, education, and professional services ("other").
FIGURE 5
Aggregate Revenue Creation, 2016–2022 ($B)
Source: IDC's Salesforce Economic Impact Model, 2017
THE SALESFORCE ECOSYSTEM
IDC's research shows that, for the most part, every cloud subscription sold is accompanied by other
products and services. These can include additional cloud subscriptions, for storage or security;
additional software, for cloud services management or add-on analytics; or even hardware or
networking, especially for private cloud computing implementations.
These additional products and services mean that the ecosystem that surrounds Salesforce
implementations is larger than Salesforce itself. It is also expected to grow faster based on the
expected growth of the Salesforce partner network and the expected growth of ancillary products and
services needed by customers as their implementations become more complex and mission critical.
$164 $159
$93 $90
$51$68
$235
Finance Manufacturing Retail/wholesale
Communications/media
Government Health Other

©2017 IDC #US43158917 8
In fact, IDC estimates that in 2017, for every dollar Salesforce will make, the ecosystem will make
$3.67. By 2022, that figure will be $5.18 (see Figure 6).
FIGURE 6
Worldwide Salesforce Ecosystem Growth, 2016–2022
Note: Data is for dollars of ecosystem revenue for a dollar of Salesforce revenue.
Source: IDC's Salesforce Economic Impact Model, 2017
Based on past surveys conducted by IDC in the constellation of products and services that surround a
cloud services implementation, IDC tracks the Salesforce ecosystem by category, as shown in Figure 7.
Over time, the category percentages will change somewhat — less hardware, more premises software —
but not by much.
FIGURE 7
The Salesforce Makeup by Category, 2017
Source: IDC's Salesforce Economic Impact Model, 2017
$3.44$3.67
$3.95$4.24
$4.54$4.86
$5.18
2016 2017 2018 2019 2020 2021 2022
Additional cloud
subscriptions
(17%)
Premises software (7%)Professional
services (including training)
(65%)
Non-IT consulting
(1%)
Hardware and network
(10%)
Total = 100%

©2017 IDC #US43158917 9
Note that the Salesforce ecosystem includes all companies that provide the products and services that
surround a Salesforce implementation. Many, but not all, will be recognized Salesforce partners. The
others may be brought into the project by partners or by the end-user organizations themselves. And
any single Salesforce partner could well make a higher multiple of Salesforce than the aggregate
ecosystem average.
What drives the partners?
First there's the chance to grow revenue. In a survey of 75 partners in 2016, respondents reported a
48% increase in revenue year on year. Ecosystem revenue as a whole is expected to more than triple
from 2016 to 2022.
The partners cited other specific benefits from working with Salesforce, such as:
▪ Using the Salesforce Platform development tools cut their development time 40% compared
with traditional development methods.
▪ Using the Salesforce Platform allowed them to cut the cost of quality assurance by 45% and
decrease time to market by 39%.
▪ Using the Salesforce AppExchange allowed them to increase market reach 13% and improve
their sales closing rate by 39%.
Specific developer ratings of the Salesforce advantage can be seen in ratings from the 2016 survey,
as shown in Figure 8.
FIGURE 8
Benefits of Developing Using Salesforce Tools
n = 75
Note: Mean scores are based on a scale of 1–10, with 10 being most important.
Source: IDC's Salesforce ISV Partner Survey, July 2016
6.7
7.4
7.5
7.5
7.6
7.7
Increases product breadth
Increases product or service quality
Cuts in-house development time and costs
Cuts in-house costs for labor and overhead
Other (customer reach, agility, awareness,features, etc.)
Decreases time to market

©2017 IDC #US43158917 10
Other advantages mentioned by Salesforce partners in the 2016 survey and interviews include:
▪ Salesforce brand recognition and reputation
▪ Product quality and ease of integration, as well as depth and breadth
▪ The ability to reach the market using AppExchange
▪ Increased leverage with lines of business and C-suite executives
▪ Analytics and marketing support
CONCLUSION
The world's enterprises are in the midst of a major transformation: a digital transformation that started
with the dot-com era and will extend years into the future. And cloud computing, growing at a much
faster pace than IT as a whole, is a major factor in that transformation. In fact, it is helping anchor a
forecast 17% annual growth for products and services supporting digital transformation projects, which
will reach $2 trillion by 2020.
The messages in this study for organizations utilizing or interested in cloud computing are:
▪ The payoff to the larger organization — in business agility, shaping customer experiences, and
bringing new products to new markets — is much greater than the impact on the IT
organization, just as digital transformation is more than an IT function.
▪ Successful implementations require concerted efforts on the part of customers, cloud
providers, and providers of ancillary services and products. Salesforce, as a recognized
market leader, helps bring all three to the table. The maturity model for cloud computing
entails migration from ad hoc projects to a "cloud" approach. Organizations on this journey
need suppliers that can support them all the way.
▪ The breadth and variety of cloud applications and development platforms available today
mean that most of an organization's business processes and workflows can be migrated to the
cloud. Legacy systems — the large enterprise applications installed in past decades — can
become part of the digital transformation.
IDC's forecasts show a significant payback from investments in cloud computing out to 2022. But even
by then, spending on public cloud computing will be less than 13% of spending on IT. We are still on
the ground floor of cloud computing, with lots of headroom for more payback.
Salesforce and its ecosystem are well positioned to help customers take advantage of that headroom.

©2017 IDC #US43158917 11
APPENDIX A: DETAILED BENEFITS DATA
Tables 3–18 show IDC's estimates of the impact of the Salesforce economy by country.
TABLE 3
U.S. Job Creation and Business Revenue from the Use of Cloud Computing and
Salesforce Ecosystem Ratio, 2016–2022
2016 2017 2018 2019 2020 2021 2022
Direct jobs 216,979 262,142 316,012 375,013 446,249 528,425 625,739
Business revenue created ($M)* 61,930 75,837 93,121 112,728 137,710 165,878 197,652
Indirect/induced jobs 293,115 363,209 429,975 509,116 628,007 700,368 875,476
Ecosystem-to-Salesforce revenue ratio 3.40 3.61 3.87 4.13 4.40 4.67 4.95
* Business revenue differs from GDP as it includes business-to-business sales, not just value added.
Source: IDC's Salesforce Economic Impact Model, 2017
TABLE 4
Canada Job Creation and Business Revenue from the Use of Cloud Computing
and Salesforce Ecosystem Ratio, 2016–2022
2016 2017 2018 2019 2020 2021 2022
Direct jobs 15,690 18,617 21,536 25,188 30,414 36,506 43,898
Business revenue created ($M)* 2,856 3,452 4,058 4,820 5,896 7,206 8,778
Indirect/induced jobs 24,437 29,921 33,980 39,720 50,105 56,226 72,136
Ecosystem-to-Salesforce revenue ratio 3.74 4.03 4.36 4.70 5.07 5.46 5.87
* Business revenue differs from GDP as it includes business-to-business sales, not just value added.
Source: IDC's Salesforce Economic Impact Model, 2017
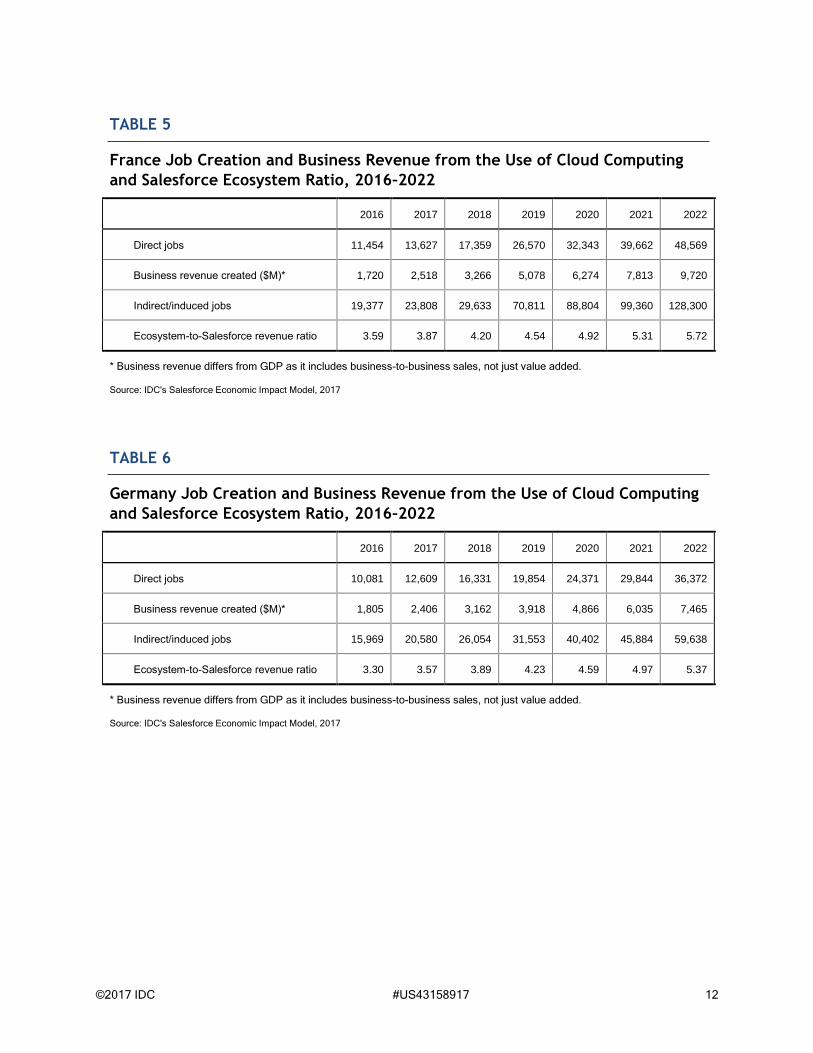
©2017 IDC #US43158917 12
TABLE 5
France Job Creation and Business Revenue from the Use of Cloud Computing
and Salesforce Ecosystem Ratio, 2016–2022
2016 2017 2018 2019 2020 2021 2022
Direct jobs 11,454 13,627 17,359 26,570 32,343 39,662 48,569
Business revenue created ($M)* 1,720 2,518 3,266 5,078 6,274 7,813 9,720
Indirect/induced jobs 19,377 23,808 29,633 70,811 88,804 99,360 128,300
Ecosystem-to-Salesforce revenue ratio 3.59 3.87 4.20 4.54 4.92 5.31 5.72
* Business revenue differs from GDP as it includes business-to-business sales, not just value added.
Source: IDC's Salesforce Economic Impact Model, 2017
TABLE 6
Germany Job Creation and Business Revenue from the Use of Cloud Computing
and Salesforce Ecosystem Ratio, 2016–2022
2016 2017 2018 2019 2020 2021 2022
Direct jobs 10,081 12,609 16,331 19,854 24,371 29,844 36,372
Business revenue created ($M)* 1,805 2,406 3,162 3,918 4,866 6,035 7,465
Indirect/induced jobs 15,969 20,580 26,054 31,553 40,402 45,884 59,638
Ecosystem-to-Salesforce revenue ratio 3.30 3.57 3.89 4.23 4.59 4.97 5.37
* Business revenue differs from GDP as it includes business-to-business sales, not just value added.
Source: IDC's Salesforce Economic Impact Model, 2017

©2017 IDC #US43158917 13
TABLE 7
Netherlands Job Creation and Business Revenue from the Use of Cloud
Computing and Salesforce Ecosystem Ratio, 2016–2022
2016 2017 2018 2019 2020 2021 2022
Direct jobs 3,766 4,545 5,807 7,190 8,859 10,919 13,417
Business revenue created ($M)* 719 1,000 1,292 1,623 2,034 2,557 3,208
Indirect/induced jobs 5,886 7,305 9,128 11,258 14,428 16,572 21,621
Ecosystem-to-Salesforce revenue ratio 3.41 3.68 4.01 4.34 4.70 5.09 5.49
* Business revenue differs from GDP as it includes business-to-business sales, not just value added.
Source: IDC's Salesforce Economic Impact Model, 2017
TABLE 8
Spain Job Creation and Business Revenue from the Use of Cloud Computing and
Salesforce Ecosystem Ratio, 2016–2022
2016 2017 2018 2019 2020 2021 2022
Direct jobs 2,063 2,712 3,521 4,435 5,580 7,048 8,940
Business revenue created ($M)* 293 380 505 643 813 1,031 1,302
Indirect/induced jobs 2,556 3,423 4,386 5,514 7,122 8,602 11,344
Ecosystem-to-Salesforce revenue ratio 4.33 4.62 5.00 5.36 5.76 6.18 6.62
* Business revenue differs from GDP as it includes business-to-business sales, not just value added.
Source: IDC's Salesforce Economic Impact Model, 2017

©2017 IDC #US43158917 14
TABLE 9
U.K. Job Creation and Business Revenue from the Use of Cloud Computing and
Salesforce Ecosystem Ratio, 2016–2022
2016 2017 2018 2019 2020 2021 2022
Direct jobs 48,380 59,375 73,800 90,190 109,793 134,065 162,925
Business revenue created ($M)* 8,282 10,295 13,040 16,169 20,006 24,971 30,816
Indirect/induced jobs 85,660 108,495 131,603 160,234 204,567 229,791 300,275
Ecosystem-to-Salesforce revenue ratio 3.32 3.60 3.94 4.28 4.64 5.02 5.42
* Business revenue differs from GDP as it includes business-to-business sales, not just value added.
Source: IDC's Salesforce Economic Impact Model, 2017
TABLE 10
Rest of Western Europe Job Creation and Business Revenue from the Use of
Cloud Computing and Salesforce Ecosystem Ratio, 2016–2022
2016 2017 2018 2019 2020 2021 2022
Direct jobs 21,868 27,045 33,605 40,355 48,214 60,290 75,292
Business revenue created ($M)* 3,545 4,402 5,484 6,636 8,017 10,104 12,769
Indirect/induced jobs 38,717 49,420 59,925 71,696 89,833 103,339 138,765
Ecosystem-to-Salesforce revenue ratio 3.29 3.55 3.87 4.18 4.53 4.90 5.28
* Business revenue differs from GDP as it includes business-to-business sales, not just value added.
Source: IDC's Salesforce Economic Impact Model, 2017

©2017 IDC #US43158917 15
TABLE 11
Australia Job Creation and Business Revenue from the Use of Cloud Computing
and Salesforce Ecosystem Ratio, 2016–2022
2016 2017 2018 2019 2020 2021 2022
Direct jobs 11,666 14,231 17,351 21,140 25,793 31,500 38,225
Business revenue created ($M)* 4,634 4,800 5,787 6,555 10,786 13,265 16,170
Indirect/induced jobs 21,340 27,127 32,142 39,023 50,400 55,964 74,020
Ecosystem-to-Salesforce revenue ratio 3.19 3.48 3.81 4.14 4.50 4.88 5.28
* Business revenue differs from GDP as it includes business-to-business sales, not just value added.
Source: IDC's Salesforce Economic Impact Model, 2017
TABLE 12
India Job Creation and Business Revenue from the Use of Cloud Computing and
Salesforce Ecosystem Ratio, 2016–2022
2016 2017 2018 2019 2020 2021 2022
Direct jobs 193,313 224,610 279,042 317,735 398,897 473,204 556,423
Business revenue created ($M)* 1,769 2,265 3,037 3,734 4,964 6,237 7,669
Indirect/induced jobs 353,604 428,160 516,918 586,509 779,449 840,728 1,077,470
Ecosystem-to-Salesforce revenue ratio 3.46 3.74 4.07 4.41 4.78 5.17 5.57
* Business revenue differs from GDP as it includes business-to-business sales, not just value added.
Source: IDC's Salesforce Economic Impact Model, 2017

©2017 IDC #US43158917 16
TABLE 13
Japan Job Creation and Business Revenue from the Use of Cloud Computing
and Salesforce Ecosystem Ratio, 2016–2022
2016 2017 2018 2019 2020 2021 2022
Direct jobs 69,776 88,617 107,889 126,171 153,725 186,255 223,163
Business revenue created ($M)* 11,672 16,046 21,066 25,178 31,065 38,378 46,726
Indirect/induced jobs 84,909 110,488 132,113 153,994 194,316 221,828 280,011
Ecosystem-to-Salesforce revenue ratio 3.81 4.12 4.46 4.81 5.19 5.58 6.00
* Business revenue differs from GDP as it includes business-to-business sales, not just value added.
Source: IDC's Salesforce Economic Impact Model, 2017
TABLE 14
Singapore Job Creation and Business Revenue from the Use of Cloud Computing
and Salesforce Ecosystem Ratio, 2016–2022
2016 2017 2018 2019 2020 2021 2022
Direct jobs 2,649 3,164 3,789 4,383 4,974 5,674 6,459
Business revenue created ($M)* 481 605 744 884 1,039 1,202 1,374
Indirect/induced jobs 5,036 6,238 7,281 8,406 10,092 10,434 12,841
Ecosystem-to-Salesforce revenue ratio 3.56 3.84 4.18 4.52 4.89 5.27 5.68
* Business revenue differs from GDP as it includes business-to-business sales, not just value added.
Source: IDC's Salesforce Economic Impact Model, 2017
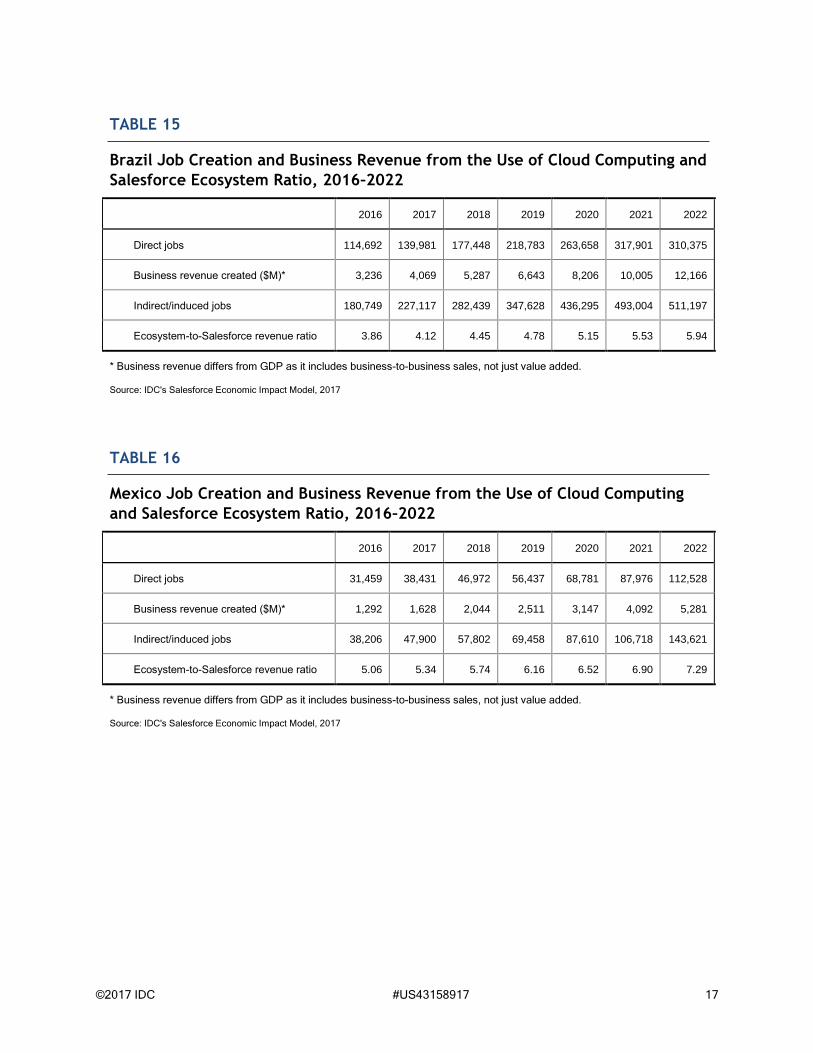
©2017 IDC #US43158917 17
TABLE 15
Brazil Job Creation and Business Revenue from the Use of Cloud Computing and
Salesforce Ecosystem Ratio, 2016–2022
2016 2017 2018 2019 2020 2021 2022
Direct jobs 114,692 139,981 177,448 218,783 263,658 317,901 310,375
Business revenue created ($M)* 3,236 4,069 5,287 6,643 8,206 10,005 12,166
Indirect/induced jobs 180,749 227,117 282,439 347,628 436,295 493,004 511,197
Ecosystem-to-Salesforce revenue ratio 3.86 4.12 4.45 4.78 5.15 5.53 5.94
* Business revenue differs from GDP as it includes business-to-business sales, not just value added.
Source: IDC's Salesforce Economic Impact Model, 2017
TABLE 16
Mexico Job Creation and Business Revenue from the Use of Cloud Computing
and Salesforce Ecosystem Ratio, 2016–2022
2016 2017 2018 2019 2020 2021 2022
Direct jobs 31,459 38,431 46,972 56,437 68,781 87,976 112,528
Business revenue created ($M)* 1,292 1,628 2,044 2,511 3,147 4,092 5,281
Indirect/induced jobs 38,206 47,900 57,802 69,458 87,610 106,718 143,621
Ecosystem-to-Salesforce revenue ratio 5.06 5.34 5.74 6.16 6.52 6.90 7.29
* Business revenue differs from GDP as it includes business-to-business sales, not just value added.
Source: IDC's Salesforce Economic Impact Model, 2017

©2017 IDC #US43158917 18
TABLE 17
Rest of World Job Creation and Business Revenue from the Use of Cloud
Computing and Salesforce Ecosystem Ratio, 2016–2022
2016 2017 2018 2019 2020 2021 2022
Direct jobs 561,078 707,460 886,551 1,121,877 1,455,219 1,898,816 2,380,362
Business revenue created ($M)* 12,280 14,764 18,471 22,535 28,296 35,245 45,594
Indirect/induced jobs 681,415 881,764 1,090,962 1,380,729 1,853,584 2,303,320 3,038,103
Ecosystem-to-Salesforce revenue ratio 3.53 3.80 4.12 4.45 4.81 5.19 5.59
* Business revenue differs from GDP as it includes business-to-business sales, not just value added.
Source: IDC's Salesforce Economic Impact Model, 2017
TABLE 18
Worldwide Job Creation and Business Revenue from the Use of Cloud
Computing and Salesforce Ecosystem Ratio, 2016–2022
2016 2017 2018 2019 2020 2021 2022
Direct jobs 1,314,914 1,617,166 2,007,013 2,455,321 3,076,870 3,848,085 4,642,687
Business revenue created ($M)* 116,514 144,469 180,365 219,655 273,119 334,019 406,689
Indirect/induced jobs 1,850,976 2,334,955 2,844,341 3,485,649 4,535,014 5,292,138 6,744,818
Ecosystem-to-Salesforce revenue ratio 3.44 3.67 3.95 4.24 4.54 4.86 5.18
* Business revenue differs from GDP as it includes business-to-business sales, not just value added.
Source: IDC's Salesforce Economic Impact Model, 2017

©2017 IDC #US43158917 19
Tables 19–26 show IDC's estimates of the impact of the Salesforce economy by industry. Note that
health and life sciences includes private health insurance.
TABLE 19
Finance Industry Job Creation and Business Revenue from the Use of Cloud
Computing and Salesforce Ecosystem Ratio, 2016–2022
2016 2017 2018 2019 2020 2021 2022
Direct jobs 228,144 281,061 349,112 428,573 538,304 673,610 813,139
Business revenue created ($M)* 21,915 27,222 34,019 41,573 51,807 63,400 77,240
Indirect/induced jobs 321,152 405,814 494,764 608,413 793,410 926,393 1,181,316
Ecosystem-to-Salesforce revenue ratio 3.10 3.32 3.57 3.83 4.10 4.38 4.67
* Business revenue differs from GDP as it includes business-to-business sales, not just value added.
Source: IDC's Salesforce Economic Impact Model, 2017
TABLE 20
Manufacturing Industry Job Creation and Business Revenue from the Use of
Cloud Computing and Salesforce Ecosystem Ratio, 2016–2022
2016 2017 2018 2019 2020 2021 2022
Direct jobs 249,314 305,619 378,822 462,890 580,721 731,003 887,610
Business revenue created ($M)* 21,554 26,640 33,223 40,412 50,300 61,921 75,882
Indirect/induced jobs 350,955 441,266 536,863 657,137 855,927 1,005,323 1,289,503
Ecosystem-to-Salesforce revenue ratio 3.79 4.05 4.36 4.68 5.01 5.36 5.71
* Business revenue differs from GDP as it includes business-to-business sales, not just value added.
Source: IDC's Salesforce Economic Impact Model, 2017

©2017 IDC #US43158917 20
TABLE 21
Communications and Media Industry Job Creation and Business Revenue from
the Use of Cloud Computing and Salesforce Ecosystem Ratio, 2016–2022
2016 2017 2018 2019 2020 2021 2022
Direct jobs 135,312 167,035 208,373 256,127 322,769 407,291 495,763
Business revenue created ($M)* 11,698 14,560 18,274 22,361 27,957 34,500 42,383
Indirect/induced jobs 190,476 241,175 295,306 363,606 475,730 560,133 720,237
Ecosystem-to-Salesforce revenue ratio 4.33 4.62 5.00 5.36 5.76 6.18 5.19
* Business revenue differs from GDP as it includes business-to-business sales, not just value added.
Source: IDC's Salesforce Economic Impact Model, 2017
TABLE 22
Retail/Wholesale Industry Job Creation and Business Revenue from the Use of
Cloud Computing and Salesforce Ecosystem Ratio, 2016–2022
2016 2017 2018 2019 2020 2021 2022
Direct jobs 157,182 194,462 242,440 296,973 371,876 464,029 558,537
Business revenue created ($M)* 12,354 15,410 19,329 23,570 29,283 35,733 43,409
Indirect/induced jobs 221,262 280,775 343,587 421,592 548,110 638,163 811,433
Ecosystem-to-Salesforce revenue ratio 3.45 3.68 3.96 4.25 4.56 4.87 5.19
* Business revenue differs from GDP as it includes business-to-business sales, not just value added.
Source: IDC's Salesforce Economic Impact Model, 2017

©2017 IDC #US43158917 21
TABLE 23
Health and Life Sciences Industry Job Creation and Business Revenue from the
Use of Cloud Computing and Salesforce Ecosystem Ratio, 2016–2022
2016 2017 2018 2019 2020 2021 2022
Direct jobs 101,987 123,687 152,061 184,703 231,708 288,294 346,083
Business revenue created ($M)* 9,797 11,980 14,818 17,917 22,300 27,134 32,874
Indirect/induced jobs 143,565 178,586 215,502 262,209 341,516 396,480 502,784
Ecosystem-to-Salesforce revenue ratio 3.10 3.32 3.57 3.83 4.10 4.38 4.67
* Business revenue differs from GDP as it includes business-to-business sales, not just value added.
Source: IDC's Salesforce Economic Impact Model, 2017
TABLE 24
Government Industry Job Creation and Business Revenue from the Use of Cloud
Computing and Salesforce Ecosystem Ratio, 2016–2022
2016 2017 2018 2019 2020 2021 2022
Direct jobs 89,864 110,187 136,825 166,722 207,121 258,628 311,504
Business revenue created ($M)* 7,063 8,732 10,909 13,232 16,309 19,916 24,210
Indirect/induced jobs 126,500 159,095 193,909 236,683 305,277 355,683 452,548
Ecosystem-to-Salesforce revenue ratio 3.79 4.05 4.36 4.68 5.01 5.36 5.71
* Business revenue differs from GDP as it includes business-to-business sales, not just value added.
Source: IDC's Salesforce Economic Impact Model, 2017

©2017 IDC #US43158917 22
TABLE 25
Other Industry Job Creation and Business Revenue from the Use of Cloud
Computing and Salesforce Ecosystem Ratio, 2016–2022
2016 2017 2018 2019 2020 2021 2022
Direct jobs 353,111 435,115 539,380 659,333 824,371 1,025,230 1,230,051
Business revenue created ($M)* 32,134 39,925 49,793 60,591 75,163 91,415 110,692
Indirect/induced jobs 497,066 628,244 764,410 936,009 1,215,044 1,409,963 1,786,997
Ecosystem-to-Salesforce revenue ratio 3.45 3.68 3.96 4.25 4.56 4.87 5.19
* Business revenue differs from GDP as it includes business-to-business sales, not just value added.
Source: IDC's Salesforce Economic Impact Model, 2017
TABLE 26
Worldwide Industry Job Creation and Business Revenue from the Use of Cloud
Computing and Salesforce Ecosystem Ratio, 2016–2022
2016 2017 2018 2019 2020 2021 2022
Direct jobs 1,314,914 1,617,166 2,007,013 2,455,321 3,076,870 3,848,085 4,642,687
Business revenue created ($M)* 116,514 144,469 180,365 219,655 273,119 334,019 406,689
Indirect/induced jobs 1,850,976 2,334,955 2,844,341 3,485,649 4,535,014 5,292,138 6,744,818
Ecosystem-to-Salesforce revenue ratio 3.44 3.67 3.95 4.24 4.54 4.86 5.18
* Business revenue differs from GDP as it includes business-to-business sales, not just value added.
Source: IDC's Salesforce Economic Impact Model, 2017

©2017 IDC #US43158917 23
APPENDIX B: METHODOLOGY
The Benefits of Cloud Computing
Since 2002, IDC has maintained an internal tool called the IDC Economic Impact Model (EIM), which
takes inputs from IDC's market research on IT spending, exchange rates, and vendor market share,
along with public inputs such as GDP, tax rates, and overall labor force from other sources. The output
of the EIM is IT company and employee counts by geographic region.
In 2009, IDC added inputs for spending on cloud computing, percentage of IT resources available for
innovation (the rest used on legacy system support and upgrades), and business revenue as a
multiple of GDP per country.
Using research-driven algorithms that compare total IT spending with spending on cloud computing and
IT budgets with business revenue; the degree to which IT innovation drives business innovation; and
estimates of business benefits from accelerated development schedules, faster project completion, and
shorter time to market for new products, the model generates job head counts and business revenue in
the general economy because of the use of cloud computing to free up IT resources.
In short, increased IT innovation leads to increased business innovation, which leads to increased
revenue, which creates new jobs. Outputs from the cloud-infused EIM have been published in various
IDC research projects and are a critical input to the European Union's Digital Agenda for Europe.
The Salesforce Economy
As a major vendor of cloud services, Salesforce accounts for a significant share of the benefits to the
general economy from cloud computing. That share is enhanced by other contributions from the
ecosystem described in this White Paper.
The Salesforce Economic Impact Model is an extension to IDC's IT Economic Impact Model.
It estimates Salesforce's current and future share of the benefits to the general economy generated by
cloud computing, and it also estimates the size of the ecosystem supporting Salesforce using IDC's
market research on the ratio of spending on professional services to cloud subscriptions; the ratio of
sales of hardware, software, and networking to spending on public and private cloud computing; and
the ratio of spending on application development tools to applications developed.
Note that the ecosystem may include companies that are not formal business partners of Salesforce
but that nevertheless sell products or services associated with the Salesforce implementations.
Key Definitions in Support of Tables and Figures
The following contains definitions of terms used in tables and figures throughout this White Paper:
▪ Direct jobs are those created in the Salesforce and Salesforce ecosystem customer bases
from the use of cloud computing.
▪ Indirect/induced jobs are those created by spending in the general economy by people filling
the direct jobs.
▪ Net gain in jobs is the difference from year-end 2016 to year-end 2022. For revenue, it is the
aggregate difference from each year to 2016.
▪ Business revenue is the revenue created in the Salesforce and Salesforce ecosystem
customer bases from the use of cloud computing. It does not equate directly to GDP.

©2017 IDC #US43158917 24
▪ The Salesforce revenue forecast is based on Wall Street forecasts and internal IDC estimates.
It is not for publication.
▪ The Salesforce ecosystem includes those selling the following in conjunction with Salesforce
implementations:
▪ Additional cloud subscriptions (e.g., storage and security)
▪ Professional services and/or business consulting supporting implementation, integration,
and training
▪ Additional hardware, software, or networking in support of implementations, including
integration with private clouds
▪ Many, but not all, Salesforce ecosystem companies are registered partners with Salesforce.
Supporting Surveys
Inputs to the Salesforce Economic Impact Model include data from IDC's CloudView series of global
surveys. The 2017 survey polled 6,064 enterprise users of cloud computing in 31 countries.
Also, in the summer of 2016, IDC conducted a survey of 75 Salesforce partners across English-
speaking countries and a half dozen in-depth interviews. The interviews explored partner investments
in various aspects of supporting Salesforce implementations, the revenue growth of partners, and the
attitudes and opinions of partners regarding their relationship with Salesforce.

About IDC
International Data Corporation (IDC) is the premier global provider of market intelligence, advisory
services, and events for the information technology, telecommunications and consumer technology
markets. IDC helps IT professionals, business executives, and the investment community make fact-
based decisions on technology purchases and business strategy. More than 1,100 IDC analysts
provide global, regional, and local expertise on technology and industry opportunities and trends in
over 110 countries worldwide. For 50 years, IDC has provided strategic insights to help our clients
achieve their key business objectives. IDC is a subsidiary of IDG, the world's leading technology
media, research, and events company.
Global Headquarters
5 Speen Street
Framingham, MA 01701
USA
508.872.8200
Twitter: @IDC
idc-community.com
www.idc.com
Copyright Notice
External Publication of IDC Information and Data — Any IDC information that is to be used in advertising, press
releases, or promotional materials requires prior written approval from the appropriate IDC Vice President or
Country Manager. A draft of the proposed document should accompany any such request. IDC reserves the right
to deny approval of external usage for any reason.
Copyright 2017 IDC. Reproduction without written permission is completely forbidden.