
IDC BI Solutions
16
Filing Information: June 2011, IDC #228442, Volume: 1, Tab: Vendors Business Analytics Solutions with Vertical Views: Competitive Analysis COMPETITIVE ANALYSIS Worldwide Business Intelligence Tools 2010 Vendor Shares Dan Vesset IDC OPINION 2010 represented a bounce-back year from the low single-digit growth in 2009 when the economic slowdown affected purchasing across the IT spectrum. However, even during the economic downturn, the underlying demand for business intelligence (BI) tools remained strong. The pent-up demand and loosening budgets drove BI tools growth in 2010. Specifically: In 2010, the business intelligence tools market reached $8.9 billion in software license and maintenance revenue (including subscription revenue). The BI tools market grew 11.4% in 2010 compared with the 2.0% revised growth for 2009. The top 5 vendors in 2010 based on worldwide revenue were SAP, IBM, SAS, Oracle, and Microsoft, accounting for 64.9% of the market total. The top 10 vendors now account for 75.3% of the market, up from 57.9% in 2003. The end-user query, reporting, and analysis (QRA) segment of the BI tools market outpaced the growth of the advanced analytics segment of the market. Global Headquarters: 5 Speen Street Framingham, MA 01701 USA P.508.872.8200 F.508.935.4015 www.idc.com
-
Upload
magicsboub -
Category
Documents
-
view
55 -
download
5
Transcript of IDC BI Solutions
Filing Information: June 2011, IDC #228442, Volume: 1, Tab: Vendors
Business Analytics Solutions with Vertical Views: Competitive Analysis
C O M P E T I T I V E A N A L Y S I S
W o r l d w i d e B u s i n e s s I n t e l l i g e n c e T o o l s 2 0 1 0 V e n d o r S h a r e s
Dan Vesset
I D C O P I N I O N
2010 represented a bounce-back year from the low single-digit growth in 2009 when
the economic slowdown affected purchasing across the IT spectrum. However, even
during the economic downturn, the underlying demand for business intelligence (BI)
tools remained strong. The pent-up demand and loosening budgets drove BI tools
growth in 2010. Specifically:
In 2010, the business intelligence tools market reached $8.9 billion in software
license and maintenance revenue (including subscription revenue). The BI tools
market grew 11.4% in 2010 compared with the 2.0% revised growth for 2009.
The top 5 vendors in 2010 based on worldwide revenue were SAP, IBM, SAS,
Oracle, and Microsoft, accounting for 64.9% of the market total. The top 10
vendors now account for 75.3% of the market, up from 57.9% in 2003.
The end-user query, reporting, and analysis (QRA) segment of the BI tools
market outpaced the growth of the advanced analytics segment of the market.
Glo
bal H
eadquart
ers
: 5 S
peen S
treet F
ram
ingham
, M
A 0
1701 U
SA
P
.508.8
72.8
200 F
.508.9
35.4
015 w
ww
.idc.
com
#228442 ©2011 IDC
T A B L E O F C O N T E N T S
P
In This Study 1
Methodology ............................................................................................................................................. 1
Business Intelligence Tools Market Definition .......................................................................................... 1
Situat ion Overview 3
The Business Intelligence Tools Market in 2010 ...................................................................................... 3
Future Out look 8
Essent ia l Guidance 10
Learn More 10
Related Research..................................................................................................................................... 10
Methodology ............................................................................................................................................. 11
©2011 IDC #228442
L I S T O F T A B L E S
P
1 Worldwide Business Intelligence Tools Revenue by Segment, 2008–2010................................. 3
2 Worldwide Business Intelligence Tools Revenue by Region, 2008–2010.................................... 4
3 Worldwide Business Intelligence Tools Revenue by Vendor, 2008–2010.................................... 5
4 Worldwide Query, Reporting, and Analysis Tools Revenue by Vendor, 2008–2010 ................... 7
5 Worldwide Advanced Analytics Tools Revenue by Vendor, 2008–2010 ...................................... 8
#228442 ©2011 IDC
L I S T O F F I G U R E S
P
1 IDC's Business Analytics Software Taxonomy, 2011 ................................................................... 2
2 Worldwide Business Intelligence Tools Combined Software Revenue Share of the Top 10 Largest Vendors, 2003–2010....................................................................................................... 6
3 Worldwide Business Intelligence Tools Revenue and Growth, 1993–2010 ................................. 6
©2011 IDC #228442 1
I N T H I S S T U D Y
This IDC study examines the business intelligence tools market from 2008 to 2010.
Revenue and market share of the leading vendors are provided for 2010, with trends
from 2009 and 2008.
The vendor shares contained herein update those found in Worldwide Business
Intelligence Tools 2009 Vendor Shares (IDC #223725, June 2010).
M e t h o d o l o g y
See the Methodology in the Learn More section for a description of the data collection
and analysis methodology employed in this study.
In addition, please note the following:
The information contained in this study was derived from the IDC Software
Market Forecaster database as of May 11, 2011.
All numbers in this document may not be exact due to rounding.
For more information on IDC's software definitions and methodology, see IDC's
Software Taxonomy, 2010 (IDC #222023, February 2010).
B u s i n e s s I n t e l l i g e n c e T o o l s M a r k e t D e f i n i t i o n
IDC defines the BI tools market as being made up of two market segments: end-user
query, reporting, and analysis (QRA) and advanced analytics:
End-user query, reporting, and analysis. End-user query, reporting, and
analysis software includes ad hoc query and multidimensional analysis tools as
well as dashboards and production reporting tools. Query and reporting tools are
designed specifically to support ad hoc data access and report building by either
IT or business users. This category does not include other application
development tools that may be used for building reports but are not specifically
designed for that purpose. Multidimensional analysis tools include both online
analytical processing (OLAP) servers and client-side analysis tools that provide a
data management environment used for modeling business problems and
analyzing business data. Packaged data marts, which are preconfigured software
combining data transformation, management, and access in a single package,
usually with business models, are also included in this functional market.
Advanced analytics. Advanced analytics software includes data mining and
statistical software (previously called technical data analysis). It uses
technologies such as neural networks, rule induction, and clustering, among
others, to discover relationships in data and make predictions that are hidden,
not apparent, or too complex to be extracted using query, reporting, and
multidimensional analysis software. This market also includes technical,
econometric, and other mathematics-specific software that provide libraries of
2 #228442 ©2011 IDC
statistical algorithms and tests for analyzing data. Although statistics products
vary in sophistication, most provide base-level functions such as frequencies,
cross-tabulation, and chi-square. This market also includes a specialized form of
statistical software focused on functional areas such as the industrial design of
experiments, clinical trial testing, exploratory data analysis, and high-volume and
real-time statistical analysis.
The BI tools market includes both standalone packaged software and embedded BI
tools provided by some database management software vendors. An example of the
latter is Microsoft SQL Server Analysis Services that comes embedded in the SQL
Server database.
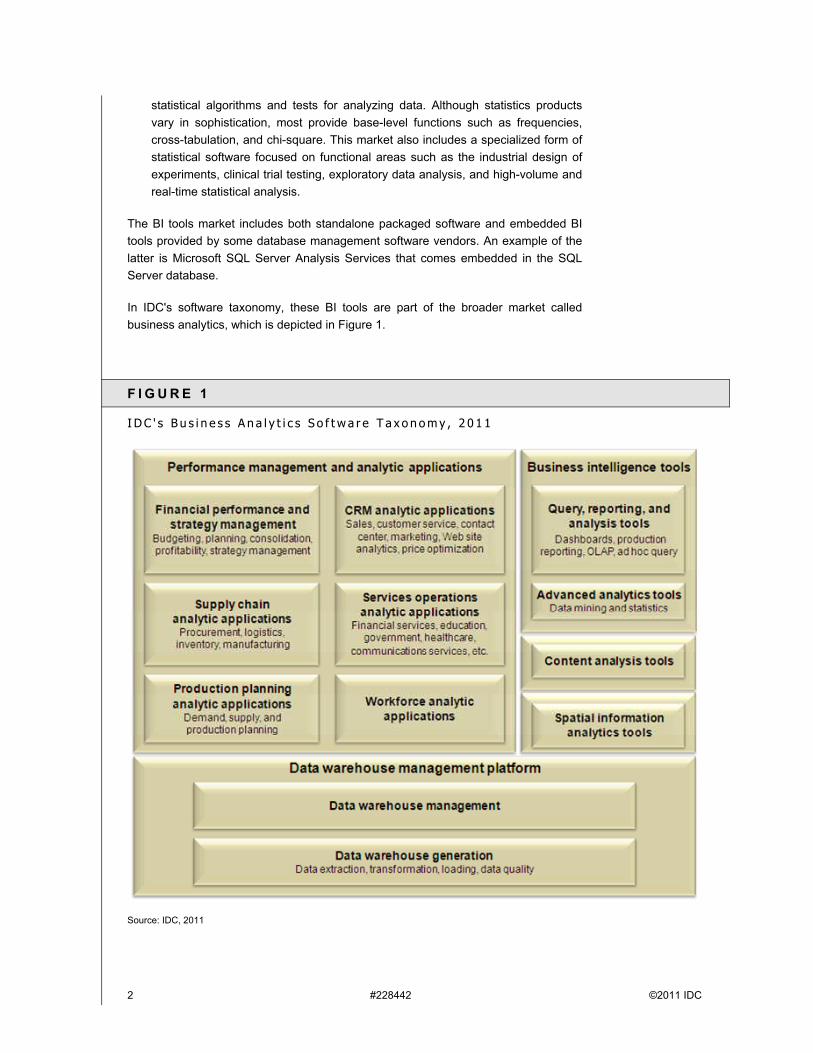
In IDC's software taxonomy, these BI tools are part of the broader market called
business analytics, which is depicted in Figure 1.
F I G U R E 1
I D C ' s B u s i n e s s A n a l y t i c s S o f t w a r e T a x o n o m y , 2 0 1 1
Source: IDC, 2011

©2011 IDC #228442 3
S I T U A T I O N O V E R V I E W
T h e B u s i n e s s I n t e l l i g e n c e T o o l s M a r k e t
i n 2 0 1 0
In 2010, the BI tools market grew 11.4% to reach $8.9 billion in worldwide license and
maintenance revenue (including software-as-a-service [SaaS] subscription contracts)
(see Table 1). This growth was higher than expected by IDC in the previously
published BI tools software market forecast (Worldwide Business Analytics Software
2010–2014 Forecast and 2009 Vendor Shares, IDC #225038, September 2010). The
higher-than-expected bounceback in the BI tools market was due to better-than-
expected worldwide economic activity.
Table 1 also shows the different sizes and growth rates of the two primary segments
of the BI tools market: QRA and advanced analytics. QRA again outperformed the
advanced analytics market. The latter continues to be dominated by SAS and IBM —
which combined hold a 51.4% market share — and is therefore more strongly
influenced by the performance of just these two vendors. In the QRA market, SAP
had a very strong year, with 19.9% growth following a lackluster 2009 when the
company's QRA decreased for the first time. The largest of IT companies continue to
dominate the BI tools market and to consolidate market share. However, a number of
midsize and smaller vendors such as QlikTech, Tableau Software, and Panorama
Software have continued to significantly outpace the market growth.
T A B L E 1
W o r l d w i d e B u s i n e s s I n t e l l i g e n c e T o o l s R e v e n u e b y S e g m e n t , 2 0 0 8 – 2 0 1 0
Revenue ($M) Share (%)
2008 2009 2010 2008 2009 2010
2008–2009
Growth (%)
2009–2010
Growth (%)
Advanced analytics 1,512.7 1,523.7 1,656.1 19.4 19.1 18.7 0.7 8.7
End-user query, reporting,
and analysis
6,298.4 6,444.1 7,217.8 80.6 80.9 81.3 2.3 12.0
Total 7,811.0 7,967.8 8,873.9 100.0 100.0 100.0 2.0 11.4
Source: IDC, May 2011
In 2010, we saw many incremental improvements to existing BI tools and suites of BI
tools software. The focus of these improvements was on simplicity, which extended to
improvements in user interfaces, interactivity, and administration.
The large IT vendors further consolidated their previously acquired BI tools onto
common architectures.
4 #228442 ©2011 IDC
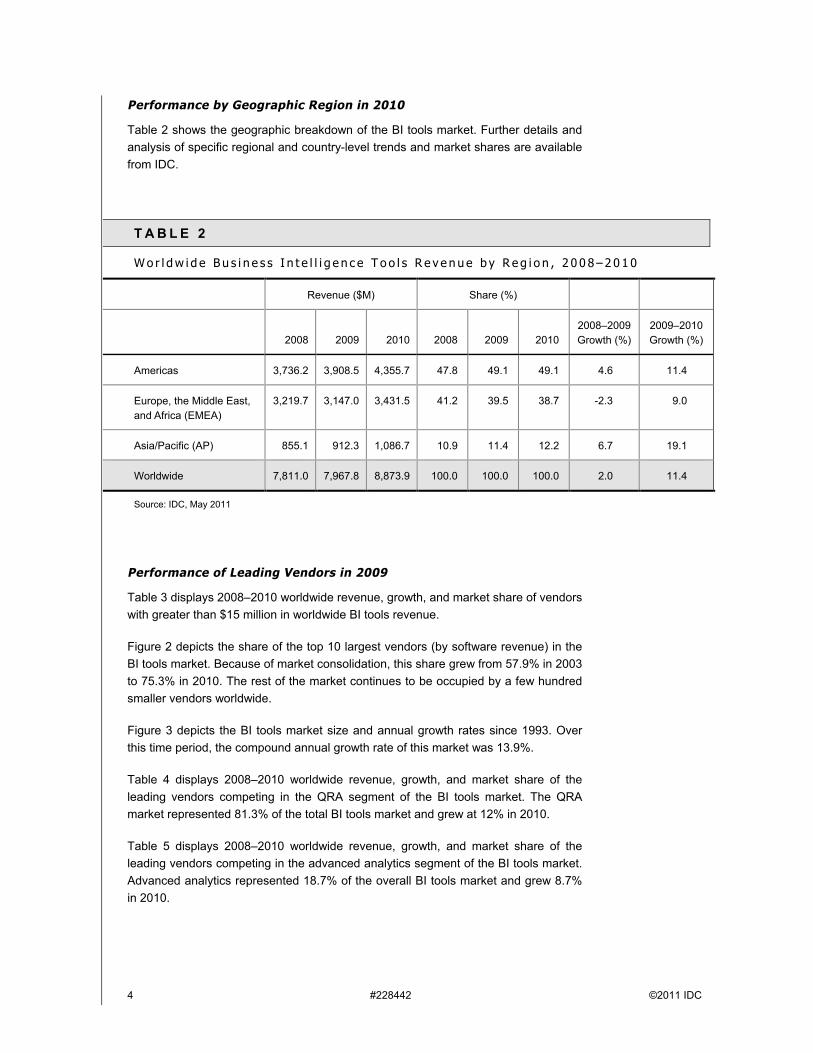
Performance by Geographic Region in 2010
Table 2 shows the geographic breakdown of the BI tools market. Further details and
analysis of specific regional and country-level trends and market shares are available
from IDC.
T A B L E 2
W o r l d w i d e B u s i n e s s I n t e l l i g e n c e T o o l s R e v e n u e b y R e g i o n , 2 0 0 8 – 2 0 1 0
Revenue ($M) Share (%)
2008 2009 2010 2008 2009 2010
2008–2009
Growth (%)
2009–2010
Growth (%)
Americas 3,736.2 3,908.5 4,355.7 47.8 49.1 49.1 4.6 11.4
Europe, the Middle East,
and Africa (EMEA)
3,219.7 3,147.0 3,431.5 41.2 39.5 38.7 -2.3 9.0
Asia/Pacific (AP) 855.1 912.3 1,086.7 10.9 11.4 12.2 6.7 19.1
Worldwide 7,811.0 7,967.8 8,873.9 100.0 100.0 100.0 2.0 11.4
Source: IDC, May 2011
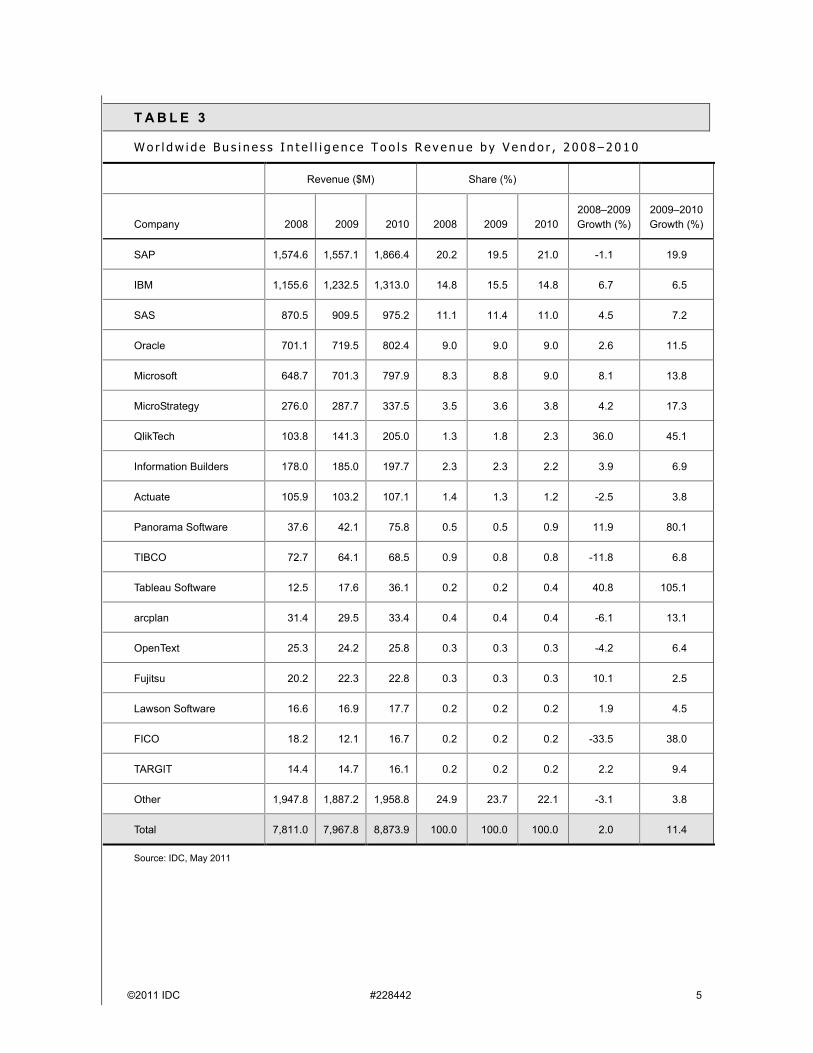
Performance of Leading Vendors in 2009
Table 3 displays 2008–2010 worldwide revenue, growth, and market share of vendors
with greater than $15 million in worldwide BI tools revenue.
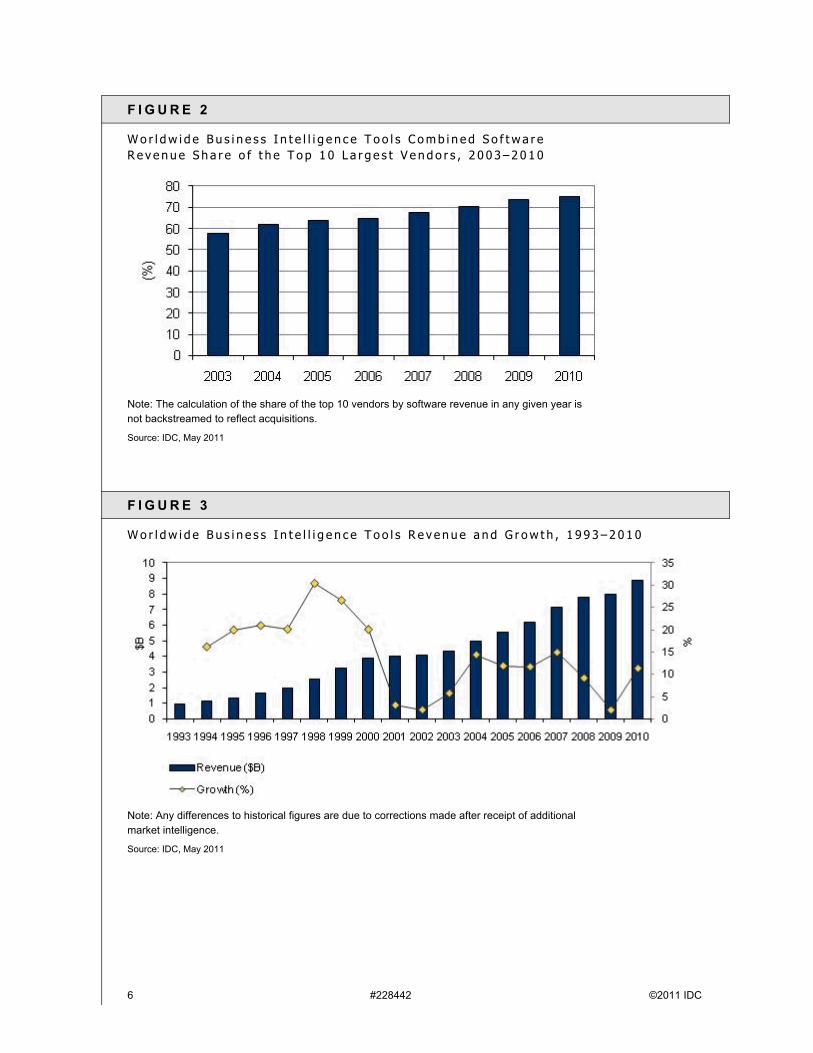
Figure 2 depicts the share of the top 10 largest vendors (by software revenue) in the
BI tools market. Because of market consolidation, this share grew from 57.9% in 2003
to 75.3% in 2010. The rest of the market continues to be occupied by a few hundred
smaller vendors worldwide.
Figure 3 depicts the BI tools market size and annual growth rates since 1993. Over
this time period, the compound annual growth rate of this market was 13.9%.
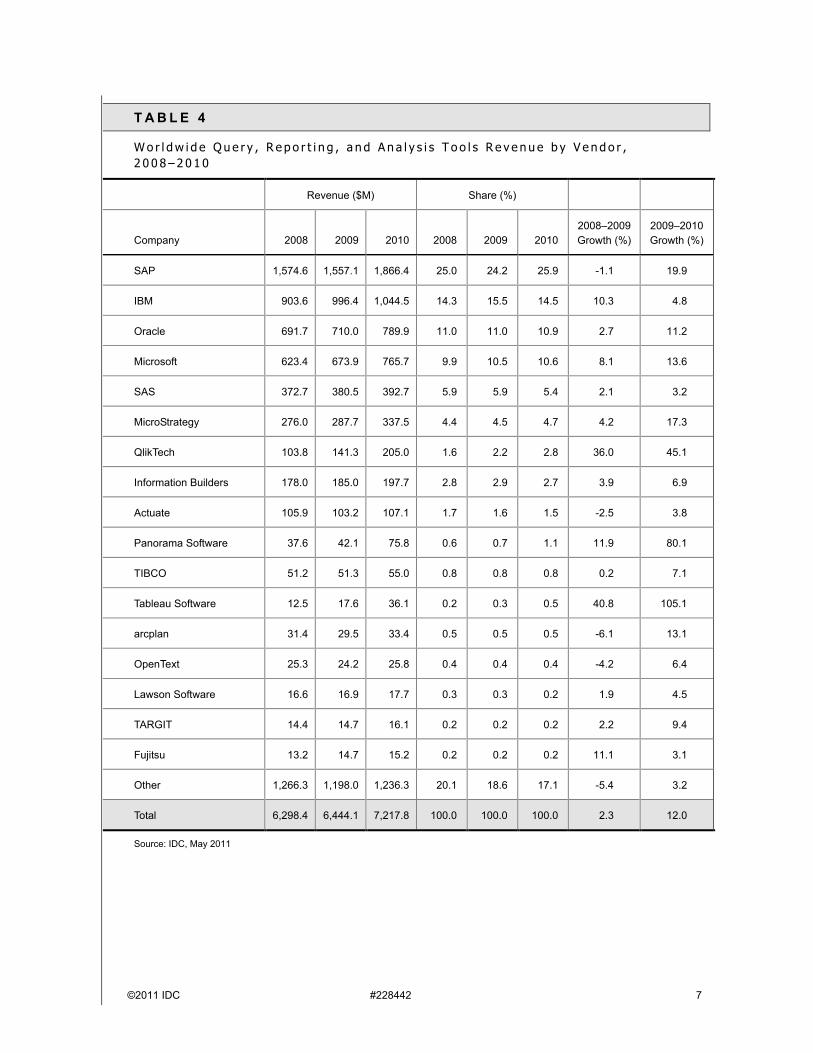
Table 4 displays 2008–2010 worldwide revenue, growth, and market share of the
leading vendors competing in the QRA segment of the BI tools market. The QRA
market represented 81.3% of the total BI tools market and grew at 12% in 2010.
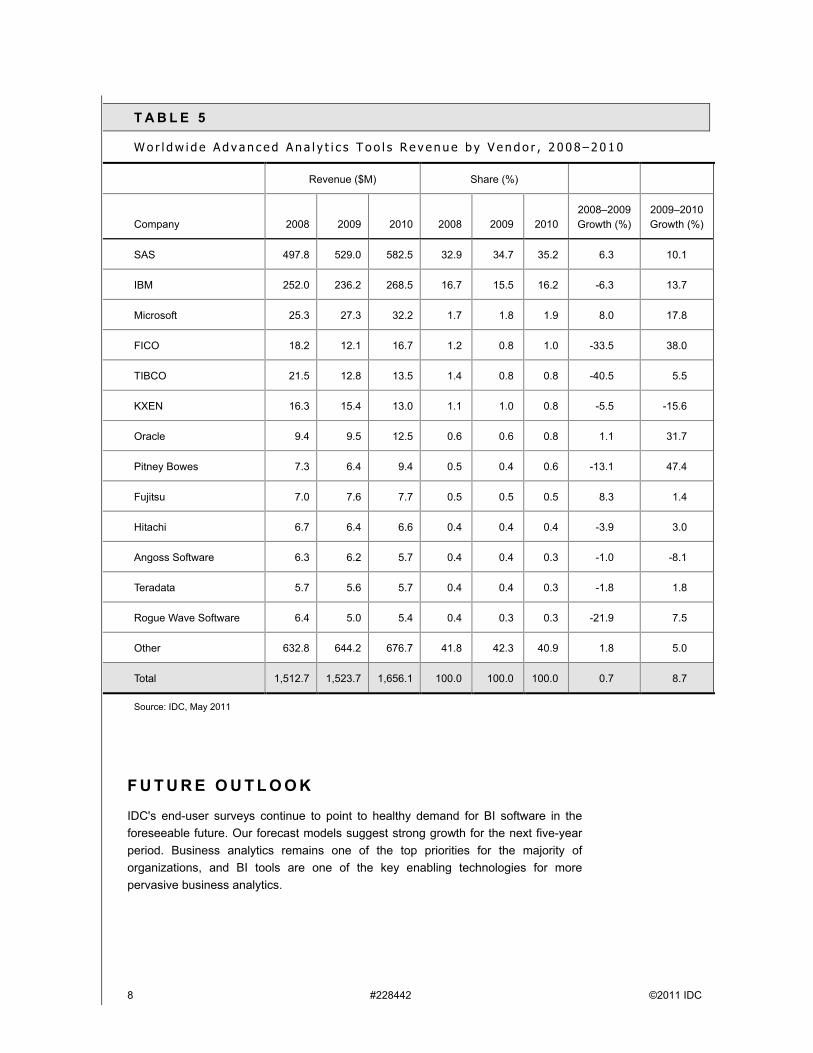
Table 5 displays 2008–2010 worldwide revenue, growth, and market share of the
leading vendors competing in the advanced analytics segment of the BI tools market.
Advanced analytics represented 18.7% of the overall BI tools market and grew 8.7%
in 2010.
©2011 IDC #228442 5
T A B L E 3
W o r l d w i d e B u s i n e s s I n t e l l i g e n c e T o o l s R e v e n u e b y V e n d o r , 2 0 0 8 – 2 0 1 0
Revenue ($M) Share (%)
Company 2008 2009 2010 2008 2009 2010
2008–2009
Growth (%)
2009–2010
Growth (%)
SAP 1,574.6 1,557.1 1,866.4 20.2 19.5 21.0 -1.1 19.9
IBM 1,155.6 1,232.5 1,313.0 14.8 15.5 14.8 6.7 6.5
SAS 870.5 909.5 975.2 11.1 11.4 11.0 4.5 7.2
Oracle 701.1 719.5 802.4 9.0 9.0 9.0 2.6 11.5
Microsoft 648.7 701.3 797.9 8.3 8.8 9.0 8.1 13.8
MicroStrategy 276.0 287.7 337.5 3.5 3.6 3.8 4.2 17.3
QlikTech 103.8 141.3 205.0 1.3 1.8 2.3 36.0 45.1
Information Builders 178.0 185.0 197.7 2.3 2.3 2.2 3.9 6.9
Actuate 105.9 103.2 107.1 1.4 1.3 1.2 -2.5 3.8
Panorama Software 37.6 42.1 75.8 0.5 0.5 0.9 11.9 80.1
TIBCO 72.7 64.1 68.5 0.9 0.8 0.8 -11.8 6.8
Tableau Software 12.5 17.6 36.1 0.2 0.2 0.4 40.8 105.1
arcplan 31.4 29.5 33.4 0.4 0.4 0.4 -6.1 13.1
OpenText 25.3 24.2 25.8 0.3 0.3 0.3 -4.2 6.4
Fujitsu 20.2 22.3 22.8 0.3 0.3 0.3 10.1 2.5
Lawson Software 16.6 16.9 17.7 0.2 0.2 0.2 1.9 4.5
FICO 18.2 12.1 16.7 0.2 0.2 0.2 -33.5 38.0
TARGIT 14.4 14.7 16.1 0.2 0.2 0.2 2.2 9.4
Other 1,947.8 1,887.2 1,958.8 24.9 23.7 22.1 -3.1 3.8
Total 7,811.0 7,967.8 8,873.9 100.0 100.0 100.0 2.0 11.4
Source: IDC, May 2011
6 #228442 ©2011 IDC
F I G U R E 2
W o r l d w i d e B u s i n e s s I n t e l l i g e n c e T o o l s C o m b i n e d S o f t w a r e
R e v e n u e S h a r e o f t h e T o p 1 0 L a r g e s t V e n d o r s , 2 0 0 3 – 2 0 1 0
Note: The calculation of the share of the top 10 vendors by software revenue in any given year is
not backstreamed to reflect acquisitions.
Source: IDC, May 2011
F I G U R E 3
W o r l d w i d e B u s i n e s s I n t e l l i g e n c e T o o l s R e v e n u e a n d G r o w t h , 1 9 9 3 – 2 0 1 0
Note: Any differences to historical figures are due to corrections made after receipt of additional
market intelligence.
Source: IDC, May 2011
©2011 IDC #228442 7
T A B L E 4
W o r l d w i d e Q u e r y , R e p o r t i n g , a n d A n a l y s i s T o o l s R e v e n u e b y V e n d o r ,
2 0 0 8 – 2 0 1 0
Revenue ($M) Share (%)
Company 2008 2009 2010 2008 2009 2010
2008–2009
Growth (%)
2009–2010
Growth (%)
SAP 1,574.6 1,557.1 1,866.4 25.0 24.2 25.9 -1.1 19.9
IBM 903.6 996.4 1,044.5 14.3 15.5 14.5 10.3 4.8
Oracle 691.7 710.0 789.9 11.0 11.0 10.9 2.7 11.2
Microsoft 623.4 673.9 765.7 9.9 10.5 10.6 8.1 13.6
SAS 372.7 380.5 392.7 5.9 5.9 5.4 2.1 3.2
MicroStrategy 276.0 287.7 337.5 4.4 4.5 4.7 4.2 17.3
QlikTech 103.8 141.3 205.0 1.6 2.2 2.8 36.0 45.1
Information Builders 178.0 185.0 197.7 2.8 2.9 2.7 3.9 6.9
Actuate 105.9 103.2 107.1 1.7 1.6 1.5 -2.5 3.8
Panorama Software 37.6 42.1 75.8 0.6 0.7 1.1 11.9 80.1
TIBCO 51.2 51.3 55.0 0.8 0.8 0.8 0.2 7.1
Tableau Software 12.5 17.6 36.1 0.2 0.3 0.5 40.8 105.1
arcplan 31.4 29.5 33.4 0.5 0.5 0.5 -6.1 13.1
OpenText 25.3 24.2 25.8 0.4 0.4 0.4 -4.2 6.4
Lawson Software 16.6 16.9 17.7 0.3 0.3 0.2 1.9 4.5
TARGIT 14.4 14.7 16.1 0.2 0.2 0.2 2.2 9.4
Fujitsu 13.2 14.7 15.2 0.2 0.2 0.2 11.1 3.1
Other 1,266.3 1,198.0 1,236.3 20.1 18.6 17.1 -5.4 3.2
Total 6,298.4 6,444.1 7,217.8 100.0 100.0 100.0 2.3 12.0
Source: IDC, May 2011
8 #228442 ©2011 IDC
T A B L E 5
W o r l d w i d e A d v a n c e d A n a l y t i c s T o o l s R e v e n u e b y V e n d o r , 2 0 0 8 – 2 0 1 0
Revenue ($M) Share (%)
Company 2008 2009 2010 2008 2009 2010
2008–2009
Growth (%)
2009–2010
Growth (%)
SAS 497.8 529.0 582.5 32.9 34.7 35.2 6.3 10.1
IBM 252.0 236.2 268.5 16.7 15.5 16.2 -6.3 13.7
Microsoft 25.3 27.3 32.2 1.7 1.8 1.9 8.0 17.8
FICO 18.2 12.1 16.7 1.2 0.8 1.0 -33.5 38.0
TIBCO 21.5 12.8 13.5 1.4 0.8 0.8 -40.5 5.5
KXEN 16.3 15.4 13.0 1.1 1.0 0.8 -5.5 -15.6
Oracle 9.4 9.5 12.5 0.6 0.6 0.8 1.1 31.7
Pitney Bowes 7.3 6.4 9.4 0.5 0.4 0.6 -13.1 47.4
Fujitsu 7.0 7.6 7.7 0.5 0.5 0.5 8.3 1.4
Hitachi 6.7 6.4 6.6 0.4 0.4 0.4 -3.9 3.0
Angoss Software 6.3 6.2 5.7 0.4 0.4 0.3 -1.0 -8.1
Teradata 5.7 5.6 5.7 0.4 0.4 0.3 -1.8 1.8
Rogue Wave Software 6.4 5.0 5.4 0.4 0.3 0.3 -21.9 7.5
Other 632.8 644.2 676.7 41.8 42.3 40.9 1.8 5.0
Total 1,512.7 1,523.7 1,656.1 100.0 100.0 100.0 0.7 8.7
Source: IDC, May 2011
F U T U R E O U T L O O K
IDC's end-user surveys continue to point to healthy demand for BI software in the
foreseeable future. Our forecast models suggest strong growth for the next five-year
period. Business analytics remains one of the top priorities for the majority of
organizations, and BI tools are one of the key enabling technologies for more
pervasive business analytics.
©2011 IDC #228442 9
In the near term, we expect that:
The influence of the cloud computing model's focus on simplicity and the
increasing buying influence of business users will grow in the BI tools market.
Customers will continue to demand software that is not only easy to use but also
easy to acquire, install, and maintain. Specialty (including cloud) vendors have
gained traction largely based on the message of simplicity to purchase, deploy,
use, and maintain. Larger vendors will be forced to respond, with the net result of
a reduction in software deployment time and the ability to purchase software in
smaller increments.
Business analytics appliances will evolve to incorporate database as well as
user-facing BI tools. Business analytics appliances have until now been first and
foremost packaged for data warehousing. The software components of these
appliances have included RDBMS software (and, in a few rare cases, data
integration software) optimized for the given hardware platform. We expect that
in the near term, IT vendors will begin to extend business analytics appliances to
include business end user–facing query, reporting, and analysis tools as well as
prepackaged analytic applications. Some of these products have already been
introduced to the market in early 2011.
Demand for mobile BI tools will grow, but prospects will demand designs to
support specific use cases rather than just support for various devices. BI tools
vendors are still learning about how best to design for mobile devices that are
only one of many access channels to data. Mobile information solutions that
provide more value than just the ability to track performance metrics or view,
comment on, or edit a report need to find their way to market. Mobile BI will be
driven by the need for mobile workers to participate in specific, collaborative
business processes and ad hoc approval workflows for tactical decision making.
Pervasive predictive analytics will not materialize through wider use of
standalone advanced analytics tools. Instead, advanced analytics functionality
will be incorporated into applications and advanced analytics as a service will
begin to emerge as an option for organizations to source the quantitative analytic
talent necessary to perform more complex analyses. The reality is that the
number of quantitative analysts with enough know-how in analytic methods and
tools is limited and unlikely to change substantially in the foreseeable future.
Therefore, more pervasive use of predictive analytics will not come through sales
of more advanced analytics software tools. A more likely scenario is that both
descriptive and predictive analytics functionalities will be incorporated into
various analytic applications targeted at business decision makers and analysts.
These applications have existed for years, but in 2011, the end-user demand for
advanced analytics functionality will drive vendors to focus more on this market.
Knowledge management, now referred to as collaborative and social decision
making, will enjoy a resurgence, spurring new investments in supporting
technologies including collaborative BI tools. The integration of social networking
and social media capabilities into collaboration environments will help accelerate
decision making and deliver on the promise of knowledge management from a
decade ago via implicit knowledge capture (which preserves contextual
10 #228442 ©2011 IDC
information about people, processes, and content). Social graphs, content rating,
and recommendations are already enriching the "search experience" at work.
Network analysis techniques that have seen early adoption in tracking social
behavior of consumers will begin to be applied to collaboration within the
workplace. Gaining the input of many stakeholders to inform a decision while
capturing the decision process for reuse will gain traction as a best practice in
leading organizations.
An updated IDC forecast for the BI tools market will be available in June 2011.
E S S E N T I A L G U I D A N C E
To continue growing in the BI tools market, vendors need to align their technology
packaging and pricing with the growing preference of end users for departmental and
incremental projects and subscription pricing. Although the latter still represents only
a small portion of the BI tools market, SaaS or cloud BI offerings are growing three
times faster than the rest of the market.
The danger in this environment of fragmented purchasing is the creation of further
information silos and a reversal of the gains made by best practices data integration
in recent years. To address this potential issue, IT departments should recognize that
their role does not include building and rebuilding dashboards and other ad hoc end-
user information access interfaces. The time previously spent on these activities
should be focused on data management technology, including projects and ongoing
programs for data integration, cleansing, security, system availability, and
performance management.
BI tools providers' focus on collaborative BI can't be superficial and include simply the
sharing of reports or dashboards. Features for adding annotations, ranking and rating
information, online collaborative workspaces, and other similar features should be
much more prevalent than they are today.
The focus on simplicity may actually make things more complicated for vendors as
simplicity is defined by each customer. It means having more options for deployment,
pricing, features, and functions that don't require customers to pay for something they
don't intend to use.
L E A R N M O R E
R e l a t e d R e s e a r c h
Take Care of Your Quants: Focusing Data Warehousing Resources on
Quantitative Analysts Matters (IDC #227524, March 2011)
Market Analysis Perspective: Worldwide Business Analytics Solutions 2010 —
The Emerging Mass Market for Business Intelligence, Analytics, and Data
Warehousing (IDC #227397, March 2011)
©2011 IDC #228442 11
Worldwide Information Access, Analysis, and Management Software 2011 Top
10 Predictions (IDC #226654, January 2011)
Worldwide Decision Management Software 2010–2014 Forecast: A Fast-
Growing Opportunity to Drive the Intelligent Economy (IDC #226244, December
2010)
Worldwide Business Intelligence Tools 2009 Vendor Shares (IDC #223725, June
2010)
IDC's Software Taxonomy, 2010 (IDC #222023, February 2010)
M e t h o d o l o g y
The IDC software market sizing and forecasts are presented in terms of packaged
software revenue. IDC uses the term packaged software to distinguish commercially
available software from custom software, not to imply that the software must be
shrink-wrapped or otherwise provided via physical media. Packaged software is
programs or codesets of any type commercially available through sale, lease, rental,
or as a service. Packaged software revenue typically includes fees for initial and
continued right-to-use packaged software licenses. These fees may include, as part
of the license contract, access to product support and/or other services that are
inseparable from the right-to-use license fee structure, or this support may be priced
separately. Upgrades may be included in the continuing right of use or may be priced
separately. All of these are counted by IDC as packaged software revenue.
Packaged software revenue excludes service revenue derived from training,
consulting, and system integration that is separate (or unbundled) from the right-to-
use license but does include the implicit value of software included in a service that
offers software functionality by a different pricing scheme. It is the total packaged
software revenue that is further allocated to markets, geographic areas, and operating
environments.
The market forecast and analysis methodology incorporates information from five
different but interrelated sources:
Reported and observed trends and financial activity. This study incorporates
reported and observed trends and financial activity in 2010 as of the end of
February 2011, including reported revenue data for public companies trading on
North American stock exchanges (CY 1Q10–4Q10 in nearly all cases).
IDC's Software Census interviews. IDC interviews all significant market
participants to determine product revenue, revenue demographics, pricing, and
other relevant information.
Product briefings, press releases, and other publicly available information.
IDC's software analysts around the world meet with hundreds of software
vendors each year. These briefings provide an opportunity to review current and
future business and product strategies, revenue, shipments, customer bases,
target markets, and other key product and competitive information.

12 #228442 ©2011 IDC
Vendor financial statements and related filings. Although many software
vendors are privately held and choose to limit financial disclosures, information
from publicly held companies provides a significant benchmark for assessing
informal market estimates from private companies. IDC also builds detailed
information related to private companies through in-depth analyst relationships
and maintains an extensive library of financial and corporate information focused
on the IT industry. We further maintain detailed revenue by product area models
on more than 1,000 worldwide vendors.
IDC demand-side research. This includes interviews with business users of
software solutions annually and provides a powerful fifth perspective for
assessing competitive performance and market dynamics. Direct conversations
with technology buyers provide an invaluable complement to the broader survey-
based results.
Ultimately, the data presented in this study represents IDC's best estimates based on
these data sources as well as reported and observed activity by vendors and further
modeling of data that we believe to be true to fill in any information gaps.
S y n o p s i s
This IDC study provides a competitive analysis of the business intelligence (BI) tools
market, with revenue and market share for the leading vendors for 2010 and with
trends from 2008. Worldwide market size with regional segmentation for the
Americas; Europe, the Middle East, and Africa (EMEA); and Asia/Pacific (AP) is also
provided.
"In 2010, the BI tools market grew 11.4%, reflecting an improved economic
environment and pent-up demand from 2009. The fundamental demand factors for BI
software remain strong," says Dan Vesset, program vice president, Business
Analytics Solutions.
C o p y r i g h t N o t i c e
This IDC research document was published as part of an IDC continuous intelligence
service, providing written research, analyst interactions, telebriefings, and
conferences. Visit www.idc.com to learn more about IDC subscription and consulting
services. To view a list of IDC offices worldwide, visit www.idc.com/offices. Please
contact the IDC Hotline at 800.343.4952, ext. 7988 (or +1.508.988.7988) or
[email protected] for information on applying the price of this document toward the
purchase of an IDC service or for information on additional copies or Web rights.
Copyright 2011 IDC. Reproduction is forbidden unless authorized. All rights reserved.


