IDBI Funds - February 2018 - ICICI Directcontent.icicidirect.com/MFSIDpdf/IDBI MUTUAL FUND.pdf ·...
27
Equity Market Overview Markets in the month of March reacted negatively on the back of global sell-offs arising from increasing apprehension of a global trade war. Both Sensex and Niſty were down by 3.2% and 3.3% respectively in March 2018. Banking sector continued to face pressure with corporate governance issue arising in India’s largest private sector bank (ICICI Bank). Indian markets followed the global trend of correction, with all major indices like Dow Jones, S&P 500 etc correcting significantly. Indian Bond market in the later part of month revived sharply on the back of surprise move by Indian Government to borrow less in the first half of FY19. Government on 26th March said that its borrowings up to September would amount to about 48% (excluding bond buybacks) of the overall target for the financial year. Normally, the government proposes to complete 60% of the targeted borrowing in the first six months, and expectations were higher for the first half of FY19, with the country facing parliamentary polls. e government’s gross borrowing is pegged at Rs 6.05 lakh crore for FY19, compared with Rs 5.99 lakh crore in FY18. e loss in multiple by-elections by the ruling party BJP also added to the negative sentiments. CPI for the month of February'18 came in at 4.44% versus 5.07% in January'18. Food and beverages inflation—the biggest contributor at 45.86%, stood at 3.38% in February 2018 against 4.66% in January 2018. e decline was supported by a sharp moderation in vegetable inflation to 17% in February 2018 against 27% in January 2018 and a continuous dip in pulses and products inflation. Fuel inflation, meanwhile, rose to 6.80% in February 2018 compared to 7.64% in January 2018. IIP for the month of Jan-2018 came in at 7.5% against Bloomberg estimates of 6.4% and 7.1% in Dec 2017. However, the Cumulative IIP number for April-January period stood at 4.1% versus 5.0% in the corresponding period last year. GST related slowdown impacted the IIP numbers in FY2018. e manufacturing sector grew at 8.7%, followed by electricity at 7.6%. However, growth in the mining sector was muted in January 2018. e cumulative growth in these three sectors during April 2017-January 2018 stood at 2.5%, 4.3%, and 5.3%, respectively. Brent Crude prices rose 8% in month of March at $69.33; Oil producer cartel of OPEC and other suppliers look set to continue withholding output for the rest of the year and potentially in 2019. INR almost remained flat month-on-month against US Dollar ending at Rs. 65.14/$. April 2018 Source: Bloomberg/Internal Research
Transcript of IDBI Funds - February 2018 - ICICI Directcontent.icicidirect.com/MFSIDpdf/IDBI MUTUAL FUND.pdf ·...

Equity Market OverviewMarkets in the month of March reacted negatively on the back of global sell-offs arising from increasing apprehension of a global trade war. Both Sensex and Nifty were down by 3.2% and 3.3% respectively in March 2018. Banking sector continued to face pressure with corporate governance issue arising in India’s largest private sector bank (ICICI Bank). Indian markets followed the global trend of correction, with all major indices like Dow Jones, S&P 500 etc correcting significantly.
Indian Bond market in the later part of month revived sharply on the back of surprise move by Indian Government to borrow less in the first half of FY19. Government on 26th March said that its borrowings up to September would amount to about 48% (excluding bond buybacks) of the overall target for the financial year. Normally, the government proposes to complete 60% of the targeted borrowing in the first six months, and expectations were higher for the first half of FY19, with the country facing parliamentary polls. The government’s gross borrowing is pegged at Rs 6.05 lakh crore for FY19, compared with Rs 5.99 lakh crore in FY18. The loss in multiple by-elections by the ruling party BJP also added to the negative sentiments.
CPI for the month of February'18 came in at 4.44% versus 5.07% in January'18. Food and beverages inflation—the biggest contributor at 45.86%, stood at 3.38% in February 2018 against 4.66% in January 2018. The decline was supported by a sharp moderation in vegetable inflation to 17% in February 2018 against 27% in January 2018 and a continuous dip in pulses and products inflation. Fuel inflation, meanwhile, rose to 6.80% in February 2018 compared to 7.64% in January 2018.
IIP for the month of Jan-2018 came in at 7.5% against Bloomberg estimates of 6.4% and 7.1% in Dec 2017. However, the Cumulative IIP number for April-January period stood at 4.1% versus 5.0% in the corresponding period last year. GST related slowdown impacted the IIP numbers in FY2018. The manufacturing sector grew at 8.7%, followed by electricity at 7.6%. However, growth in the mining sector was muted in January 2018. The cumulative growth in these three sectors during April 2017-January 2018 stood at 2.5%, 4.3%, and 5.3%, respectively.
Brent Crude prices rose 8% in month of March at $69.33; Oil producer cartel of OPEC and other suppliers look set to continue withholding output for the rest of the year and potentially in 2019. INR almost remained flat month-on-month against US Dollar ending at Rs. 65.14/$.
April 2018
Source: Bloomberg/Internal Research

2
Fixed Income OverviewMACRO Economic Data for the month:
As on 28/02/2018
As on 28/03/2018
Difference
10 year Gsec 7.73% 7.40% -33 bps5year Corp bonds 8.10% 7.82% -28 bps3 months Tbill 6.36% 6.09% -27 bps3 month Cd 7.25% 7.00% -25 bpsBrent Crude $ 65.78 69.53 3.75Inflation – CPI 5.07% 4.44% -63 bpsINR = USD 65.18 65.18 -
The major macro events during the month:
Inflation and IIP:
CPI inflation in February eased to 4.44% YoY ( January: 5.07%) on continued correction in food prices. Favorable base effect also aided in this moderation. Core (ex. food & fuel) inflation increased marginally to 5.04% YoY ( January: 5.00 %).
February WPI inflation declined to 2.48% YoY ( January: 2.84%) primarily on account of fall in vegetable prices. Core inflation rose to 3.90% YOY ( January: 3.50%) mainly due to higher inflation in manufacturing segment of basic metals.
January Industrial production rose by an astounding 7.50% (December: 7.10%). Stronger growth impulses continue to emanate from manufacturing sector reflecting an encouraging picture of underlying growth fundamentals of the economy. Manufacturing, Mining and Electricity were at 8.7%, 0.1% and 7.6% respectively.
Trade Deficit:
India February trade deficit narrowed to USD 12bn ( January: USD 16.30bn) as exports pickup and non oil non precious metals deficit improved. Numbers imply Current Account Deficit of around 2.1% of GDP in FY18.
Current Account Deficit:
India’s Current Account Deficit in the Q3 FY18 widened to USD 13.5 Bn compared to USD 7.2 Bn in the previous quarter (Q2 FY18) on the back of a widening trade deficit. CAD stood at USD 7.9 Bn in the same period a year ago (Q3 FY17).
Q3FY18 CAD is higher at 2% of GDP (Q2 at 1.2%). Services, including seasonal increase in travel receipts, and lower income payments offset higher merchandise deficit.
Chart showing the movement of the 10 year Gsec yield over the past 3 months
6.907.007.107.207.307.407.507.607.707.807.90
Jan-2018 Feb-2018 Mar-2018
Chart showing the Currency movement during the past 3 months
62.00
62.50
63.00
63.50
64.00
64.50
65.00
65.50
Jan-2018 Feb-2018 Mar-2018
The content of the articles in Equity Market Overview & Fixed Income Overview represent the opinions of our Fund Management/Research team. Nothing contained herein is intended as investment advice or recommendations for specific investment decisions, and you should not rely on it as such. Information and analysis above are derived from various sources and using methods believed to be reliable, but we do not assume responsibility and liability for any consequence of the investment decision taken by you based on this analysis. Investment decision taken by readers to this article will be at their sole discretion. The purpose of this article is intended to be used as an educational discussion of the issues involved. This is not to be construed as a solicitation to buy or sell securities.Source: Internal Research

3
HOW TO READ FACTSHEET?
Fund Manager:An employee of the asset management company such as a mutual fund or life insurer, who manages investments of the scheme. He is usually part of a larger team of fund managers and research analysts.
Application Amount for Fresh Subscription:This is the minimum investment amount for a new investor in a mutual fund scheme.
Minimum Additional Amount:This is the minimum investment amount for an existing investor in a mutual fund scheme.
Yield to Maturity:The Yield to Maturity or the YTM is the rate of return anticipated on a bond if held until maturity. YTM is expressed as an annual rate. The YTM factors in the bond's current market price, par value, coupon interest rate and time to maturity.
SIP:SIP of systematic investment plan works on the principle of making periodic investments of a fixed sum. It works similar to a recurring bank deposits. For instance, an investor may opt for an SIP that invest Rs. 500 every 15th of the month in an equity fund for a period of three years.
NAV:The NAV or the net asset value is the total asset value per unit of the mutual fund after deducting all related and permissible expenses. The NAV is calculated at the end of every business day. It is the value at which the investor enters or exits the mutual fund.
Benchmark:A group of securities, usually a market index, whose performance is used as a standard or benchmark to measure investment performance of mutual funds, among other investments. Some typical benchmarks include the Nifty, Sensex, BSE200, BSE500, 10-Year G-Sec.
Entry Load:A mutual fund may have a sales charge or load at the time of entry and/or exit to compensate the distributor/agent. Entry load is charged at the time an investor purchases the units of a mutual fund. The entry load is added to the prevailing NAV at the time of investment. For instance, if the NAV is Rs. 100 and the entry load is 1%, the investor will enter the fund at Rs. 101.Note: SEBI, vide circular dated June 30, 2009 has abolished entry load and mandated that the upfront commission to distributors will be paid by the investor directly to the distributor, based on his assessment of various factors including the service rendered by the distributor.
Exit Load:Exit load is charged at the time an investor redeems the units of a mutual fund. The exit load is deducted from the prevailing NAV at the time of redemption. For instance, if the NAV is Rs. 100 and the exit load is 1%, the redemption price would be Rs. 99 per unit.
Modified Duration:Modified duration is the price sensitivity and the percentage change in price for a unit change in yield.
Standard Deviation:Standard deviation is a statistical measure of the range of an investment's performance. When a mutual fund has a high standard deviation, its means its range of performance is wide, implying greater volatility.
Sharpe Ratio:The Sharpe Ratio, named after its founder, the Nobel Laureate William Sharpe, is a measure of risk-adjusted returns. It is calculated using standard deviation and excess return to determine reward per unit of risk.
Beta Ratio:Beta is a measure of an investment's volatility vis-a-vis the market. Beta of less than 1 means that the security will be less volatile than the market. A beta of greater than 1 implies that the security's price will be more volatile than the market.
AUM:AUM or assets under management refers to the recent / updated cumulative market value of investments managed by a mutual fund or any investment firm.
Holdings:The holdings or the portfolio is a mutual fund's latest or updated reported statement of investments / securities. These are usually displayed in terms of percentage to net assets or the rupee value or both. The objective is to give investors an idea of where their money is being invested by the fund manager.
Nature of Scheme:The investment objective and underlying investments determine the nature of the mutual fund scheme. For instance, a mutual fund that aims at generating capital appreciation by investing in stock markets is an equity fund or growth fund. Likewise, a mutual fund that aims at capital preservation by investing in debt markets is a debt fund or income fund. Each of these categories may have sub-categories.
Rating Profile:Mutual funds invest in securities after evaluating their creditworthiness as disclosed by the ratings. A depiction of the mutual fund in various investments based on their ratings becomes the rating profile of the fund. Typically, this is a feature of debt funds.
Total Expense Ratio:The Expenses of a mutual fund include management fees and all the fees associated with the fund's daily operations. Expense Ratio refers to the annual percentage of fund's assets that is paid out in expenses.
Average Maturity:The average time of maturity of all the debt securities held in a portfolio. It states the weighted average maturity of the assets in the portfolio.
Portfolio Yield:The income return on an investment. This refers to the interest or dividends received from a security and are usually expressed annually as a percentage based on the investment's cost, its current market value or its face value.
Risk Free Return:The theoretical rate of return attributed to an investment with zero risk. The risk-free rate represents the interest on an investor's money that he or she would expect from an absolutely risk-free investment over a specified period of time.
Tracking Error:The divergence between the price behavior of a position or portfolio and the price behavior of a benchmark.
Portfolio Turnover Ratio:This is a measure of the fund's trading activity, which is computed by taking the lesser of purchases or sales (excluding all securities with maturities of less than one year) and dividing by average monthly net assets.

4
Security Name % to Net Assets*
DEBENTURES 0.01Blue Dart Express Ltd. 0.01EQUITY & EQUITY RELATED 98.62TVS Motor Co. Ltd. 7.96Cholamandalam Investment and Fin Co. Ltd. 7.16Eicher Motors Ltd. 5.95Page Industries Ltd. 5.81MRF Ltd. 5.78Gruh Finance Ltd. 5.50Pidilite Industries Ltd. 4.78WABCO India Ltd. 4.74VST Industries Ltd. 4.24Kotak Mahindra Bank Ltd. 4.19ABB India Ltd. 3.77Sundaram Finance Ltd. 3.64Asian Paints Ltd. 3.57
Security Name % to Net Assets*
Thermax Ltd. 3.30Nestle India Ltd. 3.23Colgate Palmolive (India) Ltd. 3.05United Breweries Ltd. 2.93GlaxoSmithKline Consumer Healthcare Ltd. 2.54CRISIL Ltd. 2.49Bosch Ltd. 2.47Bata India Ltd. 2.40Castrol India Ltd. 2.34The Great Eastern Shipping Co. Ltd. 2.21Cummins India Ltd. 2.11Blue Dart Express Ltd. 1.77Sundaram Finance Holdings Ltd. 0.69CBLO 1.20Cash & Cash Receivables 0.17TOTAL 100.00
IDBI Equity Advantage Fund (IEAF)(An open-ended equity linked saving scheme with a statutory lock in of 3 years and tax benefit)
Portfolio as on 31/03/2018
* Rounded off to the nearest two digits after the decimal point.
Industry Classification (for equity & equity related)
19.55%
19.48%
13.92%
12.99%
7.07%
5.81%
4.78%
4.19%
3.98%
2.40%
2.34%
2.11%
0.00% 5.00% 10.00% 15.00% 20.00% 25.00%
Consumer Non Durables
Finance
Auto
Auto Ancillaries
Industrial Capital Goods
Textile Products
Chemicals
Banks
Transportation
Consumer Durables
Petroleum Products
Industrial Products
Scheme Features
Investment objective:The Scheme will seek to invest predominantly in a diversified portfolio of equity and equity related instruments with the objective to provide investors with opportunities for capital appreciation and income along with the benefit of income-tax deduction (under section 80C of the Income-tax Act, 1961) on their investments. Investments in this scheme would be subject to a statutory lock-in of 3 years from the date of allotment to be eligible for income-tax benefits under Section 80C. There can be no assurance that the investment objective under the scheme will be realized.
Fund Manager: Total Experience: Over 36 Years
Mr. V. Balasubramanian (Managing the Scheme since inception)
Inception Date: 10th September, 2013
Benchmark:S&P BSE 200 Index (TRI)
NAV as on 28th March 2018 (` per unit):Regular Direct
Growth 25.92 27.17Dividend 18.20 19.31
Monthly Average AUM:` 647.21 Crs.
AUM as on 31st March 2018:` 643.32 Crs.
Expense Ratio: (Weighted Average for the month)Regular : 2.7751% Direct : 0.8691%Expense ratio is inclusive of GST on management fees.
Quantitative Measures:Standard Deviation : 3.5986 Beta : 0.7811 Sharpe Ratio : -0.0254 Portfolio Turnover Ratio^^ : 0.50Risk free rate: Overnight MIBOR (9.39% as on 28/03/18). Source: FIMMDA.Ratios calculated on monthly 3 years data point.^^ Lower of Purchase or Sale for one year/average AUM for one year.
Load Structure:Entry Load : Not ApplicableExit Load (for Lumpsum & SIP) : Nil. Investment under the scheme is subject to
a lock-in period of 3 Years.
Dividend History (Face Value: ` 10/- Per Unit)
Record Date Individual / HUF (` Per Unit)
Others (` Per Unit)
Cum Dividend NAV** (in `)
Ex Dividend NAV (in `)
IDBI Equity Advantage Fund - Dividend (Regular Plan)19th March, 2018 1.6000 1.6000 19.48 17.9725th September, 2017 1.5000 1.5000 20.34 18.8226th September, 2016 1.0000 1.0000 19.30 18.36
IDBI Equity Advantage Fund - Dividend (Direct Plan)19th March, 2018 1.6000 1.6000 20.55 19.0525th September, 2017 1.5000 0.0000 21.21 19.6826th September, 2016 1.0000 0.0000 19.78 18.84Past performance may or may not be sustained in the future. After the payment of dividend, the per unit NAV of the Dividend option of the Scheme will fall to the extent of the dividend payout and statutory levy, if any. All dividend distribution is subject to availability of distributable surplus on the record date and will be at the discretion of IDBI Asset Management Ltd. and IDBI MF Trustee Company Ltd. For complete dividend history including daily dividend history, please refer to our website.** NAV of the record date.
Product LabelThis product is suitable for investors who are seeking*: Riskometerl Long term capital growthl An Equity Linked Savings Scheme (ELSS) investing
in equity and equity related instruments with the objective to provide investors with opportunities for capital appreciation and income along with the benefit of income-tax deduction (under section 80C of the Income-tax Act, 1961) on their investments, subject to a statutory lock-in of three years Investors understand that their principal will be at
Moderately High risk
*Investors should consult their financial advisors if in doubt about whether the product is suitable for them.

5
Security Name % to Net Assets*
EQUITY & EQUITY RELATED 99.27HDFC Bank Ltd. 5.97Maruti Suzuki India Ltd. 5.26ICICI Bank Ltd. 4.06Housing Development Finance Corpn. Ltd. 3.91IndusInd Bank Ltd. 3.90Larsen & Toubro Ltd. 3.69Indian Oil Corpn. Ltd. 3.65Britannia Industries Ltd. 3.62Titan Co. Ltd. 3.60Indiabulls Housing Finance Ltd. 2.95Procter & Gamble Hygiene & Healthcare Ltd. 2.94Bajaj Finance Ltd. 2.85Yes Bank Ltd. 2.62Petronet LNG Ltd. 2.55ABB India Ltd. 2.55Piramal Enterprises Ltd. 2.53State Bank of India 2.45Eicher Motors Ltd. 2.36Hindustan Zinc Ltd. 2.29Asian Paints Ltd. 2.25Ultratech Cement Ltd. 2.13
Security Name % to Net Assets*
Bharat Electronics Ltd. 2.09Emami Ltd. 2.07Container Corpn. of India Ltd. 1.99Infosys Ltd. 1.95Shriram Transport Finance Co. Ltd. 1.94Shree Cement Ltd. 1.87Cummins India Ltd. 1.82Motherson Sumi Systems Ltd. 1.78Bajaj Finserv Ltd. 1.67Sun TV Network Ltd. 1.67ICICI Prudential Life Insurance Co. Ltd. 1.62Pidilite Industries Ltd. 1.61Bosch Ltd. 1.53TATA Steel Ltd. 1.50Hero MotoCorp Ltd. 1.42Godrej Consumer Products Ltd. 1.39UPL Ltd. 1.26Dabur India Ltd. 1.14Aurobindo Pharma Ltd. 0.82CBLO 0.84Cash & Cash Receivables -0.12TOTAL 100.00
IDBI India Top 100 Equity Fund (IIT100EF)(Large Cap Fund - An open-ended equity scheme predominantly investing in large cap stocks)
Portfolio as on 31/03/2018
* Rounded off to the nearest two digits after the decimal point.
Industry Classification (for equity & equity related)
19.02%
14.95%
13.41%
9.04%
4.64%
4.00%
3.69%
3.65%
3.60%
3.35%
3.31%
2.55%
2.29%
1.99%
1.95%
1.82%
1.67%
1.61%
1.50%
1.26%
0.00% 4.00% 8.00% 12.00% 16.00% 20.00%
Banks
Finance
Consumer Non Durables
Auto
Industrial Capital Goods
Cement
Construction Project
Petroleum Products
Consumer Durables
Pharmaceuticals
Auto Ancillaries
Gas
Non - Ferrous Metals
Transportation
Software
Industrial Products
Media & Entertainment
Chemicals
Ferrous Metals
Pesticides
Disclaimer of IISL: The IDBI India Top 100 Equity Fund offered by IDBI Mutual Fund or its affiliates is not sponsored, endorsed, sold or promoted by India Index Services & Products Limited (IISL) and its affiliates. IISL and its affiliates do not make any representation or warranty, express or implied (including warranties of merchantability or fitness for particular purpose or use) and disclaims all liability to the owners of IDBI India Top 100 Equity Fund or any member of the public regarding the advisability of investing in securities generally or in the IDBI India Top 100 Equity Fund linked to Nifty 100 Index or particularly in the ability of the Nifty 100 Index to track general stock market performance in India. Please read the full Disclaimers in relation to the Nifty100 Index in the Scheme Information Document.
Scheme Features
Investment objective:The Investment objective of the Scheme is to provide investors with the apportunities for long-term capital appreciation by investing predominantly in Equity and Equity related Instruments of Large Cap companies. However there can be no assurance that the investment objective under the Scheme will be realized.
Fund Manager: Total Experience: Over 15 YearsMrs. Uma Venkatraman (Managing the Scheme since 5th September 2017)
Inception Date: 15th May, 2012
Benchmark:Nifty 100 Index (TRI)
NAV as on 28th March 2018 (` per unit):Regular Direct
Growth 22.92 24.05Dividend 16.48 17.47
Monthly Average AUM:` 410.10 Crs.
AUM as on 31st March 2018:` 407.21 Crs.
Expense Ratio: (Weighted Average for the month)Regular : 3.2041% Direct : 1.2351%Expense ratio is inclusive of GST on management fees.
Quantitative Measures:Standard Deviation : 3.7835 Beta : 0.9094 Sharpe Ratio : -0.0790 Portfolio Turnover Ratio^^ : 0.60Risk free rate: Overnight MIBOR (9.39% as on 28/03/18). Source: FIMMDA.Ratios calculated on monthly 3 years data point.^^ Lower of Purchase or Sale for one year/average AUM for one year.
Load Structure:Entry Load : Not ApplicableExit Load : for Lumpsum - 1% for exit (Redemption Switch-out/Transfer/SWP) within 12 months
from the date of allotment. for SIP - 1% for exit (Redemption/Switch-out/Transfer/SWP) within 12
months from the date of allotment of each installment.
Dividend History (Face Value: ` 10/- Per Unit)
Record Date Individual / HUF (` Per Unit)
Others (` Per Unit)
Cum Dividend NAV** (in `)
Ex Dividend NAV (in `)
IDBI India Top 100 Equity Fund - Dividend (Regular Plan)19th March, 2018 1.5000 1.5000 17.79 16.3331st May, 2017 1.0000 1.0000 19.15 18.1630th May, 2016 1.0000 1.0000 16.67 15.69
IDBI India Top 100 Equity Fund - Dividend (Direct Plan)19th March, 2018 1.5000 1.5000 18.76 17.3031st May, 2017 1.0000 1.0000 19.86 18.8630th May, 2016 1.0000 1.0000 17.04 16.06Past performance may or may not be sustained in the future. After the payment of dividend, the per unit NAV of the Dividend option of the Scheme will fall to the extent of the dividend payout and statutory levy, if any. All dividend distribution is subject to availability of distributable surplus on the record date and will be at the discretion of IDBI Asset Management Ltd. and IDBI MF Trustee Company Ltd. For complete dividend history including daily dividend history, please refer to our website.** NAV of the record date.
Product LabelThis product is suitable for investors who are seeking*: Riskometer
l Long term capital growthl Investments predominantly in large cap equity and
equity related instruments
Investors understand that their principal will be at Moderately High risk
*Investors should consult their financial advisors if in doubt about whether the product is suitable for them.
6
Security Name % to Net Assets*
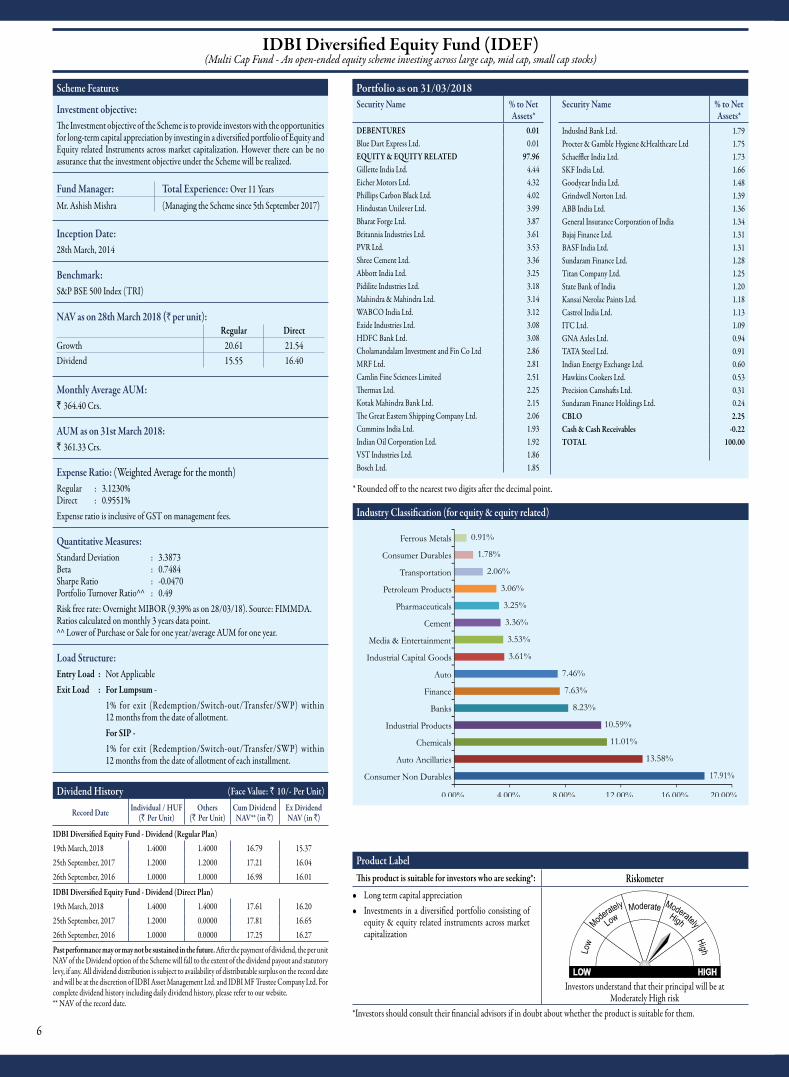
DEBENTURES 0.01Blue Dart Express Ltd. 0.01EQUITY & EQUITY RELATED 97.96Gillette India Ltd. 4.44Eicher Motors Ltd. 4.32Phillips Carbon Black Ltd. 4.02Hindustan Unilever Ltd. 3.99Bharat Forge Ltd. 3.87Britannia Industries Ltd. 3.61PVR Ltd. 3.53Shree Cement Ltd. 3.36Abbott India Ltd. 3.25Pidilite Industries Ltd. 3.18Mahindra & Mahindra Ltd. 3.14WABCO India Ltd. 3.12Exide Industries Ltd. 3.08HDFC Bank Ltd. 3.08Cholamandalam Investment and Fin Co Ltd 2.86MRF Ltd. 2.81Camlin Fine Sciences Limited 2.51Thermax Ltd. 2.25Kotak Mahindra Bank Ltd. 2.15The Great Eastern Shipping Company Ltd. 2.06Cummins India Ltd. 1.93Indian Oil Corporation Ltd. 1.92VST Industries Ltd. 1.86Bosch Ltd. 1.85
Security Name % to Net Assets*
IndusInd Bank Ltd. 1.79Procter & Gamble Hygiene &Healthcare Ltd 1.75Schaeffler India Ltd. 1.73SKF India Ltd. 1.66Goodyear India Ltd. 1.48Grindwell Norton Ltd. 1.39ABB India Ltd. 1.36General Insurance Corporation of India 1.34Bajaj Finance Ltd. 1.31BASF India Ltd. 1.31Sundaram Finance Ltd. 1.28Titan Company Ltd. 1.25State Bank of India 1.20Kansai Nerolac Paints Ltd. 1.18Castrol India Ltd. 1.13ITC Ltd. 1.09GNA Axles Ltd. 0.94TATA Steel Ltd. 0.91Indian Energy Exchange Ltd. 0.60Hawkins Cookers Ltd. 0.53Precision Camshafts Ltd. 0.31Sundaram Finance Holdings Ltd. 0.24CBLO 2.25Cash & Cash Receivables -0.22TOTAL 100.00
IDBI Diversified Equity Fund (IDEF)(Multi Cap Fund - An open-ended equity scheme investing across large cap, mid cap, small cap stocks)
Portfolio as on 31/03/2018Scheme Features
Investment objective:The Investment objective of the Scheme is to provide investors with the opportunities for long-term capital appreciation by investing in a diversified portfolio of Equity and Equity related Instruments across market capitalization. However there can be no assurance that the investment objective under the Scheme will be realized.
Fund Manager: Total Experience: Over 11 YearsMr. Ashish Mishra (Managing the Scheme since 5th September 2017)
Inception Date: 28th March, 2014
Benchmark:S&P BSE 500 Index (TRI)
NAV as on 28th March 2018 (` per unit):Regular Direct
Growth 20.61 21.54Dividend 15.55 16.40
Monthly Average AUM:` 364.40 Crs.
AUM as on 31st March 2018:` 361.33 Crs.
Expense Ratio: (Weighted Average for the month)Regular : 3.1230% Direct : 0.9551%Expense ratio is inclusive of GST on management fees.
Quantitative Measures:Standard Deviation : 3.3873 Beta : 0.7484 Sharpe Ratio : -0.0470 Portfolio Turnover Ratio^^ : 0.49Risk free rate: Overnight MIBOR (9.39% as on 28/03/18). Source: FIMMDA.Ratios calculated on monthly 3 years data point.^^ Lower of Purchase or Sale for one year/average AUM for one year.
Load Structure:Entry Load : Not ApplicableExit Load : For Lumpsum - 1% for exit (Redemption/Switch-out/Transfer/SWP) within
12 months from the date of allotment. For SIP - 1% for exit (Redemption/Switch-out/Transfer/SWP) within
12 months from the date of allotment of each installment.
Dividend History (Face Value: ` 10/- Per Unit)
Record Date Individual / HUF (` Per Unit)
Others (` Per Unit)
Cum Dividend NAV** (in `)
Ex Dividend NAV (in `)
IDBI Diversified Equity Fund - Dividend (Regular Plan)19th March, 2018 1.4000 1.4000 16.79 15.3725th September, 2017 1.2000 1.2000 17.21 16.0426th September, 2016 1.0000 1.0000 16.98 16.01
IDBI Diversified Equity Fund - Dividend (Direct Plan)19th March, 2018 1.4000 1.4000 17.61 16.2025th September, 2017 1.2000 0.0000 17.81 16.6526th September, 2016 1.0000 0.0000 17.25 16.27
Past performance may or may not be sustained in the future. After the payment of dividend, the per unit NAV of the Dividend option of the Scheme will fall to the extent of the dividend payout and statutory levy, if any. All dividend distribution is subject to availability of distributable surplus on the record date and will be at the discretion of IDBI Asset Management Ltd. and IDBI MF Trustee Company Ltd. For complete dividend history including daily dividend history, please refer to our website.** NAV of the record date.
Product LabelThis product is suitable for investors who are seeking*: Riskometerl Long term capital appreciationl Investments in a diversified portfolio consisting of
equity & equity related instruments across market capitalization
Investors understand that their principal will be at Moderately High risk
*Investors should consult their financial advisors if in doubt about whether the product is suitable for them.
* Rounded off to the nearest two digits after the decimal point.
Industry Classification (for equity & equity related)
17.91%
13.58%
11.01%
10.59%
8.23%
7.63%
7.46%
3.61%
3.53%
3.36%
3.25%
3.06%
2.06%
1.78%
0.91%
0.00% 4.00% 8.00% 12.00% 16.00% 20.00%
Consumer Non Durables
Auto Ancillaries
Chemicals
Industrial Products
Banks
Finance
Auto
Industrial Capital Goods
Media & Entertainment
Cement
Pharmaceuticals
Petroleum Products
Transportation
Consumer Durables
Ferrous Metals

7
Security Name % to Net Assets*
EQUITY & EQUITY RELATED 96.71HDFC Bank Ltd. 9.70Reliance Industries Ltd. 7.66Housing Development Finance Corpn. Ltd. 7.31Infosys Ltd. 5.67ITC Ltd. 5.49ICICI Bank Ltd. 4.50Larsen & Toubro Ltd. 4.05TATA Consultancy Services Ltd. 3.54Kotak Mahindra Bank Ltd. 3.51Maruti Suzuki India Ltd. 2.95Hindustan Unilever Ltd. 2.39State Bank of India 2.33IndusInd Bank Ltd. 2.29Axis Bank Ltd. 2.05Mahindra & Mahindra Ltd. 1.72TATA Motors Ltd. 1.51Yes Bank Ltd. 1.40Sun Pharmaceutical Industries Ltd. 1.37HCL Technologies Ltd. 1.34Bharti Airtel Ltd. 1.32Vedanta Ltd. 1.29NTPC Ltd. 1.29Oil & Natural Gas Corpn. Ltd. 1.26Asian Paints Ltd. 1.25Hero MotoCorp Ltd. 1.16TATA Steel Ltd. 1.12
Security Name % to Net Assets*
Power Grid Corpn. of India Ltd. 1.06Bajaj Finance Ltd. 1.05Ultratech Cement Ltd. 1.03Indiabulls Housing Finance Ltd. 1.00Tech Mahindra Ltd. 0.99Eicher Motors Ltd. 0.95Bajaj Auto Ltd. 0.93Coal India Ltd. 0.93Indian Oil Corpn. Ltd. 0.90Bharat Petroleum Corpn. Ltd. 0.84Wipro Ltd. 0.80Hindalco Industries Ltd. 0.79Zee Entertainment Enterprises Ltd. 0.78GAIL (India) Ltd. 0.71Adani Port and Special Economic Zone Ltd. 0.69Cipla Ltd. 0.69UPL Ltd. 0.67Bharti Infratel Ltd. 0.65Hindustan Petroleum Corpn. Ltd. 0.65Dr. Reddy's Laboratories Ltd. 0.63Lupin Ltd. 0.44Bosch Ltd. 0.05Aurobindo Pharma Ltd. 0.00Ambuja Cements Ltd. 0.00CBLO 0.83Cash & Cash Receivables 2.46TOTAL 100.00
IDBI Nifty Index Fund (INIF)(An open-ended scheme replicating/ tracking the Nifty 50 Index [Total Returns Index])
Portfolio as on 31/03/2018Scheme Features
Investment objective:The investment objective of the scheme is to invest only in and all the stocks comprising the Nifty 50 Index in the same weights of these stocks as in the Index with the objective to replicate the performance of the Total Returns Index of Nifty 50 Index. The scheme may also invest in derivatives instruments such as Futures and Options linked to stocks comprising the Index or linked to the Nifty 50 Index. The scheme will adopt a passive investment strategy and will seek to achieve the investment objective by minimizing the tracking error between the Nifty 50 Index (Total Returns Index) and the Scheme.
Fund Manager: Total Experience: Over 15 Years
Mrs. Uma Venkatraman (Managing the Scheme since 5th September 2017)
Inception Date: 25th June, 2010
Benchmark:Nifty 50 Index (TRI)
NAV as on 28th March 2018 (` per unit):Regular Direct
Growth 18.6468 19.4549Dividend 17.7817 18.5557
Monthly Average AUM:` 197.67 Crs.
AUM as on 31st March 2018:` 196.40 Crs.
Expense Ratio: (Weighted Average for the month)Regular : 1.7593% Direct : 0.4258%Expense ratio is inclusive of GST on management fees.
Quantitative Measures:Portfolio Turnover Ratio^^ : 0.59 Tracking Error : 0.7784%Annualised tracking error for last 12 month's period.^^ Lower of Purchase or Sale for one year/average AUM for one year.
Load Structure:Entry Load : Not ApplicableExit Load (for Lumpsum & SIP) : Nil
Dividend History (Face Value: ` 10/- Per Unit)
Record Date Individual / HUF (` Per Unit)
Others (` Per Unit)
Cum Dividend NAV** (in `)
Ex Dividend NAV (in `)
IDBI Nifty Index Fund - Dividend (Regular Plan)14th October, 2010 0.4000 0.4000 11.5740 10.962831st August, 2010 0.1200 0.0000 10.2883 10.2886Past performance may or may not be sustained in the future. After the payment of dividend, the per unit NAV of the Dividend option of the Scheme will fall to the extent of the dividend payout and statutory levy, if any. All dividend distribution is subject to availability of distributable surplus on the record date and will be at the discretion of IDBI Asset Management Ltd. and IDBI MF Trustee Company Ltd. For complete dividend history including daily dividend history, please refer to our website.** NAV of the record date.
Product LabelThis product is suitable for investors who are seeking*: Riskometer
l Long Term growth in a passively managed scheme tracking Nifty 50 Index (TRI)l Investments only in and all stocks comprising Nifty 50 Index in the same weight of these stocks as in
Index with objective to replicate performance of Nifty 50 Index (TRI)
Investors understand that their principal will be at Moderately High risk*Investors should consult their financial advisors if in doubt about whether the product is suitable for them.
* Rounded off to the nearest two digits after the decimal point.
Industry Classification (for equity & equity related)
25.77%
12.35%
10.05%
9.36%
9.22%
9.12%
4.05%
3.14%
2.36%
2.09%
1.32%
1.26%
1.12%
1.03%
0.93%
0.78%
0.71%
0.69%
0.67%
0.65%
0.05%
0.00% 5.00% 10.00% 15.00% 20.00% 25.00% 30.00%
Banks
Software
Petroleum Products
Finance
Auto
Consumer Non Durables
Construction Project
Pharmaceuticals
Power
Non - Ferrous Metals
Telecom - Services
Oil
Ferrous Metals
Cement
Minerals/Mining
Media & Entertainment
Gas
Transportation
Pesticides
Telecom - Equipment & Accessories
Auto Ancillaries
Disclaimer of IISL : The IDBI Nifty Index Fund offered by IDBI Mutual Fund or its affiliates is not sponsored, endorsed, sold or promoted by India Index Services & Products Limited (IISL) and its affiliates. IISL and its affiliates do not make any representation or warranty, express or implied (including warranties of merchantability or fitness for particular purpose or use) and disclaims all liability to the owners of IDBI Nifty Index Fund or any member of the public regarding the advisability of investing in securities generally or in the IDBI Nifty Index Fund linked to Nifty 50 Index or particularly in the ability of the Nifty 50 Index to track general stock market performance in India. Please read the full Disclaimers in relation to the Nifty 50 Index in the Scheme Information Document.
8
Security Name % To Net Assets*
EQUITY & EQUITY RELATED 82.92JSW Steel Ltd. 4.26Britannia Industries Ltd. 4.15Godrej Consumer Products Ltd. 3.92Motherson Sumi Systems Ltd. 3.44Piramal Enterprises Ltd. 3.00Shriram Transport Finance Co. Ltd. 2.97Ashok Leyland Ltd. 2.96Shree Cement Ltd. 2.80Dabur India Ltd. 2.63MRF Ltd. 2.52United Spirits Ltd. 2.51Petronet LNG Ltd. 2.46Marico Ltd. 2.39LIC Housing Finance Ltd. 2.30Pidilite Industries Ltd. 1.97Colgate Palmolive (India) Ltd. 1.96Idea Cellular Ltd. 1.93Container Corpn. of India Ltd. 1.90Bank of Baroda 1.90ACC Ltd. 1.80Interglobe Aviation Ltd. 1.68Havells India Ltd. 1.62Bharat Electronics Ltd. 1.55Bharat Heavy Electricals Ltd. 1.54NMDC Ltd. 1.50ICICI Prudential Life Insurance Co. Ltd. 1.47
Security Name % To Net Assets*
Rural Electrification Corporation Ltd. 1.41Punjab National Bank 1.40Cadila Healthcare Ltd. 1.35Siemens Ltd. 1.33Cummins India Ltd. 1.33Avenue Supermarts Ltd. 1.28Procter & Gamble Hygiene & Healthcare Ltd 1.25DLF Ltd. 1.25Sun TV Network Ltd. 1.17Oracle Financial Services Software Ltd. 1.16Power Finance Corpn. Ltd. 1.07Hindustan Zinc Ltd. 1.06Steel Authority of India Ltd. 1.03ABB India Ltd. 0.96Emami Ltd. 0.91Oil India Ltd. 0.82NHPC Ltd. 0.82GlaxoSmithKline Consumer Healthcare Ltd. 0.06Bajaj Finserv Ltd. 0.05Glaxosmithkline Pharmaceuticals Ltd. 0.02Torrent Pharmaceuticals Ltd. 0.01Titan Company Ltd. 0.01Glenmark Pharmaceuticals Ltd. 0.01TATA Power Company Ltd. 0.00CBLO 0.76Cash & Cash Receivables 16.32TOTAL 100.00
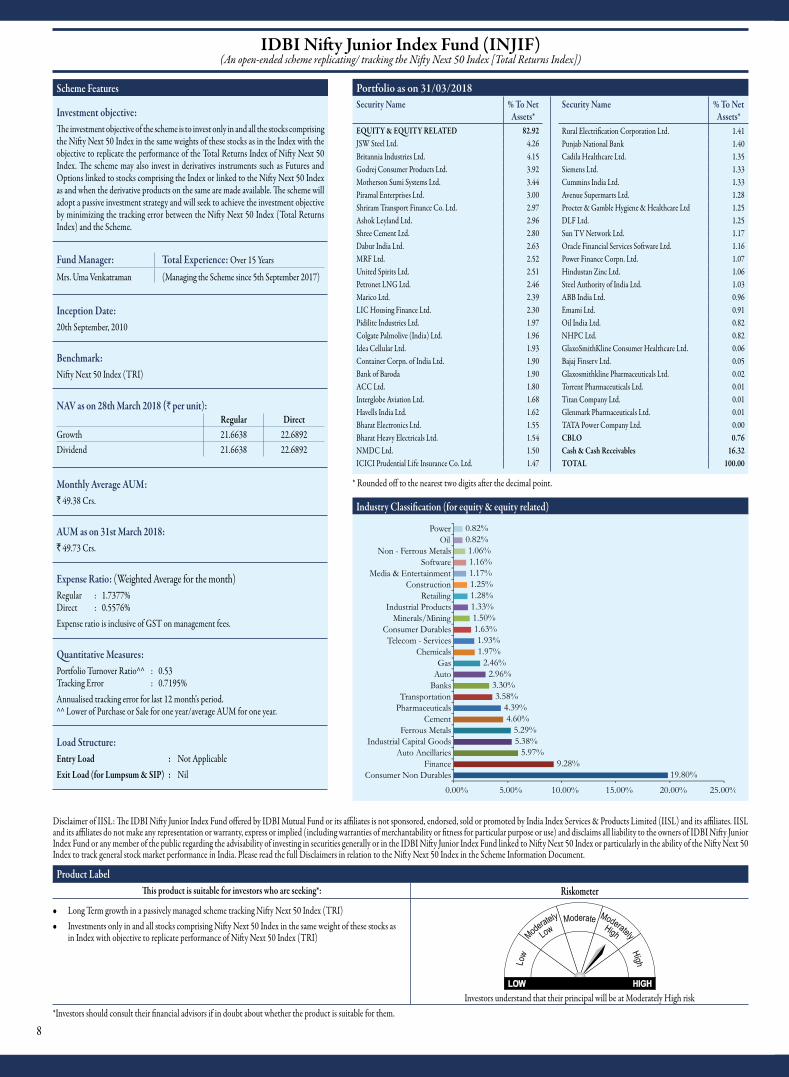
IDBI Nifty Junior Index Fund (INJIF)(An open-ended scheme replicating/ tracking the Nifty Next 50 Index [Total Returns Index])
Portfolio as on 31/03/2018Scheme Features
Investment objective:The investment objective of the scheme is to invest only in and all the stocks comprising the Nifty Next 50 Index in the same weights of these stocks as in the Index with the objective to replicate the performance of the Total Returns Index of Nifty Next 50 Index. The scheme may also invest in derivatives instruments such as Futures and Options linked to stocks comprising the Index or linked to the Nifty Next 50 Index as and when the derivative products on the same are made available. The scheme will adopt a passive investment strategy and will seek to achieve the investment objective by minimizing the tracking error between the Nifty Next 50 Index (Total Returns Index) and the Scheme.
Fund Manager: Total Experience: Over 15 Years
Mrs. Uma Venkatraman (Managing the Scheme since 5th September 2017)
Inception Date: 20th September, 2010
Benchmark:Nifty Next 50 Index (TRI)
NAV as on 28th March 2018 (` per unit):Regular Direct
Growth 21.6638 22.6892Dividend 21.6638 22.6892
Monthly Average AUM:` 49.38 Crs.
AUM as on 31st March 2018:` 49.73 Crs.
Expense Ratio: (Weighted Average for the month)Regular : 1.7377% Direct : 0.5576%Expense ratio is inclusive of GST on management fees.
Quantitative Measures:Portfolio Turnover Ratio^^ : 0.53 Tracking Error : 0.7195%Annualised tracking error for last 12 month's period.^^ Lower of Purchase or Sale for one year/average AUM for one year.
Load Structure:Entry Load : Not ApplicableExit Load (for Lumpsum & SIP) : Nil
Disclaimer of IISL: The IDBI Nifty Junior Index Fund offered by IDBI Mutual Fund or its affiliates is not sponsored, endorsed, sold or promoted by India Index Services & Products Limited (IISL) and its affiliates. IISL and its affiliates do not make any representation or warranty, express or implied (including warranties of merchantability or fitness for particular purpose or use) and disclaims all liability to the owners of IDBI Nifty Junior Index Fund or any member of the public regarding the advisability of investing in securities generally or in the IDBI Nifty Junior Index Fund linked to Nifty Next 50 Index or particularly in the ability of the Nifty Next 50 Index to track general stock market performance in India. Please read the full Disclaimers in relation to the Nifty Next 50 Index in the Scheme Information Document.
Product LabelThis product is suitable for investors who are seeking*: Riskometer
l Long Term growth in a passively managed scheme tracking Nifty Next 50 Index (TRI)l Investments only in and all stocks comprising Nifty Next 50 Index in the same weight of these stocks as
in Index with objective to replicate performance of Nifty Next 50 Index (TRI)
Investors understand that their principal will be at Moderately High risk*Investors should consult their financial advisors if in doubt about whether the product is suitable for them.
* Rounded off to the nearest two digits after the decimal point.
Industry Classification (for equity & equity related)
19.80%
9.28%
5.97%
5.38%
5.29%
4.60%
4.39%
3.58%
3.30%
2.96%
2.46%
1.97%
1.93%
1.63%
1.50%
1.33%
1.28%
1.25%
1.17%
1.16%
1.06%
0.82%
0.82%
0.00% 5.00% 10.00% 15.00% 20.00% 25.00%
Consumer Non Durables
Finance
Auto Ancillaries
Industrial Capital Goods
Ferrous Metals
Cement
Pharmaceuticals
Transportation
Banks
Auto
Gas
Chemicals
Telecom - Services
Consumer Durables
Minerals/Mining
Industrial Products
Retailing
Construction
Media & Entertainment
Software
Non - Ferrous Metals
Oil
Power
9
Security Name % To Net Assets*
EQUITY & EQUITY RELATED 76.67Minda Industries Ltd. 3.92Phillips Carbon Black Ltd. 3.83TATA Elxsi Ltd. 3.26Sterlite Technologies Ltd. 2.96Procter & Gamble Hygiene & Healthcare Ltd. 2.58Trent Ltd. 2.50RBL Bank Ltd. 2.12Motherson Sumi Systems Ltd. 2.06Akzo Nobel India Ltd. 2.04Bharat Financial Inclusion Ltd. 2.02The Federal Bank Ltd. 2.01Minda Corpn. Ltd. 1.97Dalmia Bharat Ltd. 1.94Endurance Technologies Ltd. 1.92Sanofi India Ltd. 1.91AIA Engineering Ltd. 1.91Supreme Industries Ltd. 1.90Heritage Foods Ltd. 1.79General Insurance Corpn. of India 1.78Finolex Cables Ltd. 1.67The Ramco Cements Ltd. 1.60National Aluminium Co. Ltd. 1.47Amara Raja Batteries Ltd. 1.46CESC Ltd. 1.35Navin Fluorine Int. Ltd. 1.34Hindustan Copper Ltd. 1.33Johnson Controls-Hitachi Air Conditioning India Ltd. 1.29
Security Name % To Net Assets*
CCL Products (India) Ltd. 1.28Dabur India Ltd. 1.21Gujarat State Petronet Ltd. 1.19Shriram Transport Finance Co. Ltd. 1.10Elgi Equipments Ltd. 1.08Indraprastha Gas Ltd. 1.03Carborundum Universal Ltd. 1.02Bosch Ltd. 0.99VA Tech Wabag Ltd. 0.99PNB Housing Finance Ltd. 0.98Mahindra CIE Automotive Ltd. 0.98Cadila Healthcare Ltd. 0.97BEML Ltd. 0.96Gujarat Gas Ltd. 0.92Aurobindo Pharma Ltd. 0.85Century Plyboard (India) Ltd. 0.84UPL Ltd. 0.81Trident Ltd. 0.76Vinati Organics Ltd. 0.75Timken India Ltd. 0.62DCB Bank Ltd. 0.61Cummins India Ltd. 0.54Housing And Urban Development Corpn. Ltd. 0.227.50% Vedanta Redeemable Preference Shares 0.06CBLO 22.90Cash & Cash Receivables 0.43TOTAL 100.00
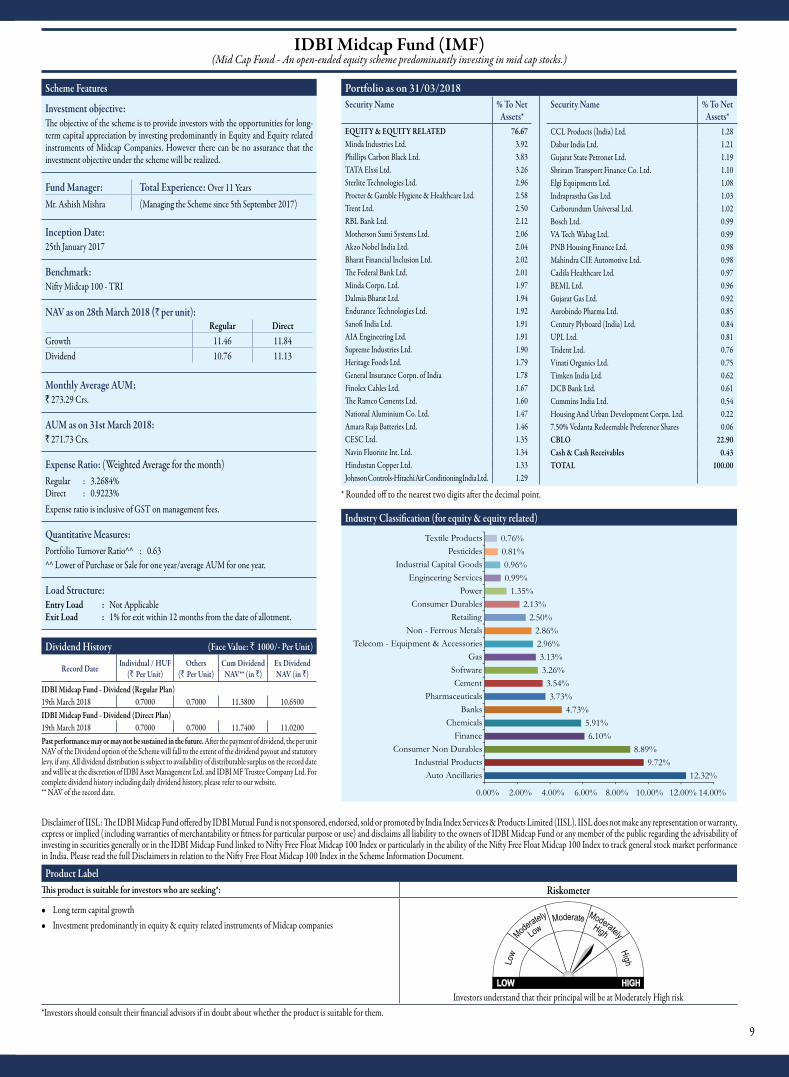
IDBI Midcap Fund (IMF)(Mid Cap Fund - An open-ended equity scheme predominantly investing in mid cap stocks.)
Scheme Features
Investment objective:The objective of the scheme is to provide investors with the opportunities for long-term capital appreciation by investing predominantly in Equity and Equity related instruments of Midcap Companies. However there can be no assurance that the investment objective under the scheme will be realized.
Fund Manager: Total Experience: Over 11 YearsMr. Ashish Mishra (Managing the Scheme since 5th September 2017)
Inception Date: 25th January 2017
Benchmark:Nifty Midcap 100 - TRI
NAV as on 28th March 2018 (` per unit):Regular Direct
Growth 11.46 11.84Dividend 10.76 11.13
Monthly Average AUM:` 273.29 Crs.
AUM as on 31st March 2018:` 271.73 Crs.
Expense Ratio: (Weighted Average for the month)Regular : 3.2684% Direct : 0.9223%Expense ratio is inclusive of GST on management fees.
Quantitative Measures:Portfolio Turnover Ratio^^ : 0.63^^ Lower of Purchase or Sale for one year/average AUM for one year.
Load Structure:Entry Load : Not ApplicableExit Load : 1% for exit within 12 months from the date of allotment.
Dividend History (Face Value: ` 1000/- Per Unit)
Record Date Individual / HUF (` Per Unit)
Others (` Per Unit)
Cum Dividend NAV** (in `)
Ex Dividend NAV (in `)
IDBI Midcap Fund - Dividend (Regular Plan)19th March 2018 0.7000 0.7000 11.3800 10.6500IDBI Midcap Fund - Dividend (Direct Plan)19th March 2018 0.7000 0.7000 11.7400 11.0200Past performance may or may not be sustained in the future. After the payment of dividend, the per unit NAV of the Dividend option of the Scheme will fall to the extent of the dividend payout and statutory levy, if any. All dividend distribution is subject to availability of distributable surplus on the record date and will be at the discretion of IDBI Asset Management Ltd. and IDBI MF Trustee Company Ltd. For complete dividend history including daily dividend history, please refer to our website.** NAV of the record date.
Product LabelThis product is suitable for investors who are seeking*: Riskometer
l Long term capital growthl Investment predominantly in equity & equity related instruments of Midcap companies
Investors understand that their principal will be at Moderately High risk*Investors should consult their financial advisors if in doubt about whether the product is suitable for them.
Disclaimer of IISL: The IDBI Midcap Fund offered by IDBI Mutual Fund is not sponsored, endorsed, sold or promoted by India Index Services & Products Limited (IISL). IISL does not make any representation or warranty, express or implied (including warranties of merchantability or fitness for particular purpose or use) and disclaims all liability to the owners of IDBI Midcap Fund or any member of the public regarding the advisability of investing in securities generally or in the IDBI Midcap Fund linked to Nifty Free Float Midcap 100 Index or particularly in the ability of the Nifty Free Float Midcap 100 Index to track general stock market performance in India. Please read the full Disclaimers in relation to the Nifty Free Float Midcap 100 Index in the Scheme Information Document.
Portfolio as on 31/03/2018
* Rounded off to the nearest two digits after the decimal point.
Industry Classification (for equity & equity related)
12.32%
9.72%
8.89%
6.10%
5.91%
4.73%
3.73%
3.54%
3.26%
3.13%
2.96%
2.86%
2.50%
2.13%
1.35%
0.99%
0.96%
0.81%
0.76%
0.00% 2.00% 4.00% 6.00% 8.00% 10.00% 12.00% 14.00%
Auto Ancillaries
Industrial Products
Consumer Non Durables
Finance
Chemicals
Banks
Pharmaceuticals
Cement
Software
Gas
Telecom - Equipment & Accessories
Non - Ferrous Metals
Retailing
Consumer Durables
Power
Engineering Services
Industrial Capital Goods
Pesticides
Textile Products

10
Security Name % To Net Assets*
EQUITY & EQUITY RELATED 97.97General Insurance Corpn. of India 5.873M India Ltd. 3.79Camlin Fine Sciences Ltd. 3.30Cholamandalam Investment and Fin. Co. Ltd 3.29Voltas Ltd. 2.77Mahindra & Mahindra Financial Services Ltd. 2.73KEI Industries Ltd. 2.62V.S.T Tillers Tractors Ltd. 2.43Elantas Beck India Ltd. 2.41Kansai Nerolac Paints Ltd. 2.30AIA Engineering Ltd. 2.20Somany Ceramics Ltd. 2.19Transport Corpn. of India Ltd. 2.18Ahluwalia Contracts (India) Ltd. 2.16Cera Sanitaryware Ltd. 2.11GNA Axles Ltd. 2.11Cochin Shipyard Ltd. 2.04V-Mart Retail Ltd. 2.04Mahindra Logistics Ltd. 2.00Ingersoll Rand (India) Ltd. 1.98Goodyear India Ltd. 1.97Timken India Ltd. 1.95JK Cement Ltd. 1.93Vijaya Bank 1.87NCC Ltd. 1.87ISGEC Heavy Engineering Ltd. 1.77Gravita India Ltd. 1.77
Security Name % To Net Assets*
City Union Bank Ltd. 1.76NRB Bearing Ltd. 1.75Mold-Tek Packaging Ltd. 1.74Star Cement Ltd. 1.72ABB India Ltd. 1.71Muthoot Capital Services Ltd. 1.68Aegis Logistics Ltd. 1.67Grindwell Norton Ltd. 1.59Garware Wall Ropes Ltd. 1.56Hatsun Agro Product Ltd. 1.55Dishman Carbogen Amcis Ltd. 1.55Honeywell Automation India Ltd. 1.54Indian Energy Exchange Ltd. 1.32Ineos Styrolution India Ltd. 1.32Exide Industries Ltd. 1.26WABCO India Ltd. 1.26Bajaj Auto Ltd. 1.25Mm Forgings Ltd. 1.14Capacite Infraprojects Ltd. 1.09Greenply Industries Ltd. 1.09Sundaram Clayton Ltd. 0.89Caplin Point Laboratories Ltd. 0.73Sintex Plastics Technology Ltd. 0.65Rajapalayam Mills Ltd. 0.50CBLO 1.98Cash & Cash Receivables 0.05TOTAL 100.00
IDBI Small Cap Fund (ISF)(Small Cap Fund - An open-ended equity scheme predominantly investing in small cap stocks)
Scheme Features
Investment objective:The Investment objective of the Scheme is to provide investors with the opportunities for long-term capital appreciation by investing predominantly in Equity and Equity related instruments of Small Cap companies. However there can be no assurance that the investment objective under the Scheme will be realized.
Fund Manager: Total Experience: Over 15 Years
Mrs. Uma Venkatraman (Managing the Scheme since 5th September 2017)
Inception Date: 21st June 2017
Benchmark:Nifty Smallcap 250 Index (TRI)
NAV as on 28th March 2018 (` per unit):Regular Direct
Growth 10.36 10.59Dividend 10.36 10.59
Monthly Average AUM:` 222.12 Crs.
AUM as on 31st March 2018:` 220.43 Crs.
Expense Ratio: (Weighted Average for the month)Regular : 3.2921% Direct : 0.6513%Expense ratio is inclusive of GST on management fees.
Load Structure:Entry Load : Not ApplicableExit Load : 1% for exit within 12 months from the date of allotment.
* Rounded off to the nearest two digits after the decimal point.
Industry Classification (for equity & equity related)
21.14%
14.90%
7.55%
7.49%
5.29%
4.64%
4.18%
3.85%
3.79%
3.67%
3.65%
3.63%
3.30%
2.27%
2.05%
2.04%
1.77%
1.67%
1.09%
0.00% 5.00% 10.00% 15.00% 20.00% 25.00%
Industrial Products
Finance
Construction
Auto Ancillaries
Industrial Capital Goods
Construction Project
Transportation
Consumer Non Durables
Commercial Services
Auto
Cement
Banks
Chemicals
Pharmaceuticals
Textile Products
Retailing
Minerals/Mining
Gas
Consumer Durables
Product LabelThis product is suitable for investors who are seeking*: Riskometer
l Long term capital growthl Investment predominantly in equity & equity related instruments of Small Cap companies
Investors understand that their principal will be at Moderately High risk*Investors should consult their financial advisors if in doubt about whether the product is suitable for them.
Portfolio as on 31/03/2018
11
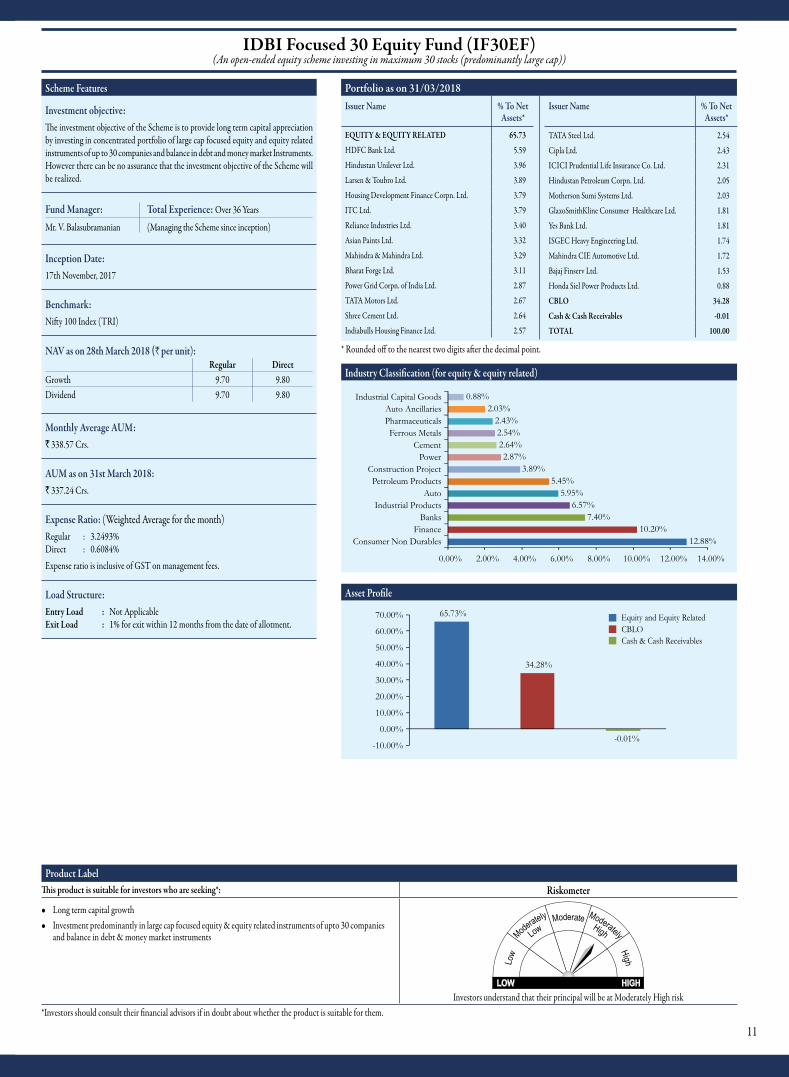
IDBI Focused 30 Equity Fund (IF30EF)(An open-ended equity scheme investing in maximum 30 stocks (predominantly large cap))
Scheme Features
Investment objective:The investment objective of the Scheme is to provide long term capital appreciation by investing in concentrated portfolio of large cap focused equity and equity related instruments of up to 30 companies and balance in debt and money market Instruments. However there can be no assurance that the investment objective of the Scheme will be realized.
Fund Manager: Total Experience: Over 36 Years
Mr. V. Balasubramanian (Managing the Scheme since inception)
Inception Date: 17th November, 2017
Benchmark:Nifty 100 Index (TRI)
NAV as on 28th March 2018 (` per unit):Regular Direct
Growth 9.70 9.80Dividend 9.70 9.80
Monthly Average AUM:` 338.57 Crs.
AUM as on 31st March 2018:` 337.24 Crs.
Expense Ratio: (Weighted Average for the month)Regular : 3.2493% Direct : 0.6084%Expense ratio is inclusive of GST on management fees.
Load Structure:Entry Load : Not ApplicableExit Load : 1% for exit within 12 months from the date of allotment.
* Rounded off to the nearest two digits after the decimal point.
Industry Classification (for equity & equity related)
12.88%
10.20%
7.40%
6.57%
5.95%
5.45%
3.89%
2.87%
2.64%
2.54%
2.43%
2.03%
0.88%
0.00% 2.00% 4.00% 6.00% 8.00% 10.00% 12.00% 14.00%
Consumer Non Durables
Finance
Banks
Industrial Products
Auto
Petroleum Products
Construction Project
Power
Cement
Ferrous Metals
Pharmaceuticals
Auto Ancillaries
Industrial Capital Goods
Asset Profile
Equity and Equity Related
CBLO
Cash & Cash Receivables
65.73%
34.28%
-0.01%-10.00%
0.00%
10.00%
20.00%
30.00%
40.00%
50.00%
60.00%
70.00%
Product LabelThis product is suitable for investors who are seeking*: Riskometer
l Long term capital growthl Investment predominantly in large cap focused equity & equity related instruments of upto 30 companies
and balance in debt & money market instruments
Investors understand that their principal will be at Moderately High risk*Investors should consult their financial advisors if in doubt about whether the product is suitable for them.
Portfolio as on 31/03/2018Issuer Name % To Net
Assets*
EQUITY & EQUITY RELATED 65.73
HDFC Bank Ltd. 5.59
Hindustan Unilever Ltd. 3.96
Larsen & Toubro Ltd. 3.89
Housing Development Finance Corpn. Ltd. 3.79
ITC Ltd. 3.79
Reliance Industries Ltd. 3.40
Asian Paints Ltd. 3.32
Mahindra & Mahindra Ltd. 3.29
Bharat Forge Ltd. 3.11
Power Grid Corpn. of India Ltd. 2.87
TATA Motors Ltd. 2.67
Shree Cement Ltd. 2.64
Indiabulls Housing Finance Ltd. 2.57
Issuer Name % To Net Assets*
TATA Steel Ltd. 2.54
Cipla Ltd. 2.43
ICICI Prudential Life Insurance Co. Ltd. 2.31
Hindustan Petroleum Corpn. Ltd. 2.05
Motherson Sumi Systems Ltd. 2.03
GlaxoSmithKline Consumer Healthcare Ltd. 1.81
Yes Bank Ltd. 1.81
ISGEC Heavy Engineering Ltd. 1.74
Mahindra CIE Automotive Ltd. 1.72
Bajaj Finserv Ltd. 1.53
Honda Siel Power Products Ltd. 0.88
CBLO 34.28
Cash & Cash Receivables -0.01
TOTAL 100.00

12
IDBI Hybrid Equity Fund (IHEF)(An open-ended hybrid scheme investing pedominantly in equity and equity related instruments)
Portfolio as on 31/03/2018
Product LabelThis product is suitable for investors who
are seeking*:Riskometer
l Long term capital appreciation with income
l Investments in equity & equity related instruments as well as debt and money market instruments
Investors understand that their principal will be at Moderately High risk
*Investors should consult their financial advisors if in doubt about whether the product is suitable for them.
* Rounded off to the nearest two digits after the decimal point.Fixed Deposits placed for margin purpose for Derivative ExposureTotal Outstanding exposure in Derivative Instruments as on March 31, 2018: Rs. 1647.78 (Market Value in Lakhs)
Industry Classification (for equity & equity related)
12.49%
9.26%
6.51%
5.44%
5.27%
4.93%
3.44%
3.03%
2.91%
2.76%
2.74%
1.67%
1.54%
0.99%
0.65%
0.45%
0.42%
0.16%
0.00% 2.00% 4.00% 6.00% 8.00% 10.00% 12.00% 14.00%
Consumer Non Durables
Banks
Industrial Products
Auto
Chemicals
Finance
Auto Ancillaries
Non - Ferrous Metals
Cement
Construction Project
Power
Ferrous Metals
Media & Entertainment
Software
Pharmaceuticals
Textile Products
Pesticides
Fertilisers
Issuer / Security Name Rating % To Net Assets*
FIXED COUPON BONDS 10.35Bank of Baroda CRISIL AA+ 4.58LIC Housing Finance Ltd. CRISIL AAA 2.31Punjab National Bank BWR AA 2.30Fullerton India Credit Co. Ltd. CARE AAA 1.16EQUITY & EQUITY RELATED 64.67Godrej Consumer Products Ltd. N.A 3.88HDFC Bank Ltd. N.A 3.50Pidilite Industries Ltd. N.A 3.20Yes Bank Ltd. N.A 2.83Bharat Forge Ltd. N.A 2.44Nestle India Ltd. N.A 2.29TVS Motor Company Ltd. N.A 2.16Larsen & Toubro Ltd. N.A 2.13IndusInd Bank Ltd. N.A 2.09Aarti Industries Ltd. N.A 2.08Dewan Housing Finance Corpn. Ltd. N.A 1.95Hindustan Unilever Ltd. N.A 1.86ITC Ltd. N.A 1.78Hindalco Industries Ltd. N.A 1.74JSW Steel Ltd. N.A 1.67Hero MotoCorp Ltd. N.A 1.65Finolex Cables Ltd. N.A 1.41Godrej Industries Ltd. N.A 1.40Exide Industries Ltd. N.A 1.40Jain Irrigation Systems Ltd. N.A 1.36Eicher Motors Ltd. N.A 1.32Vedanta Ltd. N.A 1.29Kansai Nerolac Paints Ltd. N.A 1.28Sundram Fasteners Ltd. N.A 1.28Heidelbergcement India Ltd. N.A 1.03Reliance Infrastructure Ltd. N.A 0.99
Issuer / Security Name Rating % To Net Assets*
TATA Consultancy Services Ltd. N.A 0.99TI Financial Holdings Ltd. N.A 0.91CESC Ltd. N.A 0.90Birla Corporation Ltd. N.A 0.87JSW Energy Ltd. N.A 0.85IDFC Bank Ltd. N.A 0.84Inox Leisure Ltd. N.A 0.77Sun TV Network Ltd. N.A 0.77Aditya Birla Capital Ltd. N.A 0.76Shree Cements Ltd. N.A 0.71Timken India Ltd. N.A 0.71Indiabulls Housing Finance Ltd. N.A 0.67Aurobindo Pharma Ltd. N.A 0.65Housing Development Finance Corporation Ltd. N.A 0.64NCC Ltd. N.A 0.63Sintex Plastics Technology Ltd. N.A 0.60TVS Srichakra Ltd. N.A 0.45Raymond Ltd. N.A 0.45UPL Ltd. N.A 0.42Force Motors Ltd. N.A 0.32Tube Investment of India Ltd. N.A 0.31Century Textiles & Industries Ltd. N.A 0.29Gujarat State Fertilizers & Chemicals Ltd. N.A 0.16FIXED DEPOSITS 1.86HDFC Bank Ltd. N.A 1.86GOV'T SECURITIES 14.717.17 GOI 2028 SOV 10.516.79 GOI 2027 SOV 4.19CBLO 11.78Cash & Cash Receivables -3.36TOTAL 100.00
Asset Profile
10.35%
64.67%
1.86%
14.71%11.78%
-3.36%-10.00%
0.00%
10.00%
20.00%
30.00%
40.00%
50.00%
60.00%
70.00% Fixed Coupon Bond
Fixed Deposit
Equity & Equity Related
CBLO
Cash & Cash Receivables
Gov't Securities
Scheme FeaturesInvestment objective:The investment objective of the scheme would be to generate opportunities for capital appreciation along with income by investing in a diversified basket of equity and equity related instruments, debt and money market instruments. However, there can be no assurance that the investment objective of the scheme will be realized.
Fund Managers: Total Experience: V. Balasubramanian (Equity Portion)
Over 36 Years(Managing the Scheme since inception)
Mr. Raju Sharma (Debt Portion)
Over 25 Years (Managing the Scheme since 3rd May, 2017)
Inception Date: 24th October 2016
Benchmark:CRISIL Hybrid 35+65-Aggressive Index
NAV as on 28th March 2018 (` per unit):Regular Direct
Growth 11.7075 12.0335Dividend 11.1052 11.4415
Monthly Average AUM:` 430.51 Crs.
AUM as on 31st March 2018:` 430.65 Crs.
Expense Ratio: (Weighted Average for the month)Regular : 3.2105% Direct : 1.0415%Expense ratio is inclusive of GST on management fees.
Quantitative Measures:YTM : 7.48% Average Maturity : 4.73 Years Modified Duration : 3.38 Years Portfolio Turnover Ratio^^ : 1.84^^ Lower of Purchase or Sale for one year/average AUM for one year.
Load Structure:Entry Load : Not ApplicableExit Load : 1% for exit within 12 months from the date of allotment. (for Lumpsum & SIP) No load on exit after the aforementioned period.
Dividend History (Face Value: ` 1000/- Per Unit)
Record Date Individual / HUF (` Per Unit)
Others (` Per Unit)
Cum Dividend NAV** (in `)
Ex Dividend NAV (in `)
IDBI Hybrid Equity Fund - Monthly Dividend (Regular Plan)30th October, 2017 0.2000 0.2000 11.4708 11.283931st August, 2017 0.4000 0.4000 11.4882 11.1663IDBI Hybrid Equity Fund - Monthly Dividend (Direct Plan)30th October, 2017 0.2000 0.2000 11.6905 11.503831st August, 2017 0.4000 0.4000 11.6595 11.3395Past performance may or may not be sustained in the future. After the payment of dividend, the per unit NAV of the Dividend option of the Scheme will fall to the extent of the dividend payout and statutory levy, if any. All dividend distribution is subject to availability of distributable surplus on the record date and will be at the discretion of IDBI Asset Management Ltd. and IDBI MF Trustee Company Ltd. For complete dividend history including daily dividend history, please refer to our website.** NAV of the record date.

13
IDBI Equity Savings Fund (IESF)(An open-ended equity scheme investing in equity, arbitrage and debt)
Scheme FeaturesInvestment objective:The investment objective of the Scheme is to generate regular income by investing in Debt and money market instruments and using arbitrage and other derivative strate-gies. The Scheme also intends to generate long capital appreciation through unhedged exposure to equity and equity related instruments. However, there can be no assurance or guarantee that the investment objective of the scheme will be achieved.
Fund Manager: Total Experience:Mr. Raju Sharma (Debt Portion)
Over 25 Years (Managing the Scheme since 3rd May, 2017)
Mrs. Uma Venkatraman (Equity Portion)
Over 15 Years (Managing the Scheme since 5th September, 2017)
Inception Date: 7th March, 2011
Benchmark:40% of CRISIL Liquid Fund Index + 30% CRISIL Short term Bond Fund Index + 30% of Nifty 50 Index.
NAV as on 28th March 2018 (` per unit):Regular Direct
Growth 15.9322 16.5363Monthly Dividend 13.5656 12.1589Quarterly Dividend 12.6873 10.0077NAV: 0.0000 indicates that there is no investment under the option.
Monthly Average AUM: ` 18.42 Crs.
AUM as on 31st March 2018:` 20.57 Crs.
Expense Ratio: (Weighted Average for the month)Regular : 2.4051% Direct : 0.1800%Expense ratio is inclusive of GST on management fees.
Quantitative Measures:YTM : 7.70%Average Maturity : 1.18 YearsModified Duration : 0.93 YearsPortfolio Turnover Ratio^^ : 3.73^^ Lower of Purchase or Sale for one year/average AUM for one year.
Load Structure:Entry Load : Not ApplicableExit Load : for Lumpsum - 1% for exit (New/Additional Purchase/Switch-out/Transfer/SWP)
within 12 months from the date of allotment. for SIP - 1% for exit (New/Additional Purchase/Switch-out/Transfer/SWP)
within 12 months from the date of allotment of each installment.
Dividend History (Face Value: ` 10/- Per Unit)
Record Date Individual / HUF (` Per Unit)
Others (` Per Unit)
Cum Dividend NAV** (in `)
Ex Dividend NAV (in `)
IDBI Equity Savings Fund - Monthly Dividend (Regular Plan)26th December, 2013 0.0545 0.0522 10.2703 10.216625th November, 2013 0.0468 0.0448 10.2157 10.149325th July, 2013 0.0545 0.0522 10.2261 10.1763IDBI Equity Savings Fund - Monthly Dividend (Direct Plan)25th January, 2018 0.0087 0.0000 12.0910 12.044625th October, 2017 0.0121 0.0000 12.1160 12.126825th September, 2017 0.0023 0.0000 12.0903 12.0823IDBI Equity Savings Fund - Quarterly Dividend (Regular Plan)20th April, 2017 0.2516 0.2331 12.7928 12.41606th July, 2015 0.1150 0.1065 11.7568 11.583727th March, 2015 0.2385 0.2212 12.0213 11.7359IDBI Equity Savings Fund - Quarterly Dividend (Direct Plan)29th September, 2014 0.1948 0.1866 11.5885 11.333017th April, 2014 0.0935 0.0896 10.8922 10.77533rd April, 2013 0.1839 0.1567 10.4314 10.2030Past performance may or may not be sustained in the future. After the payment of dividend, the per unit NAV of the Dividend option of the Scheme will fall to the extent of the dividend payout and statutory levy, if any. All dividend distribution is subject to availability of distributable surplus on the record date and will be at the discretion of IDBI Asset Management Ltd. and IDBI MF Trustee Company Ltd. For complete dividend history including daily dividend history, please refer to our website.** NAV of the record date.
Portfolio as on 31/03/2018
* Rounded off to the nearest two digits after the decimal point.
Industry Classification (for equity & equity related)
3.18%
2.00%
1.94%
1.90%
1.46%
1.40%
1.36%
1.01%
0.55%
0.53%
0.00% 0.50% 1.00% 1.50% 2.00% 2.50% 3.00% 3.50%
Banks
Non - Ferrous Metals
Finance
Consumer Non Durables
Auto
Industrial Capital Goods
Construction Project
Cement
Petroleum Products
Gas
Asset Profile
Equity & Equity Related15.33%
Fixed Coupon Bonds36.08%CBLO
45.78%
Cash & Cash Receivables2.81%
Rating ProfileAA
20.23%
CBLO and Cash &Cash Receivables
48.59%
Equity and Equity Related15.33%
AAA0.42%
AA+10.54%
A+4.89%
Product LabelThis product is suitable for investors who are seeking*: Riskometer
l Regular income & Capital appreciation over Medium to Long term
l Investment in equity and equity related Instruments including equity derivatives, arbitrage and debt and money market instruments
Investors understand that their principal will be at Moderately High risk
*Investors should consult their financial advisors if in doubt about whether the product is suitable for them.
Issuer / Security Name Rating % To Net Assets*
FIXED COUPON BONDS 36.08Piramal Enterprises Ltd. [ICRA]AA 11.16Bank of Baroda CRISIL AA+ 10.54JK Cement Ltd. BWR AA 9.06Ujjivan Financial Services Ltd. [ICRA]A+ 4.89NTPC Ltd. CRISIL AAA 0.42EQUITY & EQUITY RELATED 15.33HDFC Bank Ltd. N.A 1.49Larsen & Toubro Ltd. N.A 1.36IndusInd Bank Ltd. N.A 1.33Housing Development Finance Corpn. Ltd. N.A 1.24Hero MotoCorp Ltd. N.A 1.10Vedanta Ltd. N.A 1.05Shree Cement Ltd. N.A 1.01
Issuer / Security Name Rating % To Net Assets*
Hindustan Zinc Ltd. N.A 0.96ABB India Ltd. N.A 0.85Procter & Gamble Hygiene &Healthcare Ltd. N.A 0.81Shriram Transport Finance Co. Ltd. N.A 0.70Hindustan Unilever Ltd. N.A 0.65Indian Oil Corpn. Ltd. N.A 0.55Bharat Electronics Ltd. N.A 0.54GAIL (India) Ltd. N.A 0.53Asian Paints Ltd. N.A 0.44State Bank of India N.A 0.36Mahindra & Mahindra Ltd. N.A 0.36CBLO 45.78Cash & Cash Receivables 2.81TOTAL 100.00

Snapshot of IDBI Mutual Fund SchemesIEAF IF30EF ISF IIT100EF INIF INJIF IHEF IESF ILQF IDBF IGF IUSTF ISTBF ICRF IDEF IMF IGFOF IDBIGOLD
Benchmark S&P BSE 200 Index (TRI)
Nifty 100 Index (TRI)
Nifty Smallcap 250 Index (TRI)
Nifty 100 Index (TRI)
Nifty 50 Index (TRI)
Nifty Next 50 Index (TRI)
CRISIL Hybrid 35+65-Aggressive Index
40% of CRISIL Liquid Fund Index + 30% CRISIL Short term Bond Fund Index + 30% of Nifty 50 Index
CRISIL Liquid Fund Index
CRISIL Composite Bond Fund Index
CRISIL Gilt Index
CRISIL Liquid Fund Index
CRISIL Short Term Bond Fund Index
CRISIL Short Term Bond Fund Index
S&P BSE 500 Index (TRI)
Nifty Midcap 100 - TRI
Domestic price of Gold
Domestic price of Physical Gold
Fund Manager Mr. V. Balasubramanian Mrs. Uma Venkatraman (w.e.f 5th September 2017)
Mr. V. Balasubramanian (Equity Portion)
Mr. Raju Sharma (Debt portion) w.e.f 3rd May 2017
Mrs. Uma Venkatraman (Equity portion) w.e.f 5th September 2017
Mr. Raju Sharma (Debt portion) w.e.f 3rd May 2017
Mr. Raju Sharma (w.e.f. 3rd May, 2017) Mr. Bhupesh Kalyani Mr. Ashish Mishra (w.e.f 5th September 2017)
Minimum / Maximum Application Amount
Minimum Application Amount (Lumpsum) Maximum Application Amount (Lumpsum)New Purchase – Rs. 5000/- and in multiples of Re. 1/- thereafterFor IEAF – Rs. 500/- and in multiples of Rs. 500/- thereafter
New & Additional Purchase: No limit
For IDBI Gold : Authorized participants & Large investors - In creation unit lot of 1000 units and multiples of 1000 units thereof or in equivalent amount in cash.
Minimum Additional Investment
Rs. 1000/- and in multiples of Re. 1/- thereafterFor IEAF – Rs. 500/- and in multiples of Rs. 500/- thereafter -
SIP • Rs. 500 per month for a minimum period of 12 months.
NA• Rs. 1000 per month for a minimum period of 6 months.• Rs. 1500 per quarter for a minimum period of 4 quarters.• Only for IUSTF: Rs. 500 per day for a minimum of 30 installments continuously for all business days.Investments above minimum amount mentioned shall be made in multiples of Re.1/- for all SIP, except for IEAF it shall be made in multiples of Rs. 500/-. In case of SIP transactions, statutory lock-in period of 3 years is applicable to every installment made to IEAF.
SWP & STP Minimum balance in the Scheme should be Rs.25,000/- at the time of enrollment. SWP/STP from IEAF to any other Schemes of IDBI Mutual Fund is available only after completion of lock-in period of 3 years.STP:Sub-options for STP Eligible dates for effect Minimum amount per transfer*Daily (only offered under ILIQF, IUSTF and ISTBF) All Business days Rs. 200/-Weekly 1st Business day of the week Rs. 1,000/-Monthly 1st, 5th, 10th, 15th, 20th and 25th of the month Rs. 1,000/-Quarterly 1st, 5th, 10th, 15th, 20th and 25th of the each quarter Rs. 2,500/-
Daily STP amount per transfer Minimum term / duration applicableRs. 200/- to less than Rs. 500/- 30 Business daysRs. 500/- to less than Rs. 1,000/- 12 Business daysRs. 1,000/- and above 6 Business daysWeekly & Monthly STP: 12 Installments; Quarterly STP: 4 Installments
(*Multiples of Re.1/- thereafter except under IEAF where STP will be made at a minimum of Rs.500/- and in multiples of Rs.500/- thereafter.)SWP: Minimum amount for each withdrawal is Rs.1000/- and in multiples of Re.1/- thereafter for a minimum period of 6 months. Withdrawal on 25th of each month or, if 25th is a holiday, then the next effective business day.
NA
Full Form of SIP, SWP & STP is “Systematic Investment Plan”, “Systematic Withdrawal Plan” & “Systematic Transfer Plan”
Plans, options and sub-optionsNo Scheme Plan* Option Sub-option / Frequency of
DividendMode of dividend payment
1 IEAF Regular & Direct Dividend NA Payout/ SweepGrowth NA NA
2 IIT100EF Regular & Direct Dividend NA Reinvestment / Payout/ SweepGrowth NA NA
3 IDEF Regular & Direct Dividend NA Reinvestment / Payout/ SweepGrowth NA NA
4 INIF Regular & Direct Dividend NA Reinvestment / Payout/ SweepGrowth NA NA
5 INJIF Regular & Direct Dividend NA Reinvestment / Payout/ SweepGrowth NA NA
6 IMF Regular & Direct Dividend NA Reinvestment / Payout/ SweepGrowth NA NA
7 ISF Regular & Direct Dividend NA Reinvestment / Payout/ SweepGrowth NA NA
8 IHEF Regular & Direct Dividend NA Reinvestment / Payout/ SweepGrowth NA NA
9 IF30EF Regular & Direct Dividend NA Reinvestment / Payout/ SweepGrowth NA NA
10 IESF Regular & Direct Dividend Monthly/ Quarterly Reinvestment / Payout/ SweepGrowth / Growth with Regular Cash Flow Plan (RCFP) NA NA
11 ILIQF Regular & Direct Dividend Daily/ Weekly/ Monthly Reinvestment / Payout/ SweepGrowth NA NA
12 IUSTF Regular & Direct Dividend Daily/ Weekly/ Monthly Reinvestment / Payout/ SweepGrowth NA NA
Statutory Details: IDBI Mutual Fund has been set up as a trust sponsored by IDBI Bank Ltd. with IDBI MF Trustee Company Ltd. as the Trustee (Trustee under the Indian Trusts Act, 1882) and with IDBI Asset Management Ltd. as the Investment Manager. Mutual fund investments are subject to market risks, read all scheme related documents carefully.
15
No Scheme Plan* Option Sub-option / Frequency of Dividend
Mode of dividend payment
13 ICRF Regular & Direct Dividend Quarterly/Annually Reinvestment / Payout/ SweepGrowth NA NA
14 ISTBF Regular & Direct Dividend Weekly/ Monthly Reinvestment / Payout/ SweepGrowth NA NA
15 IDBF Regular & Direct Dividend Quarterly/Annually Reinvestment / Payout/ SweepGrowth NA NA
16 IGF Regular & Direct Dividend Quarterly/Annually Reinvestment / Payout/ SweepGrowth NA NA
17 IGFOF Regular & Direct Growth NA NA*All plans other than Direct plan will be treated as Regular Plan. For all schemes, Sweep facility is allowed only if dividend amount is Rs.1000/- & above.
The Mutual Fund is not assuring any dividend nor is it assuring that it will make any dividend distributions. All dividend distributions are subject to the availability of distributable surplus and would depend on the performance of the scheme(s) and will be at the discretion of the IDBIAMC and IDBIMF Trustee Company.
Load Structure (for lumpsum & SIP)
Entry Load (For normal transactions / Switch-in and SIP) – Not applicableExit Load (Redemption / Switch-out/ Transfer/ SWP):For INIF, INJIF, ILIQF, IUSTF, ISTBF & IDBIGOLD : NilFor IDBF, IHEF, IF30EF, IESF, IIT100EF, IDEF, IMF, ISF & IGFOF- 1% for exit within 12 months from the date of allotment.For IEAF: Nil. (Statutory lock-in of 3 years).For IDBI Gilt Fund: 0.50% for exit within 30 days from the date of allotment.For ICRF: 2% for exit up to & including 18 months from the date of allotment.The exit load will be applicable for both normal transactions and SIP transactions. In case of SIP, the date of allotment for each installment for subscription will be reckoned for charging exit load on redemption.
14

16
Issuer Name Rating % To Net Assets*
CERTIFICATE OF DEPOSITS 40.88HDFC Bank Ltd. IND A1+ 8.06ICICI Bank Ltd. CARE A1+ 7.38IDFC Bank Ltd. [ICRA]A1+ 6.05Axis Bank Ltd. CRISIL A1+ 5.77Vijaya Bank CARE A1+ 5.37IndusInd Bank Ltd. CRISIL A1+ 4.96Ujjivan Small Finance Bank Ltd. CRISIL A1+ 3.29COMMERCIAL PAPERS 59.06Power Finance Corpn. Ltd. CRISIL A1+ 9.72PNB Housing Finance Ltd. CRISIL A1+ 7.94IL&FS Financial Services Ltd. [ICRA]A1+ 6.69NTPC Ltd. [ICRA]A1+ 5.37National Bank for Agri & Rural Development CRISIL A1+ 5.11Capital First Ltd. [ICRA]A1+ 5.09Smartchem Technologies Ltd. [ICRA]A1+ 3.34Housing Development Finance Corpn. Ltd. CRISIL A1+ 2.71
Issuer Name Rating % To Net Assets*
Housing Development Finance Corpn. Ltd. CARE A1+ 2.68JK Lakshmi Cement Ltd. CRISIL A1+ 2.67Fiat India Automobiles Pvt. Ltd. [ICRA]A1+ 2.67IL & FS Securities Services Ltd. [ICRA]A1+ 2.65Housing & Urban Devlopment Corpn. Ltd. IND A1+ 1.34Fedbank Financial Services Ltd. CRISIL A1+ 1.07FIXED DEPOSITS 8.14Bandhan Bank Ltd. N.A 5.42The Lakshmi Vilas Bank Ltd. N.A 2.71DEBENTURES 0.68
Aadhar Housing Finance Ltd.CARE AA+
(SO) 0.68T-BILLS 1.35Reserve Bank of India SOV 1.35Cash & Cash Receivables -10.11TOTAL 100.00
IDBI Liquid Fund (ILIQF)(An open-ended liquid scheme)
Portfolio as on 31/03/2018
* Rounded off to the nearest two digits after the decimal point.
Asset Profile
Certificate of Deposits
Fixed Deposits
Commercial Papers
Cash & Cash Receivables
T-Bills
40.88%
59.06%
8.14%0.68% 1.35%
-10.11%-20.00%
-10.00%
0.00%
10.00%
20.00%
30.00%
40.00%
50.00%
60.00%
70.00%
Debentures
Rating Profile
99.94%
8.14%0.68% 1.35%
-10.11%-20.00%
0.00%
20.00%
40.00%
60.00%
80.00%
100.00%
120.00% A1+
Fixed Deposits
SOV
AA+(SO)
Cash & Cash Receivables
Product LabelThis product is suitable for investors who are seeking*: Riskometerl High level of liquidity along with regular income for
short terml Investments in Debt / Money Market Instruments
with maturity / residual maturity up to 91 days
Investors understand that their principal will be at Low risk
*Investors should consult their financial advisors if in doubt about whether the product is suitable for them.
Scheme Features
Investment objective:The investment objective of the Scheme will be to provide investors with high level of liquidity along with regular income for their investment. The Scheme will endeavour to achieve this objective through an allocation of the investment corpus in a low risk portfolio of money market and debt instruments with maturity of up to 91 days. However, there can be no assurance that the investment objective of the Scheme will be realized.
Fund Manager: Total Experience: Over 25 YearsMr. Raju Sharma (Managing the Scheme since 3rd May, 2017)
Inception Date: 9th July, 2010
Benchmark:CRISIL Liquid Fund Index
NAV as on 31st March 2018 (` per unit):Regular Direct
Growth 1850.5238 1860.4824Daily Dividend 1005.2683 1002.3548Weekly Dividend 1024.3691 1004.1271Monthly Dividend 1004.7782 1003.2328Bonus^ 1387.8969 1395.3597^ Bonus option in this scheme has been discontinued from 15th July, 2015.
Monthly Average AUM: ` 7,075.34 Crs.
AUM as on 31st March 2018:` 3,687.49 Crs.
Expense Ratio: (Weighted Average for the month)Regular : 0.2461% Direct : 0.1285%Expense ratio is inclusive of GST on management fees.
Quantitative Measures:YTM : 7.14%Average Maturity : 54 DaysModified Duration : 54 Days
Load Structure:Entry Load : Not ApplicableExit Load (for Lumpsum & SIP) : Nil
Dividend History (Face Value: ` 1000/- Per Unit)
Record Date Individual / HUF (` Per Unit)
Others (` Per Unit)
Cum Dividend NAV** (in `)
Ex Dividend NAV (in `)
IDBI Liquid Fund - Monthly Dividend (Regular Plan)25th March, 2018 4.1299 3.8263 1,009.1608 1,003.639425th February, 2018 4.1524 3.8578 1009.2000 1003.639424th January, 2018 3.8438 3.5627 1,008.6614 1,003.5289
IDBI Liquid Fund - Monthly Dividend (Direct Plan)25th March, 2018 4.1897 3.8817 1,007.6811 1,002.079925th February, 2018 4.3171 0.0000 1,007.8648 1,002.079924th January, 2018 3.8975 0.0000 1,007.2854 1,002.0799
Past performance may or may not be sustained in the future. After the payment of dividend, the per unit NAV of the Dividend option of the Scheme will fall to the extent of the dividend payout and statutory levy, if any. All dividend distribution is subject to availability of distributable surplus on the record date and will be at the discretion of IDBI Asset Management Ltd. and IDBI MF Trustee Company Ltd. For complete dividend history including daily dividend history, please refer to our website.** NAV of the record date.

17
Issuer Name Rating % To Net Assets*
CERTIFICATE OF DEPOSITS 13.94IDFC Bank Ltd. [ICRA]A1+ 8.72IndusInd Bank Ltd. CRISIL A1+ 3.48Ujjivan Small Finance Bank Ltd. CRISIL A1+ 1.75COMMERCIAL PAPERS 30.74Cox & Kings Ltd. BWR A1+ 13.81PNB Housing Finance Ltd. CRISIL A1+ 8.19Power Finance Corpon. Ltd. CRISIL A1+ 5.25Shriram Transport Finance Co. Ltd. IND A1+ 1.74Capital First Ltd. [ICRA]A1+ 1.74FIXED COUPON BONDS 36.74JK Cement Ltd. BWR AA 7.15
Issuer Name Rating % To Net Assets*
Aadhar Housing Finance Ltd. CARE AA+ (SO) 7.04Punjab National Bank BWR AA 4.18Aditya Birla Finance Ltd. [ICRA]AA+ 3.54Power Finance Corpn. Ltd. CRISIL AAA 3.53Cholamandalam Investment & Finance Co. Ltd. [ICRA]AA 3.52ECL Finance Ltd. [ICRA]AA 3.21Piramal Enterprises Ltd. [ICRA]AA 2.82Adani Transmission Ltd. IND AA+ 1.76CBLO 16.36Cash & Cash Receivables 2.22TOTAL 100.00
IDBI Ultra Short Term Fund (IUSTF)(An open ended ultra short term debt scheme investing in instruments such that the Macaulay duration of the portfolio is between 3 months to 6 months.#)
Portfolio as on 31/03/2018
* Rounded off to the nearest two digits after the decimal point.
Asset Profile
Certificate of Deposits13.94%
Fixed Coupon Bonds36.74%
CBLO16.36%
Cash & Cash Rececivables2.22%
Commercial Papers30.74%
Rating Profile
CBLO and Cash &Cash Receivables
18.58%
AA+5.30%
A1+44.68%
AA20.88%
AAA3.53%
AA+ (SO)7.04%
Product LabelThis product is suitable for investors who are seeking*: Riskometer
l Regular income for short terml Investments in Debt/Money market instruments
with relatively lower interest rate risk, such that the Macaulay duration of the portfolio is maintained between 3 months to 6 months
Investors understand that their principal will be at Moderately Low risk
*Investors should consult their financial advisors if in doubt about whether the product is suitable for them.
Scheme Features
Investment objective:The objective of the Scheme will be to provide investors with regular income for their investment by investing in debt and money market instruments with relatively lower interest rate risk, such that the Macaulay duration of the portfolio is maintained between 3 months to 6 months. However, there can be no assurance that the investment objective of the Scheme will be realized.
Fund Manager: Total Experience: Over 15 YearsMr. Bhupesh Kalyani (Managing the Scheme since 1st February, 2017)
Inception Date: 3rd September, 2010
Benchmark:CRISIL Liquid Fund Index
NAV as on 28th March 2018 (` per unit):Regular Direct
Growth 1818.2842 1874.8545Daily Dividend 1017.0054 1031.1905Weekly Dividend 1057.4963 1058.6945Monthly Dividend 1072.7947 1388.3995Bonus^ 1818.3227 1873.9361
^Bonus option in this scheme has been discontinued from 15th July, 2015.
Monthly Average AUM:` 411.27 Crs.
AUM as on 31st March 2018:` 284.24 Crs.
Expense Ratio: (Weighted Average for the month)Regular : 0.9373% Direct : 0.2882%Expense ratio is inclusive of GST on management fees.
Quantitative Measures:YTM : 7.65%Average Maturity : 251 DaysModified Duration : 214 Days
Load Structure:Entry Load : Not ApplicableExit Load (for Lumpsum & SIP) : Nil
Dividend History (Face Value: ` 1000/- Per Unit)
Record Date Individual / HUF (` Per Unit)
Others (` Per Unit)
Cum Dividend NAV** (in `)
Ex Dividend NAV (in `)
IDBI Ultra Short Term Fund - Monthly Dividend (Regular Plan)26th March, 2018 2.2727 2.1056 1,074.4653 1,071.893226th February, 2018 1.3999 1.2970 1069.1048 1067.473525th January, 2018 1.5026 1.3921 1,066.7610 1,065.2284
IDBI Ultra Short Term Fund - Monthly Dividend (Direct Plan)26th March, 2018 3.1449 2.9137 1,390.7949 1,387.209226th February, 2018 2.0414 0.0000 1383.4906 1381.083325th January, 2018 2.3252 0.0000 1,380.2016 1,377.8368
Past performance may or may not be sustained in the future. After the payment of dividend, the per unit NAV of the Dividend option of the Scheme will fall to the extent of the dividend payout and statutory levy, if any. All dividend distribution is subject to availability of distributable surplus on the record date and will be at the discretion of IDBI Asset Management Ltd. and IDBI MF Trustee Company Ltd. For complete dividend history including daily dividend history, please refer to our website.** NAV of the record date.# please refer to the Scheme Information Document (SID) on which the concept of Macaulay’s duration has been explained.

18
IDBI Short Term Bond Fund (ISTBF)(An open-ended short term debt scheme investing in instruments such that the Macaulay duration of the portfolio is between 1 year to 3 years.#)
* Rounded off to the nearest two digits after the decimal point.
Asset Profile
10.58%
80.59%
12.28%
-3.44%-10.00%
0.00%
10.00%
20.00%
30.00%
40.00%
50.00%
60.00%
70.00%
80.00%
90.00% Certificate of Deposits
CBLO
Fixed Coupon Bonds
Cash & Cash Receivables
Rating Profile
CBLO and Cash &Cash Receivables
8.84%
AA32.91%
A1+10.58%
AA+12.24%
AAA35.44%
Product LabelThis product is suitable for investors who are seeking*: Riskometer
l Regular income for short terml Investments in Debt/Money market instruments
such that the Macaulay duration of the portfolio is maintained between 1 year to 3 years
Investors understand that their principal will be at Moderately Low risk
*Investors should consult their financial advisors if in doubt about whether the product is suitable for them.
Scheme Features
Investment objective:The investment objective of the Scheme is to provide investors with regular income by investing in debt and money market instruments, such that the Macaulay duration of the portfolio is maintained between 1 year to 3 years. However, there can be no assurance that the investment objective of the Scheme will be realized.
Fund Manager: Total Experience: Over 15 YearsMr. Bhupesh Kalyani (Managing the Scheme since 1st February, 2017)
Inception Date: 23rd March, 2011
Benchmark:CRISIL Short Term Bond Fund Index
NAV as on 28th March 2018 (` per unit):Regular Direct
Growth 17.3045 18.0986Weekly Dividend 11.2958 12.1931Monthly Dividend 11.7227 14.7428
Monthly Average AUM: ` 65.81 Crs.
AUM as on 31st March 2018:` 65.60 Crs.
Expense Ratio: (Weighted Average for the month)Regular : 1.3453% Direct : 0.1062%Expense ratio is inclusive of GST on management fees.
Quantitative Measures:YTM : 8.00%Average Maturity : 1.21 YearsModified Duration : 1.03 Years
Load Structure:Entry Load : Not ApplicableExit Load (for Lumpsum & SIP) : Nil
Dividend History (Face Value: ` 10/- Per Unit)
Record Date Individual / HUF (` Per Unit)
Others (` Per Unit)
Cum Dividend NAV** (in `)
Ex Dividend NAV (in `)
IDBI Short Term Bond Fund - Monthly Dividend (Regular Plan)26th March, 2018 0.0245 0.0227 11.7301 11.711926th February, 2018 0.0160 0.0149 11.6792 11.657225th January, 2018 0.0135 0.0125 11.6471 11.6348
IDBI Short Term Bond Fund - Monthly Dividend (Direct Plan)26th March, 2018 0.0349 0.0324 14.7568 14.728825th June, 2014 0.0443 0.0424 10.9455 10.894526th May, 2014 0.0748 0.0716 10.9656 10.8736
Past performance may or may not be sustained in the future. After the payment of dividend, the per unit NAV of the Dividend option of the Scheme will fall to the extent of the dividend payout and statutory levy, if any. All dividend distribution is subject to availability of distributable surplus on the record date and will be at the discretion of IDBI Asset Management Ltd. and IDBI MF Trustee Company Ltd. For complete dividend history including daily dividend history, please refer to our website.** NAV of the record date.# please refer to the Scheme Information Document (SID) on which the concept of Macaulay’s duration has been explained.
Portfolio as on 31/03/2018Issuer Name Rating % To Net Assets*
CERTIFICATE OF DEPOSITS 10.58Ujjivan Small Finance Bank Ltd. CRISIL A1+ 10.58FIXED COUPON BONDS 80.59Punjab National Bank BWR AA 9.05JK Cement Ltd. BWR AA 8.65Reliance Gas Transportation Infra Ltd. CRISIL AAA 7.77Export-Import Bank of India CRISIL AAA 7.72Power Finance Corpn. Ltd. CRISIL AAA 7.69Dewan Housing Finance Corpn. Ltd. BWR AAA 7.66TATA Capital Financial Services Ltd. CRISIL AA+ 7.66Piramal Enterprises Ltd. [ICRA]AA 7.61Cholamandalam Investment & Fin Co. Ltd. [ICRA]AA 7.59LIC Housing Finance Ltd. CRISIL AAA 4.60Adani Transmission Ltd. IND AA+ 4.58CBLO 12.28Cash & Cash Receivables -3.44TOTAL 100.00
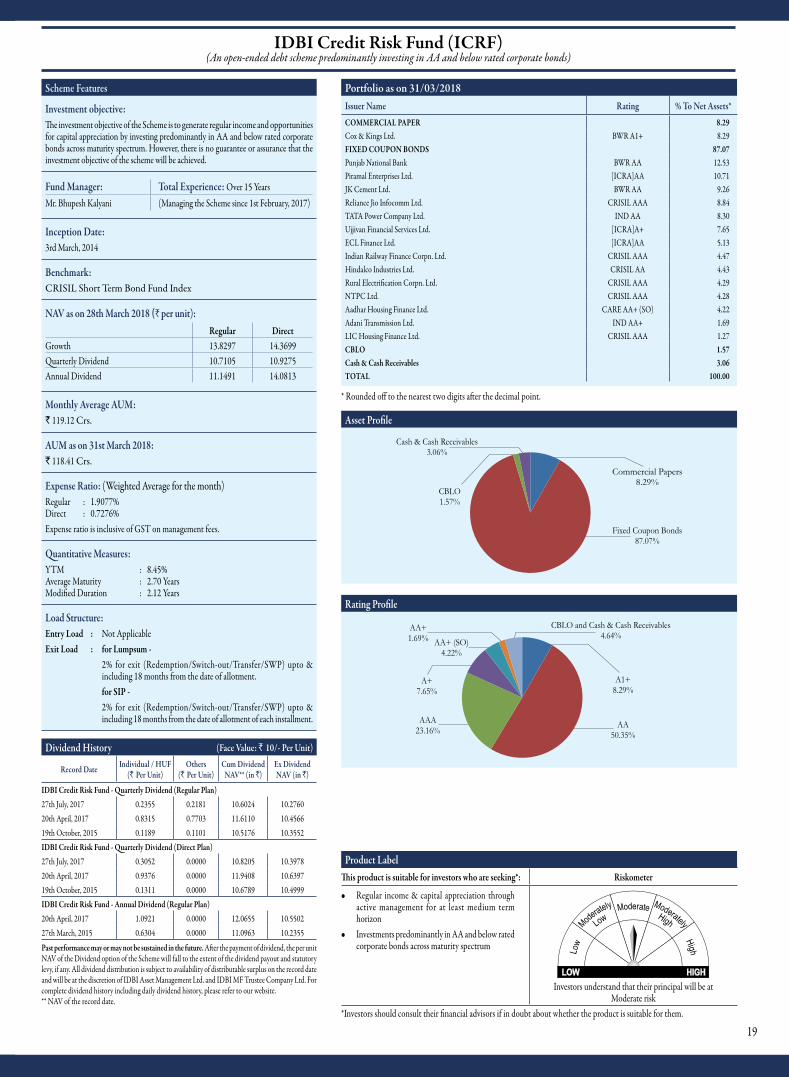
19
IDBI Credit Risk Fund (ICRF)(An open-ended debt scheme predominantly investing in AA and below rated corporate bonds)
Portfolio as on 31/03/2018
* Rounded off to the nearest two digits after the decimal point.
Asset Profile
Fixed Coupon Bonds87.07%
CBLO1.57%
Cash & Cash Receivables3.06%
Commercial Papers8.29%
Rating Profile
A1+8.29%
AA50.35%
AA+1.69%
AAA23.16%
A+7.65%
CBLO and Cash & Cash Receivables4.64%
AA+ (SO)4.22%
Product LabelThis product is suitable for investors who are seeking*: Riskometer
l Regular income & capital appreciation through active management for at least medium term horizon
l Investments predominantly in AA and below rated corporate bonds across maturity spectrum
Investors understand that their principal will be at Moderate risk
*Investors should consult their financial advisors if in doubt about whether the product is suitable for them.
Scheme Features
Investment objective:The investment objective of the Scheme is to generate regular income and opportunities for capital appreciation by investing predominantly in AA and below rated corporate bonds across maturity spectrum. However, there is no guarantee or assurance that the investment objective of the scheme will be achieved.
Fund Manager: Total Experience: Over 15 YearsMr. Bhupesh Kalyani (Managing the Scheme since 1st February, 2017)
Inception Date: 3rd March, 2014
Benchmark:CRISIL Short Term Bond Fund Index
NAV as on 28th March 2018 (` per unit):Regular Direct
Growth 13.8297 14.3699Quarterly Dividend 10.7105 10.9275Annual Dividend 11.1491 14.0813
Monthly Average AUM: ` 119.12 Crs.
AUM as on 31st March 2018:` 118.41 Crs.
Expense Ratio: (Weighted Average for the month)Regular : 1.9077% Direct : 0.7276%Expense ratio is inclusive of GST on management fees.
Quantitative Measures:YTM : 8.45%Average Maturity : 2.70 YearsModified Duration : 2.12 Years
Load Structure:Entry Load : Not ApplicableExit Load : for Lumpsum - 2% for exit (Redemption/Switch-out/Transfer/SWP) upto &
including 18 months from the date of allotment. for SIP - 2% for exit (Redemption/Switch-out/Transfer/SWP) upto &
including 18 months from the date of allotment of each installment.
Dividend History (Face Value: ` 10/- Per Unit)
Record Date Individual / HUF (` Per Unit)
Others (` Per Unit)
Cum Dividend NAV** (in `)
Ex Dividend NAV (in `)
IDBI Credit Risk Fund - Quarterly Dividend (Regular Plan)27th July, 2017 0.2355 0.2181 10.6024 10.276020th April, 2017 0.8315 0.7703 11.6110 10.456619th October, 2015 0.1189 0.1101 10.5176 10.3552IDBI Credit Risk Fund - Quarterly Dividend (Direct Plan)27th July, 2017 0.3052 0.0000 10.8205 10.397820th April, 2017 0.9376 0.0000 11.9408 10.639719th October, 2015 0.1311 0.0000 10.6789 10.4999IDBI Credit Risk Fund - Annual Dividend (Regular Plan)20th April, 2017 1.0921 0.0000 12.0655 10.550227th March, 2015 0.6304 0.0000 11.0963 10.2355
Past performance may or may not be sustained in the future. After the payment of dividend, the per unit NAV of the Dividend option of the Scheme will fall to the extent of the dividend payout and statutory levy, if any. All dividend distribution is subject to availability of distributable surplus on the record date and will be at the discretion of IDBI Asset Management Ltd. and IDBI MF Trustee Company Ltd. For complete dividend history including daily dividend history, please refer to our website.** NAV of the record date.
Issuer Name Rating % To Net Assets*COMMERCIAL PAPER 8.29Cox & Kings Ltd. BWR A1+ 8.29FIXED COUPON BONDS 87.07Punjab National Bank BWR AA 12.53Piramal Enterprises Ltd. [ICRA]AA 10.71JK Cement Ltd. BWR AA 9.26Reliance Jio Infocomm Ltd. CRISIL AAA 8.84TATA Power Company Ltd. IND AA 8.30Ujjivan Financial Services Ltd. [ICRA]A+ 7.65ECL Finance Ltd. [ICRA]AA 5.13Indian Railway Finance Corpn. Ltd. CRISIL AAA 4.47Hindalco Industries Ltd. CRISIL AA 4.43Rural Electrification Corpn. Ltd. CRISIL AAA 4.29NTPC Ltd. CRISIL AAA 4.28Aadhar Housing Finance Ltd. CARE AA+ (SO) 4.22Adani Transmission Ltd. IND AA+ 1.69LIC Housing Finance Ltd. CRISIL AAA 1.27CBLO 1.57Cash & Cash Receivables 3.06TOTAL 100.00

20
IDBI Dynamic Bond Fund (IDBF)(An open-ended dynamic debt scheme investing across duration)
Portfolio as on 31/03/2018
* Rounded off to the nearest two digits after the decimal point.
Asset Profile
Fixed Coupon Bond40.65%
CBLO8.41%
Cash & Cash Receivables5.90%
Gov’t Securities45.04%
Rating Profile
AA+12.44%
SOV45.04%
CBLO and Cash &Cash
14.31%Receivables
AA25.95%
AAA2.26%
Product LabelThis product is suitable for investors who are seeking*: Riskometer
l Generate income along with attendant liquidity through active management of portfolio with at least medium term horizon
l Investments in Debt (including Government Securities) / Money Market Instruments
Investors understand that their principal will be at Moderate risk*Investors should consult their financial advisors if in doubt about whether the product is suitable for them.
Scheme Features
Investment objective:The objective of the scheme is to generate regular income while maintaining liquidity through active management of a portfolio comprising of debt and money market instruments.
Fund Manager: Total Experience: Over 25 YearsMr. Raju Sharma (Managing the Scheme since 3rd May, 2017)
Inception Date: 21st February 2012
Benchmark:CRISIL Composite Bond Fund Index
NAV as on 28th March 2018 (` per unit):Regular Direct
Growth 14.2468 14.8047Quarterly Dividend 10.3570 12.9711Annual Dividend 10.4354 12.0596
Monthly Average AUM: ` 22.28 Crs.
AUM as on 31st March 2018:` 22.20 Crs.
Expense Ratio: (Weighted Average for the month)Regular : 1.7987% Direct : 0.4416%Expense ratio is inclusive of GST on management fees.
Quantitative Measures:YTM : 8.13%Average Maturity : 7.11 YearsModified Duration : 4.74 Years
Load Structure:Entry Load : Not ApplicableExit Load : for Lumpsum - 1% for exit (Redemption/Switch-out/Transfer/SWP) on or before
12 months from the date of allotment. For SIP - 1% for exit (Redemption/Switch-out/Transfer/SWP) on or before
12 months from the date of allotment of each installment.
Dividend History (Face Value: ` 10/- Per Unit)
Record Date Individual / HUF (` Per Unit)
Others (` Per Unit)
Cum Dividend NAV** (in `)
Ex Dividend NAV (in `)
IDBI Dynamic Bond Fund - Quarterly Dividend (Regular Plan)27th July, 2017 0.1961 0.1817 10.7876 10.501220th April, 2017 0.7980 0.7394 11.7089 10.588619th October, 2015 0.0585 0.0542 10.7392 10.6605
IDBI Dynamic Bond Fund - Quarterly Dividend (Direct Plan)29th September, 2014 0.3507 0.3358 10.7090 10.244517th April, 2014 0.3896 0.3732 10.7673 10.2862
IDBI Dynamic Bond Fund - Annual Dividend (Regular Plan)20th April, 2017 0.8926 0.8270 11.6510 10.399927th March, 2015 0.7992 0.7412 11.3590 10.278217th April, 2014 0.1403 0.1343 10.3119 10.1496
IDBI Dynamic Bond Fund - Annual Dividend (Direct Plan)27th March, 2015 0.8203 0.7607 11.4143 10.305117th April, 2014 0.1636 0.1567 10.3474 10.1555
Past performance may or may not be sustained in the future. After the payment of dividend, the per unit NAV of the Dividend option of the Scheme will fall to the extent of the dividend payout and statutory levy, if any. All dividend distribution is subject to availability of distributable surplus on the record date and will be at the discretion of IDBI Asset Management Ltd. and IDBI MF Trustee Company Ltd. For complete dividend history including daily dividend history, please refer to our website.** NAV of the record date.
Issuer Name Rating % To Net Assets*
FIXED COUPON BOND 40.65Bank of Baroda CRISIL AA+ 12.44Piramal Enterprises Ltd. [ICRA]AA 9.00Punjab National Bank BWR AA 8.92JK Cement Ltd. BWR AA 8.04LIC Housing Finance Ltd. CRISIL AAA 2.26GOVT SECURITIES 45.04 6.68 GOI 2031 SOV 29.11 6.79 GOI 2027 SOV 12.84 7.17 GOI 2028 SOV 3.10CBLO 8.41Cash & Cash Receivables 5.90TOTAL 100.00

21
IDBI Gilt Fund (IGF)(An open-ended debt scheme investing in government securities across maturity)
Portfolio as on 31/03/2018
* Rounded off to the nearest two digits after the decimal point.
Asset Profile
CBLO11.30% Cash & Cash Receivables
1.14%
Gov’t Securities87.56%
Product LabelThis product is suitable for investors who are seeking*: Riskometer
l Long term regular income along with capital appreciation with at least medium term horizon
l Investments in dated Central & State Government Securities / T-Bills / Money Market Instrument
Investors understand that their principal will be at Moderate risk
*Investors should consult their financial advisors if in doubt about whether the product is suitable for them.
Issuer Name Rating % to Net Assets*
GOV'T SECURITIES 87.56
7.17 GOI 2028 SOV 38.86
6.68 GOI 2031 SOV 35.15
6.79 GOI 2027 SOV 13.56
CBLO 11.30
Cash & Cash Receivables 1.14
TOTAL 100.00
Scheme FeaturesInvestment objective:The investment objective of the scheme would be to provide regular income along with opportunities for capital appreciation through investments in a diversified basket of central government dated securities, state government securities and treasury bills. However, there can be no assurance that the investment objective of the scheme will be realized / achieved.
Fund Manager: Total Experience: Over 25 YearsMr. Raju Sharma (Managing the Scheme since 3rd May, 2017)
Inception Date: 21st December, 2012
Benchmark:CRISIL Gilt Index
NAV as on 28th March 2018 (` per unit):Regular Direct
Growth 14.0314 14.4859Quarterly Dividend 9.9662 10.9867Annual Dividend 10.3912 10.8678
Monthly Average AUM:` 20.64 Crs.
AUM as on 31st March 2018:` 21.02 Crs.
Expense Ratio: (Weighted Average for the month)Regular : 1.0710% Direct : 0.2895%Expense ratio is inclusive of GST on management fees.
Quantitative Measures:YTM : 7.40%Average Maturity : 9.88 YearsModified Duration : 6.48 Years
Load Structure:Entry Load : Not ApplicableExit Load : for Lumpsum - 0.50% for exit (Redemption/Switch-out/Transfer/SWP) within
30 days from the date of allotment. For SIP - 0.50% for exit (Redemption/Switch-out/Transfer/SWP) within
30 days from the date of allotment of each installment.
Dividend History (Face Value: ` 10/- Per Unit)
Record Date Individual / HUF (` Per Unit)
Others (` Per Unit)
Cum Dividend NAV** (in `)
Ex Dividend NAV (in `)
IDBI Gilt Fund - Quarterly Dividend (Regular Plan)27th July, 2017 0.2353 0.2180 10.6557 10.310319th October, 2015 0.1533 0.1421 10.5736 10.38556th July, 2015 0.0869 0.0805 10.3237 10.1936IDBI Gilt Fund - Quarterly Dividend (Direct Plan)27th July, 2017 0.3575 0.0000 11.7938 11.277519th October, 2015 0.1639 0.1518 11.1166 10.91536th July, 2015 0.0961 0.0890 10.8506 10.7073IDBI Gilt Fund - Annual Dividend (Regular Plan)20th April, 2017 1.0847 0.0000 12.0341 10.518427th March, 2015 0.9936 0.9215 11.8111 10.472217th April, 2014 0.3585 0.3433 10.6705 10.2259
IDBI Gilt Fund - Annual Dividend (Direct Plan)20th April, 2017 0.9847 0.0000 12.2581 10.880927th March, 2015 0.9768 0.0000 11.8291 10.513717th April, 2014 0.3896 0.3732 10.7019 10.2176
Past performance may or may not be sustained in the future. After the payment of dividend, the per unit NAV of the Dividend option of the Scheme will fall to the extent of the dividend payout and statutory levy, if any. All dividend distribution is subject to availability of distributable surplus on the record date and will be at the discretion of IDBI Asset Management Ltd. and IDBI MF Trustee Company Ltd. For complete dividend history including daily dividend history, please refer to our website.** NAV of the record date.

22
IDBI Gold Fund (IGFOF)(An open-ended fund of fund scheme investing in IDBI Gold Exchange Traded Fund [IDBI Gold ETF])
Portfolio as on 31/03/2018Issuer Name % To Net Assets*
Units of IDBI Gold Exchange Traded Fund 99.90
CBLO 0.04
Cash & Cash Receivables 0.06
TOTAL 100.00
* Rounded off to the nearest two digits after the decimal point.
Asset Profile
99.90%
0.04% 0.06%0.00%
20.00%
40.00%
60.00%
80.00%
100.00%
120.00% Units of IDBI Gold ETF
CBLO
Cash & Cash Receivables
The Total Expense Ratio (TER) including the weighted average of charges levied by the underlying schemes will not exceed 1.70% p.a. of the daily net assets. The maximum TER after including the additional expense towards distribution of assets to cities beyond Top 15 cities, if any, that may be charged to the Scheme will not exceed 2.00% p.a of the daily net assets. The expense ratio under direct plan shall exclude distribution expenses, commission, etc.
Product LabelThis product is suitable for investors who are seeking*: Riskometer
l To replicate returns of IDBI Gold ETF with atleast medium term horizon
l Investments in units of IDBI Gold ETF / Money Market Instruments / IDBI Liquid Fund Scheme
Investors understand that their principal will be at Moderately High risk
*Investors should consult their financial advisors if in doubt about whether the product is suitable for them.
Scheme Features
Investment objective:The investment objective of the Scheme will be to generate returns that correspond closely to the returns generated by IDBI Gold Exchange Traded Fund.
Fund Manager: Total Experience: Over 11 YearsMr. Ashish Mishra (Managing the Scheme since 5th September 2017)
Inception Date: 14th August, 2012
Benchmark:Domestic price of Gold
NAV as on 28th March 2018 (` per unit):Regular Direct
Growth 8.9746 9.1652
Monthly Average AUM: ` 35.34 Crs.
AUM as on 31st March 2018:` 35.33 Crs.
Expense Ratio: (Weighted Average for the month)Regular : 1.3913% Direct : 0.8012%Expense ratio is inclusive of GST on management fees.
Load Structure:Entry Load : Not ApplicableExit Load : for Lumpsum - 1% for exit (Redemption/Switch-out/Transfer/SWP) within
12 months from the date of allotment. for SIP - 1% for exit (Redemption/Switch-out/Transfer/SWP) within
12 months from the date of allotment of each installment.
AUM REPORT FOR THE QUARTER ENDED 31/03/2018
Rs. in Lakhs
Asset class wise disclosure of AUM & AAUM Disclosure of percentage of AUM by geography
Category AUM as on the last day of the Quarter
Average AUM for the Quarter
Geographical Spread % of Total AUM as on the last day of the Quarter
Income 49,045.68 68,605.94 Top 5 Cities 64.47%
Equity (other than ELSS) 184,407.12 192,254.74 Next 10 Cities 15.74%
Balanced 45,121.06 45,300.39 Next 20 Cities 8.63%
Liquid 368,757.83 694,323.83 Next 75 Cities 7.82%
Gilt 2,101.53 2,076.34 Others 3.33%
Equity - ELSS 64,331.87 66,502.00 TOTAL 100.00%
GOLD ETF 6,844.70 6,909.24
Other ETF 0.00 0.00
Fund of Fund investing overseas 0.00 0.00
TOTAL 720,609.80 1,075,972.46
Note : Since IDBI Gold Fund (FOF Domestic) invests predominently in units of IDBI Gold Exchange Traded Fund, the AUM and Average AUM of IDBI Gold Fund are disclosed separately below:
Rs. in Lakhs
Asset class wise disclosure of AUM & AAUM
Category AUM as on the last day of the Quarter
Average AUM for the Quarter
FOF (Domestic) 3,532.83 3,580.15

23
IDBI Gold Exchange Traded Fund (IDBIGOLD)(An open-ended scheme replicating/ tracking the performance of gold in domestic prices)
Portfolio as on 31/03/2018Issuer Name % To Net Assets*
Physical Gold & Gold Related Instruments# 97.96
CBLO 2.05
Cash & Cash Receivables -0.02
TOTAL 100.00
* Rounded off to the nearest two digits after the decimal point.# Comprises of 40 Kgs deposited in the Gold Monetisation Scheme of Bank of Nova Scotia.
Asset Profile
Physical Gold & Gold Related Instruments
CBLO
Cash & Cash Receivables
97.96%
2.05%
-0.02%-20.00%
0.00%
20.00%
40.00%
60.00%
80.00%
100.00%
120.00%
Product LabelThis product is suitable for investors who are seeking*: Riskometer
l To replicate the performance of gold in domestic prices with at least medium term horizon
l Investments in physical gold and gold related instruments / debt & money market instruments
Investors understand that their principal will be at Moderately High risk
*Investors should consult their financial advisors if in doubt about whether the product is suitable for them.
Scheme FeaturesInvestment objective:To invest in physical gold and gold related instruments with the objective to replicate the performance of gold in domestic prices. The ETF will adopt a passive investment strategy and will seek to achieve the investment objective by minimizing the tracking error between the Fund and the underlying asset.
Fund Manager: Total Experience: Over 11 YearsMr. Ashish Mishra (Managing the Scheme since 5th September 2017)
Inception Date: 9th November, 2011
Benchmark:Domestic price of Physical Gold
NAV as on 28th March 2018 (` per unit):
NAV 2925.3860Physical Gold Price* 3089.9164Cash Component -164.5304* Source: Bank of Nova Scotia (Custodian for IDBI Gold ETF)
Monthly Average AUM:` 68.35 Crs.
AUM as on 31st March 2018:` 68.45 Crs.
Expense Ratio: (Weighted Average for the month)Regular : 0.5799%Expense ratio is inclusive of GST on management fees.
Quantitative Measures:Tracking Error : 0.8819% Annualised tracking error for last 12 month's period.
Load Structure:Entry Load : Not ApplicableExit Load (for Lumpsum & SIP) : Nil
Listing:The Scheme is listed on National Stock Exchange of India Ltd. (NSE) and Bombay Stock Exchange Ltd. (BSE).
NSE Disclaimer for IDBI Gold Exchange Traded Fund : It is to be distinctly understood that the permission given by NSE should not in any way be deemed or construed that the Scheme Information Document has been cleared or approved by NSE nor does it certify the correctness or completeness of any of the contents of the Draft Scheme Information Document. The investors are advised to refer to the Scheme Information Document for the full text of the ‘Disclaimer Clause of NSE’.BSE Disclaimer for IDBI Gold Exchange Traded Fund : It is to be distinctly understood that the permission given by BSE Ltd. should not in any way be deemed or construed that the SID has been cleared or approved by BSE Ltd. nor does it certify the correctness or completeness of any of the contents of the SID. The investors are advised to refer to the SID for the full text of the ‘Disclaimer Clause of BSE Ltd.’
Our Branches:Ahmedabad : IDBI Mutual Fund, IDBI Complex, 3rd Floor, Near Lal Bungalows, Off. C G Road, Ahmedabad - 380 006. Tel.: 079-2640 0887 / 30. Fax: 079-26400844.Bengaluru : IDBI Mutual Fund, No.7, First Level, Unit No. 116, Prestige Centre Point, Cunningham Road, Bengaluru - 560 052. Tel.: 080-41495263.Chandigarh : IDBI Mutual Fund, IDBI Bank Ltd., First Floor, SCO 162 - 163, Sector - 9C, Chandigarh - 160 009. Tel.: 0172-5076705.Chennai : IDBI Mutual Fund, No. 115, Anna Salai, P.B. No. 805, Saidapet, Chennai - 600 015. Tel.: 044-6555 2320Delhi : IDBI Mutual Fund, IDBI Bank, 5th Floor, Red Cross Building, Red Cross Road, Parliament Street, New Delhi - 110 001. Tel.: 011-66130050. Fax: 011-66130051.Hyderabad : IDBI Mutual Fund, 3rd Floor, 5 - 9 - 89/1, Chapel Road, Hyderabad - 500 001. Tel.: 040-66663559. Fax: 040-66663889.Indore : IDBI Mutual Fund, IDBI Bank Ltd., Ground Floor, 16-C, Omni Palace, Ratlam Kothi Main Road, Indore - 452 001. Tel.: 0731-6679127.Jaipur : IDBI Mutual Fund, D-24, Durlabh Niwas, Prithvi Raj Road, C-Scheme, Jaipur - 302 001.Kochi : IDBI Mutual Fund, IDBI Bank, Corporate Office, Near Passport Office, Panampally Nagar, Kochi - 680 366. Tel.: 0484-6462112.Kolkata : IDBI Mutual Fund, IDBI House, 6th Floor, 44, Shakespeare Sarani, Kolkata - 700 017. Tel.: 033 - 66557627. Fax: 033-66557629.Lucknow : IDBI Mutual Fund, IDBI Bank, 2 M G Marg, Kisan Sekhari Bhawan, Hazratganj, Lucknow - 226 001. Tel.: 0522-2202863 / 6500103.Mumbai : IDBI Mutual Fund, Mafatlal Center, 5th Floor, Nariman Point, Mumbai - 400021. Tel.: 022-66442800.Pune : IDBI Mutual Fund, Shreenath Plaza, Office No. 91, ”C” Wing, 5th Floor, Dyaneshwar Paduka Chowk, F. C. Road, Opp. IDBI Bank, Pune - 411 005
Contact usIDBI Asset Management Limited
(Investment Manager to IDBI Mutual Fund)CIN: U65100MH2010PLC199319
Registered Office: IDBI Tower, WTC Complex, Cuffe parade, Colaba, Mumbai - 400005Corporate Office: 5th Floor, Mafatlal Centre, Nariman Point, Mumbai- 400021
Phone: 022-66442800 Fax: 022-66442801 E-mail: [email protected] Website: www.idbimutual.co.in
SMS: IDBIMF on 09220092200 Toll-free: 1800-419-4324 (from any landline or mobile number across India, between 9 am-6 pm from Monday to Saturday)

24
SCHEME PERFORMANCE - REGULAR PLANS (As on 31st March, 2018)
Schemes Managed by Fund Manager (FM) - Mr. V. Balasubramanian Total Experience: Over 36 Years
IDBI Equity Advantage Fund (IEAF) Inception date: 10th September, 2013
PeriodReturns (in %) Value of ` 10,000/- invested
Scheme Benchmark# Additional Benchmark##
Scheme (`)
Benchmark# (`)
Additional Benchmark## (`)
Last 1 year 15.41 13.51 13.51 11,368 11,249 11,270 Last 3 years 8.22 9.91 7.76 12,528 13,054 12,295 Since Inception 23.30 16.80 13.12 25,920 20,262 17,516
FM Managing this Scheme since inception.The Regular Plan of this scheme is in existence for a period less than 5 years. # S&P BSE 200 Index-TRI, ## S&P BSE Sensex-TRI.
Schemes Managed by Fund Manager (FM) - Ms. Uma Venkatraman Total Experience: Over 15 Years
IDBI India Top 100 Equity Fund (IIT100EF) Inception date: 15th May 2012
PeriodReturns (in %) Value of ` 10,000/- invested
Scheme Benchmark# Additional Benchmark##
Scheme (`)
Benchmark# (`)
Additional Benchmark## (`)
Last 1 year 7.10 13.19 12.68 10,611 11,222 11,176 Last 3 years 5.74 9.23 7.99 11,605 12,810 12,378 Last 5 years 15.49 14.97 13.63 20,556 20,091 18,954 Since Inception 15.17 15.63 14.44 22,920 23,453 22,077
FM Managing this Scheme since 5th September 2017.# Nifty 100 Index-TRI, ## Nifty 50 Index-TRI.
IDBI Nifty Index Fund (INIF) Inception date: 25th June, 2010
PeriodReturns (in %) Value of ` 10,000/- invested
Scheme Benchmark# Scheme (`) Benchmark# (`)Last 1 year 10.11 12.68 10,927 11,176 Last 3 years 5.92 7.99 11,682 12,378 Last 5 years 11.71 13.63 17,401 18,954 Since Inception 8.36 10.08 18,647 21,074
FM Managing this Scheme since 5th September 2017.# Nifty 50 Index-TRI.
IDBI Nifty Junior Index Fund (INJIF) Inception date: 20th September, 2010
PeriodReturns (in %) Value of ` 10,000/- invested
Scheme Benchmark# Additional Benchmark##
Scheme (`)
Benchmark# (`)
Additional Benchmark## (`)
Last 1 year 13.93 16.57 12.68 11,284 11,531 11,176 Last 3 years 13.78 16.01 7.99 14,506 15,359 12,378 Last 5 years 19.83 22.20 13.63 24,718 27,264 18,954 Since Inception 10.82 12.78 8.52 21,664 24,719 18,505
FM Managing this Scheme since 5th September 2017.# Nifty Next 50 Index-TRI, ## Nifty 50 Index-TRI.
Schemes Managed by Fund Manager (FM) - Mr. Ashish Mishra Total Experience: Over 11 Years
IDBI Diversified Equity Fund (IDEF) Inception date: 28th March, 2014
PeriodReturns (in %) Value of ` 10,000/- invested
Scheme Benchmark# Additional Benchmark##
Scheme (`)
Benchmark# (`)
Additional Benchmark## (`)
Last 1 year 13.99 14.41 13.51 11,201 11,321 11,270 Last 3 years 7.51 10.64 7.76 12,261 13,298 12,295 Since Inception 19.80 15.88 11.79 20,610 18,040 15,624
FM Managing this Scheme since 5th September 2017.The Regular Plan of this scheme is in existence for a period less than 5 years.# S&P BSE 500-TRI, ## S&P BSE Sensex-TRI.
IDBI Midcap Fund (IMF) Inception date: 25th January, 2017
PeriodReturns (in %) Value of ` 10,000/- invested
Scheme Benchmark# Additional Benchmark##
Scheme (`)
Benchmark# (`)
Additional Benchmark## (`)
Last 1 year 10.30 11.51 12.68 10,894 11,025 11,176 Since Inception 12.35 19.24 16.44 11,460 12,285 11,949
FM Managing this Scheme since 5th September 2017.The Regular Plan of this scheme is in existence for a period less than 3 years.# Nifty Midcap 100 - TRI, ## Nifty 50 Index-TRI.
Scheme Managed by Fund Managers (FM) - Mr. V Balasubramanian (Equity Portion) - Total Experience: Over 36 Years &
Mr. Raju Sharma (Debt Portion) Total Experience: Over 25 Years
IDBI Hybrid Equity Fund (IHEF) Inception Date: 24th October, 2016
PeriodReturns (in %) Value of ` 10,000/- invested
Scheme Benchmark# Additional Benchmark##
Scheme (`)
Benchmark# (`)
Additional Benchmark## (`)
Last 1 year 7.98 10.67 12.68 10,723 10,999 11,176
Since Inception 11.70 10.46 12.40 11,708 11,522 11,811
Mr. V Balasubramanian (Equity Portion) since 24th October 2016 &Mr. Raju Sharma Managing this Scheme (Debt Portion) since 24th October, 2017The Regular Plan of this scheme is in existence for a period less than 3 years.# CRISIL Hybrid 35+65-Aggressive Index, ## Nifty 50 Index-TRI.
Scheme Managed by Fund Managers (FM) - Mr. Raju Sharma (Debt Portion) - Total Experience: Over 25 Years &
Ms. Uma Venkatraman (Equity Portion) - Total Experience: Over 15 Years
IDBI Equity Savings Fund (IESF) Inception date: 7th March, 2011
PeriodReturns (in %) Value of ` 10,000/- invested
Scheme Benchmark# Additional Benchmark##
Scheme (`)
Benchmark# (`)
Additional Benchmark## (`)
Last 1 year 2.00 8.67 -0.21 10,181 10,816 9,962
Last 3 years 4.17 7.94 6.46 11,242 12,495 12,034
Last 5 years 6.61 10.11 6.42 13,773 16,187 18,823
Since Inception 6.82 9.25 6.52 15,932 18,686 15,626
Mr. Raju Sharma Managing this Scheme (Debt Portion) since 3rd May 2017 & Ms. Uma Venkatraman Managing this Scheme (Equity Portion) since 5th September 201740% of CRISIL Liquid Fund Index + 30% CRISIL Short Term Bond Fund Index + 30% of Nifty 50 Index, ## CRISIL 10 Year Gilt Index.
Schemes Managed by Fund Manager (FM) - Mr. Raju Sharma - Total Experience: Over 25 Years
IDBI Liquid Fund (ILIQF) Inception date: 9th July, 2010
PeriodReturns (in %) Value of ` 10,000/- invested
Scheme Benchmark# Additional Benchmark##
Scheme (`)
Benchmark# (`)
Additional Benchmark## (`)
Last 1 year 6.73 6.92 5.94 10,672 10,684 10,592
Last 3 years 7.34 7.39 7.01 12,363 12,367 12,223
Last 5 years 8.01 8.10 7.06 14,701 14,752 14,059
1 month 0.59 0.72 0.82 NA NA NA
2 weeks 0.31 0.41 0.46 NA NA NA
1 week 0.15 0.24 0.32 NA NA NA
Since Inception 8.29 8.05 6.91 18,505 18,189 16,757
FM Managing this Scheme since 3rd May 2017# CRISIL Liquid Fund Index, ## CRISIL 1 Year T-Bill Index, NA Not Applicable.
IDBI Dynamic Bond Fund (IDBF) Inception date: 21st February, 2012
PeriodReturns (in %) Value of ` 10,000/- invested
Scheme Benchmark# Additional Benchmark##
Scheme (`)
Benchmark# (`)
Additional Benchmark## (`)
Last 1 year 0.32 5.23 -0.21 10,022 10,511 9,962
Last 3 years 4.39 8.23 6.46 11,337 12,639 12,034
Last 5 years 5.35 8.61 6.42 12,976 15,111 13,648
Since Inception 5.97 8.65 6.81 14,247 16,592 14,946
FM Managing this Scheme since 3rd May 2017# CRISIL Composite Bond Fund Index, ## CRISIL 10 Year Gilt Index.
IDBI Gilt Fund (IGF) Inception date: 21st December, 2012
PeriodReturns (in %) Value of ` 10,000/- invested
Scheme Benchmark# Additional Benchmark##
Scheme (`)
Benchmark# (`)
Additional Benchmark## (`)
Last 1 year -1.43 2.75 -0.21 9,847 10,287 9,962
Last 3 years 4.36 7.25 6.46 11,310 12,299 12,034
Last 5 years 6.63 7.80 6.42 13,784 14,550 13,648
Since Inception 6.64 8.11 6.77 14,031 15,081 14,031
FM Managing this Scheme since 3rd May 2017# CRISIL Gilt Index, ## CRISIL 10 Year Gilt Index.

25
SCHEME PERFORMANCE - REGULAR PLANS (As on 31st March, 2018) (contd...)
IDBI Equity Advantage Fund (IEAF)Instalment amount: ` 10,000/-Frequency: Monthly
Investment date: 1st of every monthInception date: 10th September, 2013
Since Inception 3 years 1 year
Total amount invested (Rs. in '000) 550 360 120
Market value as on 31st March, 2018 (Rs. in '000) 792.91 426.67 124.01
Scheme Return (% XIRR) 16.10 11.43 6.39
Benchmark (S&P BSE 200 Index-TRI#) return (% XIRR) 13.31 12.86 3.84
Additional Benchmark (S&P BSE Sensex-TRI##) return (%XIRR) 10.74 11.23 5.20
IDBI India Top 100 Equity Fund (IIT100 EF)Instalment amount: ` 10,000/-Frequency: Monthly
Investment date: 1st of every monthInception date: 15th May, 2012
Since Inception 5 years 3 years 1 year
Total amount invested (Rs. in '000) 710 600 360 120
Market value as on 31st March, 2018 (Rs. in '000) 1024.14 794.49 400.71 116.98
Scheme Return (% XIRR) 12.31 11.22 7.13 -4.73
Benchmark (Nifty 100-TRI#) return (% XIRR) 13.45 12.92 12.22 3.69
Additional Benchmark (Nifty 50 Index-TRI##) return (%XIRR) 12.18 11.63 11.28 3.70
IDBI Diversified Equity Fund (IDEF)Instalment amount: ` 10,000/-Frequency: Monthly
Investment date: 1st of every monthInception date: 28th March, 2014
Since Inception 3 years 1 year
Total amount invested (Rs. in '000) 490 360 120
Market value as on 31st March, 2018 (Rs. in '000) 624.62 416.24 123.04
Scheme Return (% XIRR) 11.97 9.73 4.84
Benchmark (S&P BSE 500 Index-TRI#) return (% XIRR) 12.87 13.62 4.00
Additional Benchmark (S&P BSE Sensex-TRI##) return (%XIRR) 9.93 11.23 5.20
IDBI Nifty Index Fund (INIF)Instalment amount: ` 10,000/-Frequency: Monthly
Investment date: 1st of every monthInception date: 25th June, 2010
Since Inception 5 years 3 years 1 year
Total amount invested (Rs. in '000) 940 600 360 120
Market value as on 31st March, 2018 (Rs. in '000) 1376.00 761.04 411.54 120.83
Scheme Return (% XIRR) 9.55 9.48 8.95 1.31
Benchmark (Nifty 50 Index-TRI #) return (% XIRR) 11.44 11.63 11.28 3.70
Additional Benchmark (Nifty 50 Index-TRI ##) return (%XIRR) 11.44 11.63 11.28 3.70
IDBI Nifty Junior Index Fund (INJIF)Instalment amount: ` 10,000/-Frequency: Monthly
Investment date: 1st of every monthInception date: 20th September, 2010
Since Inception 5 years 3 years 1 year
Total amount invested (Rs. in '000) 910 600 360 120
Market value as on 31st March, 2018 (Rs. in '000) 1722.02 930.99 451.31 121.61
Scheme Return (% XIRR) 16.47 17.68 15.35 2.55
Benchmark (Nifty Next 50 Index-TRI#) return (% XIRR) 18.69 20.15 17.66 4.49
Additional Benchmark (Nifty 50 Index-TRI##) return (%XIRR) 11.53 11.63 11.28 3.70
# Scheme Benchmark ## Additional Benchmark as per SEBI Circular dated August 22, 2011.
Past Performance may or may not be sustained in the future. Returns pertain to growth option under Regular Plan and the same have been computed using XIRR by excel spreadsheet function. XIRR helps in calculating return on investments based on cash flows that are uniform and regular monthly subscriptions. The Regular and Direct Plan of IDBI Mutual Fund have different expense structure.
SYSTEMATIC INVESTMENT PLAN (SIP) PERFORMANCE EQUITY FUNDS - REGULAR PLANS (As on 31st March, 2018)
Schemes Managed by Fund Manager (FM) - Mr. Bhupesh Kalyani Total Experience: Over 15 Years
IDBI Ultra Short Term Fund (IUSTF) Inception date: 3rd September, 2010
PeriodReturns (in %) Value of ` 10,000/- invested
Scheme Benchmark# Additional Benchmark##
Scheme (`)
Benchmark# (`)
Additional Benchmark## (`)
Last 1 year 6.13 6.92 5.94 10,602 10,684 10,592 Last 3 years 7.08 7.39 7.01 12,256 12,367 12,223 Last 5 years 7.76 8.10 7.06 14,532 14,752 14,059 Since Inception 8.22 8.10 7.02 18,183 18,038 16,709
FM Managing this Scheme since 1st February 2017.# CRISIL Liquid Fund Index, ## CRISIL 1 Year T-Bill Index.
IDBI Short Term Bond Fund (ISTBF) Inception date: 23rd March, 2011
PeriodReturns (in %) Value of ` 10,000/- invested
Scheme Benchmark# Additional Benchmark##
Scheme (`)
Benchmark# (`)
Additional Benchmark## (`)
Last 1 year 6.05 6.27 5.94 10,594 10,617 10,592 Last 3 years 7.07 7.99 7.01 12,257 12,564 12,223 Last 5 years 7.63 8.57 7.06 14,449 15,080 14,059 Since Inception 8.13 8.62 7.18 17,305 17,868 16,268
FM Managing this Scheme since 1st February 2017.# CRISIL Short Term Bond Fund Index, ## CRISIL 1 Year T-Bill Index
IDBI Credit Risk Fund (ICRF) Inception date: 3rd March, 2014
PeriodReturns (in %) Value of ` 10,000/- invested
Scheme Benchmark# Additional Benchmark##
Scheme (`)
Benchmark# (`)
Additional Benchmark## (`)
Last 1 year 6.15 6.27 5.94 10,602 10,617 10,592 Last 3 years 7.60 7.99 7.01 12,443 12,564 12,223 Since Inception 8.29 8.65 7.46 13,830 14,020 13,401 FM Managing this Scheme since 1st February 2017. The Regular Plan of this scheme is in existance for a period less than 5 years.# CRISIL Short Term Bond Fund Index, ## CRISIL 1 Year T-Bill Index
Schemes Managed by Fund Manager (FM) - Mr. Ashish Mishra Total Experience: Over 11 Years
IDBI Gold Fund (IGFOF) Inception date: 14th August, 2012
PeriodReturns (in %) Value of ` 10,000/- invested
Scheme Benchmark# Scheme (`)
Benchmark# (`)
Last 1 year 2.94 5.49 10,412 10,669
Last 3 years 2.30 4.88 10,866 11,707
Last 5 years -1.58 0.58 9,236 10,292
Since Inception -1.91 0.33 8,975 10,184
FM Managing this Scheme since 5th September 2017.# Domestic price of physical Gold.
IDBI Gold Exchange Traded Fund (IDBIGOLD) Inception date: 9th November, 2011
PeriodReturns (in %) Value of ` 10,000/- invested
Scheme Benchmark# Scheme (`)
Benchmark# (`)
Last 1 year 5.15 5.49 10,633 10,669
Last 3 years 4.22 4.88 11,488 11,707
Last 5 years -0.22 0.58 9,892 10,292
Since Inception 0.13 0.99 10,082 10,649
FM Managing this Scheme since 5th September 2017.# Domestic price of physical Gold.
# Scheme Benchmark; ## Additional Benchmark as per SEBI Circular dated August 22, 2011.Past performance may or may not be sustained in the future. Returns pertain to growth option under Regular Plan. The returns are Compounded Annual Growth Returns (CAGR) for past 1 year, 3 years, 5 years & since inception period and annualised for the period below 1 year. The Regular and Direct Plan of IDBI Mutual Fund have different expense structure.

26
SCHEME PERFORMANCE - DIRECT PLANS (As on 31st March, 2018)
Schemes Managed by Fund Manager (FM) - Mr. V. Balasubramanian Total Experience: Over 36 Years
IDBI Equity Advantage Fund (IEAF) Inception date: 10th September, 2013
PeriodReturns (in %) Value of ` 10,000/- invested
Scheme Benchmark# Additional Benchmark##
Scheme (`)
Benchmark# (`)
Additional Benchmark## (`)
Last 1 year 17.47 13.51 13.51 11,572 11,249 11,270 Last 3 years 9.56 9.91 7.76 12,994 13,054 12,295 Since Inception 24.58 16.80 13.12 27,170 20,262 17,516
FM Managing this Scheme since inception. The Direct Plan of this scheme is in existence for a period less than 5 years.# S&P BSE 200 Index-TRI, ## S&P BSE Sensex-TRI.
Schemes Managed by Fund Manager (FM) - Ms. Uma Venkatraman Total Experience: Over 15 Years
IDBI India Top 100 Equity Fund (IIT100EF) Inception date: 1st January, 2013
PeriodReturns (in %) Value of ` 10,000/- invested
Scheme Benchmark# Additional Benchmark##
Scheme (`)
Benchmark# (`)
Additional Benchmark## (`)
Last 1 year 9.07 13.19 12.68 10,804 11,222 11,176 Last 3 years 7.01 9.23 7.99 12,031 12,810 12,378 Last 5 years 16.57 14.97 13.63 21,531 20,091 18,954 Since Inception 13.94 13.08 12.02 19,811 19,037 18,123
FM Managing this Scheme since 5th September 2017.# Nifty 100 Index-TRI, ## Nifty 50 Index-TRI.
IDBI Nifty Index Fund (INIF) Inception date: 1st January, 2013
PeriodReturns (in %) Value of ` 10,000/- invested
Scheme Benchmark# Scheme (`) Benchmark# (`)Last 1 year 11.52 12.68 11,066 11,176 Last 3 years 7.14 7.99 12,091 12,378 Last 5 years 12.63 13.63 18,131 18,954 Since Inception 11.07 12.02 17,335 18,123
FM Managing this Scheme since 5th September 2017.# Nifty 50 Index-TRI.
IDBI Nifty Junior Index Fund (INJIF) Inception date: 1st January, 2013
PeriodReturns (in %) Value of ` 10,000/- invested
Scheme Benchmark# Additional Benchmark##
Scheme (`)
Benchmark# (`)
Additional Benchmark## (`)
Last 1 year 15.32 16.57 12.68 11,421 11,531 11,176 Last 3 years 15.14 16.01 7.99 15,032 15,359 12,378 Last 5 years 20.91 22.20 13.63 25,859 27,264 18,954 Since Inception 17.47 18.70 12.02 23,239 24,547 18,123
FM Managing this Scheme since 5th September 2017.# Nifty Next 50 Index-TRI, ## Nifty 50 Index-TRI.
Schemes Managed by Fund Manager (FM) - Mr. Ashish Mishra Total Experience: Over 11 Years
IDBI Diversified Equity Fund (IDEF) Inception date: 28th March, 2014
PeriodReturns (in %) Value of ` 10,000/- invested
Scheme Benchmark# Additional Benchmark##
Scheme (`)
Benchmark# (`)
Additional Benchmark## (`)
Last 1 year 16.37 14.41 13.51 11,427 11,321 11,270 Last 3 years 8.90 10.64 7.76 12,746 13,298 12,295 Since Inception 21.13 15.88 11.79 21,540 18,040 15,624
FM Managing this Scheme since 5th September 2017.The Direct Plan of this scheme is in existence for a period less than 5 years.# S&P BSE 500-TRI, ## S&P BSE Sensex-TRI.
IDBI Midcap Fund (IMF) Inception date: 25th January, 2017
PeriodReturns (in %) Value of ` 10,000/- invested
Scheme Benchmark# Additional Benchmark##
Scheme (`)
Benchmark# (`)
Additional Benchmark## (`)
Last 1 year 13.41 11.51 12.68 11,212 11,025 11,176 Since Inception 15.53 19.24 16.44 11,840 12,285 11,949
FM Managing this Scheme since 5th September 2017.The Direct Plan of this scheme is in existence for a period less than 3 years.# Nifty Midcap 100 - TRI, ## Nifty 50 Index-TRI.
Scheme Managed by Fund Managers (FM) - Mr. V Balasubramanian (Equity Portion) - Total Experience: Over 36 Years &
Mr. Raju Sharma (Debt Portion) Total Experience: Over 25 Years
IDBI Hybrid Equity Fund (IHEF) Inception Date: 24th October, 2016
Period
Returns (in %) Value of ` 10,000/- invested
Scheme Benchmark# Additional Benchmark##
Scheme (`)
Benchmark# (`)
Additional Benchmark## (`)
Last 1 year 10.25 10.67 12.68 10,946 10,999 11,176
Since Inception 13.88 10.46 12.40 12,034 11,522 11,811
Mr. V Balasubramanian (Equity Portion) since 24th October 2016 &Mr. Raju Sharma Managing this Scheme (Debt Portion) since 24th October, 2017The Direct Plan of this scheme is in existence for a period less than 3 years.# CRISIL Hybrid 35+65-Aggressive Index, ## Nifty 50 Index-TRI.
Scheme Managed by Fund Managers (FM) - Mr. Raju Sharma (Debt Portion) - Total Experience: Over 25 Years &
Ms. Uma Venkatraman (Equity Portion) - Total Experience: Over 15 Years
IDBI Equity Savings Fund (IESF) Inception date: 1st January, 2013
Period
Returns (in %) Value of ` 10,000/- invested
Scheme Benchmark# Additional Benchmark##
Scheme (`)
Benchmark# (`)
Additional Benchmark## (`)
Last 1 year 3.43 8.67 -0.21 10,323 10,816 9,962
Last 3 years 5.12 7.94 6.46 11,551 12,495 12,034
Last 5 years 7.40 10.11 6.42 14,293 16,187 13,648
Since Inception 7.06 9.63 6.57 14,295 16,187 13,953
Mr. Raju Sharma Managing this Scheme (Debt Portion) since 3rd May 2017 & Ms. Uma Venkatraman Managing this Scheme (Equity Portion) since 5th September 201740% of CRISIL Liquid Fund Index + 30% CRISIL Short Term Bond Fund Index + 30% of Nifty 50 Index, ## CRISIL 10 Year Gilt Index.
Schemes Managed by Fund Manager (FM) - Mr. Raju Sharma - Total Experience: Over 25 Years
IDBI Liquid Fund (ILIQF) Inception date: 1st January, 2013
PeriodReturns (in %) Value of ` 10,000/- invested
Scheme Benchmark# Additional Benchmark##
Scheme (`)
Benchmark# (`)
Additional Benchmark## (`)
Last 1 year 6.87 6.92 5.94 10,685 10,684 10,592
Last 3 years 7.46 7.39 7.01 12,403 12,367 12,223
Last 5 years 8.13 8.10 7.06 14,778 14,752 14,059
1 month 0.60 0.72 0.82 NA NA NA
2 weeks 0.32 0.41 0.46 NA NA NA
1 week 0.16 0.24 0.32 NA NA NA
Since Inception 8.16 8.10 7.15 15,089 15,040 14,353
FM Managing this Scheme since 3rd May 2017# CRISIL Liquid Fund Index, ## CRISIL 1 Year T-Bill Index, NA Not Applicable.
IDBI Dynamic Bond Fund (IDBF) Inception date: 1st January, 2013
PeriodReturns (in %) Value of ` 10,000/- invested
Scheme Benchmark# Additional Benchmark##
Scheme (`)
Benchmark# (`)
Additional Benchmark## (`)
Last 1 year 1.80 5.23 -0.21 10,169 10,511 9,962
Last 3 years 5.44 8.23 6.46 11,680 12,639 12,034
Last 5 years 6.15 8.61 6.42 13,481 15,111 13,648
Since Inception 6.13 8.58 6.57 13,657 15,390 13,953
FM Managing this Scheme since 3rd May 2017# CRISIL Composite Bond Fund Index, ## CRISIL 10 Year Gilt Index.
IDBI Gilt Fund (IGF) Inception date: 1st January, 2013
PeriodReturns (in %) Value of ` 10,000/- invested
Scheme Benchmark# Additional Benchmark##
Scheme (`)
Benchmark# (`)
Additional Benchmark## (`)
Last 1 year -0.26 2.75 -0.21 9,964 10,287 9,962
Last 3 years 5.25 7.25 6.46 11,603 12,299 12,034
Last 5 years 7.29 7.80 6.42 14,220 14,550 13,648
Since Inception 7.21 7.87 6.57 14,399 14,874 13,953
FM Managing this Scheme since 3rd May 2017# CRISIL Gilt Index, ## CRISIL 10 Year Gilt Index.

27
SCHEME PERFORMANCE - DIRECT PLANS (As on 31st March, 2018) (contd...)
IDBI Equity Advantage Fund (IEAF)Instalment amount: ` 10,000/-Frequency: Monthly
Investment date: 1st of every monthInception date: 10th September, 2013
Since Inception 3 years 1 year
Total amount invested (Rs. in '000) 550 360 120
Market value as on 31st March, 2018 (Rs. in '000) 819.05 436.73 125.22
Scheme Return (% XIRR) 17.56 13.05 8.35
Benchmark (S&P BSE 200 Index-TRI#) return (% XIRR) 13.31 12.86 3.84
Additional Benchmark (S&P BSE Sensex-TRI##) return (%XIRR) 10.74 11.23 5.20
IDBI India Top 100 Equity Fund (IIT100 EF)Instalment amount: ` 10,000/-Frequency: Monthly
Investment date: 1st of every monthInception date: 1st January, 2013
Since Inception 5 years 3 years 1 year
Total amount invested (Rs. in '000) 630 600 360 120
Market value as on 31st March, 2018 (Rs. in '000) 882.23 820.93 410.33 118.17
Scheme Return (% XIRR) 12.81 12.55 8.75 -2.88
Benchmark (Nifty 100-TRI#) return (% XIRR) 12.99 12.92 12.22 3.69
Additional Benchmark (Nifty 50 Index-TRI##) return (%XIRR) 11.72 11.63 11.28 3.70
IDBI Diversified Equity Fund (IDEF)Instalment amount: ` 10,000/-Frequency: Monthly
Investment date: 1st of every monthInception date: 28th March, 2014
Since Inception 3 years 1 year
Total amount invested (Rs. in '000) 490 360 120
Market value as on 31st March, 2018 (Rs. in '000) 644.68 427.28 124.43
Scheme Return (% XIRR) 13.56 11.53 7.07
Benchmark (S&P BSE 500 Index-TRI#) return (% XIRR) 12.87 13.62 4.00
Additional Benchmark (S&P BSE Sensex-TRI##) return (%XIRR) 9.93 11.23 5.20
IDBI Nifty Index Fund (INIF)Instalment amount: ` 10,000/-Frequency: Monthly
Investment date: 1st of every monthInception date: 1st January, 2013
Since Inception 5 years 3 years 1 year
Total amount invested (Rs. in '000) 630 600 360 120
Market value as on 31st March, 2018 (Rs. in '000) 835.37 782.86 419.79 121.67
Scheme Return (% XIRR) 10.72 10.62 10.31 2.64
Benchmark (Nifty 50-TRI#) return (% XIRR) 11.72 11.63 11.28 3.70
Additional Benchmark (Nifty 50 Index-TRI##) return (%XIRR) 11.72 11.63 11.28 3.70
IDBI Nifty Junior Index Fund (INJIF)Instalment amount: ` 10,000/-Frequency: Monthly
Investment date: 1st of every monthInception date: 1st January, 2013
Since Inception 5 years 3 years 1 year
Total amount invested (Rs. in '000) 630 600 360 120
Market value as on 31st March, 2018 (Rs. in '000) 1032.56 960.61 460.87 122.40
Scheme Return (% XIRR) 18.91 18.97 16.84 3.80
Benchmark (Nifty Next 50 Index-TRI #) return (% XIRR) 20.10 20.15 17.66 4.49
Additional Benchmark (Nifty 50 Index-TRI##) return (%XIRR) 11.72 11.63 11.28 3.70
# Scheme Benchmark ## Additional Benchmark as per SEBI Circular dated August 22, 2011.
Past Performance may or may not be sustained in the future. Returns pertain to growth option under Direct Plan and the same have been computed using XIRR by excel spreadsheet function. XIRR helps in calculating return on investments based on cash flows that are uniform and regular monthly subscriptions. The Regular and Direct Plan of IDBI Mutual Fund have different expense structure.
SYSTEMATIC INVESTMENT PLAN (SIP) PERFORMANCE EQUITY FUNDS - DIRECT PLANS (As on 31st March, 2018)
MUTUAL FUND INVESTMENTS ARE SUBJECT TO MARKET RISKS, READ ALL SCHEME RELATED DOCUMENTS CAREFULLY.
Schemes Managed by Fund Manager (FM) - Mr. Bhupesh Kalyani Total Experience: Over 15 Years
IDBI Ultra Short Term Fund (IUSTF) Inception date: 1st January, 2013
PeriodReturns (in %) Value of ` 10,000/- invested
Scheme Benchmark# Additional Benchmark##
Scheme (`)
Benchmark# (`)
Additional Benchmark## (`)
Last 1 year 7.11 6.92 5.94 10,698 10,684 10,592
Last 3 years 7.96 7.39 7.01 12,559 12,367 12,223
Last 5 years 8.41 8.10 7.06 14,980 14,752 14,059
Since Inception 8.44 8.10 7.14 15,287 15,040 14,353
FM Managing this Scheme since 1st February 2017.# CRISIL Liquid Fund Index, ## CRISIL 1 Year T-Bill Index.
IDBI Short Term Bond Fund (ISTBF) Inception date: 1st January, 2013
PeriodReturns (in %) Value of ` 10,000/- invested
Scheme Benchmark# Additional Benchmark##
Scheme (`)
Benchmark# (`)
Additional Benchmark## (`)
Last 1 year 7.30 6.27 5.94 10,718 10,617 10,592
Last 3 years 8.14 7.99 7.01 12,626 12,564 12,223
Last 5 years 8.56 8.57 7.06 15,081 15,080 14,059
Since Inception 8.60 8.56 7.14 15,406 15,379 14,353
FM Managing this Scheme since 1st February 2017.# CRISIL Short Term Bond Fund Index, ## CRISIL 1 Year T-Bill Index.
IDBI Credit Risk Fund (ICRF) Inception date: 3rd March, 2014
PeriodReturns (in %) Value of ` 10,000/- invested
Scheme Benchmark# Additional Benchmark##
Scheme (`)
Benchmark# (`)
Additional Benchmark## (`)
Last 1 year 7.44 6.27 5.94 10,730 10,617 10,592
Last 3 years 8.68 7.99 7.01 12,821 12,564 12,223
Since Inception 9.31 8.65 7.46 14,370 14,020 13,401
FM Managing this Scheme since 1st February 2017. The Direct Plan of this scheme is in existance for a period less than 5 years.# CRISIL Short Term Bond Fund Index, ## CRISIL 1 Year T-Bill Index
Schemes Managed by Fund Manager (FM) - Mr. Ashish Mishra Total Experience: Over 11 Years
IDBI Gold Fund (IGFOF) Inception date: 1st January, 2013
PeriodReturns (in %) Value of ` 10,000/- invested
Scheme Benchmark# Scheme (`)
Benchmark# (`)
Last 1 year 3.51 5.49 10,469 10,669
Last 3 years 2.80 4.88 11,028 11,707
Last 5 years -1.17 0.58 9,427 10,292
Since Inception -1.65 0.05 9,168 10,028
FM Managing this Scheme since 5th September 2017.# Domestic price of physical Gold.
# Scheme Benchmark; ## Additional Benchmark as per SEBI Circular dated August 22, 2011.
Past performance may or may not be sustained in the future. Returns pertain to growth option under Direct Plan. The returns are Compounded Annual Growth Returns (CAGR) for past 1 year, 3 years, 5 years & since inception period and annualised for the period below 1 year. The Regular and Direct Plan of IDBI Mutual Fund have different expense structure.