Idahoan Group Mines Final PA - Idaho Department of ...
41
IDAHOAN GROUP (Aka IDAHOAN, RICHMOND LODE, EUREKA, HOMESTAKE, WHALE, AND GARFIELD PATENTED CLAIMS) PRELIMINARY ASSESSMENT REPORT Blaine County State of Idaho Department of Environmental Quality December 2009 Submitted to: U. S. Environmental Protection Agency Region 10 1200 Sixth Avenue Seattle, WA 98101
Transcript of Idahoan Group Mines Final PA - Idaho Department of ...

IDAHOAN GROUP
(Aka IDAHOAN, RICHMOND LODE, EUREKA, HOMESTAKE, WHALE, AND GARFIELD PATENTED CLAIMS)
PRELIMINARY ASSESSMENT REPORT
Blaine County State of Idaho
Department of
Environmental Quality December 2009
Submitted to:
U. S. Environmental Protection Agency Region 10
1200 Sixth Avenue Seattle, WA 98101

STATE OF IDAHO
DEPARTMENT OF ENVIRONMENTAL QUALITY
1410 North Hillon • Boise, Idaho 83706 • (208) 373-0502 C.L. "Butch" Otter, Governor Toni Hardesty, Director
December 22, 2009
Daniel Henry 308 North 2nd Avenue Hailey, Idaho 83333
RE: Site Assessment of the Idahoan Group, aka Idahoan, Richmond Lode, Eureka, Homestake, Whale and Garfield patented claims.
Dear Mr. Henry:
In 2006 the Idaho Department of Environmental Quality (IDEQ) and U.S. Environmental Protection Agency conducted site visits ofmines in the Croy Creek Area (Croy Creek PAiSI 2008). Subsequently DEQ has completed a more in depth review of historical mining data and geological information at the above referenced claims. The following is a site specific report regarding these claims.
Based on existing conditions and uses, historic information, data observations made during DEQ's site visit, soil sample analysis, size of the mine, potential contaminant pathways, and potential exposures to ecological and human receptors, DEQ recommends that further investigation is conducted at the Idahoan Group mines if the sites are to be developed for residences or if recreational activities increase. Otherwise, DEQ determines the Idahoan mine and the surrounding claims as No Remedial Action is Planned (NRAP).
However, there are numerous mine openings and physical hazards that may pose a risk to recreationists and future residents, if any. These mine openings should be properly managed or restricted to prevent injuries.

Mr. Dan Henry Idahoan Mine December 22, 2009 Page 2 of2
IDEQ very much appreciates your cooperation and your approval for our access. I look forward to addressing any questions you may have regarding our findings. You may contact me at (208) 373-0554.
-/j::IJj/Bruce A. sc~L; Mine Waste Projects Coordinator Waste Management and Remediation Division
BAS:TE:tg G:\Waste & Remediation\Bruce Schuld\ldahoan Group
attachment
cc: Ken Marcy, Environmental Protection Agency file

i
Table of Contents List of Acronyms ........................................................................................................................... iv Section 1. Introduction............................................................................................................. 1 Section 2. Ownership and Status ............................................................................................. 2 Section 3. Mine Site History.................................................................................................... 4 Section 4. Climate.................................................................................................................... 5 Section 5. General Geology ..................................................................................................... 6
5.1 Structure.......................................................................................................................... 7 Section 6. Current and Potential Future Land Uses................................................................. 9
6.1 Current Land Uses .......................................................................................................... 9 6.2 Future Land Use.............................................................................................................. 9
Section 7. Site Conditions and Waste Characterization......................................................... 10 Section 8. Soil/Sediment Sample Collection ......................................................................... 16
8.1 Soil Analysis ................................................................................................................. 16 8.2 Sediment Analysis ........................................................................................................ 17
Section 9. Surface Water Sample Collection......................................................................... 21 Section 10. Pathways and Environmental Hazards.................................................................. 22
10.1 Ground Water Pathways ............................................................................................... 22 10.2 Surface Water Pathways ............................................................................................... 26 10.3 Air Quality Pathways.................................................................................................... 26 10.4 Soil Exposure ................................................................................................................ 26 10.5 Domestic Wells and Public Water Supplies ................................................................. 27 10.6 Residences, Schools and Day Care Facilities ............................................................... 27 10.7 Wetlands ....................................................................................................................... 27 10.8 Sensitive Species (Plant and Animal) ........................................................................... 29 10.9 Fisheries ........................................................................................................................ 29 10.10 Sensitive Waterways................................................................................................. 29 10.11 Livestock Receptors.................................................................................................. 29
Section 11. Summary and Conclusions ................................................................................... 31 Section 12. References............................................................................................................. 32

ii
List of Figures Figure 1. Location of the Idahoan Group mines with USFS parcel data overlay. (Photo source: Blaine County NAIP 2004)............................................................................................................. 3 Figure 2. General Surface Geology of the Idahoan Group. (Map source: USGS 24k) .................. 8 Figure 3. Drawing of Idahoan sampling locations, adits, and waste rock piles (from E&E, 2007)........................................................................................................................................................ 14 Figure 4. Drawing of Eureka and Whale sampling locations, adits, and waste rock piles (from E&E, 2007). .................................................................................................................................. 15 Figure 5. Drinking Water Well locations and source water delineations (Map source: NIAP 2004)................................................................................................................................... 25 Figure 6. Wetlands and 15-Mile TDL map. (Source Fair 100k, Sunv 100k, NIAP 2004)........... 28 Figure 7. Sensitive species near the Idahoan Group mines. (Source: Fair 100k, Sunv 100k, USGS 24K Topo)..................................................................................................................................... 30

iii
List of Tables Table 1: Total Recoverable Metals Analysis ................................................................................ 19

iv
List of Acronyms
Acronym Definition amsl above mean sea level BLM United States Department of the Interior, Bureau of Land
Management DEQ Department of Environmental Quality EPA United States Environmental Protection Agency gpm gallons per minute IDTL Initial Default Target Levels IGS Idaho Geological Survey MCL Maximum Concentration Limit PPE Probable Point of Entry HHSL Human Health Medium-Specific Screening Levels TCLP Toxicity Characteristic Leaching Procedure TDL Target Distance Limit TMDL Total Maximum Daily Load USFS United States Department of Agriculture, Forest Service WRP Waste rock pile

1
Section 1. Introduction
This document presents the results of the preliminary assessment (PA) for the Idahoan Group of mines (aka Idahoan, Richmond Lode, Eureka, Homestake, Whale, and Garfield patented claims). The Idaho Department of Environmental Quality (DEQ) is contracted by Region 10 of the United States Environmental Protection Agency (EPA) to provide technical support for completion of preliminary assessments at various mines within the Mineral Hill Mining District in Blaine County, Idaho.
DEQ often receives complaints or information about sites that may be contaminated with hazardous waste. These sites include abandoned mines, rural airfields that have served as bases for aerial spraying, old landfills, illegal dumps, and abandoned industrial facilities that have known or suspected releases.
In February 2002, DEQ initiated a Preliminary Assessment Program to evaluate and prioritize assessment of such potentially contaminated sites. Due to accessibility and funding considerations, priority is given to sites where potential contamination poses the most substantial threat to human health or the environment. Priority was also given to mining districts where groups or clusters of sites could be assessed on a watershed basis.
For additional information about the Preliminary Assessment Program, see the following:
http://www.deq.idaho.gov/waste/prog_issues/mining/pa_program.cfm
The Idahoan Group is located in the Bullion Gulch sub-basin of the Croy Creek drainage basin in Sections 14, 15, 22, and 23 of Township 2 North, Range 17 East, Blain County, Idaho. The group of mines is accessible by vehicle through Bullion Gulch by way of a dirt road that intersects Croy Creek Road, approximately 4.5 miles west of Highway 75 in Hailey, Idaho (Figure 1). In 2006 DEQ participated in a site visit to the Idahoan Group and sampling conducted by Ecology and Environment Inc. (E&E, 2007). DEQ is assimilating the information collected during that site visit and sampling with available historic and geological data collected during desk top research

2
Section 2. Ownership and Status
Based on a limited search, Daniel Henry is the current owner of the patented claims of the Idahoan Group (Blaine County, 2009).
Owner Mine/Claim Name Parcel Number Latitude Longitude Partial Determination
Idahoan Group aka
Idahoan patented claim RP1M000000069A 43.499754 -114.406429 NRAP
Richmond Lode patented claim RP1M000000069A 43.501015 -114.404809 NRAP
Eureka patented claim RP1M0000000700 43.501596 -114.408021 NRAP
Whale patented claim RP1M0000000630 43.505026 -114.413791 NRAP
Garfield patented claim RP1M000000070 43.506137 -144.415091 NRAP
Daniel Henry 308 North 2nd Avenue Hailey ID 83333
Homestake patented claim RP1M000000069A 43.503531 -114.412727 NRAP
NRAP – no remedial action planed
3
Figure 1. Location of the Idahoan Group mines with USFS parcel data overlay. (Photo source: Blaine County NAIP 2004)

4
Section 3. Mine Site History
The amount of history DEQ found addressing the Idahoan Group mine’s is limited primarily to Umpleby and others, 1930 with other documents referencing Umpleby and others. The Idahoan on the same northwest trending lode system as the Eureka, Whale, Homestake, Richmond Lode, Garfield, Bay State, Iris, and Arizona. All these claims were owned and operated by the New York-Idaho Exploration Co. in the 1880s through the 1920s, with the exception of the Arizona and Iris claims which were owned by Charles Cuneo.
Umpleby and others (1930) reported the Idahoan mine produced $899,528 worth of ore between 1880 and 1878 based of data provided by MR. E. Daft. The Eureka produced $141.162 worth of ore, the Whale $10,476, and the Garfield $1,909. “…from 1882 to 1906 the Idahoan produced 9,147 tons of ore and concentrate containing 591,547 ounces of silver and 10,548,390 pounds of lead…” The Whale produced 27,410 ounces of silver and 311,809 pounds of lead; the Garfield 4,053 ounces of silver and 43,003 pounds of lead; and the Eureka produced 82,733 ounces of silver and 1,199356 pounds of lead. In the 1920’s the Eureka produced 20 ounces of gold, 114,962 ounces of silver, 1,755,151 pounds of lead, and 12,268 pounds of copper. No data was available for the other claims.
The development at the Eureka mine comprises a main tunnel about 1,100 feet long, with over 300 feet of crosscuts leading from it, and an inclined shaft to a vertical depth of 435 feet, with six levels, aggregating perhaps 2,000 feet of working, turned from it. …The shaft is now partly caved and inaccessible. There are some short tunnels…. The Whale tunnel is over 1,600 feet long with crosscuts and stopes off it, and there are several other tunnels, in this claim. In the Idahoan there are two tunnels, each about 230 feet long, which can still be entered [in 1930], and some others that are inaccessible. Above one of the tunnels is a large stope. The shaft from which the principal workings extend is now completely caved. There are reported to have been eight levels. A shaft was sunk on the vein to a depth between 300 and 400 feet. About 500 feet northwest of the bottom of this shaft sinking was resumed. Total depth attained on the vein was about 700 feet…
Umpleby and others, 1930
The Idahoan Group lode has several off-shoots and is cut by a number of faults with minor displacement. The lode, as with most lodes in the district, is shear zones with little evidence of mineralization at some locations and excellent lead-silver ore at others. The ore is principally low-grade material averaging about 8 per cent lead and 9 ounces of silver per ton with about a quarter of the ore 50 to 60 percent lead and 60 to 65 ounces of silver per ton (Umpleby and others, 1930).

5
Section 4. Climate
Climate information provided in this section is based on a climatological summary for Hailey, Idaho which was obtained from the National Oceanic and Atmospheric Administration (NOAA), National Climatic Data Center. The climatological data collected at the Hailey Airport (elevation 5,328 amsl), is for the period of 1951 through 1980. Each site for which this data is used is subject to more localized meteorological conditions that result from difference in elevation, orientation of slopes in watershed, vegetation and other factors. The region is characterized by short cool dry summers and very cold winters. The total annual precipitation measured at the Hailey Airport averages 16.2 inches. The majority of precipitation occurs as snow. Total annual snowfall averages 78.2 inches with most snowfall occurring in December and January. The driest months are July, August and September. Based on records from 1951 to 1980, the average annual temperature measured at the Hailey Airport is 43 degrees Fahrenheit (F). The lowest temperature recorded for this period was – 28 degrees F in 1962. The highest temperature for this period of record was 100 degrees F in 1953. January is the coldest month with an average temperature of 19.5 degrees F. July is the hottest month with an average temperature of 67 degrees F.

6
Section 5. General Geology
Numerous geology and mineral resource studies of the Wood River and adjacent areas have been accomplished. Geologic studies have been conducted to investigate mineral deposits (Lindgren, 1900 & 1933; Umpleby et al, 1930; Anderson and Wagner, 1946; Anderson et al, 1950; Hall et al, 1978; Wavra and Hall, 1989; Link and Worl, 2001; Worl and Lewis, 2001); individual formations and units (Hall et al, 1974; Sandberg et al, 1975; Wavra and Hall, 1986; Worl and Johnson, 1995); quadrangles (Batchelder and Hall, 1978; Mitchell et al, 1991; Kiislgaard et al, 2001) and to compile regional information (Rember and Bennett, 1979). Preliminary and environmental assessment investigations have been conducted to assess current and potential impacts from historic mining in the region (Mitchell and Gillerman, 2005; DEQ, 2002 & 2008; E&E, 2007).
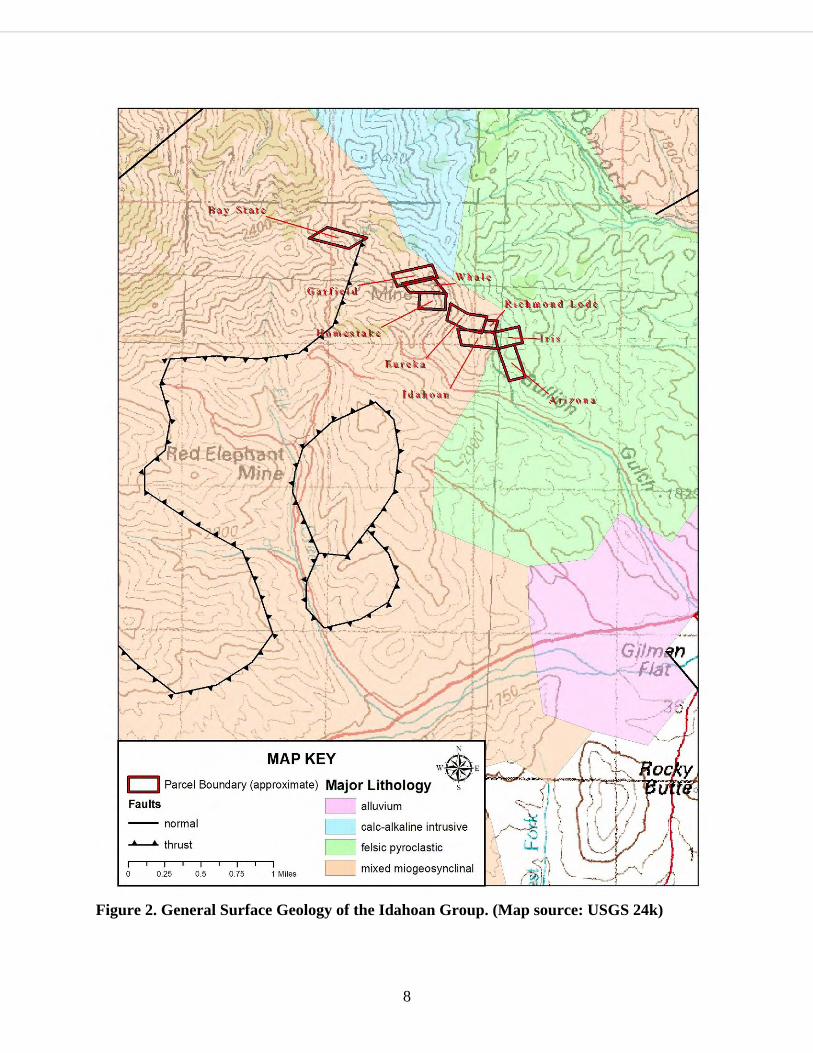
Generally speaking the Croy Creek basin is hosted by sheared and altered quart monzonite intrusives, with a basal chert-pebble conglomerate; of the Wood River formation. The lower portions of ephemeral drainages contain thick layers of colluvial fill, which are predominantly sandy remnants of the decomposed quartz monzonite. The colluvium is extremely erodible, and generally deeply incised. Figure 2 shows the generalized geology of the Idahoan Mine area.
The Hailey-Bellevue mineral belt is underlain by a varied assemblage of sedimentary and igneous rocks, which, except for volcanics of mid-Tertiary age and some still younger unconsolidated sedimentary rocks, are all older than the ore deposits. The earlier rocks include fairly wide exposures of the Milligen and Wood River formations that host many of the ore deposits in the Wood River region. They also host rather large intrusive bodies of diorite and quartz monzonitic rock which are regarded as outliers of the Idaho batholith. There is a younger group of intrusive rocks which are of more pertinent interest because of their close association with the mineralization.…In addition to the Milligen formation (Mississippian age) and the Wood River formation (Pennsylvanian age), the area contains some strata in and beneath a series of Tertiary volcanics (Oligocene) and much poorly consolidated and unconsolidated slope wash, terrace gravels, and stream alluvium of Quaternary age.
Anderson, 1950, p. 2
Anderson (1950, p. 7) went on to note that, “The folding within the area is comparatively simple and consequently faulting constitutes the outstanding feature.”
To the south of the mine, a thrust fault separates the overlying sediments with the underlying intrusives. In discussion of the Red Elephant and Bullion areas, which are very similar in nature to the Idahoan Mine area, Link and Worl (2001) described geologic and historic information relating to stratigraphy and mineralization relationships within Dollarhide sedimentary sequences in the Mineral Hill district.
The Bullion mineralized area...is underlain by the lower and middle members of the Pennsylvanian and Permian Dollarhide Formation, which is folded into upright and west-overturned map scale folds….The lower member of the Dollarhide Formation,

7
hosts most of the mineralized rock (Skipp and others, 1994). Fryklund (1950), following Umpleby and others (1930), labeled these rocks as Wood River Formation, though he notes, “it is possible that Milligen formation is also present” (p. 64). An unpublished map (circa 1970) of W.E. Hall labels the dark-colored rocks in the Bullion area as Milligen Formation. Hall (1985) showed the rocks as Dollarhide Formation, and Wavra and Hall (1989) showed them as upper member, Dollarhide Formation.
The lower member of the Dollarhide Formation in the Bullion area contains fine- to medium-grained sandstone, black siltite and black limestone or marble. A distinctive lithology in the lower member is channelized disorganized conglomerate that contains mainly intrabasinal soft-sediment clasts of siltstone and sandstone. The lower member occupies both sides of Bullion Gulch and the central part of Red Elephant Gulch. The rocks east of Bullion Gulch are mapped as being stratigraphically high in lower member Dollarhide Formation, because the middle member quartzite is not present. They are intruded on the east by the Deer Creek stock.
In the Bullion area the middle member of the Dollarhide Formation (regionally about 300 m [984 ft] thick) contains silicified sandstone that crops out as light-gray to brown quartzite that forms the high ridge between Red Elephant and Bullion Gulches. These rocks were shown as Wood River Formation on the map of Hall (1985). The mineralized veins of the Bullion area do not extend southward into the middle member Dollarhide Formation. The middle member, much less silicified, is also present in west-dipping beds on the ridge of Kelly Mountains (Link and Worl, 2001, pp. 12 & 14).
5.1 Structure Fryklund (1950, pp. 65-66) noted the following in regards to the structure of the rocks:
The most obvious and significant structural features of the area are the major faults or fault zones which divide the area into a number of distinct blocks...The age of the oldest faults are to be placed as pre-intrusive and possibly all the major faulting is pre-intrusive...All of the major faults are probably pre-mineral as well as pre-intrusive.
8
Figure 2. General Surface Geology of the Idahoan Group. (Map source: USGS 24k)

9
Section 6. Current and Potential Future Land Uses
6.1 Current Land Uses Current land uses in the Bullion Creek sub-drainage includes biking, hiking, hunting, horseback riding and off-road vehicle (ORV) touring. The Idahoan and surrounding mines lie within the Bureau of Land Management’s Bullion grazing allotment (BLM, 2009), so some grazing is likely occurring at the mines.
The most direct route approaches Bullion Gulch from Croy Creek. Public access to the claims is not restricted. Ready access is afforded from Bullion Gulch Road. During a DEQ’s site visit to near by mines in the fall of 2009, staff noted abundant forest grouse and several deer in the area.
6.2 Future Land Use Future land use could potentially include some year-round and/or seasonal homes on the private parcels of property in the sub-basin, owing to its close proximity to Hailey and homes presently constructed at the mouth of Bullion Gulch. It appears likely that unauthorized access to the property may increase as the local populations and the recreation industry expands.

10
Section 7. Site Conditions and Waste Characterization
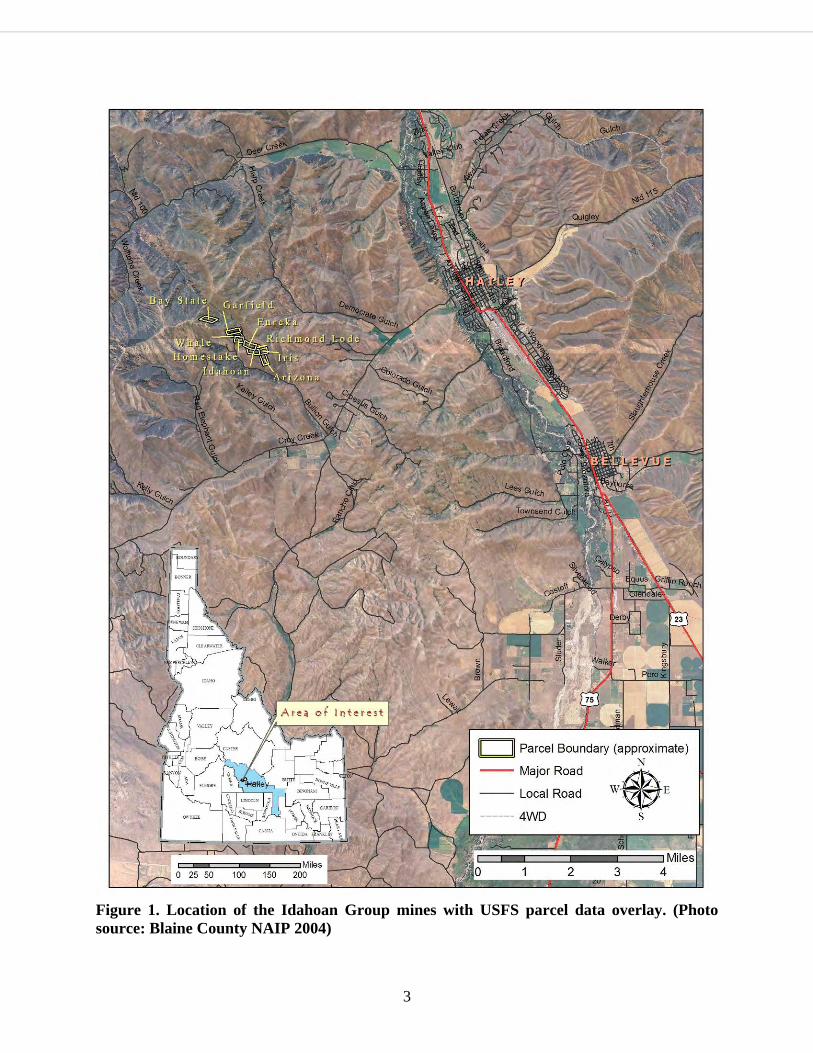
The Idaho Geologic Survey (IGS) visited most of the Idahoan Group mines in 1994 that resulted in a site report, and DEQ with E&E (2007) conducted site inspections in July 2006 that was reported in E&E’s Croy Creek Site Inspection Report (2007). During DEQ and E&E’s visit, they collected two background, ten waste rock pile, and four probable point of entry soil/sediment samples. E&E reports descriptions of workings and samples for the Idahoan that more likely on or collected from the Iris and Richmond Lode. This conclusion is based on the parcel boundary as shown on Blaine County’s parcel map (2009), Plate 20 in Umpleby and others (1930), and Figure 3, a site drawing developed by E&E that shows the relative location of mine workings and sample locations for the Idahoan. Figure 4 is a site drawing developed by E&E that shows the relative location of mine workings and sample locations for the Eureka and Whale. The other claims were not sampled. The following descriptions are from the E&E report which included a summary if the IGS visit.
The site [Idahoan, Richmond Lode, and Iris claims] consists of a big dump on the north side of the gulch. On the east side of the dump is a pile of brick marking a hoist house and a caved shaft. Across the gulch to the south are three or four more small dumps and caved adits, each with several hundred feet of workings. The main dump is several hundred feet long but only 15 to 20 feet wide and 50 feet thick (Summarized from the IGS site visit).
The Idahoan Mine contained approximately 15 waste rock piles (Waste Rock Piles 1 through 15) and 14 adits (Adits 1 through 14); four of which are shafts …. The adits were dry and were not sampled. In accordance with the SQAP, only select waste rock piles were sampled. Most of the waste rock piles at this mine were small piles at adit portals. The volume of the sampled sources; and their associated sample numbers and analytical results are presented below:
� Waste Rock Pile 1 – The dimensions of this waste rock pile were not recorded on the field data sheet; therefore, it is estimated from the field drawing that more than 10,000 cubic yards of waste rock were present. Three waste rock samples (IMWR01SS, IMWR02SS, and IMWR03SS) were collected from this source. Analytical results from sample IMWR01SS indicate the presence of nine TAL metals at significant concentrations with respect to background concentrations …. Analytical results from sample IMWR02SS indicate the presence of ten TAL metals at significant concentrations with respect to background concentrations …. Analytical results from sample IMWR03SS indicate the presence of eleven TAL metals at significant concentrations with respect to background concentrations …. All three samples contained significant concentrations of antimony, arsenic, lead, manganese, mercury, selenium, silver, thallium, and zinc.

11
� Waste Rock Pile 3 - This waste rock pile measured approximately 35 feet in length by 88 feet in width having a thickness of approximately 108 feet on land with an approximate 30 degree slope. The estimated volume of this source is calculated to be 1,232 cubic yards. One waste rock sample, IMWR04SS, was collected from this source. Analytical results from sample IMWR04SS indicate the presence of nine TAL metals at significant concentrations with respect to background concentrations ….
� Waste Rock Pile 5 – This waste rock pile measured approximately 60 feet in length by 20 feet in width having a thickness of approximately 40 feet on land with an approximate 25 degree slope. The estimated volume of this source is calculated to be 148 cubic yards. One waste rock sample, IMWR05SS, was collected from this source. Analytical results from sample IMWR05SS indicate the presence of eight TAL metals at significant concentrations with respect to background concentrations….
The remaining 12 waste rock piles were not sampled; however, their measurements and volumes are provided below:
� Waste Rock Pile 2 – This waste rock pile measured approximately 15 feet in length by 80 feet in width having a thickness of approximately 10 feet on land with an approximate 35 degree slope. The estimated volume of this source is calculated to be 52 cubic yards.
� Waste Rock Pile 4 – This waste rock pile measured approximately 50 feet in length by 10 feet in width having a thickness of approximately 10 feet on land with an approximate 30 degree slope. The estimated volume of this source is calculated to be 19 cubic yards.
� Waste Rock Pile 6 – This waste rock pile measured approximately 50 feet in length by 50 feet in width having a thickness of approximately 23 feet on land with an approximate 30 degree slope. The estimated volume of this source is calculated to be 213 cubic yards.
� Waste Rock Pile 7 – This waste rock pile measured approximately 60 feet in length by 20 feet in width having a thickness of approximately 10 feet on land with an approximate 30 degree slope. The estimated volume of this source is calculated to be 44 cubic yards.
� Waste Rock Pile 8 – This waste rock pile measured approximately 35 feet in length by 15 feet in width having a thickness of approximately 8 feet on land with an approximate 25 degree slope. The estimated volume of this source is calculated to be 13 cubic yards.
� Waste Rock Pile 9 – This waste rock pile measured approximately 40 feet in length by 10 feet in width having a thickness of approximately 8 feet on land with an approximate 25 degree slope. The estimated volume of this source is calculated to be 10 cubic yards.
� Waste Rock Pile 10 – This waste rock pile measured approximately 26 feet in length by 15 feet in width having a thickness of approximately 3 feet

12
on land with an approximate 35 degree slope. The estimated volume of this source is calculated to be 5 cubic yards.
� Waste Rock Pile 11 – This waste rock pile measured approximately 78 feet in length by 10 feet in width having a thickness of approximately 25 feet on land with an approximate 35 degree slope. The estimated volume of this source is calculated to be 84 cubic yards.
� Waste Rock Pile 12 – This waste rock pile measured approximately 32 feet in length by 10 feet in width having a thickness of approximately 20 feet on land with an approximate 30 degree slope. The estimated volume of this source is calculated to be 24 cubic yards.
� Waste Rock Pile 13 – This waste rock pile measured approximately 43 feet in length by 16 feet in width having a thickness of approximately 40 feet on land with an approximate 30 degree slope. The estimated volume of this source is calculated to be 102 cubic yards.
� Waste Rock Pile 14 - This waste rock pile measured approximately 48 feet in length by 25 feet in width having a thickness of approximately 15 feet on land with an approximate 30 degree slope. The estimated volume of this source is calculated to be 67 cubic yards.
� Waste Rock Pile 15 - This waste rock pile measured approximately 60 feet in length by 25 feet in width having a thickness of approximately 11 feet on land with an approximate 30 degree slope. The estimated volume of this source is calculated to be 61 cubic yards.
Eureka Mine. The mine has an inclined shaft and a dry, caved adit on a large dump. The hoist is intact, and the shaft is caved approximately 15 feet down. The dump covers approximately 0.75 acre and is approximately 20 feet deep. No water issues from the site. … The thickness of the dump ranged from 69 feet to 102 feet. A wooden structure is located at the top of the dump. There is a closed adit approximately 100 feet northwest of the wooden structure. Another wooden structure, presumed to be an old hotel, was found to the north of the dump.
The Eureka Mine contained three waste rock piles (Waste Rock Piles 1, 2, and 3) and two adits (Adits 1 and 2…). The adits were dry and were not sampled. Further, the smaller waste rock pile (Waste Rock Pile 3) was not sampled. The volume of the sampled sources; and their associated sample numbers and analytical results are presented below:
� Waste Rock Pile 1 – This waste rock pile measured approximately 238 feet in length by an average of 50 feet in width having an average thickness of approximately 85 feet on land with an approximate 30 degree slope. The estimated volume of this source is calculated to be 3,746 cubic yards. Two waste rock samples (EMWR01SS and EMWR02SS) were collected from this source. Analytical results from samples EMWR01SS and EMWR02SS indicate the presence of the same ten TAL metals at

13
significant concentrations with respect to background concentrations in each sample ….
� Waste Rock Pile 2 – This waste rock p ile measured approximately 231 feet in length by 58 feet in width having a thickness of approximately 65 feet on land with an approximate 30 degree slope. The estimated volume of this source is calculated to be 3,225 cubic yards. One waste rock sample, EMWR03SS, was collected from this source. Analytical results from sample EMWR03SS indicate the presence of ten TAL metals at significant concentrations with respect to background concentrations ….
Whale Mine. A large dump with an old building was noted by the road just north of the Eureka Mine in Bullion Gulch. The adit was caved and dry. A dump crosses the gulch, covers approximately 0.75 acre, and is approximately 20 feet deep. …The main dump has an average thickness of 50 feet. There is a small dump located approximately 50 feet west of the large dump, and two additional small dumps are located to the southwest of the large dump.
The Whale Mine contained two waste rock piles (Waste Rock Piles 1 and 2) and one adit (Adit 1…). The adit was dry and was not sampled. Further, the smaller waste rock pile (Waste Rock Pile 2) was not sampled. The volume of the sampled source; and its associated sample numbers and analytical results are presented below:
� Waste Rock Pile 1 – This waste rock pile measured approximately 175 feet in length by 63 feet in width having a thickness of approximately 50 feet on land with an approximate 30 degree slope. The estimated volume of this source is calculated to be 2,042 cubic yards. Two waste rock samples (WMWR01SS and WMWR02SS) were collected from this source. Analytical results from sample WMWR01SS indicate the presence of eleven TAL metals at significant concentrations with respect to background concentrations…. Analytical results from sample WMWR02SS indicate the presence of nine TAL metals at significant concentrations with respect to background concentrations ….
E&E, 2007

14
Figure 3. Drawing of Idahoan sampling locations, adits, and waste rock piles (from E&E, 2007).

15
Figure 4. Drawing of Eureka and Whale sampling locations, adits, and waste rock piles (from E&E, 2007).

16
Section 8. Soil/Sediment Sample Collection
Sixteen soil and sediment samples were collected from the Idahoan and potentially adjacent properties, the Eureka, and the Whale in 2006 during the E&E site inspection. Soil samples included two background, ten waste rock, and four probable point of entry. Background samples were collected north of Idahoan Adits 8 and 9 as shown on Figure 3. Only soil samples IMWR01SS and INWR02SS and sediment sample IMPP02SD are directly attributable to the Idahoan. Other samples collected at locations noted in Section 7 or shown in Figure 3 are believed to be associated with the Iris and Richmond claims or the location is uncertain (text, drawing, and/or coordinates do not correlate).
E&E’s sample naming convention is as follows: The first two letters represent the mine IM – Idahoan Mine EM – Eureka Mine WM – Whale Mine The next two letters are a description of the sample type BG – background WR – waste rock PP – probable point of entry The numbers are a sequential numbering system And the final two letters represent the sampled media SS – soil SD – sediment So sample IMWR02SS was the second soil sample collected at the Idahoan from a waste rock pile.
8.1 Soil Analysis A summary of laboratory results from E&E soil and sediment samples are presented in Table 1, for samples DEQ has some confidence in the collection location.
Laboratory analysis of the soil and sediment background samples (IMBG01SS and IMBG01SD) showed arsenic, cadmium, iron, lead, magnesium, manganese, mercury, and silver concentrations in exceedance of Idaho’s Initial Default Target (IDTLs). Arsenic exceeded both the IDTLS and EPA Region 6’s Preliminary Human Health Screening Levels (HHSLs) in background sample IMBG01SD. Background sediment sample IMBG01SD also exceeded the IDTL for thallium. IMBG01SS selenium concentration exceeded the IDTL.
IDTLs are very conservative risk based soil screening levels developed by the state of Idaho to provide preliminary screening levels for contaminants. HHSLs used in this report are health based screening levels developed by EPA for a residential scenario.

17
The laboratory analytical result’s of soil samples IMWR01SS and IMWR02SS collected from the Idahoan main waste rock pile, showed concentrations of arsenic, iron, lead, and manganese above IDTLs, HHSLs and the background sample concentrations (IMBG01SS). Antimony, magnesium, mercury, nickel, selenium, silver, and zinc concentrations were above IDTLs and background in both soil samples. Concentrations for many of these constituents were three times greater than (>3X) the background concentration (See Table 1). Calcium, chromium, copper, sodium, and vanadium were above background concentrations in both soil samples. Cadmium and thallium exceeded all three comparative values in sample IMWR02SS and background and IDTLS in sample IMWR01SS.
Laboratory analysis of soil samples collected from the Eureka waste rock piles resulted in arsenic and lead concentrations exceeding all three screening criteria in each of the three samples. Manganese concentrations exceeded the three screening levels in samples EMWR01SS, and EMWR02SS and the IDTLs and background levels in sample EMWR03SS. Zinc and cadmium concentrations exceeded all three screening levels in sample EMWR01SS and IDTLs and background in the other Eureka soils samples. Antimony, magnesium, mercury, silver, and thallium concentrations were above IDTLs and background. The majority of these analytes were detected at concentrations >3X background. Selenium was detected in EMWR01SS and EMWR03SS at concentrations above IDTLs and >3X background. Selenium in EMWR02SS was above the IDTL and below background. Calcium, chromium, copper, iron, nickel, and sodium concentrations were all above the background sample concentration in all three soil samples. Beryllium was above background in EMWR01SS and EMWR02SS. Cobalt and vanadium were above background in EMRW02SS and EMWR02SS and EMWR03SS, respectively.
Similar to the Eureka, analysis of Whale waste rock soils resulted in arsenic and lead exceeding all three screening criteria with the addition of manganese. Thallium concentrations exceeded all three criteria in WMWR02SS and IDTLs and background in WMWR01SS. All analytes that exceeded HHSLs also were >3X background. Antimony, cadmium, magnesium, mercury, silver and zinc concentrations were greater than IDTLs and background in both soil samples. Selenium concentrations were above IDTLs in both soil samples and above background in WMWR01SS. Beryllium, calcium, chromium, copper, iron, and sodium concentrations in both soil samples were below IDTLs and HHSLs, yet above background. Aluminum, cobalt, nickel, and vanadium concentrations were above background in only one or the other soil sample.
Sediment Analysis Idahoan sediment samples IMPP01SD and IMPP02SD varied considerably in metal constituents with IMPP02SD (furthest upstream sample) being more consistent with the background sample. Antimony, barium, selenium, and zinc were above background levels in IMPPO2SD. Silver and thallium were above both IDTLs and background. Cadmium, iron, magnesium, and manganese were above IDTLs. Lead concentrations were above all three comparative values for both sediment samples.
IMPP01SD had arsenic, cadmium, manganese, and thallium concentrations in addition to lead above all three comparative values. Antimony, iron, magnesium, mercury, selenium, and silver

18
were above both IDTLs and background. Beryllium, calcium, chromium, cobalt, cooper, and zinc were above background.
The Eureka sediment sample (EMPP01SD) was probable the most contaminated sediment sample with only one analyte (vanadium) below all three screening criteria. Arsenic and lead concentrations were above all three screening criteria with another five analytes that exceeded two of the screening criteria. Three analytes had concentrations that were >3X background.
The Whale sediment sample had no analytes exceed all three criteria. Arsenic, cadmium, and manganese in this sample only exceeded the IDLT criteria. Lead, magnesium, mercury, selenium, silver, and thallium exceeded both the IDTLs and background. Antimony, iron, potassium, and zinc exceeded background.

19
Table 1: Total Recoverable Metals Analysis Idahoan Group Soil/Sediment Samples
Sample No.
IDTLs
EPA Region 6 HHSLs
Background
Idahoan
Description Units: mg/Kg IMBG01SS IMBG01SD IMWR01SS IMWR02SS IMPP01SD IMPP02SD Aluminum NSC 76,000 9,440 8,250 9,230 9,340 7,380 5,150 Antimony 4.77 314 1.7 JQ 2.0 JQ 26.5 JL 21.2 JL 36.5 JL 3.0 JQ Arsenic 0.391 21.65 19.8 22.6 391 520 922 11.5 Barium 896 15,642 119 74.9 13.0 JQ 7.7 JQ 19.5 JQ 106 Beryllium 1.63 150 0.49 JQ 0.47 JQ 0.49 0.54 0.51 0.28 JQ Cadmium 1.35 39 3.3 3.9 16.6 47.9 39.9 3.9 Calcium NSC NSC 2,770 7,630 4,950 9,000 11,500 7,420 Chromium NSC NSC 13.1 16.3 17.1 34.4 20.8 11.5 Cobalt NSC 900 5.6 JK 4.1 JQ 4.8 JK 4.6 JK 4.5 JQ 2.3 JQ Copper 921 2,900 27.6 34.4 118 89.5 165 27.8 Iron 5.76 55,000 13,100 12,600 67,400 69,800 45,000 7,450 Lead 49.6 400 50.9 JL 72.9 JL 10,500 JL 3,560 JL 37,500 571 JL Magnesium 223 NSC 2,600 2,060 5,890 6,530 4,160 1,980 Manganese 223 3,239 531 618 3,510 3,900 6,960 529 Mercury 0.00509 23 0.049JQ 0.088 JQ 0.43 1.1 0.57 0.30 Nickel 59.1 1,600 19.2 16.5 76.3 88.2 46.4 11.0 Potassium NSC NSC 1,970 JK 1,510 JH 478 JH 344 JQ 593 1,530 Selenium 2.03 391 3.5 JK 0.44 JQ 14.3 JL 4.9 JL 4.2 JL 0.85 JQ Silver 0.189 391 0.28 JQ 0.51 JQ 42.5 24.5 102 2.2 Sodium NSC NSC 79.8 JQ NA 116 JQ 206 JQ NA NA Thallium 1.55 5.5 1.1 JQ 2.6 4.7 5.6 3.5 2.7 U Vanadium NSC 390 65.0 86.6 184 298 33.5 42.3 Zinc 886 23,464 261 318 3,130 8,440 421 507

20
Idahoan Group Soil/Sediment Samples Sample No.
IDTLs
EPA Region
6 HHSLs
Background
Eureka Whale
Description Units: mg/Kg IMBG01SS IMBG01SD EMWR01SS EMWR02SS EMWR03SS EMPP01SD WMWR01SS WMWR02SS WMPP01SDAluminum NSC 76,000 9,440 8,250 6,240 15,600 10,100 14,100 11,900 7,450 8,080 Antimony 4.77 314 1.7 JQ 2.0 JQ 62.6 JL 9.3 JL 8.6 JL 2.8 JL 8.4 JL 66.8 JL 2.9 JQ Arsenic 0.391 21.65 19.8 22.6 1,300 702 309 67.2 433 362 21.5 Barium 896 15,642 119 74.9 8.7 JQ 15.0 JQ 10.2 JQ 103 16.8 JQ 14.7 JQ 68.6 Beryllium 1.63 150 0.49 JQ 0.47 JQ 0.53 0.67 0.47 JQ 0.89 JQ 0.64 0.54 0.25 JQ Cadmium 1.35 39 3.3 3.9 139 23.4 34.6 7.6 22.0 35.2 2.1 Calcium NSC NSC 2,770 7,630 18,900 29,500 5,190 9,030 10,100 74,600 3,200 Chromium NSC NSC 13.1 16.3 13.8 22.0 20.6 20.6 22.1 14.3 13.0 Cobalt NSC 900 5.6 JK 4.1 JQ 3.0 JQ 5.7 5.5 8.1 JQ 8.3 1.4 JQ 3.7 JQ Copper 921 2,900 27.6 34.4 753 115 55.9 36.5 61.3 270 10.4 Iron 5.76 55,000 13,100 12,600 51,400 41,300 53,500 26,600 43,800 50,800 16,600 Lead 49.6 400 50.9 JL 72.9 JL 60,800 JL 2,050 JL 4,130 JL 452 JL 2,030 JL 23,000 JL 389 JL Magnesium 223 NSC 2,600 2,060 3,780 JL 21,700 JL 7,950 JL 7,400 JL 11,200 JL 13,600 JL 4,700 JL Manganese 223 3,239 531 618 4,760 3,300 3,030 933 3,570 8,510 450 Mercury 0.00509 23 0.049JQ 0.088 JQ 3.3 1.4 1.1 0.17 JQ 0.56 0.64 0.12 U Nickel 59.1 1,600 19.2 16.5 27.4 35.8 36.8 24.1 54.6 10.2 9.4
Potassium NSC NSC 1,970 JK 1,510 JH 277 JQ 757 JH 331 JQ 4,650 490 JQ 656 JH 3,120 JH Selenium 2.03 391 3.5 JK 0.44 JQ 14.3 JL 2.6 JQ 50.3 JL 2.7 JQ 6.4 JL 2.5 JQ 4.3 UJL Silver 0.189 391 0.28 JQ 0.51 JQ 134 37.9 17.3 3.9 15.4 131 1.7 Sodium NSC NSC 79.8 JQ NA 566 141 JQ 167 JQ NA 111 JQ 193 JQ NA
Thallium 1.55 5.5 1.1 JQ 2.6 4.3 5.2 3.4 0.73Q 3.0 8.1 3.1 U Vanadium NSC 390 65.0 86.6 60.6 75.5 230 64.3 112 16.0 39.3
Zinc 886 23,464 261 318 25,400 3,310 5,780 885 2,850 4,570 471 Notes: Bold – values above background Underlined – value>3x background - value above HHSLs Blue – above IDTL values J – The associated value is an estimated quantity K - Unknown bias L - Low bias Q - The detected concentration is below the method reporting limit/contract required quantitation limit, but is above the method quantitation limit. NA – Not Analyzed, U - The material was analyzed for, but was not detected above the level of the associated value

21
Section 9. Surface Water Sample Collection
Surface water was not noted at the Idahoan Group mine sites during E&E’s site visit. No surface water samples were collected during this investigation.

22
Section 10. Pathways and Environmental Hazards
10.1 Ground Water Pathways During the cleanup activities of the nearby mines, specifically the Minnie Moore and Triumph mines, some of the first concerns were related to potential human health risks as a result of contamination of public and private drinking water supplies. Generally speaking, contamination of drinking water systems was thought likely to occur from two types of sources (ore bodies and waste piles) and along three pathways, as illustrated by the following three scenarios. First, heavy metals are leached from tailings piles and waste rock piles, enter ephemeral or perennial drains and then contaminate the area’s shallow ground water system. Second, heavy metals leach from the local ore bodies and are transported through the geologic structure to the shallow ground water. Third, heavy metals could leach out of the ore bodies, and be discharged from the underground workings as adit water, that is then conveyed through ephemeral and perennial drains to the shallow ground water systems.
For the purposes of completing Preliminary Assessments, Source Water Assessments (completed for local public drinking water supplies) were used to identify any known affects to those systems. Although DEQ’s Source Water Assessments were used to evaluate potential affects of this mine on public drinking water supplies no inferences can be made about the affects that this and adjoining mines have on local private wells.
Source water assessments provide information on the potential contaminant threats to public drinking water sources. In the Big Wood River Valley Idaho, most of those sources (>95%) are ground water (DEQ 2000). Each source water assessment:
• Defines the zone of contribution, which is that portion of the watershed or subsurface area contributing water to the well or surface water intake (source area delineation).
• Identifies the significant potential sources of drinking water contamination in those areas (contaminant source inventory).
• Determines the likelihood that the water supply will become contaminated (susceptibility analysis).
Each assessment is summarized in a report that describes the above information and provides maps of the location of the public water system, the source area delineation, and the locations of potential contaminant sources. Idaho began developing source water assessments in 1999, and in May 2003 met its obligation under the amendments of the Safe Drinking Water Act by completing delineations for all 2100+ public water systems that were active in Idaho as of August 1999 (DEQ, 1999). Source water assessments for new public drinking water systems are being developed as those systems come online. Each public water system is provided with two copies of its final assessment report. Four source water assessments for drinking water supplies have been used in this Preliminary Assessment Process to evaluate the potential impacts to both

23
public and private drinking water supplies in and around Sun Valley, Ketchum, Hailey and Bellevue, Idaho.
The information extrapolated from these source water assessment reports is based on data that existed at the time of their writing, and the professional judgment of DEQ staff. Although reasonable efforts were made to present accurate information, no guarantees, including expressed or implied warranties of any kind are made with respect to these reports or this Preliminary Assessment by the State of Idaho or any of its agents who also assume no legal responsibility for accuracy of presentation, comments or other information in these publications or this Preliminary Assessment report. The results should not be used as an absolute measure of risk, and they should not be used to undermine public confidence in public drinking water systems.
The Source Area delineation process establishes the physical area around a well or surface water intake that becomes the focal point of the source water assessment. The process includes mapping the boundaries of the zone of contribution (the area contributing water to the well or to the surface water intake) into time of travel zones (TOT) indicating the number of years necessary for a particle of water to reach a well or surface water intake (DEQ, 1999). The size and shape of the source water assessment area depend on the delineation method used, local hydrogeology, and volume of water pumped from the well or surface water intake.
DEQ used a refined computer model approved by EPA to determine the 3-year (Zone 1B), 6-year (Zone 2), and 10-year (Zone 3) time of travel associated with the Big Wood River Aquifer and its sources. This information is illustrated in Figure 5 near the right edge.
This process involves collecting, recording, and mapping existing data and geographical information system (GIS) coverage to determine potential contaminant sources (e.g., gas stations) within the delineated source water assessment area. The potential contaminant source inventory is one of three factors used in the susceptibility analysis to evaluate the overall potential risk to the drinking water supply (DEQ, 1999). The inventory process goal is to locate and describe those facilities, land uses, and environmental conditions that are potential sources of ground water or surface water contamination.
This susceptibility analytical process determines the susceptibility of each public water system well or surface water intake to potential contamination within the delineated source water assessment area. It considers hydrogeologic characteristics, land use characteristics, potentially significant contaminant sources, and the physical integrity of the well or surface water intake. The outcome of the process is a relative ranking into one of three susceptibility categories: high, moderate, and low. The rankings can be used to set priorities for drinking water protection efforts (DEQ, 1999). There are numerous public and private drinking water supplies in the Big Wood River Basin. The Sun Valley Water and Sewer District operates and maintains nine wells in two groupings (DEQ, 2008).
Generally speaking, public drinking water systems in the Big Wood River Valley are rated as moderate to high susceptibility. Multiple factors affect the likelihood of movement of contaminants from the sources to the aquifer, which lead to this moderate to high score. Soils in

24
the area are poorly to moderately drained. The vadose zone is predominantly gravel, which increases the score. On the valley floors the average depth to ground water is twenty to fifty feet.
To date, routine water quality monitoring of public drinking water indicates that there are no significant volumes of heavy metals migrating through the regional or localized ground water systems. There is no current, long term or recurring water chemistry problems in the City of Ketchum’s drinking water sources. Arsenic, nickel, antimony, barium, selenium, chromium, cyanide and nitrate have been detected in Ketchum’s wells, but all were well below MCLs (DEQ, 2008). There is no long term or recurring water chemistry problems in the City of Hailey’s drinking water sources. Manganese, zinc, chromium, and mercury have been detected in Hailey’s wells, but all were well below MCLs (DEQ 2008). Currently, there are no data that indicate that any metal concentrations have exceeded MCLs in the Bellevue drinking water systems.

25
Figure 5. Drinking Water Well locations and source water delineations (Map source: NIAP 2004).
26
10.2 Surface Water Pathways There was no evidence of flowing water at the Idahoan Group mines beyond the short seasonal runoff due to snow melt. The vegetation surrounding the mines is well-established and there is no evidence of substantial waste rock eroding into a body of water.
Ephemeral streams that drain the Idahoan and surrounding area flows into Bullion Gulch then into Croy Creek which is a tributary to the Big Wood River. Several small ephemeral drainages appear to pass through the mine site within 80 or 90 feet of a waste rock pile. The Eureka, Homestake, Whale, and Garfield mines drain directly into Bullion Gulch upstream of the confluence with the Idahoan drain.
The probable point of entry of mines’ runoff into Croy Creek is approximately 1.5 miles to the south of the Idahoan where Bullion Gulch enters Croy Creek. The 15-mile target distance limit (TDL) is approximately 7.5 miles south of Hailey on the Big Wood River. The city of Hailey sites at about mile 6 of the TDL. There are no surface water intakes for public drinking water systems within the 15-mile TDL.
10.3 Air Quality Pathways Bullion Gulch Road gives easy access to the Idahoan Group mines. Access is unrestricted to off-road vehicles. However, many of the waste rock piles are located on steep slopes with even steeper sloping waste rock piles which will discourage most casual off-road vehicle use. The delivery of significant dust from the mine sites to local residents is not likely because of the distance (~2 miles) to those residents.
10.4 Soil Exposure According to DEQ’s Risk Evaluation Manual (DEQ, 2009) if pathways are determined to be complete, or if pathways are anticipated to become complete as a result of future uses, and the IDTLs are exceeded for any constituents, two options should be considered:
1. Adopt the IDTLs as the cleanup levels and develop a Risk Management Plan (RMP).
2. Perform a more detailed, site-specific evaluation, which includes developing site-specific background concentrations for comparative purposes.
The soil exposure pathways are not currently complete for residential or construction worker receptors at the Idahoan Group. However, the non-residential receptor pathway is potentially complete for recreational users. The residential pathway for hypothetical future residential receptors on the mine site is also potentially complete if one or more of the claims are developed for residential housing.
A cumulative risk and hazard index analysis was completed by DEQ staff using Idaho’s Risk Evaluation Manual (DEQ, 2009). The analysis was performed for antimony, arsenic, cadmium, iron, lead, manganese, mercury, selenium, silver, thallium, and zinc based on the highest levels detected for the Idahoan and the Eureka and Whale waste rock pile soil samples. The Idahoan

27
was evaluated separately because it is in a different drainage. The highest concentrations were used instead of a mean to show a worst case scenario.
Analysis of Idahoan analytes showed a cumulative risk of 5.72 X 10⁻⁵ and a cumulative hazard index of 1.93 for non-residential receptors. Both the risk and hazard indices are larger for the hypothetical future residential receptors. The primary driver for both the risk and hazard index is arsenic with a risk of 5.72 X 10⁻⁵ and a hazard quotient of 1.35. Remedial action levels are typically set between 1 X10⁻⁴ and 1 X10⁻⁶ for risk and/or a hazard index of 1. Based on this analysis there is some human health risk and hazard associated with frequent recreational use of the Idahoan mine site through inhalation, dermal contact and ingestion of site soils.
Analysis of Eureka and Whale analytes showed a cumulative rick of 1.43 x10⁻⁴ and a cumulative hazard index of 4.24 for non-residential receptors. As with the Idahoan, both the risk and hazard indices are larger for the hypothetical future residential receptor. The primary driver for both the risk and hazard index is arsenic with a risk of 1.43 X 10⁻⁵ and a hazard quotient of 3.37. There is some human health risk and hazard associated with frequent recreational use of the Idahoan Group mines through inhalation, dermal contact and ingestion of site soils, based on this analysis.
10.5 Domestic Wells and Public Water Supplies There are approximately 120 domestic, commercial and municipal water wells within a four mile radius of the mines. No public water system wells or their zones of capture are within 4-miles of the Idahoan Group (Figure 5). The nearest domestic well is located approximately 1.5 miles down hydraulic gradient from the Idahoan near the mouth of Bullion Gulch. The six or so domestic wells locate at or near the mouth of Bullion Gulch are the most likely wells to be impacted by the Idahoan and other Bullion Gulch mines. No analytical data was available for these wells. DEQ recommends that owners of the wells have their wells tested on a regular basis for metals.
10.6 Residences, Schools and Day Care Facilities The nearest residence is approximately 1.5 miles south of the Idahoan. The nearest Day Care or School Facility is over 6 road miles east of the mine site.
10.7 Wetlands Significant wetlands exist along Croy Creek 2-4 miles down stream of the Idahoan to the 15-mile TDL on the Big Wood River. However, there are no wetlands in the immediate area of the Idahoan Group (Figure 6). The closest wetland is a 0.64 acre freshwater forest/shrub wetland with 0.08 mile frontage located approximately 0.5 mile south of the Idahoan mine, to small to be readily seen in Figure 6 (USFWS, 2009). This wetland is classified as seasonally flooded.

28
Figure 6. Wetlands and 15-Mile TDL map. (Source Fair 100k, Sunv 100k, NIAP 2004)

29
10.8 Sensitive Species (Plant and Animal) Although the site is located within a defined range and habitat for wolves, the size of the piles relative to the total range is small and therefore unlikely to be a significant source for exposure (Figure 7). Camas Golden weed (Haplopappus insecticruris), North American Wolverine (Gulo gulo luscus), and Long-legged Myotis (Myotis volans) are listed as sensitive species located within 4 miles of the claim.
10.9 Fisheries Redband rainbow trout [Oncorhynchhus mykiss gairdneri], mountain white fish [Prosopium williamsoni], wood river sculpin [Cottus leiopomus], and brook trout [Salvelinus foninalis] are present within the Big Wood River (IDFG, 2000). Fish were not noted in Croy Creek.
10.10 Sensitive Waterways Croy Creek and the Big Wood Rivers are both Clean Water Act 303(d) listed streams down gradient from the Idahoan Group, which might be adversely affected by contaminant delivery from the site. However, the ephemeral stream draining Bullion Gulch likely only flows during spring runoff and runoff from the mines would provide only a small percentage to total stream flow.
10.11 Livestock Receptors There was no indication that the area is used for livestock grazing. However, the Idahoan Group falls within the BLM’s Bullion grazing allotment, indicating the potential for grazing to occur on the property.

30
Figure 7. Sensitive species near the Idahoan Group mines. (Source: Fair 100k, Sunv 100k, USGS 24K Topo)

31
Section 11. Summary and Conclusions
Based on existing conditions and uses, historic information, data observations made during DEQ’s and E&E’s site visit, soil sample analysis, size of the mine, potential contaminant pathways, and potential exposures to ecological and human receptors, DEQ recommends that further investigation be conducted at the Idahoan Group mines if the sites are to be developed for residences or if recreational activities increase. Otherwise, DEQ determines the Idahoan mine as No Remedial Action is Planned (NRAP). In addition, there are numerous mine openings and physical hazards that may pose a risk to recreationists and future residents, if any. These mine openings should be properly managed to or restricted to prevent injuries.

32
Section 12. References
Anderson, A.L., Kiislgaard, T.H., and Fryklund, V.C., Jr., 1950, Detailed geology of certain areas in the Mineral Hill and Warms Springs mining districts, Blaine County, Idaho; Idaho Bureau of Mines and Geology, Pamphlet No. 90, 37 p.
Anderson, Alfred L., and Warren R. Wagner, 1946, A Geological Reconnaissance in the Little Wood River (Muldoon) District, Blaine County, Idaho: Idaho Bureau of Mines and Geology Pamphlet No. 75, 22 p.
Blaine County, 2009, Blaine County Parcel web site accessed December 1, http://maps.co.blaine.id.us/website/parcel/viewer.htm.
Bureau of Land Management, 2008, Land Patent Details – BLM GLO Records. http://www.glorecords.blm.gov/PatentSearch/Detail.asp?Accession=IDIDAA+046037&Index=1&QryID=41620.75&DetailTab=1
Bureau of Land Management, 2009, Grazing Allotments, Digital Special Database, Idaho State Offices, Engineering and Geographic Science
Dunn, Mike, and V.S. Gillerman, 2000, Site inspection report for the abandoned and inactive mines in Idaho on U.S. Bureau of Land Management Property in the Hailey-Bellevue Area: Bullion Gulch, Hailey-Bellevue Area, Blaine County, Idaho: unpublished Idaho Geological Survey report to the BLM, 78 p.
Ecology & Environment, Inc. (E & E). November 2007. Croy Creek Watershed Preliminary Assessment/Site Inspection Hailey and Bellevue, Idaho. United States Environmental Protection Agency, Contract Number EP-S7-06-02, Seattle, Washington.Environmental Protection Agency (EPA), 2002. Preliminary Remediation Goals. http://www.epa.gov/region9/waste/sfund/prg/index.htm
Fryklund, V.C., Jr., 1950, The ore deposits of the Mayflower area: pp. 63-73 in A.L. Anderson, T.H. Kiilsgaard, and V.C. Fryklund, Jr., 1950, Detailed geology of certain areas in the Mineral Hill and Warm Springs mining districts: Idaho Bureau of Mines and Geology Pamphlet No. 90, 73 p.
Hall, W.E., J.H. Batchelder, and R.D. Douglass, 1974, Stratigraphic section of the Wood River Formation, Blaine County, Idaho: U.S. Geological Survey Journal of Research, v. 6, no. 5, p. 579-592.
Idaho Department of Environmental Quality (DEQ), 2000. 1998 303(d) list. Idaho Department of Environmental Quality, 2002. Red Elephant Mine Preliminary Assessment,
December 2002; Submitted to USEPA Region 10. Idaho Department of Environmental Quality, 2008. Narrow Gauge Gulch Preliminary
Assessment, December 2008; submitted to USEPA Region 10. Idaho Department of Environmental Quality, 2008. Safe Drinking Water Information System
(SDWIS). Idaho Department of Environmental Quality (DEQ), 2009. Risk Evaluation Manual, Version 1.0
(6/2004). http://www.deq.idaho.gov/Applications/Brownfields/index.cfm?site=risk.htm

33
Idaho Department of Fish and Game (IDF&G), 2000. Redband Trout Distribution. Idaho Department of Water Resources (IDRW), 1992. Well Construction database.
http://www.idwr.idaho.gov/apps/appswell/searchWC.asp Idaho Division of Environmental Quality, 1999, Idaho Source Water Assessment Plan, October,
39 p. IDF&G, 2002. http://www2.state.id.us/fishgame/info/cdc/plants/vasc_plants&status_n-r.htm IDWR, 1997. COVERAGE IDOWN -- Idaho Surface Ownership. IDWR, 2002. GIS shapefile of well database. IDWR, 2008. http://www.idwr.idaho.gov/water/well/search.htm Kiislgaard, T.H., Lewis, R.S., and Bennett, E.H., 2001, Plutonic and Hypabyssal Rocks of the
Hailey 1ºx2º Quadrangle, Idaho, USGS Bulletin 2064-U, 18 p. Lindgren, W., 1900, The gold and silver veins of Silver City, DeLamar, and other mining
districts in Idaho: U.S. Geological Survey 20th Annual Report, pt. 3, p. 65-256. Lindgren, W., 1933, Mineral deposits, 4th edition: New York, McGraw-Hill, 930 p. Link, P.K. and Worl, R.G., 2001, Geology and Mineral Deposits of the Minnie Moore and
Bullion Mineralized Areas, Blaine County, Idaho, USGS Bulletin 2064-Y, 22 p. Link, Paul Karl, and Ronald G. Worl, 2001, Geology and Mineral Deposits of the Minnie Moore
and Bullion Mineralized Areas, Blaine County, Idaho: U.S. Geological Survey Bulletin 2064-Y, 21 p.
Mitchell, Victoria E., Margaret H. Ott, Ruth E. Vance, and E. H. Bennett. 1991. Mines and Prospects of the Hailey Quadrangle, Idaho. Idaho Geological Survey, 2nd ed.
Rember, W.C., E.H. Bennett. 1979. Geologic map of the Hailey quadrangle, Idaho. Idaho Bureau of Mines and Geology, Geologic Map Series, Hailey 2 Quadrangle, scale 1:250,000.
Sandberg, C.A., 1975, McGowan Creek Formation, new name for Lower Mississippian flysch sequence in east-central Idaho: U.S. Geological Survey Bulletin 1405-E, 11 p.
Skipp, Betty, and C.A. Sandberg, 1975, Silurian and Devonian miogeosynclinal and transitional rocks of the Fish Creek Reservoir window, central Idaho: U.S. Geological Survey Journal of Research, v. 3, no. 6, p. 691-706.
Skipp, Betty, Hall, W.E., and P.K. Link,1994, Geologic map of the Mahoney Butte quadrangle, Blaine County, Idaho: U.S. Geological Survey Geologic Quadrangle Map GQ-1742, scale 1:24,000.
Umpleby, J.B., Westgate, L.G., and Ross, C.P., 1930, Geology and ore deposits of the Wood River region, Idaho, with a description of the Minnie Moore and nearby mines by Hewett, USGS Bulletin 814, 250 p.
United States Fish and Wildlife Service (USFWS), 2009. Classification of Wetlands and Deep Water Habitat of the United States. Accessed December 4, 2009. http://www.fws.gov/wetlands/Data/webatx/atx.html
United States Geological Survey (USGS), 1991. Digital map file of major land uses in the United States.
Wavra, C.S., and W.E. Hall, 1989, Potential for shale-hosted massive sulfides in the Permian Dollarhide Formation, south-central Idaho: U.S. Geological Survey Open-File Report 88-376: 9 p.

34
Western Regional Climate Center (WRCC), 2006. http://www.wrcc.dri.edu/cgi-bin/cliMAIN.pl?idhail
Worl, R.G., and K.M. Johnson, 1995, Geology and mineral deposits of the Hailey 1º x 2º quadrangle and the western part of Idaho Falls 1º x 2º quadrangle, south central Idaho—an overview: Part A in Ronald G. Worl, P.K. Link, G.R. Winkler, and K.M. Johnson, editors, Geology and Mineral Resources of the Hailey 1º x 2º Quadrangle and the Western Part of Idaho Falls 1º x 2º Quadrangle, Idaho: U.S. Geological Survey Bulletin 2064-A, 21 p.