IDAF/Technical Report/97/I INTEGRATED DEVELOPMENT OF ARTISANAL
107
IDAF/Technical Report/97/I INTEGRATED DEVELOPMENT OF ARTISANAL FISHERIES (IDAF) (GHA/93/008) CATCH AND FISH STOCK ASSESSMENT IN STRATUM VII OF LAKE VOLTA By G.J. DE GRAAF and P.K. OFORI -DANSON FOOD AND AGRICULTURE ORGANISATION OF THE UNITED NATIONS ROME, 1997
Transcript of IDAF/Technical Report/97/I INTEGRATED DEVELOPMENT OF ARTISANAL

IDAF/Technical Report/97/I
INTEGRATED DEVELOPMENT OF ARTISANAL FISHERIES (IDAF) (GHA/93/008)
CATCH AND FISH STOCK ASSESSMENT IN STRATUM VII OF LAKE VOLTA
By
G.J. DE GRAAF and P.K. OFORI -DANSON
FOOD AND AGRICULTURE ORGANISATION OF THE UNITED NATIONS ROME, 1997

C:\degraaf\Ghana\final97.doc 29-7-2001
The designation employed and the presentation of materials in this report do not imply the expression of any opinion whatsoever on the part of the Food and Agriculture Organisation of the United Nations concerning the legal status of any country, territory, city or area of its authorities, or concerning the delimitation’s of its frontiers or boundaries.
C:\degraaf\Ghana\final97.doc 29-7-2001
PREFACE
This report presents the results of a fisheries monitoring programme executed from March 1995 till December 1996 in Stratum VII of Lake Volta (Ghana) by the project, Integrated Development of Artisanal Fisheries (IDAF) under the aegis of FAO/UNDP. The major goals were to determine the total catch of Stratum VII , to gain insight into the present status of the exploited fish stocks in Stratum VII and to develop an appropriate method which can be used for the whole of Lake Volta.
A full frame survey was carried out; a traditional Catch and Effort monitoring programme established and Fish Stocks Assessment done with a length-based monitoring programme. Considering that several aspects of the different monitoring programmes were quite new for Ghana and that some professionals concerned may not be familiar with the different methods, the results in this report are not presented as a complete technical/scientific report. Background information is provided whenever needed and advantages/disadvantages of the different methods are discussed. However, analysis of fisheries related data cannot exclude statistics and this could not be avoided. No background information is given for the different statistical analyses used, but where possible the results are discussed in a non-scientific way to provide indication of how fisheries data can be analysed. No final conclusions are drawn from the obtained results on the status of the stocks and possible management options as only Stratum VII of Lake Volta was covered. The main purpose of this report is to provide information on the different methods which could be used for the whole of Lake Volta. Yeji, Ghana, February, 1997
G.J. de Graaf
(NEFISCO FOUNDATION, Amsterdam, the Netherlands) [email protected] www.nefisco.org www.netfish.org
P.K. Ofori-Danson [email protected] Water Research Institute, C.S.I.R, P.O.Box 38, ACHIMOTA, GHANA
C:\degraaf\Ghana\final97.doc 29-7-2001
TABLE OF CONTENTS
1. INTRODUCTION ......................................................................................1
1.1 PREVIOUS FISHERIES PROJECTS EXECUTED IN LAKE VOLTA ....................................1
2. STRATUM VII OF LAKE VOLTA ..........................................................4
3. THE FRAME SURVEY ............................................................................5
4. THE CATCH ASSESSMENT SURVEY.................................................11
4.1 METHODS ...........................................................................................................11 4.1.1 Sampling and data collection.......................................................................11
4.2 STATISTICS..........................................................................................................12 4.3 “VILLAGE SIZE” VS “GEOGRAPHICAL LOCATION” AS STRATIFICATION CRITERIA ....13 4.4 ESTIMATION OF THE TOTAL ANNUAL CATCH OF STRATUM VII OF LAKE VOLTA.....15
4.4.1 Non-stratified catch estimation. ...................................................................15 4.4.1.1 Method used .................................................................................................... 15 4.4.1.2 Canoes............................................................................................................. 15 4.4.1.3 Winchboats...................................................................................................... 18 4.4.1.4 Total catch and Confidence Limits ................................................................... 19
4.4.2 Estimates of total catch in Stratum with stratification “North, Central and South”..................................................................................................................19
4.4.2.1 Key parameters................................................................................................ 19 4.4.2.2 Total catch canoes. .......................................................................................... 20 4.4.2.3 The winchboats................................................................................................ 22 4.4.2.4 Total catch and Confidence Limits ................................................................... 24
4.4.3 Comparison of catch estimates. ...................................................................25 4.4.4 An analysis of catch trends and extrapolation for the whole of Lake Volta..25
4.5 SPECIES COMPOSITION OF THE CATCH IN STRATUM VII ........................................29 4.5.1 Gillnets........................................................................................................29
4.5.1.1 Long-term trends.............................................................................................. 29 4.5.1.2 Geographical differences .................................................................................. 29
4.5.2 Winchboats..................................................................................................31 4.5.3 A Comparison with the results of the Market Survey ....................................31
4.5.3.1 Total Fish Production....................................................................................... 31 4.5.3.2 Species composition......................................................................................... 33
4.6 BIOLOGICAL AND TECHNICAL INTERACTIONS .......................................................33 4.6.1 The impact of waterlevel..............................................................................33 4.6.2 Differences within Stratum VII.....................................................................35
5. LENGTH BASED STOCK ASSESSMENT PROGRAMME. ...............38
5.1 SPECIES AND GEARS ............................................................................................38 5.2 SAMPLING PROGRAMME ......................................................................................38 5.3 ANALYSIS OF DATA .............................................................................................39
5.3.1 Growth parameters ......................................................................................39 5.3.2 Mortalities...................................................................................................39 5.3.3 Yield per Recruit Analysis............................................................................40 5.3.4 Estimation of fishing mortality from Cohort Analysis ..................................40 5.3.5 Predictive Analysis ......................................................................................40

C:\degraaf\Ghana\final97.doc 29-7-2001
5.4 HEMISYNODONTIS MEMBRACEUS ........................................................................42 5.4.1 Growth parameters ......................................................................................42 5.4.2 Gillnets........................................................................................................43
5.4.2.1 Mortality rates ................................................................................................. 43 5.4.2.2 Virtual Population Analysis ............................................................................. 44 5.4.2.3 Yield per Recruit Analysis ............................................................................... 44
5.4.3 Winchboats..................................................................................................46 5.4.3.1 Mortality rates ................................................................................................. 46 5.4.3.2 Virtual Population Analysis ............................................................................. 47 5.4.3.3 Yield per Recruit Analysis ............................................................................... 48
5.4.4 Thompson and Bell prediction for H. membraceus.......................................49 5.5 CHRYSICHTHYS NIGRODIGITATUS ........................................................................51
5.5.1 Growth parameters ......................................................................................51 5.5.2 Gillnets........................................................................................................52
5.5.2.1 Mortality rates ................................................................................................. 52 5.5.2.2 Virtual Population Analysis ............................................................................. 53 5.5.2.3 Yield per Recruit Analysis ............................................................................... 53
5.5.3 Winchboats..................................................................................................55 5.5.3.1 Mortality rates ................................................................................................. 55 5.5.3.2 Virtual Population Analysis ............................................................................. 57 5.5.3.3 Yield per Recruit Analysis ............................................................................... 57
5.5.4 Thompson and Bell prediction for C. nigrodigitatus ....................................59 5.6 CHRYSICHTHYS AURATUS....................................................................................61
5.6.1 Growth parameters ......................................................................................61 5.6.2 Gillnets........................................................................................................62
5.6.2.1 Mortality rates ................................................................................................. 62 5.6.2.2 Virtual Population Analysis ............................................................................. 63 5.6.2.3 Yield per Recruit Analysis ............................................................................... 63
5.6.3 Winchboats..................................................................................................65 5.6.3.1 Mortality rates ................................................................................................. 65 5.6.3.2 Virtual Population Analysis ............................................................................. 66 5.6.3.3 Yield per Recruit Analysis ............................................................................... 66
5.6.4 Thompson and Bell prediction for C. auratus ..............................................68 5.7 LABEO COUBIE ....................................................................................................69
5.7.1 Growth parameters ......................................................................................69 5.7.2 Gillnets........................................................................................................70
5.7.2.1 Mortality rates ................................................................................................. 70 5.7.2.2 Virtual Population Analysis ............................................................................. 71 5.7.2.3 Yield per Recruit Analysis ............................................................................... 71
5.7.3 Winchboats..................................................................................................73 5.7.3.1 Mortality rates ................................................................................................. 73 5.7.3.2 Virtual Population Analysis ............................................................................. 74 5.7.3.3 Yield per Recruit Analysis ............................................................................... 74
5.7.4 Thompson and Bell prediction for L. coubie ................................................76 5.8 SCHILBE INTERMEDIUS ........................................................................................78
5.8.1 Growth parameters ......................................................................................78 5.8.2 Gillnets........................................................................................................79
5.8.2.1 Mortality rates ................................................................................................. 79 5.8.2.2 Virtual Population Analysis ............................................................................. 80 5.8.2.3 Yield per Recruit Analysis ............................................................................... 80
5.8.3 Winchboats..................................................................................................81

C:\degraaf\Ghana\final97.doc 29-7-2001
5.8.3.1 Mortality rates ................................................................................................. 81 5.8.3.2 Virtual Population Analysis ............................................................................. 82 5.8.3.3 Yield per Recruit Analysis ............................................................................... 83
5.8.4 Thompson and Bell prediction for S. intermedius.........................................84 5.9 SAROTHERODON GALILEUS..................................................................................86
5.9.1 Growth parameters ......................................................................................86 5.9.2 Gillnets........................................................................................................87
5.9.2.1 Mortality rates ................................................................................................. 87 5.9.2.2 Virtual Population Analysis ............................................................................. 88 5.9.2.3 Yield per Recruit Analysis ............................................................................... 88
5.9.3 Thompson and Bell prediction for S. galileus...............................................89 5.10 OREOCHROMIS NILOTICUS .................................................................................91
5.10.1 Growth parameters ....................................................................................91 5.10.2 Gillnets......................................................................................................92
5.10.2.1 Mortality rates ............................................................................................... 92 5.10.2.2 Virtual Population Analysis............................................................................ 93 5.10.2.3 Yield per Recruit Analysis.............................................................................. 93
5.10.3 Thompson and Bell prediction for O. niloticus...........................................94 5.10.4 Remarks.....................................................................................................95
5.11 MULTI SPECIES & MULTI GEAR THOMPSON AND BELL ANALYSIS.........................95

C:\degraaf\Ghana\final97.doc 29-7-2001
.
i SUMMARY In 1995/1996 IDAF carried out a fisheries monitoring programme in stratum VII of Lake Volta. The programme encompassed a full frame survey, a catch and effort monitoring programme and a length-based stock-assessment programme. This report summarises1 the results of the frame survey and presents the results of the catch and effort monitoring programme and the stock-assessment. The frame survey indicated that at present 288 villages are located in stratum VII, with 8068 canoes, 358 winchboats, with a total population of 100,000 and 40,000 fishermen. In comparison with the socio-economic survey of 1992 the number of canoes had increased 23% from 6,500 to 8,068, the number of fishermen increased by 122% from 18,000 to 40,000 while the number of winchboats slightly declined from 380 to 358. Analysis of catch data clearly indicated differences in catches on basis of the geographical zonation, with the highest catches in the South and the lowest catches in the Central part of stratum VII. Therefore it was decided not to stratify for “Large, Medium or Small” fishing villages as was done in earlier monitoring programmes but to use the geographical location of the landing sites as stratification criteria. The total catch of stratum VII of Lake Volta was estimated with and without stratification and the results are presented below; . Non stratified
(t/year) Stratified (t/year)
Average gillnets 22422 27843 Max. gillnets 26065 34056 Min gillnets 18779 20988 Average winch 5559 6005 Max. winch 7054 6511 Min winch 4064 5745 Average all 27981 33848 Max. all 33119 40567 Min all 22843 26743 Stratum VII of Volta produced between 28.000 and 33,800 tonnes in 1996 depending on the method used for the estimation. Due to the impact of the lower catches in the Central area it was concluded that stratification is indeed necessary and 33,800 tonnes is the total catch estimate for Stratum VII of Lake Volta for 1996.
1 The full results of the frame survey were presented in a separate report; de Graaf, G.J. and Ofori-Danson, P.K., 1996, Results of a full frame survey in stratum VII of Lake Volta, FI:DP/GHA/93/008, Field document, FAO, Rome, 1996.

C:\degraaf\Ghana\final97.doc 29-7-2001
It is certain that the previously used production estimate of 44,000 t/year for the whole of Lake Volta is an under-estimation, as the actual total catch of Stratum VII is already 33.800 t/year. The total production of Lake Volta most likely will be around 150,000 -200,000 t/year (180-240 kg/ha) with a total annual value of 30 million USD This is a substantial quantity, if compared with the annual marine catches of 300,000-400,000 t/year, and it justifies that serious action be taken in order to protect the productivity of this natural resource. Surplus production models such as Schaefer or Fox can only be used for the determination of the maximum sustainable yield and maximum fishing effort if the frame survey is updated regular intervals. There is a distinct difference in species composition of the gillnets in the North or the South . In the North a large part of the catch consists of O. niloticus, L. coubie and S. galileus. While in the South the two tilapia species are almost absent and the bulk of the catch consists of C. auratus, C. nigrodigitatus and H. membraceus. This difference stresses the importance of stratification in North, Central and South. The catch assessment survey and the market survey indicated that Tilapia spp, Chrysichthys spp. and Hemisynodontis/Synodontis spp. are the major species. There are however large differences between the two estimates. In the market survey the three mentioned species represent 79%, while in the catch assessment survey they represent only 43%. In the market survey Tilapia spp. are the most important, while “Other species” are the most important in the catch assessment survey. The differences are most likely caused by: • the catch assessment survey covering mainly gillnets and winchboats. Traps and nifa
nifa are not covered. The latter gears are however very site specific and are mainly catching Tilapia spp. It indicates that in the catch assessment survey more stratification types have to be used.
• Tilapia spp being the highest priced species and most likely sold, while the less
valuable species are used for home consumption. A small survey could verify this phenomenon.
It seems that there is a relation between the water level and the fish catch. Therefore it could be concluded that the decline of the CPUE is caused by an increased number of canoes and a reduced waterlevel. A multi linear regression analysis of both factors on the CPUE indicated that both partial coefficients are significant (P < 0.05) and the relation can be described as;
CPUE = -0.00275*No. of canoes + 0,0958*Waterlevel + 10,0327 This analysis stresses again the importance of long-term data-series because the picture could become more clear if we have observations during a period of high water-levels.

C:\degraaf\Ghana\final97.doc 29-7-2001
Differences in the major factors influencing the CPUE-canoe in the three geographical sub-strata are analysed again using ANOVA and the results are presented in the table below. Mean values of the average mesh size, the number of bundles, the number of days the gears are set and the number of assistants per canoe in the northern, central and southern area of Stratum VII of Lake Volta. (different superscripts indicate significant difference). Stratum Mesh size No of bundles Days set No. of assistants North 2.14a±0.05 1.56a±0.05 1.03a±0.03 2.02a±0.04 Central 2.71b ±0.05 1.91b±0.04 1.34b±0.02 1.79c±0.03 South 2.60b±0.07 1.62b±0.08 1.73c±0.52 2.52c±0.06 Significant differences are found for the different areas of Stratum VII but they can not yet directly explain the difference in catches and it is recommended to carry out an in-depth analysis in the near future (World Bank project). A length-based stock-assessment programme can be applied in Lake Volta. The results of such a programme in stratum VII provided important information on the stocks. A length-based programme can provide the needed information on the status of the stocks within a short time period, in comparison with the long time-series needed for the traditional surplus-production models. It is therefore strongly recommended to carry out a length-based programme in the whole of Lake Volta. The quality of the results of length-based models depends on the obtained data- set (the length frequencies). Small sample sizes, as sometimes was the case in the programme executed in Stratum VII, seriously hampers the analysis and reduces the reliability of the results. A length-based programme for the whole of Lake Volta is a major exercise and will only provide reliable results if it is well supported, scientifically and financially. From a scientific point of view it is difficult to draw conclusions on the present status of the stocks in stratum VII of Lake Volta because; sample sizes were low; it was assumed that there was one unit of stock; growth parameters were not validated by ageing, otolith readings, etc. However, if the data are reliable, the results indicate that the stocks are seriously over-exploited, therefore the preliminary analysis presented in this report should warn all policy makers involved. Parameters as estimated for the major species by the length-based stock-assessment programme are summarised below.

C:\degraaf\Ghana\final97.doc 29-7-2001
Species Growth parameters Gillnets
Winch
Rel Y/R Y/R T&B Rel Y/R Y/R T & B L∞ K ϕ Epresent Emax Fpresent Fmax F factor yield Ffactor value Epresent Emax Fpresent Fmax F factor yield Ffactor value H. membraceus 44.0 0.55 3.02 0.72 0.62 2.82 2.0 1.1 0.6 0.72 0.52 2.91 2.0 0.5 0.2 C. auratus 31.0 0.60 2.76 0.61 0.54 2.00 1.5 1.6 1.0 0.68 0.59 2.74 1.6 1.1 0.6 C. nigrodigitatus 44.5 0.65 3.12 0.70 0.48 2.81 1.0 0.4 0.3 0.64 0.45 2.22 1.3 0.8 0.6 S. intermedius 30.0 0.80 2.85 0.65 0.57 2.90 1.4 2.0 1.7 0.51 0.57 1.64 2.0 1.4 1.1 L. coubie 75.0 0.70 3.50 0.52 0.41 1.21 0.8 0.3 0.2 0.77 0.46 3.87 1.0 0.4 0.4 O. niloticus 33.5 0.55 2.59 0.30 0.47 0.38 1.2 3.1 1.7 S. galileus 32.5 0.25 2.42 0.60 0.46 1.11 0.9 0.4 0.2

0
C:\degraaf\Ghana\final97.doc 29-7-2001
Cumulative Thompson and Bell analysis for the major species in stratum VII of lake Volta.
At the present fishing effort (Ffactor=1) the annual cumulative catch (for the major species) is estimated 16,816 tonnes with a value of 3.440.000 USD/yr. The optimal fishing effort considering yield is Ffactor=0.6 (Yield=17,500 t/yr). The optimal economic fishing effort is Ffactor=0.5 (Value=3.750.000 USD/yr). The optimal fishing effort considering the biomass is Ffactor =0.3
Major speciesCumulative
05000
10000150002000025000300003500040000
0 1 2 3 4
F-factor
Yie
ld &
Val
ue
0
20000
40000
60000
80000
100000
Bio
mas
s
Yield (t/yr) Value (100 US$) Biomass (t)
1
C:\degraaf\Ghana\final97.doc 29-7-2001
1. INTRODUCTION
Lake Volta was formed as a result of the closure of the Akosombo dam in 1964. The created lake has a surface area of about 8,400 km2 or 3.6% of the surface area of the country, a shoreline length of 4,800 km, a maximum depth of 70 m and a mean depth of 19 m. Trees were not removed before the creation of the basin and the existing tree stumps have a considerable impact on fisheries and navigation on the lake. It was early realized that the building of the dam would have major effects apart from power production. These effects were primarily the effects on public health, transportation and the development of a new fisheries. Since the creation of Lake Volta several fisheries programmes/projects have been executed and a summary their activities is presented below.
1.1 Previous fisheries projects executed in Lake Volta
1964-1968; The Ghana Institute of Aquatic Biology and the Volta Basin Research
Project of the University of Ghana executed basic studies on fish biology and limnological aspects during the formation of the lake. The shift of the fish community from a system dominated by "riverine" towards a composition which is dominated by the more "lacustrine" species and the changes in the limnology of the system were well monitored and documented by those projects. Within the same period research work on the used fishing gears was carried out by the Department of Fisheries.
1968-1971 The Volta Lake Research Project Phase I. This UNDP financed project
was executed by FAO with the Volta River Authority as government co-operating agency. During this project an effort was made to monitor fisheries more thoroughly. A complete frame survey was carried out in order to determine the number of canoes and fishermen operating on the Lake (12,000 canoes and 18,300 active fishermen). A preliminary catch assessment programme was initiated which was set up with a stratified sampling technique, Fish marketing was followed at three recording centres along the lake (Yeji, Kpandu Tokor and Kete Krachi) biological parameter such as feeding habits, reproduction and growth were determined and an experimental fish stock-assessment programme was initiated.
1971-1977 The Volta Lake Research Project Phase II. (UNDP/FAO/VRA). The
second phase of the Volta Lake Research Project aimed at the strengthening of research on fisheries, hydrobiology, public health and the resettlement of the people displaced by the Volta Lake. The earlier projects were carried out during the period the lake was formed and during which several changes in hydrobiology and fisheries and fish

2
C:\degraaf\Ghana\final97.doc 29-7-2001
stocks took place. In 1970 the lake system became more or less stable and the data obtained in that year could be considered as a baseline of the lake.
The project carried a complete new frame survey in 1975 which indicated
that 13,800 canoes were operated by 20,600 active fishermen, or the fishing effort had increased with approximately 12% since the previous survey in 1970. The project strengthened the catch assessment survey, the whole lake was divided into eight strata, and within each of these strata ten villages were visited every three month. During three consecutive days the fishermen were interviewed and the catch weighed. Averages of these selected villages were used to obtain quarterly estimates of the catch for each strata, and these were added up to give the total of the whole lake. Annual estimates were calculated by adding up the quarterly estimates. In a later stage of the project it was decided to reduce the number of sample villages to 4 per stratum. The survey was continuously carried out from 1969 till 1977 and the yearly total catch estimates are presented below:
Year Estimated total catch (t) 1969 61,700 1970 39,200 1971 39,000 1972 36,000 1973 35,900 1974 37,300 1975 41,900 1976 40,700 1977 38,300 A Fish Stock Assessment Programme based on regular sampling with a
set of gillnets (mesh sizes 12,5-200 mm) of 30 sampling sites, located in all the strata of the lake, was carried out from 1969 till 1977. The project concluded that there was no sign of over fishing of the stocks and that the fishing effort could be increased.
The project set up a fish marketing survey. At the major market places
along the lake the total quantity of processed fish was estimated by counting the number of baskets landed. This allowed comparison of the total quantity of processed fish from the lake with the total quantity of fish caught in the lake. The survey was executed from 1970 till 1977.
1977-1989 After termination of the Volta Lake Research Project, phase II, the
Fisheries Department continued the monitoring programme
3
C:\degraaf\Ghana\final97.doc 29-7-2001
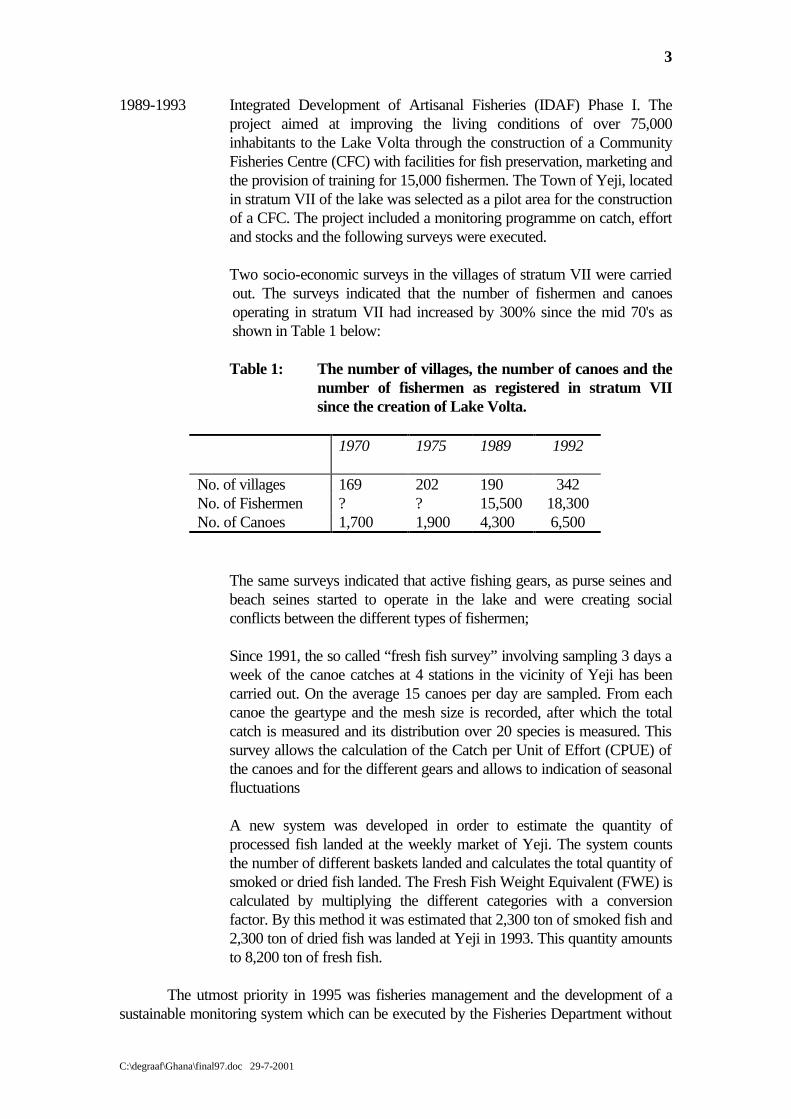
1989-1993 Integrated Development of Artisanal Fisheries (IDAF) Phase I. The project aimed at improving the living conditions of over 75,000 inhabitants to the Lake Volta through the construction of a Community Fisheries Centre (CFC) with facilities for fish preservation, marketing and the provision of training for 15,000 fishermen. The Town of Yeji, located in stratum VII of the lake was selected as a pilot area for the construction of a CFC. The project included a monitoring programme on catch, effort and stocks and the following surveys were executed.
Two socio-economic surveys in the villages of stratum VII were carried
out. The surveys indicated that the number of fishermen and canoes operating in stratum VII had increased by 300% since the mid 70's as shown in Table 1 below:
Table 1: The number of villages, the number of canoes and the
number of fishermen as registered in stratum VII since the creation of Lake Volta.
1970 1975 1989 1992
No. of villages 169 202 190 342 No. of Fishermen ? ? 15,500 18,300 No. of Canoes 1,700 1,900 4,300 6,500
The same surveys indicated that active fishing gears, as purse seines and
beach seines started to operate in the lake and were creating social conflicts between the different types of fishermen;
Since 1991, the so called “fresh fish survey” involving sampling 3 days a
week of the canoe catches at 4 stations in the vicinity of Yeji has been carried out. On the average 15 canoes per day are sampled. From each canoe the geartype and the mesh size is recorded, after which the total catch is measured and its distribution over 20 species is measured. This survey allows the calculation of the Catch per Unit of Effort (CPUE) of the canoes and for the different gears and allows to indication of seasonal fluctuations
A new system was developed in order to estimate the quantity of
processed fish landed at the weekly market of Yeji. The system counts the number of different baskets landed and calculates the total quantity of smoked or dried fish landed. The Fresh Fish Weight Equivalent (FWE) is calculated by multiplying the different categories with a conversion factor. By this method it was estimated that 2,300 ton of smoked fish and 2,300 ton of dried fish was landed at Yeji in 1993. This quantity amounts to 8,200 ton of fresh fish.
The utmost priority in 1995 was fisheries management and the development of a sustainable monitoring system which can be executed by the Fisheries Department without
4
C:\degraaf\Ghana\final97.doc 29-7-2001
external funding. Therefore IDAF decided to start several different monitoring programmes Five types of survey were carried out in Stratum VII of Lake Volta by the IDAF project: • A fish market survey aimed at determining the total quantity of processed fish
landed at the Yeji market. • A processing programme for determining the conversion factor of smoked and
dried fish and its seasonal fluctuation. • A full frame survey, to determine the actual total fishing effort. • A catch assessment survey to determine the monthly average catch of the different
fishing units. • A stock-assessment survey in order to assess the present situation of the stocks and
to predict future changes. This report presents the results of the Catch and Stock Assessment Programme with a summary of the results of the Frame Survey.
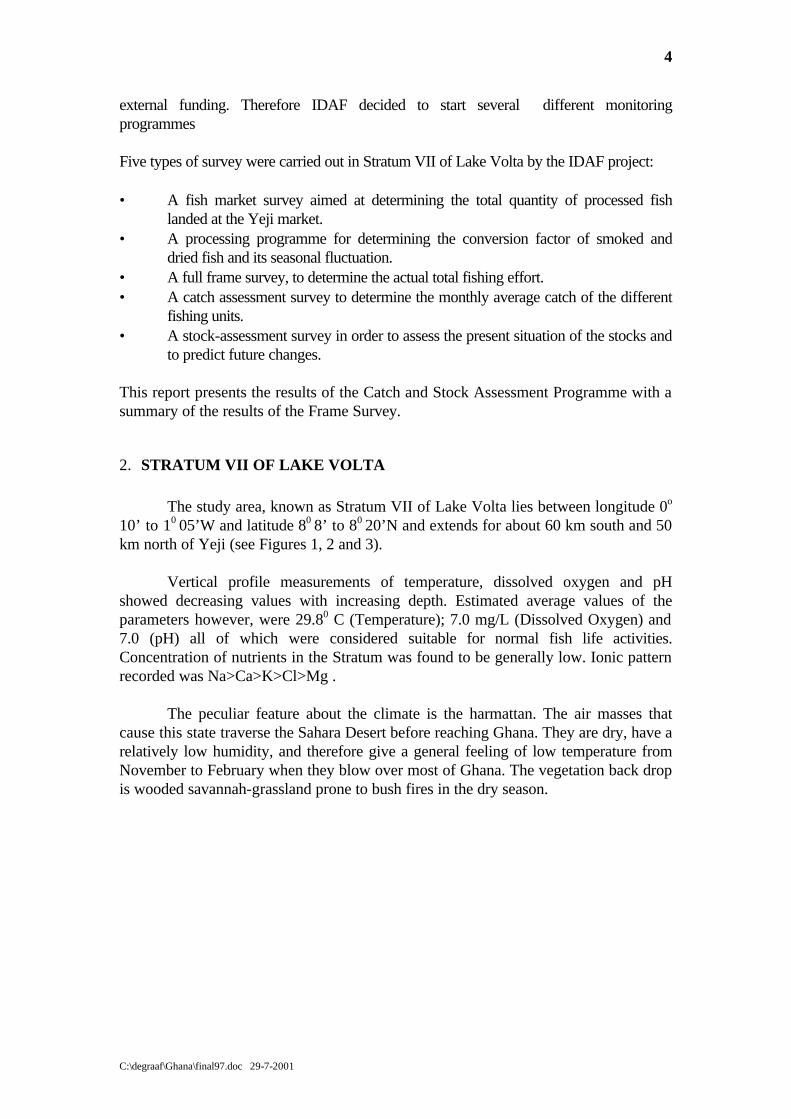
2. STRATUM VII OF LAKE VOLTA
The study area, known as Stratum VII of Lake Volta lies between longitude 0o 10’ to 10 05’W and latitude 80 8’ to 80 20’N and extends for about 60 km south and 50 km north of Yeji (see Figures 1, 2 and 3). Vertical profile measurements of temperature, dissolved oxygen and pH showed decreasing values with increasing depth. Estimated average values of the parameters however, were 29.80 C (Temperature); 7.0 mg/L (Dissolved Oxygen) and 7.0 (pH) all of which were considered suitable for normal fish life activities. Concentration of nutrients in the Stratum was found to be generally low. Ionic pattern recorded was Na>Ca>K>Cl>Mg . The peculiar feature about the climate is the harmattan. The air masses that cause this state traverse the Sahara Desert before reaching Ghana. They are dry, have a relatively low humidity, and therefore give a general feeling of low temperature from November to February when they blow over most of Ghana. The vegetation back drop is wooded savannah-grassland prone to bush fires in the dry season.

5
C:\degraaf\Ghana\final97.doc 29-7-2001
3. THE FRAME SURVEY
The socio economic surveys of 1989 and 1991 were based on stratified sampling of the villages. The last full frame survey has been carried out in 1975. A new full frame was needed especially if the differences in the total catch, estimated at present, is considered. All the villages in stratum VII were visited and information gathered through direct observation and through interviews with the chiefs of the villages and the fishermen. Within the frame survey, the previous (1970-1977) village classification was used; • Large size village, more than 51 canoes • Medium size village, 11-50 canoes • Small size village, 0-10 canoes The survey indicated that at present 288 villages are located in stratum VII, with 8068 canoes, 358 winchboats, with a total population of 100,000 and 40,000 fishermen. A breakdown of these data for the East, West bank and for the classification of large, medium and small sized villages is presented in Table 2.

6
C:\degraaf\Ghana\final97.doc 29-7-2001
Table 2: Results of the frame survey for the east and the west bank of Stratum VII.
Location No of
villages No of canoes No of
winchboats Population Fishermen
East-Large 13 1,276 61 20,978 8,317 East-Medium 59 1,479 62 15,501 6,424 East-Small 50 275 5 4,163 1,560 West-Large 25 2,451 91 24,622 9,426 West-Medium 92 2,285 128 32,335 12,366 West-Small 49 302 11 4,281 1,8,37 TOTAL 288 8,068 358 101,883 39,934 In comparison with the socio-economic survey of 1992 the number of canoes increased 23% from 6,500 to 8,068, the number of fishermen increased by 122% from 18,000 to 40,000 while the number of winchboats slightly declined from 380 to 358. Small sized villages represent 34.1% of the total number of villages and 7.1% of the total number of canoes are located in the small sized villages. For medium and large sized villages these figures are respectively 52.0 % and 13.2% for the villages and 46.6 and 46.1 for the canoes. Stratification in Large, Medium and Small size villages was done in the early 70’s. The major purpose of this stratification was to obtain sound statistical data which could facilitated later frame surveys, based on sub-sampling. For a Catch Assessment/Stock Assessment Programmes such a stratification is regarded inappropriate2, because differences in catches are more likely dependent on factors such as habitat, species, fishing effort, etc. Within Stratum VII a preliminary stratification was made based on geographical location of the villages ( see Figure 2); Northern area: Westbank from Agbokope (vilno 1) to Degbesu (vilno. 38) Eastbank from Nkwanta (vilno. 1 ) to Sabonjida (vilno. 50) Central area: Westbank from Medee (vilno. 39) to Hutideke (vilno 56) Eastbank from Watehkope (vilno 51) to Gbetekpo (vilno 85) Southern area: Westbank from Tonkakope (vilno. 57) to Gakope (vilno 184) Eastbank from John kope (vilno 86) to Maamata (vilno 158)
2 This will be discussed in detail in Chapter 4.

7
C:\degraaf\Ghana\final97.doc 29-7-2001
Figure 1: Map of Ghana
8
C:\degraaf\Ghana\final97.doc 29-7-2001
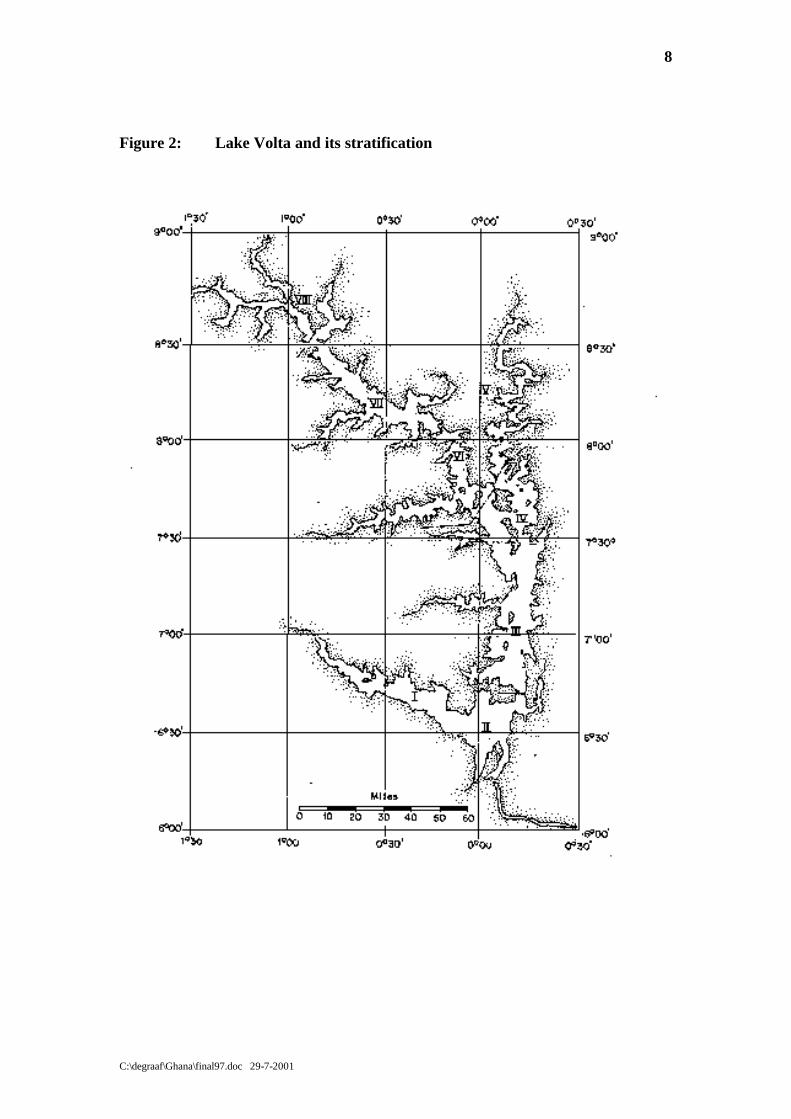
Figure 2: Lake Volta and its stratification

9
C:\degraaf\Ghana\final97.doc 29-7-2001
Figure 3: Stratum VII of Lake Volta and its geographical stratification.
10
C:\degraaf\Ghana\final97.doc 29-7-2001
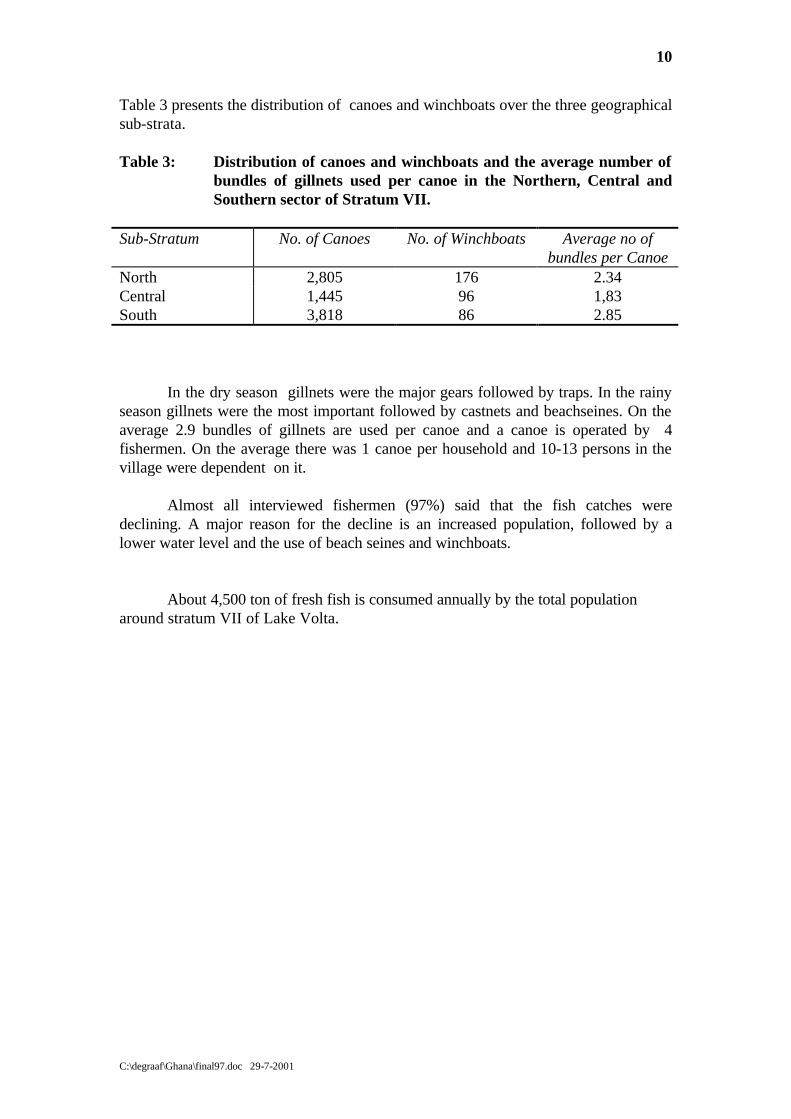
Table 3 presents the distribution of canoes and winchboats over the three geographical sub-strata. Table 3: Distribution of canoes and winchboats and the average number of
bundles of gillnets used per canoe in the Northern, Central and Southern sector of Stratum VII.
Sub-Stratum No. of Canoes No. of Winchboats Average no of
bundles per Canoe North 2,805 176 2.34 Central 1,445 96 1,83 South 3,818 86 2.85 In the dry season gillnets were the major gears followed by traps. In the rainy season gillnets were the most important followed by castnets and beachseines. On the average 2.9 bundles of gillnets are used per canoe and a canoe is operated by 4 fishermen. On the average there was 1 canoe per household and 10-13 persons in the village were dependent on it. Almost all interviewed fishermen (97%) said that the fish catches were declining. A major reason for the decline is an increased population, followed by a lower water level and the use of beach seines and winchboats. About 4,500 ton of fresh fish is consumed annually by the total population around stratum VII of Lake Volta.

11
C:\degraaf\Ghana\final97.doc 29-7-2001
4. THE CATCH ASSESSMENT SURVEY.
4.1 Methods
4.1.1 Sampling and data collection
The Catch Assessment Survey started in March 1995 and became fully operational in October 1995. The Northern and Southern area were visited bi-monthly and within each sub-strata three different villages/landing sites were sampled during one day. The Central area around Yeji town was sampled one day per week. Table 4 presents the major characteristics of the different landing sites. Table 4: Major characteristics of the sampled landing sites in Stratum VII
of Lake Volta. Name Sub-stratum No. of canoes Class No of winchboats Gbevukpo North 82 Large 4 Blackie kope North 20 medium 5 Kejawu North 120 large 8 Fanti town Central 13 medium 7 Jaklai no 3 Central 37 medium 7 Salt Town Central 10 small 3 Site area Central 16 medium 0 Abodwese Akura South 34 medium 0 Pedjai no. 1 South 9 small 0 Avorkope South 120 large 17

12
C:\degraaf\Ghana\final97.doc 29-7-2001
At each landing site the following data was collected; CANOES • Total catch per canoe (by weighing of total catch) • No of bundles of the sampled canoe, mesh size and type of gillnet (mono/multi
filament). • If not a gillnet then other gear characteristics were taken. • Weight and number of the different species in the sampled canoes by means of a
sub-sample. • The number of fishermen per canoe. • The number of days the fishermen went fishing in the previous month. • The total number of canoes on the landing site. • The total number of canoes that went fishing on the sample day. WINCH BOATS • The total catch of the winchboat was found by counting the number of headpans3
landed. • Mesh size of the gear. • Species composition was obtained through experimental fishing. • The number of winchboats at the landing site. BEACH SEINES • The number of beach seines operated. • The total catch of the beach seines by weighing. • The mesh size.
4.2 Statistics
From May 1995 till January 1997, 1,741 canoes and 283 winchboats were sampled at the different landing sites. The data were entered in a database program (MsACCESS) and statistical analysis was done by using SYSTAT. Prior to analysis, the coefficient of variation (%) was calculated for the CPUE’S for all different types of stratification and methods of estimation. On the average the CV was 11% and in 4 cases exceeded 15%, the latter always in small sized villages. It was therefore concluded that the sample sizes were appropriate for a correct analysis.
3 The average weight of a headpan is 40 kg of fish.

13
C:\degraaf\Ghana\final97.doc 29-7-2001
4.3 “Village size” vs “Geographical location” as stratification criteria
Analysis of variance of the catch per canoe and the catch per bundle indicates significant differences among the three type of landing sites ( see Table 5). Table 5: Mean catch per canoe and mean catch per bundle (± s.e.m4) among
large, medium and small size villages. Different superscripts indicate a significant difference (P≤≤0.005).
Village size Catch/canoe/day
(kg/day) n Catch/bundle/day
(kg/day) n
Large 16.77a ± 0.64 375 10.07a ± 0,5 232 Medium 12.91b ± 0.37 1105 8.36b ± 0.26 876 Small 11.73b ± 0.76 261 6.15c ± 0.52 220 The picture changes if the catch per canoe or catch per bundle is analysed for the different individual landing sites (Tables 6 & 7). Table 6: Mean daily catch per canoe (±± s.e.m) at the different landing sites
in Stratum VII of Lake Volta. . Different superscripts indicate a significant difference (P≤≤0.005).
Landing site CPUE-canoe
(kg/canoe/day) n
size Location
Abodwese 17.7a ± 1.2 90 medium South Avorkope 22.8a ± 1.0 135 large South Blackie 18.4a ± 0.9 151 medium North Fanti 9.5b ± 0.7 291 medium Central Gbevukpo 12.7a ± 1.1 123 large North Jaklai 12.3b ± 0.8 234 medium Central Kejawu 13.4a ± 0.8 240 large North Pedjai 15.8a ± 1.7 47 small South Salt 10.8b ± 0.8 214 small Central Site 12.0b ± 0.8 200 medium Central
4 s.e.m. is standard error of the mean

14
C:\degraaf\Ghana\final97.doc 29-7-2001
Table 7: Mean daily catch per bundle (±± s.e.m) at the different landing sites in Stratum VII of Lake Volta. . Different superscripts indicate a significant difference (P≤≤0.005).
Landing site CPUE-bundle
(kg/day) n
size Location
Abodwese 12.8a ± 0.9 63 medium South Avorkope 12.4a ± 0.8 69 large South Blackie 12.3a ± 0.7 94 medium North Fanti 7.6b ± 0.5 240 medium Central Gbevukpo 11.1a ± 0.7 105 large North Jaklai 7.3b ± 0.5 234 medium Central Kejawu 9.1a ± 0.6 163 large North Pedjai 14.2a ± 1.2 47 small South Salt 4.6b ± 0.5 186 small Central Site 5.1b ± 0.6 167 medium Central The analysis indicates that the catches at the landing sites around Yeji in the central part of Stratum VII differ strongly from the others. The catches within the geographical locations do not differ among the different sizes of landing site. The overall difference between “Large”, “Medium” and “Small” is artificial and is caused by the low catches for “Small” and “Medium” sized villages obtained in the Central area and the relative large number of samples obtained from this area. Results of an ANOVA which uses the geographical location ‘North”, “Central” and “South” in relation to the obtained CPUE is presented in Table 7. Table 8: Mean catch per canoe and mean catch per bundle (± s.e.m) in the
Northern, Central and Southern sector of Stratum VII of Lake Volta. Different superscripts indicate a significant difference (P≤≤0.005).
Sector Catch/canoe/day
(kg/day) n Catch/bundle/day
(kg/day) n
North 14.7a ± 0.52 530 10.5a ± 0.26 362 Central 11.0b ± 0.39 939 6.3b ± 0.38 800 South 19.9c ± 0.72 272 12.9c ± 0.57 166 The results of the analysis clearly indicate differences in catches on basis of the geographical zonation, with the highest catch in the South and the lowest catches in the Central part. Coupled with the information that the CPUE in the Central part reduces the overall CPUE in the North and the South, it was been decided not to stratify for “Large, Medium or Small” but to use the geographical location of the landing sites as stratification criteria.

15
C:\degraaf\Ghana\final97.doc 29-7-2001
4.4 Estimation of the total annual catch of Stratum VII of Lake Volta.
Estimation of the total catch of Stratum VII was the major goal of the Catch Assessment Survey. Two different estimations were made. A total catch estimation without stratification and a total catch estimation with stratification as North, Central or South. The two methods were then compared afterwards. Total catch estimates were made for 1996 which had a complete data set for the year only. The catches of canoes utilising gillnets and winchboats were considered only. The data available from the frame survey and catch assessment survey on beach seines, traps, hook and line, nifa-nifa, etc., was not sufficient to include them.
4.4.1 Non-stratified catch estimation.
4.4.1.1 Method used In principle the total catch was estimated as; Total catch = No. of canoes* annual catch/canoe + No. of Winch*annual catch/winchboat
The frame survey estimated the total number of canoes at 8068 and the total number of winchboats at 358. Estimation of the annual catch was made with the results of the catch assessment. It took into consideration the seasonal fluctuation in CPUE-canoe, the relative fishing effort i.e. the percentage of canoes that went fishing on a sampling day and the number of days fishermen went fishing in a week.
4.4.1.2 Canoes
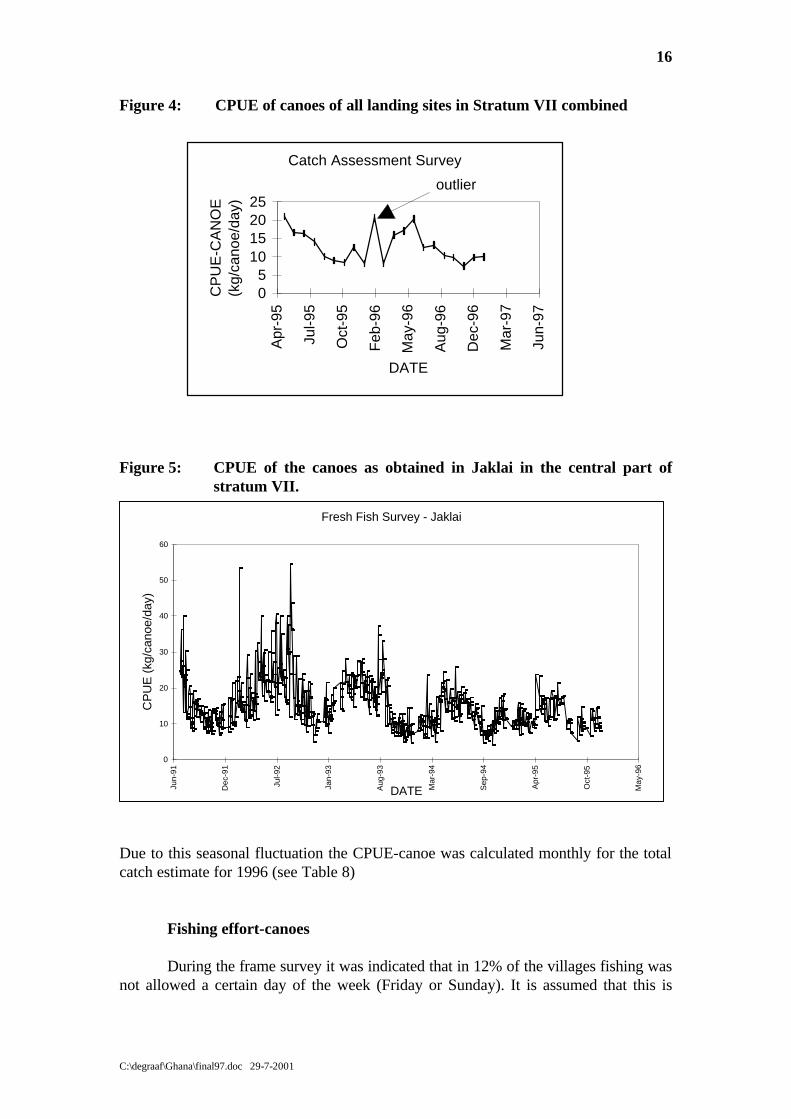
CPUE-canoe As indicated in Figures 4 & 5 the CPUE-canoe varies throughout the season with peak catches in July/August and low catches in January/February. Figure 3 indicate a significant outlier in February 1996, when a unusual high catch was observed during sampling in the South.
16
C:\degraaf\Ghana\final97.doc 29-7-2001
Figure 4: CPUE of canoes of all landing sites in Stratum VII combined
Figure 5: CPUE of the canoes as obtained in Jaklai in the central part of
stratum VII.
Due to this seasonal fluctuation the CPUE-canoe was calculated monthly for the total catch estimate for 1996 (see Table 8) Fishing effort-canoes During the frame survey it was indicated that in 12% of the villages fishing was not allowed a certain day of the week (Friday or Sunday). It is assumed that this is
Catch Assessment Survey
05
10152025
Apr
-95
Jul-9
5
Oct
-95
Feb
-96
May
-96
Aug
-96
Dec
-96
Mar
-97
Jun-
97
DATE
CP
UE
-CA
NO
E
(kg/
cano
e/da
y)
outlier
Fresh Fish Survey - Jaklai
0
10
20
30
40
50
60
Jun-
91
Dec
-91
Jul-9
2
Jan-
93
Aug
-93
Mar
-94
Sep
-94
Apr
-95
Oct
-95
May
-96
DATE
CP
UE
(kg
/can
oe/d
ay)

17
C:\degraaf\Ghana\final97.doc 29-7-2001
uniformly covered the whole of Stratum VII and the fishing days are adjusted for this phenomenon and is expressed as primary fishing days (see Table 8) The fishing effort is the number of canoes multiplied by the fraction of the canoes which went fishing and the monthly data as obtained from Stratum VII is presented in Figure 6. Figure 6: The fishing effort in Stratum VII of Lake Volta.
It seems that the effort is following the same pattern as the CPUE-canoe. Approximately 40% of the canoes were observed to be fishing during November-January and this increased to about 60% in July-August. As for the CPUE-canoes the fraction of fishing canoes is calculated monthly for the estimation of the total catch in Stratum VII. The number of canoe fishing days in a month for the whole of Stratum VII was calculated as follows: Canoe days = {0.12*(day in the month-4)+0.88(day in the month)}*fraction of fishing canoes Finally the monthly total catch was calculated by multiplying the total monthly canoe fishing days with the mean of the CPUE-canoe for that month and the results are presented in Table 9.
Fishing effort, Stratum VII
20
30
40
50
60
70
80
Apr
-95
Aug
-95
Sep
-95
Oct
-95
Nov
-95
Jan-
96
Feb
-96
Mar
-96
Apr
-96
May
-96
Jun-
96
Jul-9
6
Aug
-96
Sep
-96
Oct
-96
Nov
-96
Dec
-96
Jan-
97
Date
% o
f can
oes
that
go
fishi
ng
18
C:\degraaf\Ghana\final97.doc 29-7-2001
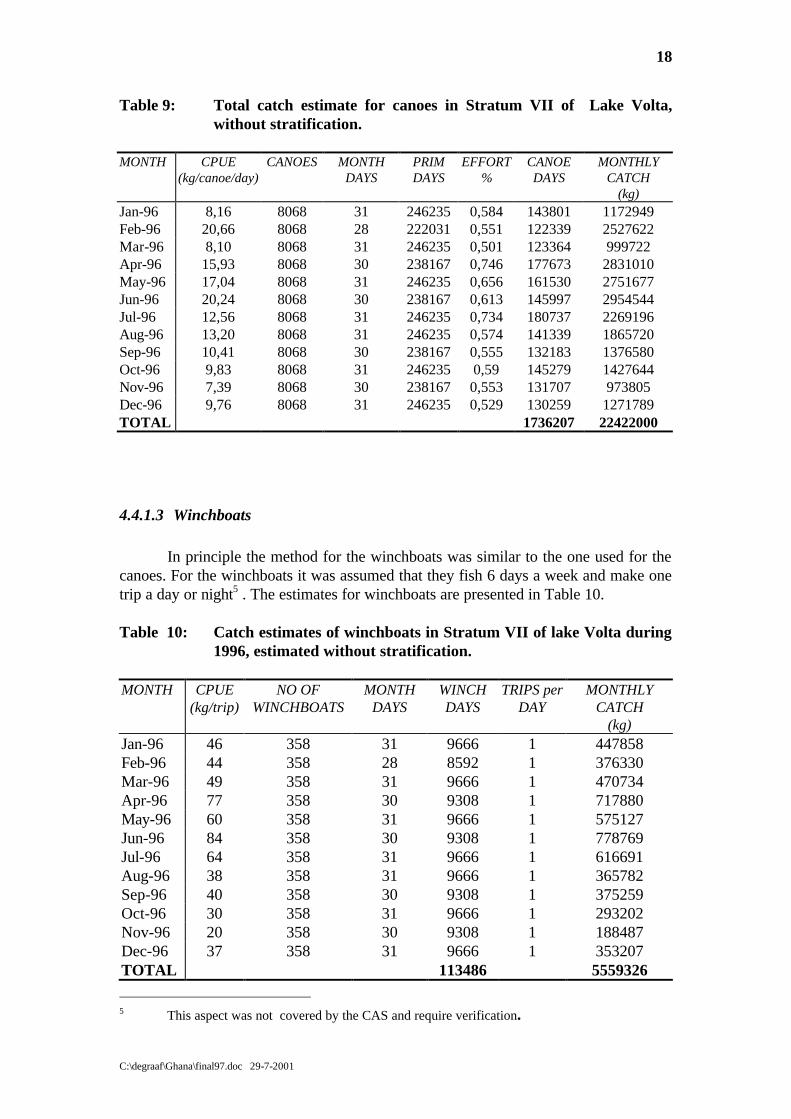
Table 9: Total catch estimate for canoes in Stratum VII of Lake Volta, without stratification.
MONTH CPUE
(kg/canoe/day) CANOES MONTH
DAYS PRIM DAYS
EFFORT %
CANOE DAYS
MONTHLY CATCH
(kg) Jan-96 8,16 8068 31 246235 0,584 143801 1172949 Feb-96 20,66 8068 28 222031 0,551 122339 2527622 Mar-96 8,10 8068 31 246235 0,501 123364 999722 Apr-96 15,93 8068 30 238167 0,746 177673 2831010 May-96 17,04 8068 31 246235 0,656 161530 2751677 Jun-96 20,24 8068 30 238167 0,613 145997 2954544 Jul-96 12,56 8068 31 246235 0,734 180737 2269196 Aug-96 13,20 8068 31 246235 0,574 141339 1865720 Sep-96 10,41 8068 30 238167 0,555 132183 1376580 Oct-96 9,83 8068 31 246235 0,59 145279 1427644 Nov-96 7,39 8068 30 238167 0,553 131707 973805 Dec-96 9,76 8068 31 246235 0,529 130259 1271789 TOTAL 1736207 22422000
4.4.1.3 Winchboats
In principle the method for the winchboats was similar to the one used for the canoes. For the winchboats it was assumed that they fish 6 days a week and make one trip a day or night5 . The estimates for winchboats are presented in Table 10. Table 10: Catch estimates of winchboats in Stratum VII of lake Volta during
1996, estimated without stratification. MONTH CPUE
(kg/trip) NO OF
WINCHBOATS MONTH
DAYS WINCH DAYS
TRIPS per DAY
MONTHLY CATCH
(kg) Jan-96 46 358 31 9666 1 447858 Feb-96 44 358 28 8592 1 376330 Mar-96 49 358 31 9666 1 470734 Apr-96 77 358 30 9308 1 717880 May-96 60 358 31 9666 1 575127 Jun-96 84 358 30 9308 1 778769 Jul-96 64 358 31 9666 1 616691 Aug-96 38 358 31 9666 1 365782 Sep-96 40 358 30 9308 1 375259 Oct-96 30 358 31 9666 1 293202 Nov-96 20 358 30 9308 1 188487 Dec-96 37 358 31 9666 1 353207 TOTAL 113486 5559326
5 This aspect was not covered by the CAS and require verification.

19
C:\degraaf\Ghana\final97.doc 29-7-2001
4.4.1.4 Total catch and Confidence Limits
The total catch for the canoes and the winchboats has been calculated with the average monthly CPUE’s. The maximum catch (95% confidence limit) can be calculated by replacing the CPUE’s monthly with the 95% upper limit (average CPUE+1.96*standard error). For the minimum catch the monthly CPUE’s are replaced with the lower limit (CPUE-1.96*standard error). A summary of the results is presented in Table 11.
Table 11: Mean total catch (in kg/year) of Stratum VII of Lake Volta and
its 95% upper and lower limit, estimated without stratification. Mean
(kg/year) Max. (95%) (kg/year)
Min (95%) (kg/year)
Total catch canoes (t/year) 22422 26065 18779 Total catch winch (t/year) 5559 7054 4064 Total catch Stratum VII (t/year) 27981 33119 22843
4.4.2 Estimates of total catch in Stratum with stratification “North, Central and South”
4.4.2.1 Key parameters As discussed before significant differences are observed in the catches in the Northern, southern and Central area of stratum VII. The rather large impact of the sampling station in the central area with relatively low catches lead to an under estimate of the total catch when no stratification is used. Key parameters used in the analysis are presented in Table 12. Table 12: Key parameters of the Northern, Central and Southern area of
Stratum VII of Lake Volta. Area No. of Canoes % canoes that do
not fish one day in the week
No of Winchboats
North 2805 3.8 176 Central 1445 5.3 96 South 3818 18.9 86

20
C:\degraaf\Ghana\final97.doc 29-7-2001
4.4.2.2 Total catch canoes. In principle the estimation method was more or less similar to the one used for canoes in the case of no-stratification. The only difference was that in the Northern and Southern area the CPUE was determined bi-monthly. The results for the Northern, Central and Southern area are presented in Tables 13, 14 & 15. Table 13: Catch estimates of canoes in the Northern area of Stratum VII of
Lake Volta. MONTH CPUE
(kg/canoe/day) CANOES MONTH
DAYS PRIM DAYS
EFFORT %
CANOE DAYS
MONTHLY CATCH
(kg) Jan-96 12,11 2805 31 86360 0,58 50089 606578 Feb-96 35,34 2805 28 77945 0,63 49222 1739512 Mar-96 35,34 2805 31 86360 0,63 54407 1922744 Apr-96 13,34 2805 30 83555 0,88 73529 981234 May-96 13,34 2805 31 86360 0,88 75997 1013801 Jun-96 18,42 2805 30 83555 0,63 52640 969639 Jul-96 18,42 2805 31 86360 0,63 54407 1002177 Aug-96 9,09 2805 31 86360 0,39 33681 306080 Sep-96 9,09 2805 30 83555 0,39 32587 296212 Oct-96 10,62 2805 31 86360 0,59 50953 541168 Nov-96 10,62 2805 30 83555 0,59 49298 523541 Dec-96 11,03 2805 31 86360 0,40 34544 380953 TOTAL 2523527 10283639

21
C:\degraaf\Ghana\final97.doc 29-7-2001
Table 14: Catch estimates of canoes in the Central area of Stratum VII of Lake Volta.
MONTH CPUE
(kg/canoe/day) CANOES MONTH
DAYS PRIM DAYS
EFFORT %
CANOE DAYS
MONTHLY CATCH
(kg) Jan-96 8,16 1445 31 44575 0,58 26014 212190 Feb-96 6,87 1445 28 40240 0,52 20933 143739 Mar-96 8,10 1445 31 44575 0,51 22644 183506 Apr-96 14,29 1445 30 43130 0,70 30252 432340 May-96 17,04 1445 31 44575 0,66 29237 498053 Jun-96 13,00 1445 30 43130 0,58 25016 325203 Jul-96 12,56 1445 31 44575 0,73 32540 408548 Aug-96 8,35 1445 31 44575 0,65 28974 241978 Sep-96 10,41 1445 30 43130 0,55 23722 247043 Oct-96 8,82 1445 31 44575 0,58 25854 228137 Nov-96 7,39 1445 30 43130 0,55 23722 175392 Dec-96 7,35 1445 31 44575 0,61 27057 198786 TOTAL 315964 3294916

22
C:\degraaf\Ghana\final97.doc 29-7-2001
Table 15: Catch estimates of canoes in the Southern area of Stratum VII of
Lake Volta. MONTH CPUE
(kg/canoe/day) CANOES MONTH
DAYS PRIM DAYS
EFFORT %
CANOE DAYS
MONTHLY CATCH
(kg)
Jan-96 15,37 3818 31 115472 0,44 50692 779136 Feb-96 15,55 3818 28 104018 0,44 45664 709863 Mar-96 15,55 3818 31 115472 0,65 75057 1167129 Apr-96 23,66 3818 30 111654 0,65 72575 1717067 May-96 23,66 3818 31 115472 0,59 68013 1609182 Jun-96 23,55 3818 30 111654 0,59 65764 1549056 Jul-96 23,55 3818 31 115472 0,65 75057 1767581 Aug-96 21,77 3818 31 115472 0,65 75057 1633640 Sep-96 21,77 3818 30 111654 0,59 65585 1427792 Oct-96 8,65 3818 31 115472 0,59 67828 586577 Nov-96 8,65 3818 30 111654 0,53 59176 511876 Dec-96 12,22 3818 31 115472 0,53 61200 747931 TOTAL 781667 14206831 The total canoe catch in 1996 in respectively the Northern, Central and Southern areas was 10,283 tonnes, 3,294 tonnes and 14,266 tonnes, with a total canoe catch of 27,785 tonnes.
4.4.2.3 The winchboats. As with the canoes in the Northern and Southern area the CAS was executed bi-monthly and results were used for the calculation of two months. In a number of months no winchboats were sampled at all and in this case the average CPUE for that month was taken from the non-stratified data set. The results for the Northern, Central and Southern area are presented in Tables 16, 17 and 18.

23
C:\degraaf\Ghana\final97.doc 29-7-2001
Table 16: Catch estimates of winchboats in the Northern area of Stratum VII of Lake Volta.
MONTH CPUE
(kg/trip) WINCHBOATS MONTH
DAYS WINCH DAYS
TRIPS per DAY
MONTHLY CATCH
(kg) Jan-96 57,17 176 31 4752 1 271656 Feb-96 46,67 176 28 4224 1 197120 Mar-96 46,67 176 31 4752 1 221760 Apr-96 67,88 176 30 4576 1 310596 May-96 67,88 176 31 4752 1 322542 Jun-96 96,88 176 30 4576 1 443300 Jul-96 96,88 176 31 4752 1 460350 Aug-96 33,00 176 31 4752 1 156816 Sep-96 33,00 176 30 4576 1 151008 Oct-96 52,86 176 31 4752 1 251177 Nov-96 52,86 176 30 4576 1 241874 Dec-96 61,67 176 31 4752 1 293040 TOTAL 3321239 Table 17: Catch estimates of winchboats in the Central area of Stratum VII
of Lake Volta. MONTH CPUE
(kg/trip) WINCHBOATS MONTH
DAYS WINCH DAYS
TRIPS per DAY
MONTHLY CATCH
(kg) Jan-96 46,33 96 31 2592 1 120096 Feb-96 39,50 96 28 2304 1 91008 Mar-96 48,70 96 31 2592 1 126230 Apr-96 48,80 96 30 2496 1 121805 May-96 59,50 96 31 2592 1 154224 Jun-96 70,00 96 30 2496 1 174720 Jul-96 63,80 96 31 2592 1 165370 Aug-96 38,41 96 31 2592 1 99563 Sep-96 40,32 96 30 2496 1 100628 Oct-96 25,00 96 31 2592 1 64800 Nov-96 20,25 96 30 2496 1 50544 Dec-96 28,23 96 31 2592 1 73165 TOTAL 1342153

24
C:\degraaf\Ghana\final97.doc 29-7-2001
Table 18: Catch estimates of winchboats in the Southern area of Stratum VII of Lake Volta.
MONTH CPUE
(kg/trip) WINCHBOATS MONTH
DAYS WINCH DAYS
TRIPS per
DAY
MONTHLY CATCH
(kg) Jan-96 46,33 86 31 2322 1 107586 Feb-96 43,80 86 28 2064 1 90403 Mar-96 48,70 86 31 2322 1 113081 Apr-96 136,67 86 30 2236 1 305587 May-96 59,50 86 31 2322 1 138159 Jun-96 60,00 86 30 2236 1 134160 Jul-96 63,80 86 31 2322 1 148144 Aug-96 37,84 86 31 2322 1 87869 Sep-96 40,32 86 30 2236 1 90146 Oct-96 13,33 86 31 2322 1 30960 Nov-96 20,25 86 30 2236 1 45279 Dec-96 22,13 86 31 2322 1 51394 TOTAL 1342768 The total catch of winchboats in respectively the Northern, Central and Southern area was 3,321 tonnes, 1,342 tonnes and 1,342 tonnes, with a total of 4,359 tonnes.
4.4.2.4 Total catch and Confidence Limits
The total catch for the canoes and the winchboats has been calculated with the average monthly CPUE’s. The maximum catch (95% confidence limit) can be calculated by replacing the CPUE’s monthly with the 95% upper limit (average CPUE+1.96*standard error). For the minimum catch the monthly CPUE’s are replaced with the lower limit (CPUE-1.96*standard error). A summary of the results is presented in Table 19. Table 19: Mean total catch of Stratum VII of Lake Volta and its 95% upper
and lower limit, estimated without stratification. Mean
(tonnes) Max. (95%) Min (95%)
(kg) Total catch canoes North 10283 12321 8077 Total catch canoes Central 3294 3847 2743 Total catch canoes South 14266 17888 10178 Total catch winch North 3321 3558 3070 Total catch winch Central 1342 1457 1226 Total catch winch South 1342 1496 1449 Total catch Stratum VII (t/year) 33848 40567 26743

25
C:\degraaf\Ghana\final97.doc 29-7-2001
It shows that Stratum VII of Lake Volta on the average produced 33,800 tonnes in 1996 if stratification is used for the estimate. The lowest estimate for 1996 is 26,700 tonnes.
4.4.3 Comparison of catch estimates.
A summary of the results of estimation without stratification and with stratification is presented in Table 20. Table 20: Comparison of the total catch in Stratum VII estimated without
and with stratification. Non stratified
(t/year) Stratified (t/year)
Average gillnets 22422 27843 Max. gillnets 26065 34056 Min gillnets 18779 20988 Average winch 5559 6005 Max. winch 7054 6511 Min winch 4064 5745 Average all 27981 33848 Max. all 33119 40567 Min all 22843 26743 Stratum VII of Volta produced between 27.900 and 33,800 tonnes in 1996 depending on the method used for the estimation. Due to the impact of the lower catches in the Central area it was concluded that stratification is indeed necessary and 33,800 tonnes is the final total catch estimate for Stratum VII of Lake Volta for 1996.
4.4.4 An analysis of catch trends and extrapolation for the whole of Lake Volta
In this chapter an analysis of catches is given. It is mainly given as an illustration of how catch and effort data can be used and why long term monitoring programmes and regular updating of the frame survey is an absolute necessity for proper fisheries analysis. The available data does not allow at present to make a complete analysis for the whole of Stratum VII. Since 1991 the catch in Jaklai is monitored weekly by the “fresh fish survey” and it is observed that the CPUE decreased significantly over the years (Table 21)

26
C:\degraaf\Ghana\final97.doc 29-7-2001
Table 21: Fisheries data of Jaklai in the central area of Stratum VII of Lake
Volta during 1991-1996. Year No of Canoes CPUE ± std6
(kg/canoe/day) Significance
(P) 1991/1992 6,500 16.4±6.1 - 1992 ? 18.9±8.5 0.001 1993 ? 16.2±6.5 0.001 1994 ? 12.5±4.2 0.0001 1995 8,060 12.1±3.5 . 1996 8,060 (?) 12.2±11.3 . With the surplus production model of Schaefer it can be seen if overfishing takes place by using catch and effort data such as the ones presented in Table 21. The objective of the Schaefer model is to determine the optimum level of effort (no. of canoes); the effort that produces the maximum yield (total catch) that can be sustained without affecting the long-term productivity of the stock, the so-called Maximum Sustainable Yield (MSY). In the Schaefer model the effort is plotted against the Catch per Unit of effort after which the regression line is calculated following:
Y(i)/f(i) = a + b*f(i) The slope and the intercept of the regression line is further used for the calculation of the annual yields;
Y(i) = a*f(i) + b* f(i)*f(i) The MSY is calculated with MSY =- 0.25*a*a/b and the corresponding Fmsy with Fmsy = -0.5*a/b. The Schaefer-curve of Stratum VII of Lake Volta is presented in Figure 7.
6 std is standard deviation
27
C:\degraaf\Ghana\final97.doc 29-7-2001
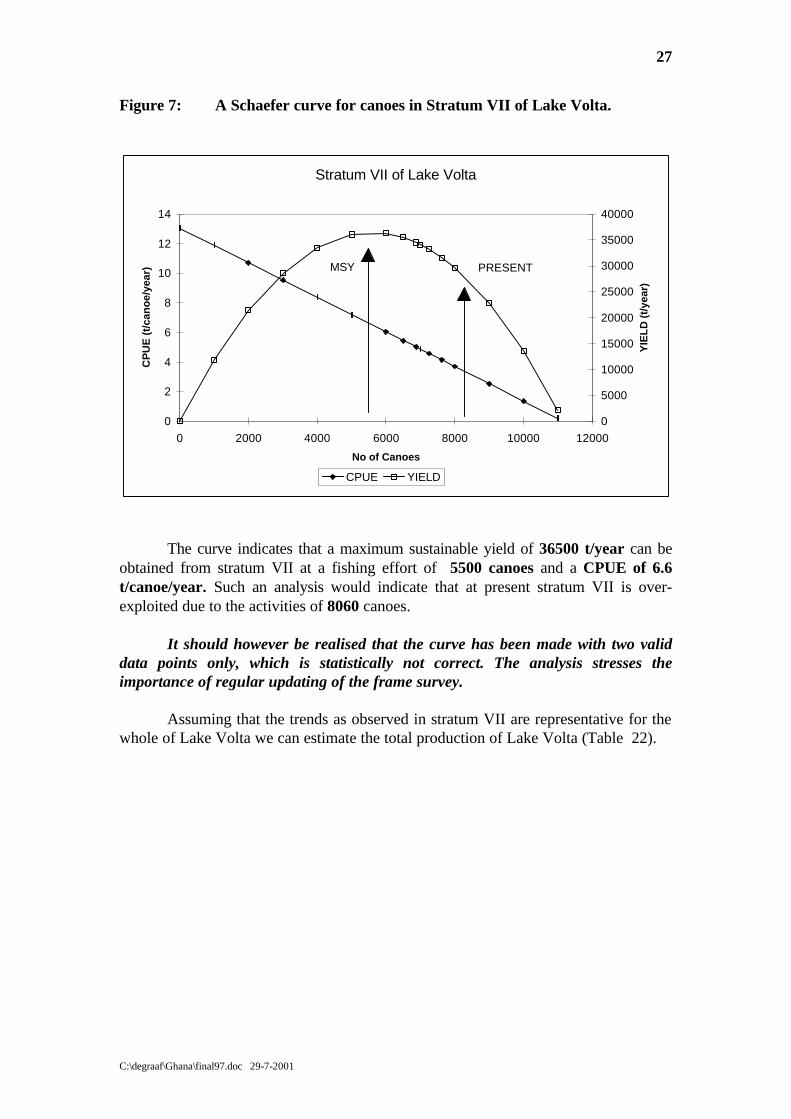
Figure 7: A Schaefer curve for canoes in Stratum VII of Lake Volta.
The curve indicates that a maximum sustainable yield of 36500 t/year can be obtained from stratum VII at a fishing effort of 5500 canoes and a CPUE of 6.6 t/canoe/year. Such an analysis would indicate that at present stratum VII is over-exploited due to the activities of 8060 canoes. It should however be realised that the curve has been made with two valid data points only, which is statistically not correct. The analysis stresses the importance of regular updating of the frame survey. Assuming that the trends as observed in stratum VII are representative for the whole of Lake Volta we can estimate the total production of Lake Volta (Table 22).
Stratum VII of Lake Volta
0
2
4
6
8
10
12
14
0 2000 4000 6000 8000 10000 12000
No of Canoes
CP
UE
(t/
can
oe/
year
)
0
5000
10000
15000
20000
25000
30000
35000
40000
YIE
LD
(t/
year
)
CPUE YIELD
MSY PRESENT

28
C:\degraaf\Ghana\final97.doc 29-7-2001
Table 22: Extrapolated production figures for the different strata of Lake Volta.
Stratum No. Canoes
in 1978 % of total no. of canoes Fopt-1996
(No. of Canoes) MSY
(t/year) 1 3092 21 8596 57000 2 1894 13 5265 35000 3 2614 18 7267 48000 4 2645 18 7353 49000 5 908 6 2524 17000 6 588 4 1635 10000 7 1978 13 5500 36500 8 1027 7 2855 19000 Total 14746 100 41000 271500 A maximum fishing effort of 41,000 canoes and a MSY of 271,000 t/year for the whole of Lake Volta is certainly an overestimation. Most likely the fishermen are moving to the most productive strata and that the distribution of the canoes over the different strata has changed over the years. A new full frame survey for the whole of Lake Volta would clarify this and is an essential exercise. It is however certain that the previous used production figure of 44,000 t/year for Lake Volta is an under-estimation, as the actual total catch of Stratum VII is already 33.800 t/year. The total production of Lake Volta most likely will be around 150,000 -200,000 t/year (180-240 kg/ha) with a total annual value of 30 million USD This is a substantial quantity, if compared with the annual marine catches of 300,000-400,000 t/year, and it justifies that serious action is taken in order to protect the productivity of this natural resource. A production of 180-240 kg/ha/year is high but not un-common for African lakes as can be seen from the examples below. Lake Albert (Uganda) 182 kg/ha/year Lake George (Uganda) 108 kg/ha/year Lake Nakawali (Uganda) 236 kg/ha/year Lake Kainji (Nigeria) 100 kg/ha/year

29
C:\degraaf\Ghana\final97.doc 29-7-2001
4.5 Species composition of the catch in Stratum VII
4.5.1 Gillnets
4.5.1.1 Long-term trends Results of the fresh fish survey in Jaklai are used to analyse long-term trends in species composition. The results are presented in Figure 8. It should be remarked that during 1991 H. membraceus and S. schall were grouped as Synodontis. Figure 8: The species composition of gillnets In Stratum VII of Lake Volta.
No regular seasonal pattern could be detected. It seems, however that a distinct shift in species composition took place in 94/95 whereby Chrysichthys has been replaced by Schilbe. It could not be verified if this trend continued in 1996 as the data were at the Legon University for entering in Dbase. A further analysis will be carried out in the near future.
4.5.1.2 Geographical differences There is a distinct difference in species composition of the gillnets in the North or the South as can be seen in Figure 9 & 10. In the North a large part of the catch consists of O. niloticus, L. coubie and S. galileus. While in the South the two tilapia species are almost absent and the bulk of the catch consists of C. auratus, C. nigrodigitatus and H. membraceus. This difference again stresses the importance of
JAKLAI, SPECIES COMPOSITION
0%
20%
40%
60%
80%
100%
Jul-9
1
Oct
-91
Jan-
92
Apr
-92
Jul-9
2
Oct
-92
Jan-
93
Apr
-93
Jul-9
3
Oct
-93
Jan-
94
Apr
-94
Jul-9
4
Oct
-94
Jan-
95
Apr
-95
Jul-9
5
Oct
-95
MONTH
% O
F T
OT
AL
CA
TC
H
Others
Alestes
Schilbe
Bagrus
Mormiridae
Labeo
Chrys
Tilapia
Syno
H.memb

30
C:\degraaf\Ghana\final97.doc 29-7-2001
stratification in North, Central and South. The reason for the difference will be further studied. Figure 9: Species composition of gillnets in the northern area of Stratum VII
of Lake Volta.
Figure 10: Species composition of gillnets in the Southern area of Stratum VII
of Lake Volta.
Gillnets, North
0%
20%
40%
60%
80%
100%
Apr
-95
Jun-
95
Aug
-95
Oct
-95
Dec
-95
Feb
-96
Apr
-96
Jun-
96
Aug
-96
Oct
-96
Dec
-96
Date
Per
cen
tag
e o
f to
tal c
atch
Others
O.nil
L.coub
A.barem
S.interm
H.memb
C.nigro
C.aura
S.gal
Gillnets, South
0%
20%
40%
60%
80%
100%
Oct
-95
Nov
-96
Dec
-95
Jan-
96
Feb
-96
Mar
-96
Apr
-96
May
-96
Jun-
96
Jul-9
6
Aug
-96
Sep
-96
Oct
-96
Nov
-96
Dec
-96
Date
Per
cen
tag
e o
f to
tal c
atch
Others
O.nil
L.coub
A.barem
S.interm
H.memb
C.nigro
C.aura
S.gal
31
C:\degraaf\Ghana\final97.doc 29-7-2001
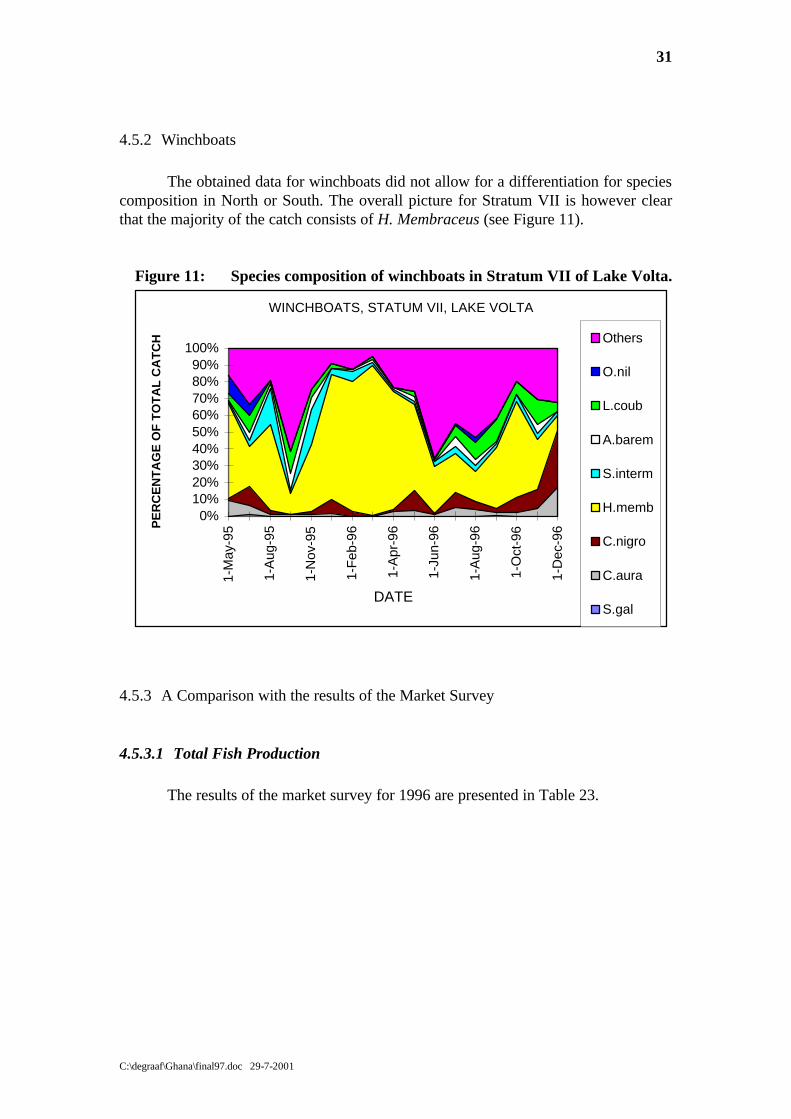
4.5.2 Winchboats
The obtained data for winchboats did not allow for a differentiation for species composition in North or South. The overall picture for Stratum VII is however clear that the majority of the catch consists of H. Membraceus (see Figure 11).
Figure 11: Species composition of winchboats in Stratum VII of Lake Volta.
WINCHBOATS, STATUM VII, LAKE VOLTA
0%10%20%30%40%50%60%70%80%90%
100%
1-M
ay-9
5
1-A
ug-9
5
1-N
ov-9
5
1-F
eb-9
6
1-A
pr-9
6
1-Ju
n-96
1-A
ug-9
6
1-O
ct-9
6
1-D
ec-9
6
DATE
PE
RC
EN
TA
GE
OF
TO
TA
L C
AT
CH Others
O.nil
L.coub
A.barem
S.interm
H.memb
C.nigro
C.aura
S.gal
4.5.3 A Comparison with the results of the Market Survey
4.5.3.1 Total Fish Production The results of the market survey for 1996 are presented in Table 23.

32
C:\degraaf\Ghana\final97.doc 29-7-2001
Table 23: The quantity of smoked, dried or processed fish and its equivalent in fresh fish which passed through the Yeji market in 1996.
Species
Smoked (t/year)
% dried (t/year)
% processed (t/year)
% Fresh Weight Equivalent (t/year)
Alestes 63 3.9 27 1.2 90 2.4 201 Bagrus/Aucheno 28 1.7 9 0.4 38 1.0 85 Chrysichthys 787 48.0 178 8.2 965 25.3 2210 Citharinus 5 0.4 1 0.1 6 0.2 15 Clarias 55 3.4 5 0.3 61 1.6 143 Cynothrissa 32 2.0 3 0.1 35 0.9 82 Distichodus 9 0.6 4 0.2 13 0.4 30 Gymnarchus 3 0.2 2 0.1 6 0.2 13 Heterotis 3 0.2 67 3.1 71 1.9 130 Hydrocynus 5 0.3 17 0.8 22 0.6 43 Labeo 201 12.3 52 2.4 253 6.7 578 Lates 2 0.2 11 0.5 13 0.4 26 Mormyridae 18 1.1 60 2.8 78 2.1 152 Schilbeidae 45 2.8 13 0.6 59 1.6 134 Synodontis 302 18.4 65 3.0 367 9.6 842 Tilapia 73 4.5 1656 76.1 1730 45.3 3158 TOTAL 1639 2176 3816 7852
The market survey indicated that 7852 tonnes (in fresh fish equivalents) passed through Yeji market in 1996. This is rather low in comparison with a total catch of 33,700 as obtained from the Catch Assessment Survey. The major reasons are; * 44% of all villages in Stratum VII are using Yeji as their only market.
* The fresh weight equivalent was calculated with conversion factors of 1.5 -2. Preliminary results of the fish processing research programme indicated that the conversion factor should be in the order of 2 -3, which would increase the fresh weight equivalent to about 15,000 t/year. * Home consumption of fish in Stratum VII was estimated at 4,500 t/year and is not accounted for in the market survey. In general it can be concluded that the market survey confirms the results of the catch assessment survey and in the future more attention should be given to the used conversion factors and other outlet channels in Stratum VII.

33
C:\degraaf\Ghana\final97.doc 29-7-2001
4.5.3.2 Species composition A comparison of the species composition as obtained through the market survey and the catch assessment survey is presented in Figure 12. Figure 12: Species composition as obtained with the market and catch
assessment survey.
Both surveys indicate that Tilapia spp, Chrysichthys spp. and Hemisynodontis/Synodontis spp. are the major species. There are however large differences between the two estimates. In the market survey the mentioned species are covering 79%, while in the catch assessment survey they cover only 43%. In the market survey Tilapia spp. are the most important while “Other species” are the most important in the catch assessment survey. The differences are most likely caused by; • The catch assessment survey covers mainly gillnets and winchboats. Traps and
Nifa nifa are not covered. These gears are however very site specific and are mainly catching Tilapia spp. It indicates that in the catch assessment survey more stratification types have to be used.
• Tilapia spp are the highest priced species and are most likely only sold while
the less valuable species are used for home consumption. A small survey could verify this phenomena.
4.6 Biological and technical interactions
4.6.1 The impact of waterlevel
A particular phenomena of Lake Volta the seasonal fluctuation of the waterlevel. Therefore it can be expected that typical “floodplain” characteristics in fisheries such as the “floodpulse concept”, “seasonal growth”, “seasonal reproduction related to water level”, etc are also valid in Lake Volta.
MARKET
40%
28%
11%
2%
7%
3%9% Tilapia
Chrysichthys
Synodontis
Schilbe
Labeo
Alestes
Others
CAS
10%
18%
15%
5%11%4%
37%
Tilapia
Chrysichthys
Synodontis
Schilbe
Labeo
Alestes
Others
34
C:\degraaf\Ghana\final97.doc 29-7-2001
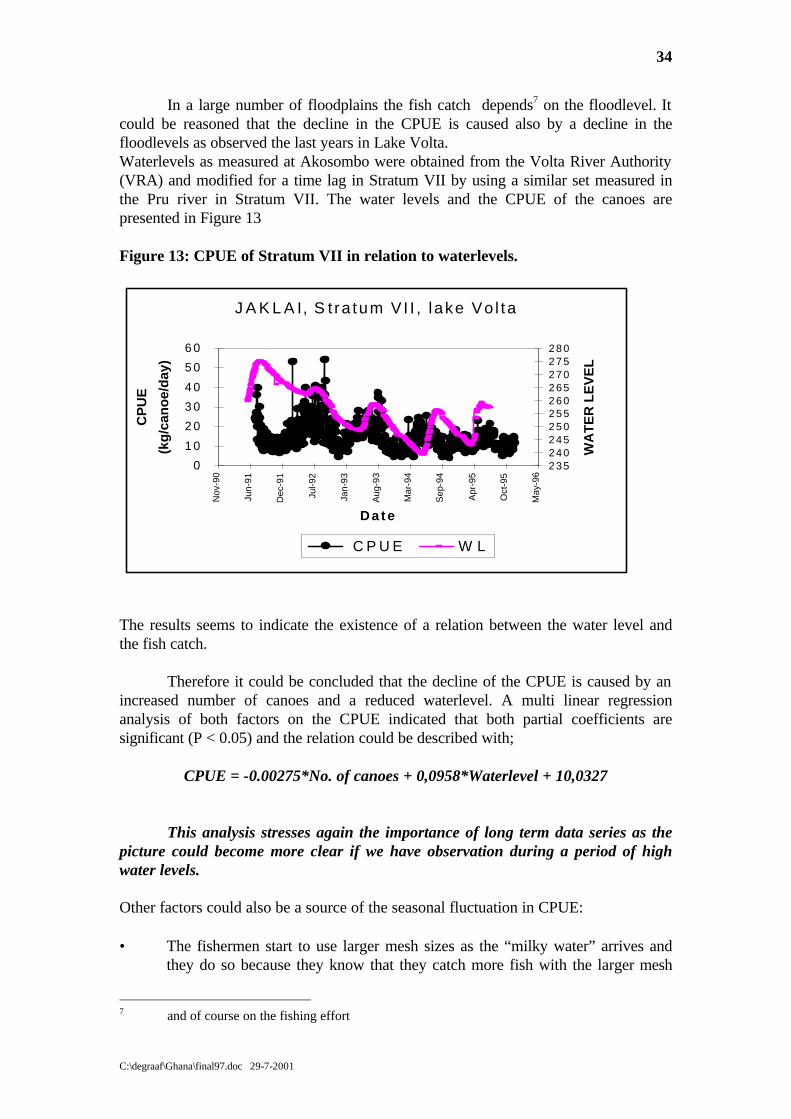
In a large number of floodplains the fish catch depends7 on the floodlevel. It could be reasoned that the decline in the CPUE is caused also by a decline in the floodlevels as observed the last years in Lake Volta. Waterlevels as measured at Akosombo were obtained from the Volta River Authority (VRA) and modified for a time lag in Stratum VII by using a similar set measured in the Pru river in Stratum VII. The water levels and the CPUE of the canoes are presented in Figure 13 Figure 13: CPUE of Stratum VII in relation to waterlevels.
The results seems to indicate the existence of a relation between the water level and the fish catch. Therefore it could be concluded that the decline of the CPUE is caused by an increased number of canoes and a reduced waterlevel. A multi linear regression analysis of both factors on the CPUE indicated that both partial coefficients are significant (P < 0.05) and the relation could be described with;
CPUE = -0.00275*No. of canoes + 0,0958*Waterlevel + 10,0327 This analysis stresses again the importance of long term data series as the picture could become more clear if we have observation during a period of high water levels. Other factors could also be a source of the seasonal fluctuation in CPUE: • The fishermen start to use larger mesh sizes as the “milky water” arrives and
they do so because they know that they catch more fish with the larger mesh
7 and of course on the fishing effort
J A K L A I, S t ra tum VI I , l ake Vo l ta
0
1 0
2 0
3 0
4 0
5 0
6 0
Nov
-90
Jun-
91
Dec
-91
Jul-9
2
Jan-
93
Aug
-93
Mar
-94
Sep
-94
Apr
-95
Oct
-95
May
-96
D a t e
CP
UE
(kg
/can
oe/
day
)
2 3 52 4 02 4 52 5 02 5 52 6 02 6 52 7 02 7 52 8 0
WA
TE
R L
EV
EL
C P U E W L
35
C:\degraaf\Ghana\final97.doc 29-7-2001
sizes This could be true but it could also be an effect of a better catchability due to the higher turbidity. In order to clarify this, monthly a fixed traject (inshore and offshore) should be measured with the echo-sounder in order to determine if their are seasonal changes in abundancy.
4.6.2 Differences within Stratum VII
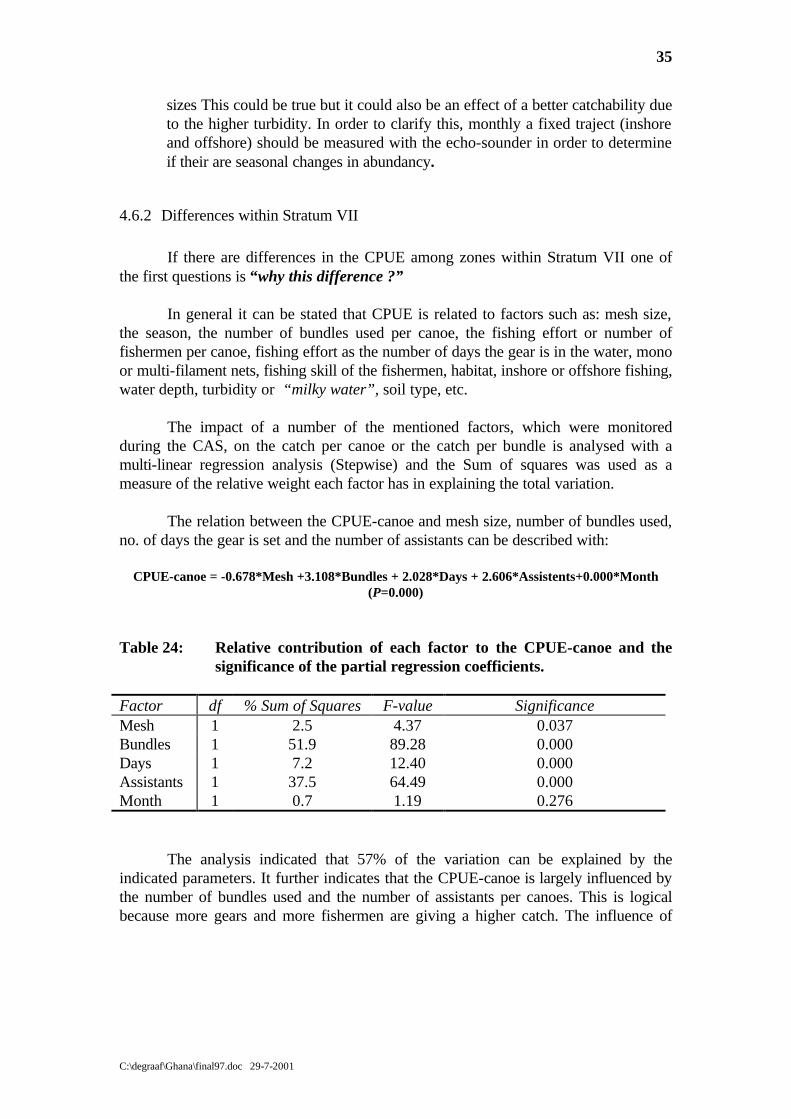
If there are differences in the CPUE among zones within Stratum VII one of the first questions is “why this difference ?” In general it can be stated that CPUE is related to factors such as: mesh size, the season, the number of bundles used per canoe, the fishing effort or number of fishermen per canoe, fishing effort as the number of days the gear is in the water, mono or multi-filament nets, fishing skill of the fishermen, habitat, inshore or offshore fishing, water depth, turbidity or “milky water”, soil type, etc. The impact of a number of the mentioned factors, which were monitored during the CAS, on the catch per canoe or the catch per bundle is analysed with a multi-linear regression analysis (Stepwise) and the Sum of squares was used as a measure of the relative weight each factor has in explaining the total variation. The relation between the CPUE-canoe and mesh size, number of bundles used, no. of days the gear is set and the number of assistants can be described with:
CPUE-canoe = -0.678*Mesh +3.108*Bundles + 2.028*Days + 2.606*Assistents+0.000*Month (P=0.000)
Table 24: Relative contribution of each factor to the CPUE-canoe and the significance of the partial regression coefficients. Factor df % Sum of Squares F-value Significance Mesh 1 2.5 4.37 0.037 Bundles 1 51.9 89.28 0.000 Days 1 7.2 12.40 0.000 Assistants 1 37.5 64.49 0.000 Month 1 0.7 1.19 0.276 The analysis indicated that 57% of the variation can be explained by the indicated parameters. It further indicates that the CPUE-canoe is largely influenced by the number of bundles used and the number of assistants per canoes. This is logical because more gears and more fishermen are giving a higher catch. The influence of

36
C:\degraaf\Ghana\final97.doc 29-7-2001
mesh size, days the gear is set and season8 is outnumbered by the above mentioned factors. Therefore a better insight in the catch will be obtained by analysing the Catch per bundle (CPUE-bundles) The relation between the CPUE-bundles and mesh size, number of days the gear is set, the number of assistants and the month can be described with:
CPUE-canoe = -0.624*Mesh + 1.43*Days + 1.23*Assistents +0.000*Month (P≤≤0.000)
Table 24: Relative contribution of each factor to the CPUE-bundle and the significance of the partial regression coefficients. Factor df % Sum of Squares F-value Significance Mesh 1 7.12 8.92 0.003 Days 1 11,28 14.38 0.000 Assistants 1 26.8 34.15 0.000 Month 1 54.75 69.69 0.000 55% of the total variation of the CPUE-bundles can be explained by the used indicators. Furthermore it becomes clear that a major factor influencing the CPUE-bundle is the season followed by the number of days the gear is set. The question remains whether differences in the number of bundles used, the number of days the gear is set or the number of assistants per canoe in the three geographical sub-strata could explain the difference in the catches per canoe. Differences of the major factors influencing the CPUE-canoe in the three geographical sub-strata are analysed again with an ANOVA and the results are presented in Table 25. Table 25: Mean values of the average mesh size, the number of bundles, the
number of days the gears are set and the number of assistants per canoe in the northern, central and southern area of Stratum VII of Lake Volta. (different superscripts indicate significant difference).
Stratum Mesh size No of bundles Days set No. of Assistants North 2.14a±0.05 1.56a±0.05 1.03a±0.03 2.02a±0.04 Central 2.71b ±0.05 1.91b±0.04 1.34b±0.02 1.79c±0.03 South 2.60b±0.07 1.62b±0.08 1.73c±0.52 2.52c±0.06
8 Month in the model is entered in the international computer code for days which means that
1-Jan-96 is coded as a number: 30400, this could also limited the impact of seasonality. This point will be checked in the near future.

37
C:\degraaf\Ghana\final97.doc 29-7-2001
Significant differences are found for the different areas of Stratum VII but they cannot yet directly explain the different in catches and it is recommended to carry out an in-depth analysis in the near future (World Bank project).

38
C:\degraaf\Ghana\final97.doc 29-7-2001
5. LENGTH BASED STOCK ASSESSMENT PROGRAMME.
In addition to the traditional catch and effort data collection a length-based stock-assessment programme was carried out in Stratum VII of Lake Volta. It was the first time that such a programme was used for the fish stocks of Lake Volta. Therefore within this chapter the methods used and the results are discussed and where necessary details are explained.
5.1 Species and gears
60-70 % of the catch in Stratum VII is comprised of O. niloticus, S. galileus, H. membraceus, C. nigrodigitatus, C. auratus, S. intermedius and L. coubie. Therefore it was decided to concentrate on those species only. The major gears used in Stratum VII are gillnets and the winchboats and they were the only gear sampled for the length-based programme.
5.2 Sampling programme
The length-based sampling programme started in June 1995 and was continued till December 1996. Sampling was carried out monthly in the Central part and bi-monthly in the Northern and Southern part of stratum VII. Commercial winchboats could not be sampled as the fishermen/fish processors did not allow that the fish were measured. Obtaining samples by buying the fish was also not possible. Therefore the project decided to purchase a winchboat with a purse seine (mesh 2 inch, stretched) and all samples were obtained from experimental fishing. It is assumed that the catches are representative for the commercial winchboats.

39
C:\degraaf\Ghana\final97.doc 29-7-2001
Gillnets could be sampled by project staff members as long as not all species within one catch was measured. The latter was acceptable since it would take too much time and the women want to have their fish so they could start the processing. The standard length of the individual fishes was measured with an accuracy of 0.5 cm and from at least 200 fishes the individual weight was recorded in order to determine the length-weight relationship.
5.3 Analysis of data
A preliminary analysis indicated that there were no direct differences for the Northern, Central and Southern part of stratum VII. Therefore it was decided to group9 all data and carry out one analysis for the whole of Stratum VII. Only a complete analysis for 1996 could be made, this as the sampling programme did not cover two complete years. The used analytical methods are well described by Sparre and Venema (199210) and are therefore only summarised in this chapter. For the Yield per Recruit Analysis the project designed a spreadsheet model in MsExcel and all further analysis was carried out by using the computer program FISAT11.
5.3.1 Growth parameters
Growth parameters (k, and L∞) for the von Bertalanffy seasonal growth model were fitted with ELEFAN to grouped length frequency data (gillnets and winchboats combined).While t0 was calculated from the formula;
Log10(-t0) = -0.392-0.275Log10(L∞∞) -1.038Log10(k)
The growth performance indice ϕϕ (phi prime) was calculated from;
ϕϕ = Log10(k) + 2Log10(L∞∞)
5.3.2 Mortalities
Total mortality rate (Z) was estimated using the using the linearized length converted catch curve method, using the growth parameters from the von Bertalanffy
9 This increased the sample size and improved the final results of the analysis. 10 Sparre P. & Venema S.C. (1992) Introduction to tropical fish stock-assessment. Part 1-
manual. FAO Fisheries Technical Paper 306/1 Rev. 1, 337 pp. 11 FAO ICLARM STOCK ASSESSMENT TOOLS

40
C:\degraaf\Ghana\final97.doc 29-7-2001
plot as input data. Natural mortality (M) was estimated with Pauly’s empirical relation ship:
Ln (M) = -0.4851 - 0.0824Ln (L∞∞) + 0.6543Ln(k)+0.463Ln(T) An average water temperature of 29.8 oC was used for the estimate of M.
5.3.3 Yield per Recruit Analysis
Yield per Recruit was calculated in two different ways; • Relative Yield per Recruit model which uses the selection ogives as obtained from
the length converted catch curve and the parameters L∞, M and k. This method is a basic option of FISAT and details are described in the FISAT manual.
• A length-based Beverton and Holt model which considers the length of first
rcruitment into the system12 (Lr) and Length of first capture (Lc) and calculates the Yield per recruit as follows:
Y/R = F*A*W∞∞*[1/Z - 3U/(Z+K) + 3U2/(Z+2K) - U3/(Z+3K)]
Whereby;
A = [ L∞∞-Lc/L∞∞-Lr]M/K
Lc or L50% is length at which 50% of the fish is caught by the gear Lr is Length at first recruitment into the system
U = 1 - (Lc/L∞∞)
5.3.4 Estimation of fishing mortality from Cohort Analysis
A length cohort analysis or Virtual Population Analysis (VPA) was used to estimate the stock size and fishing mortality. The input parameters were: terminal exploitation rate (F/Z), M, k, L∞ and a and b in the length weight relationship. The terminal exploitation rate was chosen so that the exploitation rate of the last 4-5 length groups became approximately equal as they are fully exploited.
5.3.5 Predictive Analysis
12 for all species kept at 1 cm

41
C:\degraaf\Ghana\final97.doc 29-7-2001
Catch and stock biomass are predicted for various levels of fishing effort , using the length-based Thompson and Bell models. Whereby the results of the VPA were used as input parameters In the next chapter for each species the results will be presented and discussed in a summary.

42
C:\degraaf\Ghana\final97.doc 29-7-2001
5.4 Hemisynodontis membraceus
5.4.1 Growth parameters
The growth parameters of H. membraceus for 1996 are presented in Table 26. Table 26: Growth parameters as estimated with ELEFAN for H. membraceus
for Stratum VII of Lake Volta. Parameter L∞ 44 cm K 0.55 year-1 C 0.65 Wp 0.35 year t0 0.26 year Rn 0.232 ϕ 3.0273 Figure 14 shows the growth curves superimposed on the length frequency data. Figure 14: Length frequency data and estimated growth curves of H.
membraceus in Stratum VII of Lake Volta.
The results indicates that at least 4 cohorts are found in the fisheries. The length weight relation ship could be described with:
W = 0.0157 L 3.23

43
C:\degraaf\Ghana\final97.doc 29-7-2001
5.4.2 Gillnets
5.4.2.1 Mortality rates The linearised catch curve of H. membraceus for gillnets is presented in Figure 15. Figure 15: The length converted catch curve of H. membraceus for gillnets in
stratum VII of Lake Volta.
Parameter estimates as obtained from the catch curve are presented in Table 27. Table 27: Parameter estimates as obtained from a length converted catch
curve for H. membraceus caught by gillnets in Stratum VII of Lake Volta.
Parameter Total mortality (Z, year-1) 3.94 Natural mortality (M, year-1) 1.12 Fishing mortality (F, year-1) 2.82 Exploitation rate (E) 0.72 Cut-off length (L’, cm) 23.5 Mean length (from L’, cm) 27.6 L25 (cm) 21.7 L50 (cm) 22.6 L75 (cm) 23.54

44
C:\degraaf\Ghana\final97.doc 29-7-2001
5.4.2.2 Virtual Population Analysis The fishing mortality (F) of gillnets per length group as obtained from a VPA is presented in Figure 16. Figure 16: Fishing mortality from gillnets for H. membraceus in stratum VII
of Lake Volta.
There are two visible peaks in fishing mortality; one small peak at 17 cm and a relative wide peak at 22-30 cm. The difference could be caused by the different mesh sizes or by the different habitats where the gill nets were used. The total catch of H. membraceus by gillnets in 1996 was 1927 tonnes.
5.4.2.3 Yield per Recruit Analysis The results of the Relative Yield per Recruit Analysis is presented in Figure 17.

45
C:\degraaf\Ghana\final97.doc 29-7-2001
Figure 17: Relative Yield per Recruit of H. membraceus caught by gill nets.
The present Exploitation rate was estimated at 0.72 (see table 27) and is indicated by a arrow. The analysis indicated a maximum exploitation rate of 0.62, a E0.1 =0.59 and a E0,5 of B/R = 0,35. If all data are representative it would mean that the exploitation rate of the gillnets is too high.
The input data used in the Yield per Recruit analysis following the length-based Beverton and Holt model are presented in Table 28. Table 28: Input parameters Y/R analysis for H. membraceus SPECIES Hemisynodontis Membraceus
GEARTYPE Gill nets L∞ 44 cm k 0,55 Lr 1 cm M 1,12 Lc present 22,60 cm F 2,82 Lc/L∞ 0,51 a 0,0157 F present 2,82 year b 3,23
The Yield per Recruit curve obtained with those input parameters is presented in Figure 18.
Relative Yield per Recruit, H. membranaceus, Gillnets
0
0,005
0,01
0,015
0,02
0,025
0,03
0 0,1 0,2 0,3 0,4 0,5 0,6 0,7 0,8 0,9 1
Exploitation Rate (E)
Rel
ativ
e Y
ield
/Rec
ruit
0
0,1
0,2
0,3
0,4
0,5
0,6
0,7
0,8
0,9
1
Rel
ativ
e B
iom
ass/
recr
uit
Y'/R B'/R
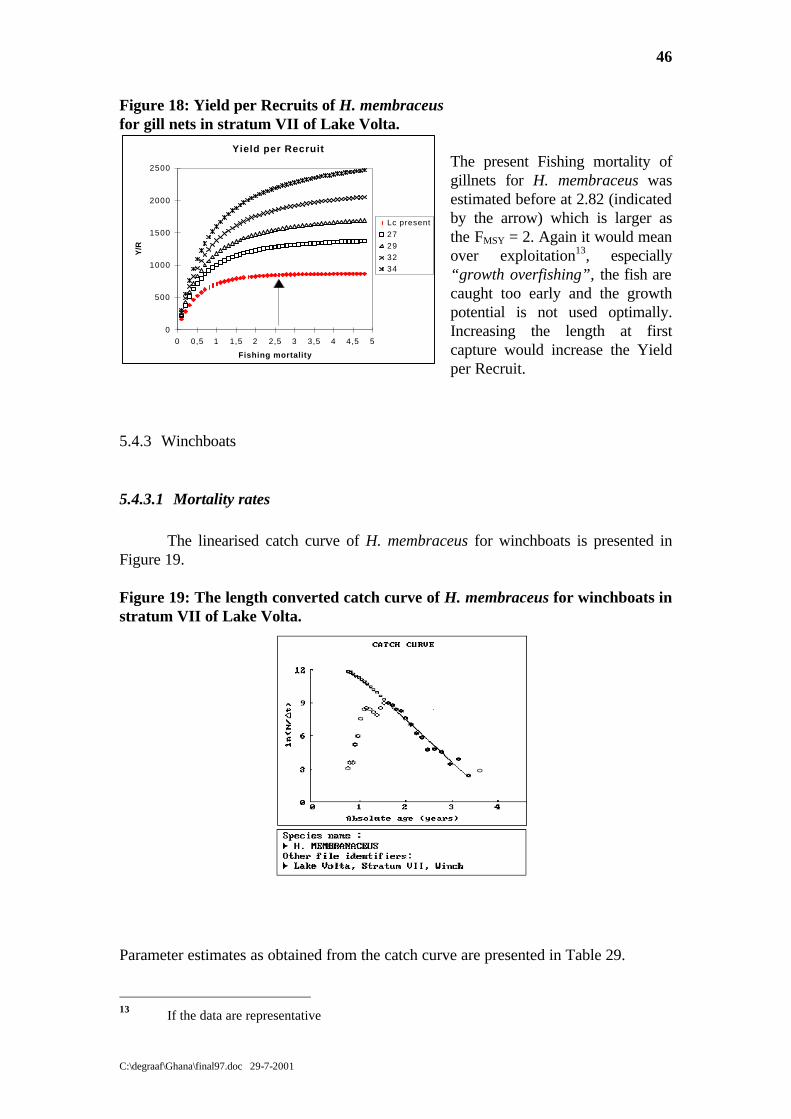
46
C:\degraaf\Ghana\final97.doc 29-7-2001
Figure 18: Yield per Recruits of H. membraceus for gill nets in stratum VII of Lake Volta.
The present Fishing mortality of gillnets for H. membraceus was estimated before at 2.82 (indicated by the arrow) which is larger as the FMSY = 2. Again it would mean over exploitation13, especially “growth overfishing”, the fish are caught too early and the growth potential is not used optimally. Increasing the length at first capture would increase the Yield per Recruit.
5.4.3 Winchboats
5.4.3.1 Mortality rates The linearised catch curve of H. membraceus for winchboats is presented in Figure 19. Figure 19: The length converted catch curve of H. membraceus for winchboats in stratum VII of Lake Volta. Parameter estimates as obtained from the catch curve are presented in Table 29. 13 If the data are representative
Yield per Recruit
0
500
1000
1500
2000
2500
0 0,5 1 1,5 2 2,5 3 3,5 4 4,5 5
Fishing mortality
Y/R
Lc present
27293234

47
C:\degraaf\Ghana\final97.doc 29-7-2001
Table 29: Parameter estimates as obtained from a length converted catch curve for H. membraceus caught by winchboats in Stratum VII of Lake Volta.
Parameter Total mortality (Z, year-1) 4.03 Natural mortality (M, year-1) 1.12 Fishing mortality (F, year-1) 2.91 Exploitation rate (E) 0.72 Cut-off length (L’, cm) 22.5 Mean length (from L’, cm) 25.1 L25 (cm) 20.3 L50 (cm) 21.3 L75 (cm) 22.2
5.4.3.2 Virtual Population Analysis
The fishing mortality (F) of winchboats per length group as obtained from a VPA is presented in Figure 20.
Figure 20: Fishing mortality from winchboats for H. membraceus
in stratum VII of Lake Volta.
There are two visible peaks in fishing mortality; one small peak at 17 cm and a second peak which starts at 23 cm. It seems that the winchboats, which are operating in the main channel/open water are not catching H. membraceus with a length of 19-21 cm. This could be an artefact, but this phenomena was also observed in 1995.
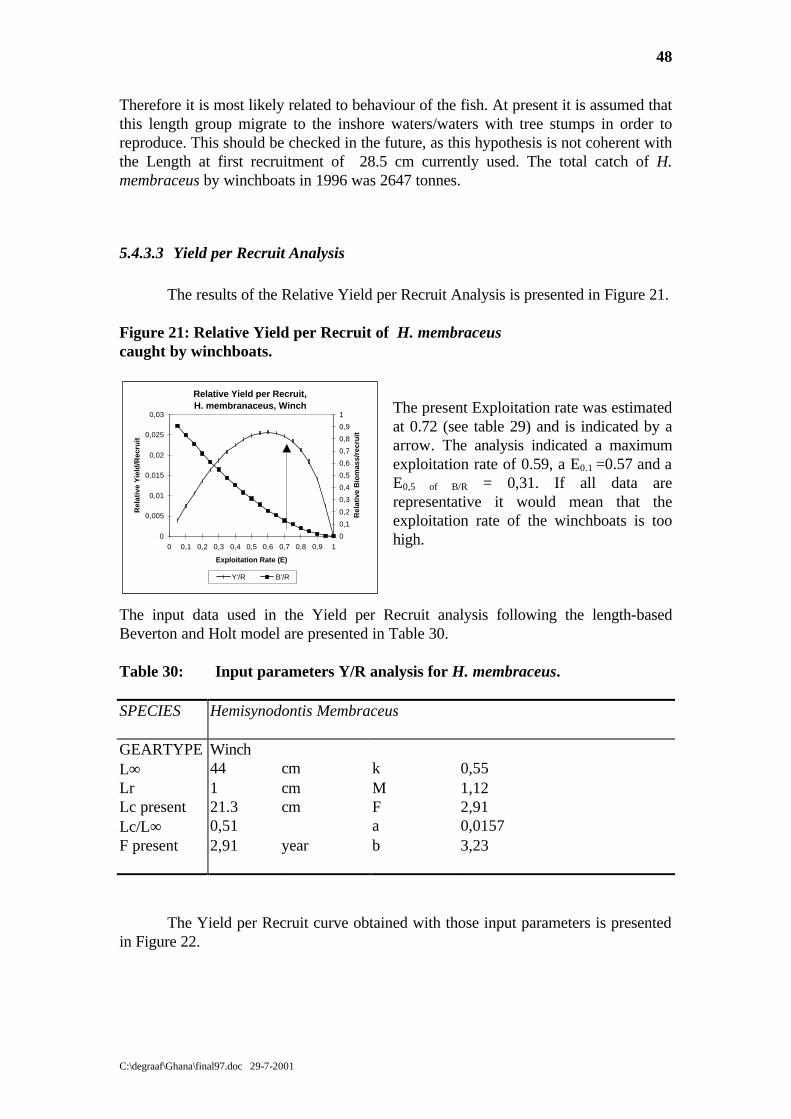
48
C:\degraaf\Ghana\final97.doc 29-7-2001
Therefore it is most likely related to behaviour of the fish. At present it is assumed that this length group migrate to the inshore waters/waters with tree stumps in order to reproduce. This should be checked in the future, as this hypothesis is not coherent with the Length at first recruitment of 28.5 cm currently used. The total catch of H. membraceus by winchboats in 1996 was 2647 tonnes.
5.4.3.3 Yield per Recruit Analysis The results of the Relative Yield per Recruit Analysis is presented in Figure 21. Figure 21: Relative Yield per Recruit of H. membraceus caught by winchboats.
The present Exploitation rate was estimated at 0.72 (see table 29) and is indicated by a arrow. The analysis indicated a maximum exploitation rate of 0.59, a E0.1 =0.57 and a E0,5 of B/R = 0,31. If all data are representative it would mean that the exploitation rate of the winchboats is too high.
The input data used in the Yield per Recruit analysis following the length-based Beverton and Holt model are presented in Table 30. Table 30: Input parameters Y/R analysis for H. membraceus. SPECIES Hemisynodontis Membraceus
GEARTYPE Winch L∞ 44 cm k 0,55 Lr 1 cm M 1,12 Lc present 21.3 cm F 2,91 Lc/L∞ 0,51 a 0,0157 F present 2,91 year b 3,23 The Yield per Recruit curve obtained with those input parameters is presented in Figure 22.
Relative Yield per Recruit, H. membranaceus, Winch
0
0,005
0,01
0,015
0,02
0,025
0,03
0 0,1 0,2 0,3 0,4 0,5 0,6 0,7 0,8 0,9 1
Exploitation Rate (E)
Rel
ativ
e Y
ield
/Rec
ruit
0
0,1
0,2
0,3
0,4
0,5
0,6
0,7
0,8
0,9
1
Rel
ativ
e B
iom
ass/
recr
uit
Y'/R B'/R
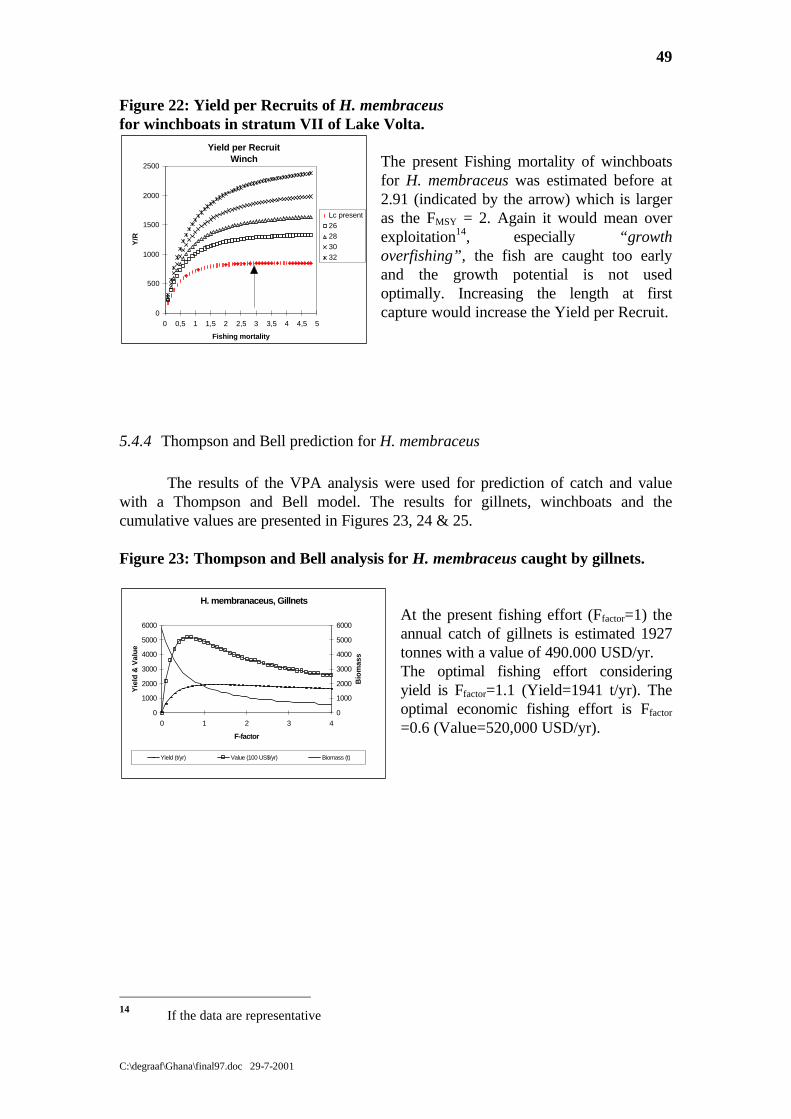
49
C:\degraaf\Ghana\final97.doc 29-7-2001
Figure 22: Yield per Recruits of H. membraceus for winchboats in stratum VII of Lake Volta.
The present Fishing mortality of winchboats for H. membraceus was estimated before at 2.91 (indicated by the arrow) which is larger as the FMSY = 2. Again it would mean over exploitation14, especially “growth overfishing”, the fish are caught too early and the growth potential is not used optimally. Increasing the length at first capture would increase the Yield per Recruit.
5.4.4 Thompson and Bell prediction for H. membraceus
The results of the VPA analysis were used for prediction of catch and value with a Thompson and Bell model. The results for gillnets, winchboats and the cumulative values are presented in Figures 23, 24 & 25. Figure 23: Thompson and Bell analysis for H. membraceus caught by gillnets.
At the present fishing effort (Ffactor=1) the annual catch of gillnets is estimated 1927 tonnes with a value of 490.000 USD/yr. The optimal fishing effort considering yield is Ffactor=1.1 (Yield=1941 t/yr). The optimal economic fishing effort is Ffactor =0.6 (Value=520,000 USD/yr).
14 If the data are representative
Yield per RecruitWinch
0
500
1000
1500
2000
2500
0 0,5 1 1,5 2 2,5 3 3,5 4 4,5 5
Fishing mortality
Y/R
Lc present26283032
H. membranaceus, Gillnets
0
1000
2000
3000
4000
5000
6000
0 1 2 3 4
F-factor
Yie
ld &
Val
ue
0
1000
2000
3000
4000
5000
6000
Bio
mas
s
Yield (t/yr) Value (100 US$/yr) Biomass (t)

50
C:\degraaf\Ghana\final97.doc 29-7-2001
Figure 24: Thompson and Bell analysis for H. membraceus caught by winchboats.
At the present fishing effort (Ffactor=1) the annual catch of winchboats is estimated 2647 tonnes with a value of 475.000 USD/yr. The optimal fishing effort considering yield is Ffactor =0.5 (Yield=2832 t/yr). The optimal economic fishing effort is Ffactor =0.2 (Value=712,000 USD/yr).
Figure 25: Cumulative Thompson and Bell analysis for H. membraceus.
At the present fishing effort (Ffactor =1) the annual cumulative catch is estimated 4574 tonnes with a value of 969.000 USD/yr. The optimal fishing effort considering yield is Ffactor =0.8 (Yield=4601 t/yr). The optimal economic fishing effort is Ffactor =0.4 (Value=1.15 million USD/yr).
H.membranaceusWinch
0
2000
4000
6000
8000
0 1 2 3 4
F-factor
Yie
ld &
Val
ue
0
2000
4000
6000
8000
10000
Bio
mas
s
Yield (t/yr) Value (100 US$/yr) Biomass (t)
H. membranaceusCumulative
0
2000
4000
6000
8000
10000
12000
0 1 2 3 4
F-factor
Yie
ld &
Val
ue
0
2000
4000
6000
8000
10000
12000
14000
16000
Bio
mas
s
Yield (t/yr) Value (100 US$) Biomass (t)

51
C:\degraaf\Ghana\final97.doc 29-7-2001
5.5 Chrysichthys nigrodigitatus
5.5.1 Growth parameters
The growth parameters of C. nigrodigitatus for 1996 are presented in Table 31. Table 31: Growth parameters as estimated with ELEFAN for C.
nigrodigitatus for Stratum VII of Lake Volta. Parameter L∞ 44.5 cm K 0.65 year-1 C 0.5 Wp 0.00 year t0 0.222 year Rn 0.146 ϕ 3.129 Figure 26 shows the growth curves superimposed on the length frequency data. Figure 26: Length frequency data and estimated growth curves of C.
nigrodigitatus in Stratum VII of Lake Volta.
The results indicates that at 4-5 cohorts are found in the fisheries. A major problem of the fitted curve are the low sample sizes in February, March and September
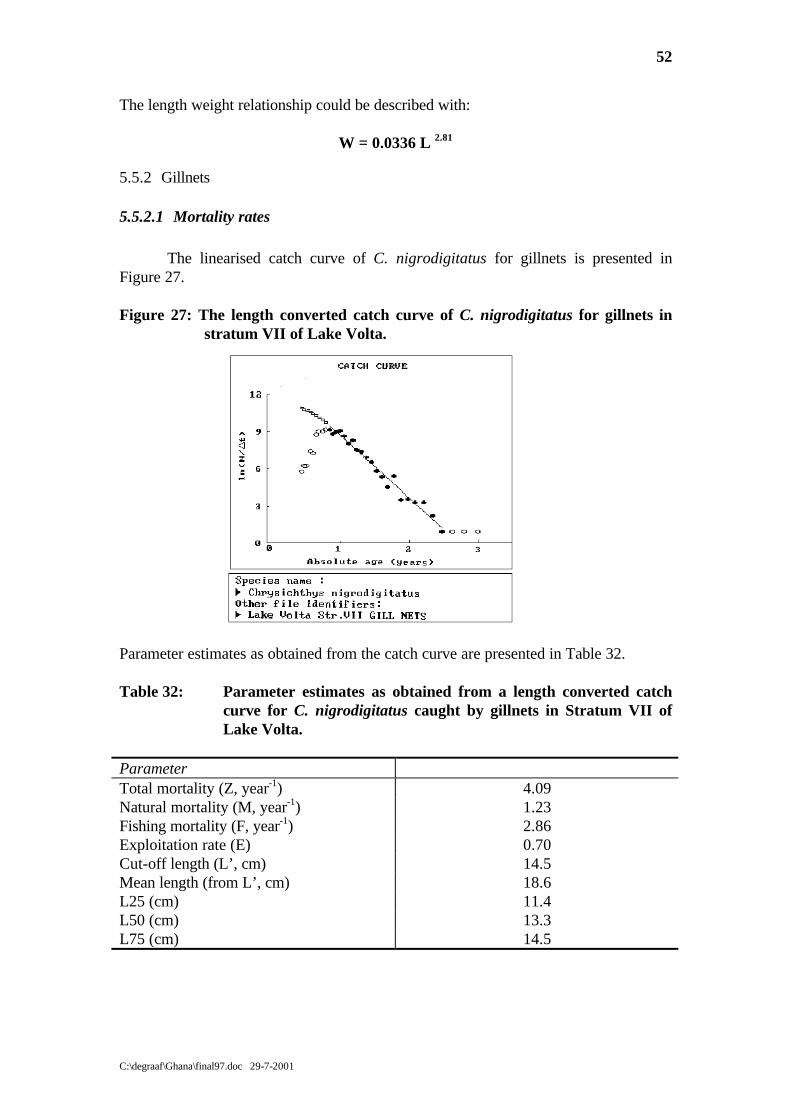
52
C:\degraaf\Ghana\final97.doc 29-7-2001
The length weight relationship could be described with:
W = 0.0336 L 2.81
5.5.2 Gillnets
5.5.2.1 Mortality rates The linearised catch curve of C. nigrodigitatus for gillnets is presented in Figure 27. Figure 27: The length converted catch curve of C. nigrodigitatus for gillnets in
stratum VII of Lake Volta.
Parameter estimates as obtained from the catch curve are presented in Table 32. Table 32: Parameter estimates as obtained from a length converted catch
curve for C. nigrodigitatus caught by gillnets in Stratum VII of Lake Volta.
Parameter Total mortality (Z, year-1) 4.09 Natural mortality (M, year-1) 1.23 Fishing mortality (F, year-1) 2.86 Exploitation rate (E) 0.70 Cut-off length (L’, cm) 14.5 Mean length (from L’, cm) 18.6 L25 (cm) 11.4 L50 (cm) 13.3 L75 (cm) 14.5
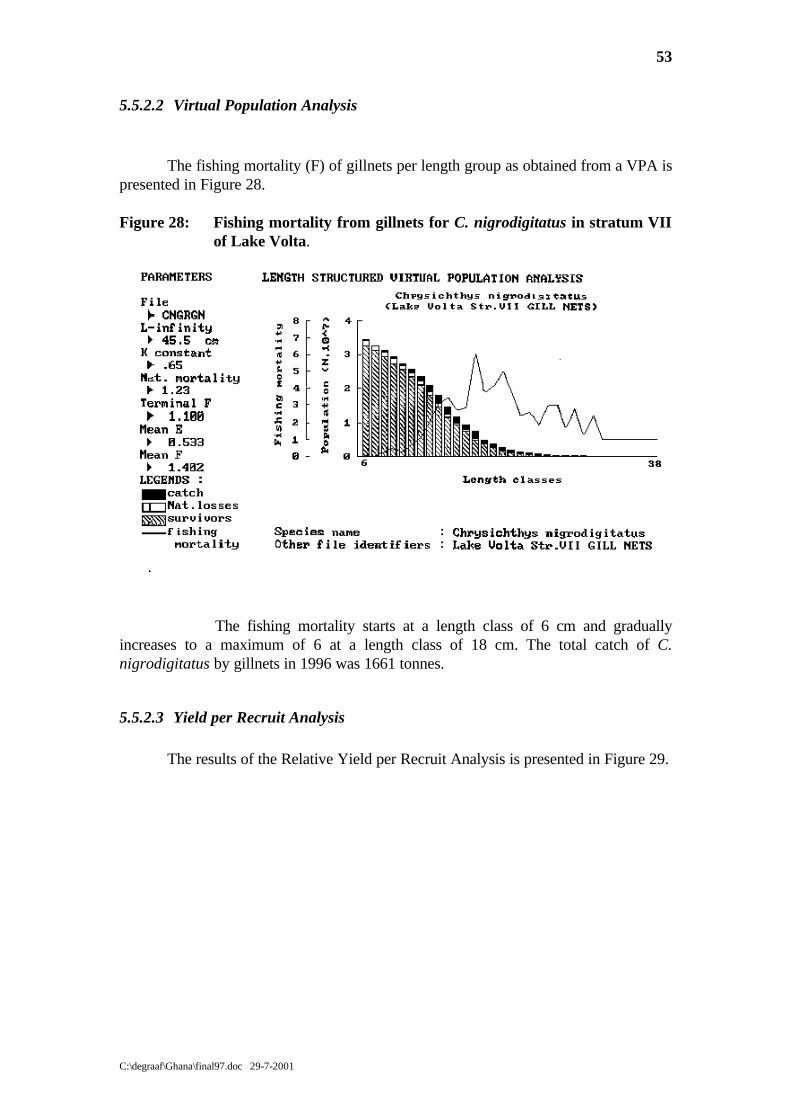
53
C:\degraaf\Ghana\final97.doc 29-7-2001
5.5.2.2 Virtual Population Analysis The fishing mortality (F) of gillnets per length group as obtained from a VPA is presented in Figure 28. Figure 28: Fishing mortality from gillnets for C. nigrodigitatus in stratum VII
of Lake Volta.
The fishing mortality starts at a length class of 6 cm and gradually increases to a maximum of 6 at a length class of 18 cm. The total catch of C. nigrodigitatus by gillnets in 1996 was 1661 tonnes.
5.5.2.3 Yield per Recruit Analysis The results of the Relative Yield per Recruit Analysis is presented in Figure 29.

54
C:\degraaf\Ghana\final97.doc 29-7-2001
Figure 29: Relative Yield per Recruit of C. nigrodigitatus caught by gill nets.
The present Exploitation rate was estimated at 0.70 (see table 32) and is indicated by a arrow. The analysis indicated a maximum exploitation rate of 0.48, a E0.1 =0.32 and a E0,5 of B/R = 0,37. If all data are representative it would mean that the exploitation rate of the gillnets is too high.
The input data used in the Yield per Recruit analysis following the length-based Beverton and Holt model are presented in Table 33. Table 33: Input data Y/R analysis for C. nigrodigitatus. SPECIES C. nigrodigitatus
GEARTYPE Gill nets L∞ 45.5 cm k 0,65 Lr 1 cm M 1,23 Lc present 13.8 cm F 2,86 Lc/L∞ 0,51 a 0,0366 F present 2,86 year b 2.81 The Yield per Recruit curve obtained with those input parameters is presented in Figure 30.
Relative Yield per Recruit, C. nigrodigitatus, Gillnets
0
0,005
0,01
0,015
0,02
0,025
0,03
0 0,1 0,2 0,3 0,4 0,5 0,6 0,7 0,8 0,9 1
Exploitation Rate (E)
Rel
ativ
e Y
ield
/Rec
ruit
0
0,1
0,2
0,3
0,4
0,5
0,6
0,7
0,8
0,9
Rel
ativ
e B
iom
ass/
recr
uit
Y'/R B'/R

55
C:\degraaf\Ghana\final97.doc 29-7-2001
Figure 30: Yield per Recruits of C. nigrodigitatus for gill nets in stratum VII of Lake Volta.
The present Fishing mortality of gillnets for C. nigrodigitatus was estimated before at 2.86 (indicated by the arrow) which is larger as the FMSY = 1. Again it would mean overexploitation15, especially “growth overfishing”, the fish are caught too early and the growth potential is not used optimally. Increasing the length at first capture would increase the Yield per Recruit.
5.5.3 Winchboats
5.5.3.1 Mortality rates The linearised catch curve of C. nigrodigitatus for winchboats is presented in Figure 31.
15 If the data are representative
Yield per Recruit
0
50
100
150
200
250
300
350
0 0,5 1 1,5 2 2,5 3 3,5 4 4,5 5
Fishing mortality
Y/R
Lc present17181921

56
C:\degraaf\Ghana\final97.doc 29-7-2001
Figure 31: The length converted catch curve of C. nigrodigitatus for winchboats in stratum VII of Lake Volta. Parameter estimates as obtained from the catch curve are presented in Table 34. Table 34: Parameter estimates as obtained from a length converted catch
curve for C. nigrodigitatus caught by winchboats in Stratum VII of Lake Volta.
Parameter Total mortality (Z, year-1) 3.45 Natural mortality (M, year-1) 1.23 Fishing mortality (F, year-1) 2.22 Exploitation rate (E) 0.64 Cut-off length (L’, cm) 15.5 Mean length (from L’, cm) 19.4 L25 (cm) 10.9 L50 (cm) 13.3 L75 (cm) 14.5

57
C:\degraaf\Ghana\final97.doc 29-7-2001
5.5.3.2 Virtual Population Analysis
The fishing mortality (F) of winchboats per length group as obtained from a VPA is presented in Figure 32.
Figure 32: Fishing mortality from winchboats for C. nigrodigitatus
in stratum VII of Lake Volta.
The major fishing mortality of C. nigrodigitatus takes place at a length of 17-20 cm. The total catch of C. nigrodigitatus by winchboats in 1996 was 366 tonnes.
5.5.3.3 Yield per Recruit Analysis The results of the Relative Yield per Recruit Analysis is presented in Figure 33.

58
C:\degraaf\Ghana\final97.doc 29-7-2001
Figure 33: Relative Yield per Recruit of C. nigrodigitatus caught by winchboats.
The present Exploitation rate was estimated at 0.64 (see table 34) and is indicated by a arrow. The analysis indicated a maximum exploitation rate of 0.45, a E0.1 =0.37 and a E0,5 of B/R = 0,31. If all data are representative it would again mean that the exploitation rate of the winchboats is too high.
The input data used in the Yield per Recruit analysis following the length-based Beverton and Holt model for C. nigrodigitatus are presented in Table 35. Table 35: Input parameters Y/R analysis C. nigrodigitatus. SPECIES C. nigrodigitatus
GEARTYPE Winch L∞ 45.5 cm k 0,65 Lr 1 cm M 1,23 Lc present 13.3 cm F 2,22 Lc/L∞ 0,3 a 0,0366 F present 2.22 year b 2.81 The Yield per Recruit curve obtained with those input parameters is presented in Figure 33.
Relative Yield per Recruit, C. nigrodigitatus, Winch
0
0,005
0,01
0,015
0,02
0,025
0,03
0 0,1 0,2 0,3 0,4 0,5 0,6 0,7 0,8 0,9 1
Exploitation Rate (E)
Rel
ativ
e Y
ield
/Rec
ruit
0
0,1
0,2
0,3
0,4
0,5
0,6
0,7
0,8
0,9
Rel
ativ
e B
iom
ass/
recr
uit
Y'/R B'/R

59
C:\degraaf\Ghana\final97.doc 29-7-2001
Figure 33: Yield per Recruits of C. nigrodigitatus for winchboats in stratum VII of Lake Volta.
The present Fishing mortality of winchboats for C. nigrodigitatus was estimated before at 2.22 (indicated by the arrow) which is larger as the FMSY = 1.3. Again it would mean overexploitation16, especially “growth overfishing”, the fish are caught too early and the growth potential is not used optimally. Increasing the length at first capture would increase the Yield per Recruit.
5.5.4 Thompson and Bell prediction for C. nigrodigitatus
The results of the VPA analysis were used for prediction of catch and value with a Thompson and Bell model. The results for gillnets, winchboats and the cumulative values are presented in Figures 34, 35 & 36. Figure 34: Thompson and Bell analysis for C. nigrodigitatus caught by gillnets.
At the present fishing effort (Ffactor =1) the annual catch of gillnets is estimated at 1660 tonnes with a value of 286.000 USD/yr. The optimal fishing effort considering yield is Ffactor =0.4 (Yield=1820 t/yr). The optimal economic fishing effort is Ffactor =0.3 (Value=375,000 USD/yr).
16 If the data are representative
Yield per RecruitWinch
0
50
100
150
200
250
300
350
0 0,5 1 1,5 2 2,5 3 3,5 4 4,5 5
Fishing mortality
Y/R
Lc present
16
1719
20
C. nigrodigitatus, Gillnets
0
500
1000
1500
2000
2500
3000
3500
4000
0 1 2 3 4
F-factor
Yie
ld &
Val
ue
0
1000
2000
3000
4000
5000
6000
7000
Bio
mas
s
Yield (t/yr) Value (100 US$/yr) Biomass (t)
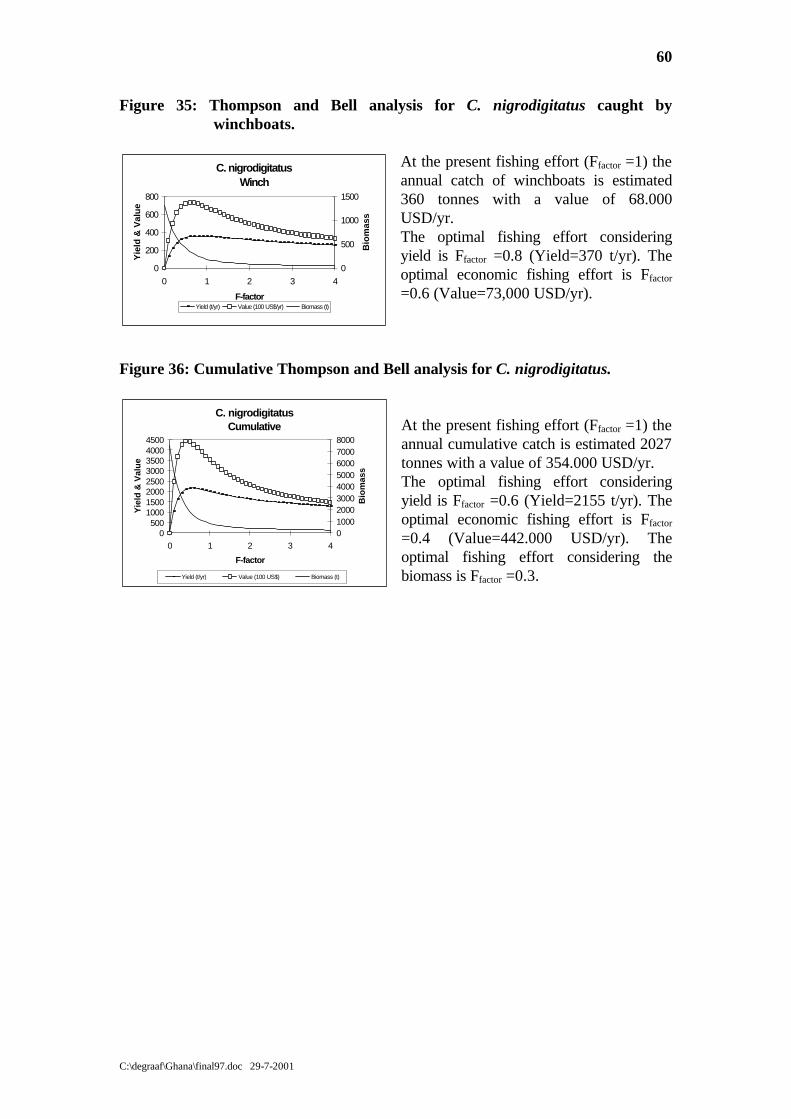
60
C:\degraaf\Ghana\final97.doc 29-7-2001
Figure 35: Thompson and Bell analysis for C. nigrodigitatus caught by winchboats.
At the present fishing effort (Ffactor =1) the annual catch of winchboats is estimated 360 tonnes with a value of 68.000 USD/yr. The optimal fishing effort considering yield is Ffactor =0.8 (Yield=370 t/yr). The optimal economic fishing effort is Ffactor =0.6 (Value=73,000 USD/yr).
Figure 36: Cumulative Thompson and Bell analysis for C. nigrodigitatus.
At the present fishing effort (Ffactor =1) the annual cumulative catch is estimated 2027 tonnes with a value of 354.000 USD/yr. The optimal fishing effort considering yield is Ffactor =0.6 (Yield=2155 t/yr). The optimal economic fishing effort is Ffactor =0.4 (Value=442.000 USD/yr). The optimal fishing effort considering the biomass is Ffactor =0.3.
C. nigrodigitatusWinch
0
200
400
600
800
0 1 2 3 4
F-factor
Yie
ld &
Val
ue
0
500
1000
1500
Bio
mas
s
Yield (t/yr) Value (100 US$/yr) Biomass (t)
C. nigrodigitatusCumulative
0500
10001500200025003000350040004500
0 1 2 3 4
F-factor
Yie
ld &
Val
ue
010002000300040005000600070008000
Bio
mas
s
Yield (t/yr) Value (100 US$) Biomass (t)

61
C:\degraaf\Ghana\final97.doc 29-7-2001
5.6 Chrysichthys auratus
5.6.1 Growth parameters
The growth parameters of C. auratus for 1996 are presented in Table 36. Table 36: Growth parameters as estimated with ELEFAN for C. auratus for
Stratum VII of Lake Volta. Parameter L∞ 31 cm K 0.6 year-1 C 0.35 Wp 0.4 year t0 0.153 year Rn 0.120 ϕ 2.760 Figure 37 shows the growth curves superimposed on the length frequency data. Figure 37: Length frequency data and estimated growth curves of C. auratus
in Stratum VII of Lake Volta.
The results indicates that at 4 cohorts are found in the fisheries. The length weight relationship could be described with:

62
C:\degraaf\Ghana\final97.doc 29-7-2001
W = 0.023 L 2.97
5.6.2 Gillnets
5.6.2.1 Mortality rates The linearised catch curve of C. auratus for gillnets is presented in Figure 38. Figure 38: The length converted catch curve of C. auratus for gillnets in
Stratum VII of Lake Volta Parameter estimates as obtained from the catch curve are presented in Table 37. Table 37: Parameter estimates as obtained from a length converted catch
curve for C. auratus caught by gillnets in Stratum VII of Lake Volta.
Parameter Total mortality (Z, year-1) 3.30 Natural mortality (M, year-1) 1.30 Fishing mortality (F, year-1) 2.00 Exploitation rate (E) 0.61 Cut-off length (L’, cm) 11.5 Mean length (from L’, cm) 15.8 L25 (cm) 9.9 L50 (cm) 10.7 L75 (cm) 11.6

63
C:\degraaf\Ghana\final97.doc 29-7-2001
5.6.2.2 Virtual Population Analysis The fishing mortality (F) of gillnets per length group as obtained from a VPA is presented in Figure 39. Figure 39: Fishing mortality from gillnets for C. auratus in stratum VII of
Lake Volta.
The fishing mortality starts at a length class of 8 cm and gradually increases to two peaks at respectively 13 and 18 cm. The two peaks could be a result of different mesh sizes or fishing habitats. However they could also be the result of the low sample sizes in the length frequency data and the lack of data in the CAS, which are needed to raise the data for a VPA. The total catch of C. auratus by gillnets in 1996 was 2153 tonnes.
5.6.2.3 Yield per Recruit Analysis The results of the Relative Yield per Recruit Analysis is presented in Figure 40.

64
C:\degraaf\Ghana\final97.doc 29-7-2001
Figure 40: Relative Yield per Recruit of C. auratus caught by gill nets.
The present Exploitation rate was estimated at 0.61 (see table 37) and is indicated by a arrow. The analysis indicated a maximum exploitation rate of 0.54, a E0.1 =0.50 and a E0,5 of B/R = 0,31. If all data are representative it would mean that the exploitation rate of the gillnets is too high.
The input data used in the Yield per Recruit analysis following the length-based Beverton and Holt model for C. auratus are presented in Table 38. Table 38: Input parameters Y/R analysis C. auratus. SPECIES C. auratus
GEARTYPE Gill nets L∞ 31 cm k 0,60 Lr 1 cm M 1,30 Lc present 10.7 cm F 2,00 Lc/L∞ 0,51 a 0,023 F present 2,0 year b 2.967 The Yield per Recruit curve obtained with those input parameters is presented in Figure 41. Figure 41: Yield per Recruits of C. auratus for gill nets in stratum VII of Lake Volta.
The present Fishing mortality of gillnets for C. auratus was estimated before at 2.00 (indicated by the arrow) which is larger as the FMSY = 1.5 Again it would mean overexploitation17, especially “growth overfishing”, the fish are caught too early and the growth potential is not used optimally. Increasing the length at first capture would increase the Yield per Recruit.
17 If the data are representative
Relative Yield per Recruit, C. auratus, Gillnets
0
0,005
0,01
0,015
0,02
0,025
0 0,1 0,2 0,3 0,4 0,5 0,6 0,7 0,8 0,9 1
Exploitation Rate (E)
Rel
ativ
e Y
ield
/Rec
ruit
0
0,1
0,2
0,3
0,4
0,5
0,6
0,7
0,8
0,9
1
Rel
ativ
e B
iom
ass/
recr
uit
Y'/R B'/R
Yield per Recruitgillnets
0
50
100
150
200
250
300
350
0 0,5 1 1,5 2 2,5 3 3,5 4 4,5 5
Fishing mortality
Y/R
Lc present
13
14
15
16

65
C:\degraaf\Ghana\final97.doc 29-7-2001
5.6.3 Winchboats
5.6.3.1 Mortality rates The linearised catch curve of C. auratus for winchboats is presented in Figure 42. Figure 42: The length converted catch curve of C. auratus for winchboats in
stratum VII of Lake Volta. Parameter estimates as obtained from the catch curve are presented in Table 39. Table 39: Parameter estimates as obtained from a length converted catch
curve for C. auratus caught by winchboats in Stratum VII of Lake Volta.
Parameter Total mortality (Z, year-1) 4.04 Natural mortality (M, year-1) 1.30 Fishing mortality (F, year-1) 2.74 Exploitation rate (E) 0.68 Cut-off length (L’, cm) 15.5 Mean length (from L’, cm) 17.5 L25 (cm) 14.3 L50 (cm) 15.1 L75 (cm) 16.1
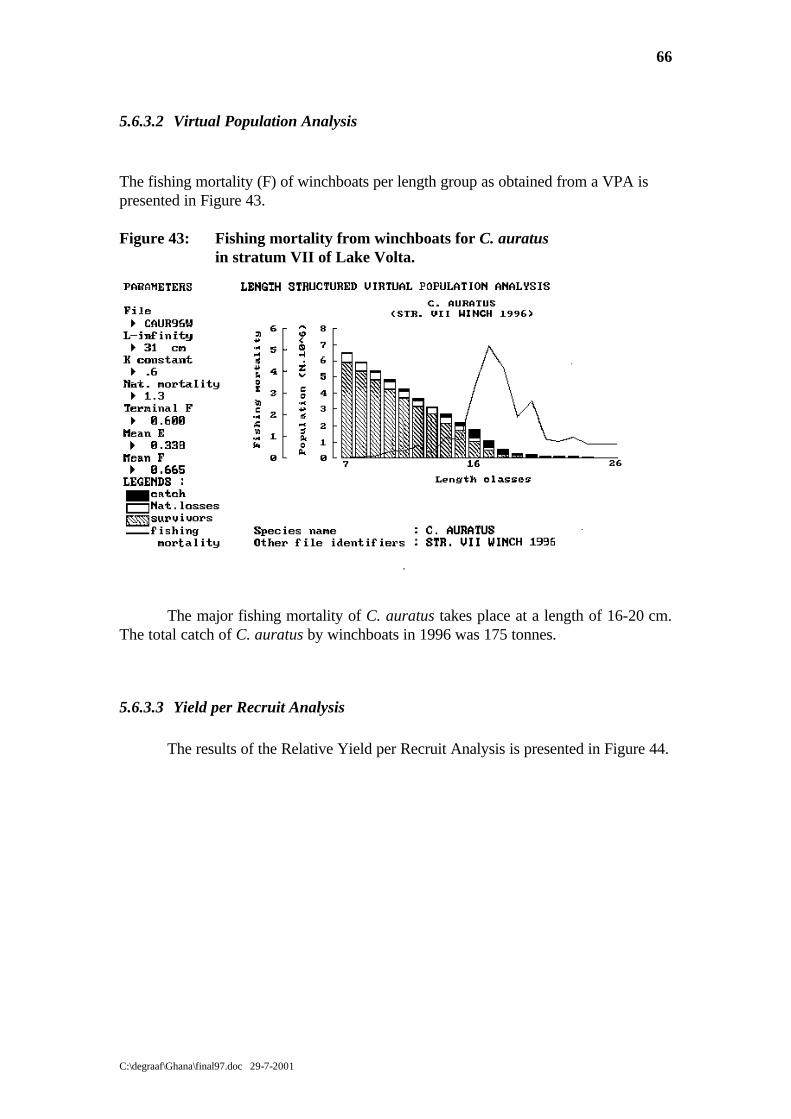
66
C:\degraaf\Ghana\final97.doc 29-7-2001
5.6.3.2 Virtual Population Analysis
The fishing mortality (F) of winchboats per length group as obtained from a VPA is presented in Figure 43.
Figure 43: Fishing mortality from winchboats for C. auratus
in stratum VII of Lake Volta.
The major fishing mortality of C. auratus takes place at a length of 16-20 cm. The total catch of C. auratus by winchboats in 1996 was 175 tonnes.
5.6.3.3 Yield per Recruit Analysis The results of the Relative Yield per Recruit Analysis is presented in Figure 44.

67
C:\degraaf\Ghana\final97.doc 29-7-2001
Figure 44: Relative Yield per Recruit of C. auratus caught by winchboats.
The present Exploitation rate was estimated at 0.68 (see table 39) and is indicated by a arrow. The analysis indicated a maximum exploitation rate of 0.59, a E0.1 =0.56 and a E0,5 of B/R = 0,33. If all data are representative it would again mean that the exploitation rate of the winchboats is too high.
The input data used in the Yield per Recruit analysis following the length-based Beverton and Holt model for C. auratus are presented in Table 40. Table 40: Input parameters Y/R analysis C. auratus. SPECIES C. auratus
GEARTYPE Winch L∞ 31 cm k 0,60 Lr 1 cm M 1,30 Lc present 15.1 cm F 2,74 Lc/L∞ 0,3 a 0,023 F present 2.74 year b 2.967
The Yield per Recruit curve obtained with those input parameters is presented in Figure 45. Figure 45: Yield per Recruits of C. auratus for winchboats in stratum VII of Lake Volta.
The present Fishing mortality of winchboats for C. auratus was estimated before at 2.74 (indicated by the arrow) which is larger as the FMSY = 1.6. Again it would mean overexpoitation18, especially “growth overfishing”, the fish are caught too early and the growth potential is not used optimally. Increasing the length at first capture would increase the Yield per Recruit.
18 If the data are representative
Relative Yield per Recruit, C. auratus, Winch
0
0,005
0,01
0,015
0,02
0,025
0 0,1 0,2 0,3 0,4 0,5 0,6 0,7 0,8 0,9 1
Exploitation Rate (E)
Rel
ativ
e Y
ield
/Rec
ruit
0
0,1
0,2
0,3
0,4
0,5
0,6
0,7
0,8
0,9
1
Rel
ativ
e B
iom
ass/
recr
uit
Y'/R B'/R
Yield per RecruitWinch
0
50
100
150
200
250
300
350
400
450
500
0 0,5 1 1,5 2 2,5 3 3,5 4 4,5 5
Fishing mortality
Y/R
Lc present
18
20
21
23

68
C:\degraaf\Ghana\final97.doc 29-7-2001
5.6.4 Thompson and Bell prediction for C. auratus
The results of the VPA analysis were used for prediction of catch and value with a Thompson and Bell model. The results for gillnets, winchboats and the cumulative values are presented in Figures 45, 46 & 47. Figure 45: Thompson and Bell analysis for C. auratus caught by gillnets.
At the present fishing effort (Ffactor =1) the annual catch of gillnets is estimated at 2160 tonnes with a value of 375.000 USD/yr. The optimal fishing effort considering yield is almost reached and is Ffactor =1.6 (Yield=2370 t/yr). The optimal economic fishing effort is reached at Ffactor =1 (Value=375,000 USD/yr).
Figure 46: Thompson and Bell analysis for C. auratus caught by winchboats.
At the present fishing effort (Ffactor =1) the annual catch of winchboats is estimated 174 tonnes with a value of 27.000 USD/yr. The optimal fishing effort considering yield is Ffactor =1.1 (Yield=176 t/yr). The optimal economic fishing effort is Ffactor =0.6 (Value=27.500 USD/yr).
Figure 47: Cumulative Thompson and Bell analysis for C. auratus.
At the present fishing effort (Ffactor =1) the annual cumulative catch is estimated 2336 tonnes with a value of 402.000 USD/yr. The optimal fishing effort considering yield is Ffactor =2 (Yield=2549 t/yr). The optimal economic fishing effort is Ffactor=1.1 (Value=402.000 USD/yr). The optimal fishing effort considering the biomass is Ffactor =0.8
Gillnets
0
10001500
2500
3000
4000
0 2 3
F-factor
1000
2000
4000
5000
7000
Yield (t/yr) Value (100 US$/yr)
C. auratusWinch
050
100150200250300
0 1 2 3 4
F-factor
Yie
ld &
Val
ue
0
100
200
300
400
500
Bio
mas
s
Yield (t/yr) Value (100 US$/yr) Biomass (t)
C. auratusCumulative
0500
10001500200025003000350040004500
0 1 2 3 4
F-factor
Yie
ld &
Val
ue
010002000300040005000600070008000
Bio
mas
s
Yield (t/yr) Value (100 US$) Biomass (t)

C: degraaf\ \final97.doc -7 2001
5.7
Growth parameters
The growth parameters of L. coubie 996 are presented in Table 41.
Table 41: Growth parameters as estimated with ELEFAN for L. coubie
Stratum VII of Lake Volta.
Parameter L∞ 75 cm
0.7 year 1 0.6
Wp t 0.178 yearRn ϕ 3.595
Figure 48 shows the growth curve
Length frequency data and estimated growth curves of in Stratum VII of Lake Volta.
The results indicate that at 3 cohorts are found in the fisheries.

70
C:\degraaf\Ghana\final97.doc 29-7-2001
The length weight relationship could be described with:
W = 0.02 L 3.137
5.7.2 Gillnets
5.7.2.1 Mortality rates The linearised catch curve of L. coubie for gillnets is presented in Figure 49. Figure 49: The length converted catch curve of L. coubie for gillnets in
stratum VII of Lake Volta. Parameter estimates as obtained from the catch curve are presented in Table 42. Table 42: Parameter estimates as obtained from a length converted catch
curve for L. coubie caught by gillnets in Stratum VII of Lake Volta.
Parameter Total mortality (Z, year-1) 2.34 Natural mortality (M, year-1) 1.13 Fishing mortality (F, year-1) 1.21 Exploitation rate (E) 0.52 Cut-off length (L’, cm) 17.0 Mean length (from L’, cm) 24.4 L25 (cm) 7.6 L50 (cm) 9.3 L75 (cm) 10.8
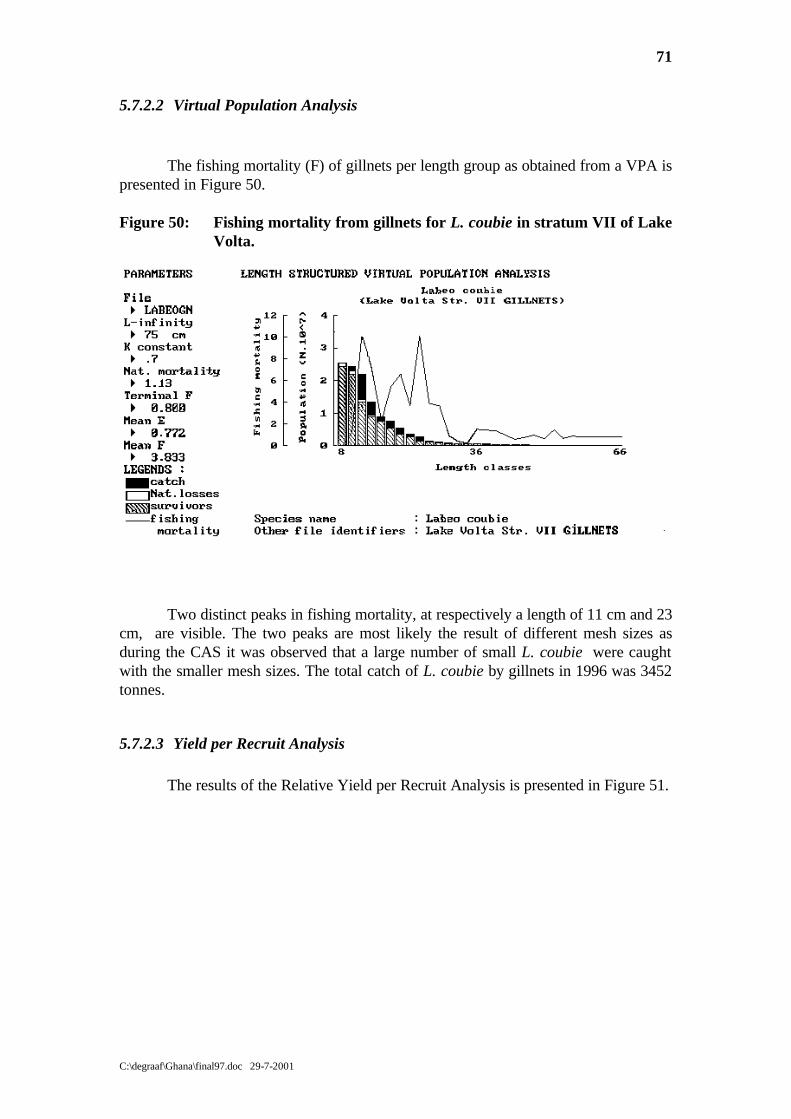
71
C:\degraaf\Ghana\final97.doc 29-7-2001
5.7.2.2 Virtual Population Analysis The fishing mortality (F) of gillnets per length group as obtained from a VPA is presented in Figure 50. Figure 50: Fishing mortality from gillnets for L. coubie in stratum VII of Lake
Volta.
Two distinct peaks in fishing mortality, at respectively a length of 11 cm and 23 cm, are visible. The two peaks are most likely the result of different mesh sizes as during the CAS it was observed that a large number of small L. coubie were caught with the smaller mesh sizes. The total catch of L. coubie by gillnets in 1996 was 3452 tonnes.
5.7.2.3 Yield per Recruit Analysis The results of the Relative Yield per Recruit Analysis is presented in Figure 51.

72
C:\degraaf\Ghana\final97.doc 29-7-2001
Figure 51: Relative Yield per Recruit of L. coubie caught by gill nets. The present Exploitation rate was estimated at 0.52 (see table 42) and is indicated by a arrow. The analysis indicated a maximum exploitation rate of 0.41, a E0.1 =0.35 and a E0,5 of B/R = 0,26. If all data are representative it would mean that the exploitation rate of the gillnets is too high.
The input data used in the Yield per Recruit analysis following the length-based Beverton and Holt model for L. coubie are presented in Table 43. Table 43: Input parameters Y/R analysis L.coubie. SPECIES L. coubie
GEARTYPE Gill nets L∞ 75 Cm k 0,70 Lr 1 Cm M 1.13 Lc present 9.3 Cm F 1.21 Lc/L∞ 0.12 a 0,02 F present 1.21 year b 3.137 The Yield per Recruit curve obtained with those input parameters is presented in Figure 52. Figure 52: Yield per Recruits of L. coubie for gill nets in stratum VII of Lake Volta.
The present Fishing mortality of gillnets for L. coubie was estimated before at 1.21 (indicated by the arrow) which is larger as the FMSY = 0.8 Again it would mean overexpoitation19, especially “growth overfishing”, the fish are caught too early and the growth potential is not used optimally. Increasing the length at first capture would increase the Yield per Recruit.
19 If the data are representative
Relative Yield per Recruit,
Exploitation Rate (E)
Rel
ativ
e Y
ield
/Rec
ruit
Yield per RecruitL. coubie, gillnets
0
200
400
600
800
1000
1200
0 0,5 1 1,5 2 2,5 3 3,5 4 4,5 5
Fishing mortality
Y/R
Lc present
11
1213
14

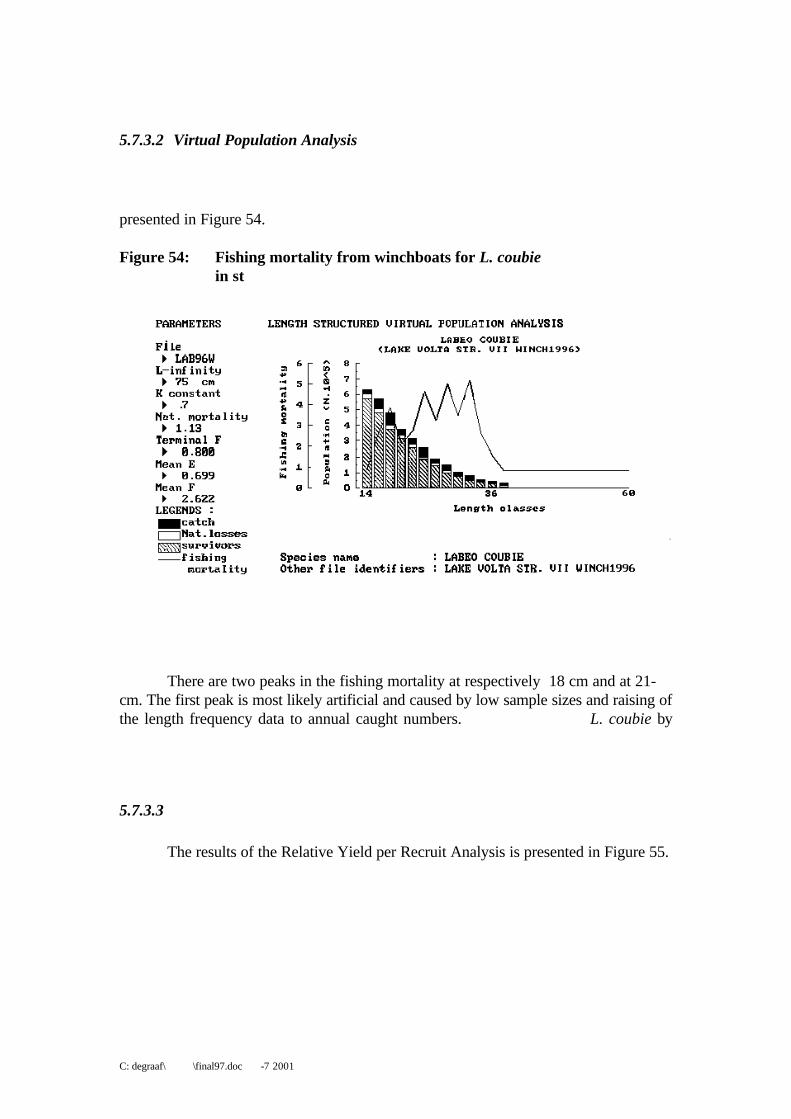
C: degraaf\ \final97.doc -7 2001
5.7.3.2 Virtual Population Analysis
presented in Figure 54.
Figure 54: Fishing mortality from winchboats for L. coubie in st
There are two peaks in the fishing mortality at respectively 18 cm and at 21-cm. The first peak is most likely artificial and caused by low sample sizes and raising of the length frequency data to annual caught numbers. L. coubie by
5.7.3.3
The results of the Relative Yield per Recruit Analysis is presented in Figure 55.
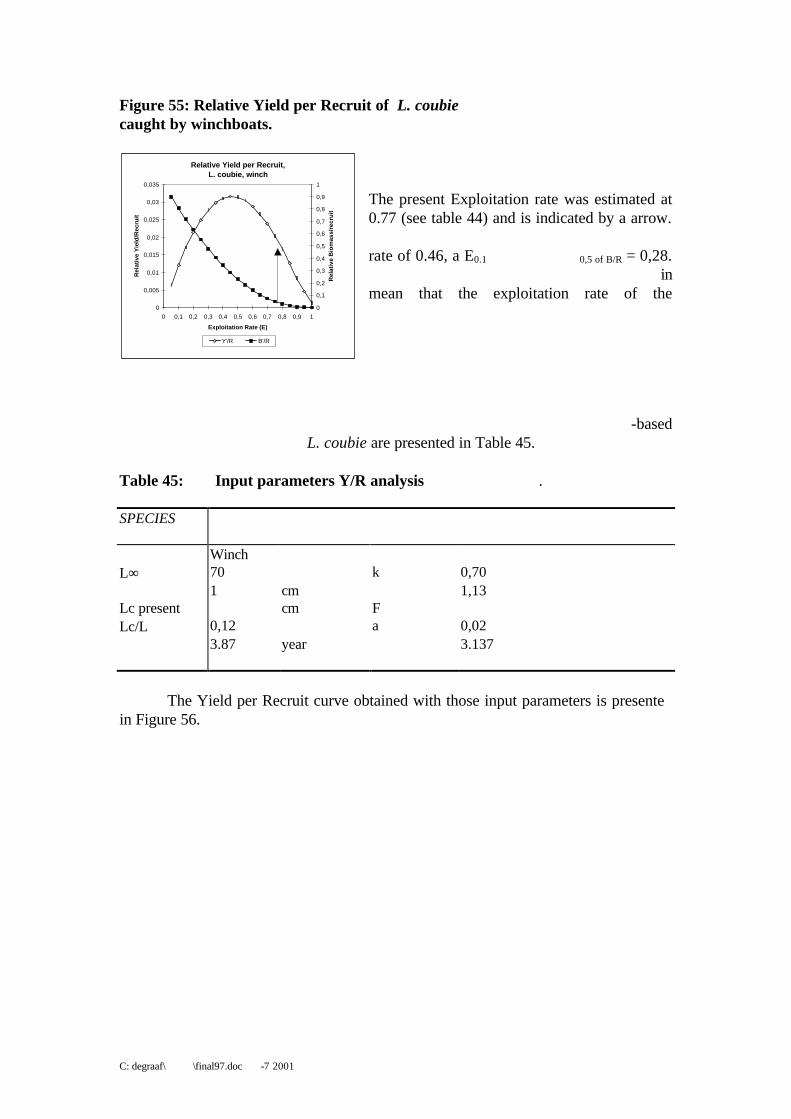
C: degraaf\ \final97.doc -7 2001
Figure 55: Relative Yield per Recruit of L. coubiecaught by winchboats.
The present Exploitation rate was estimated at 0.77 (see table 44) and is indicated by a arrow.
rate of 0.46, a E0.1 0,5 of B/R = 0,28. in
mean that the exploitation rate of the
-based L. coubie are presented in Table 45.
Table 45: Input parameters Y/R analysis .
SPECIES
Winch L∞ 70 k 0,70
1 cm 1,13Lc present cm F Lc/L 0,12 a 0,02
3.87 year 3.137
The Yield per Recruit curve obtained with those input parameters is presentein Figure 56.
Relative Yield per Recruit, L. coubie, winch
0
0,005
0,01
0,015
0,02
0,025
0,03
0,035
0 0,1 0,2 0,3 0,4 0,5 0,6 0,7 0,8 0,9 1
Exploitation Rate (E)
Rel
ativ
e Y
ield
/Rec
ruit
0
0,1
0,2
0,3
0,4
0,5
0,6
0,7
0,8
0,9
1
Rel
ativ
e B
iom
ass/
recr
uit
Y'/R B'/R

76
C:\degraaf\Ghana\final97.doc 29-7-2001
Figure 56: Yield per Recruits of L. coubie for winchboats in stratum VII of Lake Volta.
The present Fishing mortality of winchboats for L. coubie was estimated before at 3.87 (indicated by the arrow) which is larger as the FMSY = 1. Again it would mean overexpoitation20, especially “growth overfishing”, the fish are caught too early and the growth potential is not used optimally. Increasing the length at first capture would increase the Yield per Recruit.
5.7.4 Thompson and Bell prediction for L. coubie
The results of the VPA analysis were used for prediction of catch and value with a Thompson and Bell model. The results for gillnets, winchboats and the cumulative values are presented in Figures 57, 58 & 59. Figure 57: Thompson and Bell analysis for L. coubie caught by gillnets.
At the present fishing effort (Ffactor =1) the annual catch of gillnets is estimated at 3452 tonnes with a value of 240.000 USD/yr. The optimal fishing effort considering yield is almost reached and is Ffactor=0.3 (Yield=6059 t/yr). The optimal economic fishing effort is reached at Ffactor=0.2 (Value=625,000 USD/yr).
Figure 58: Thompson and Bell analysis for L. coubie caught by winchboats.
At the present fishing effort (Ffactor=1) the annual catch of winchboats is estimated 215 tonnes with a value of 16.000 USD/yr. The optimal fishing effort considering yield is Ffactor=0.4 (Yield=250 t/yr). The optimal economic fishing effort is Ffactor=0.4 (Value=24.000 USD/yr).
20 If the data are representative
Yield per RecruitL. coubie, winch
0
200
400
600
800
1000
1200
1400
1600
0 0,5 1 1,5 2 2,5 3 3,5 4 4,5 5
Fishing mortality
Y/R
Lc present
1920
2224
L. coubie Gillnets
0
1000
2000
3000
4000
5000
6000
7000
0 1 2 3 4
F-factor
Yie
ld &
Val
ue
0
1000
2000
3000
4000
5000
6000
Bio
mas
s
Yield (t/yr) Value (100 US$/yr) Biomass (t)
L. coubieWinch
0
50
100
150
200
250
0 1 2 3 4
F-factor
Yie
ld &
Val
ue
0
50
100
150
Bio
mas
s
Yield (t/yr) Value (100 US$/yr) Biomass (t)
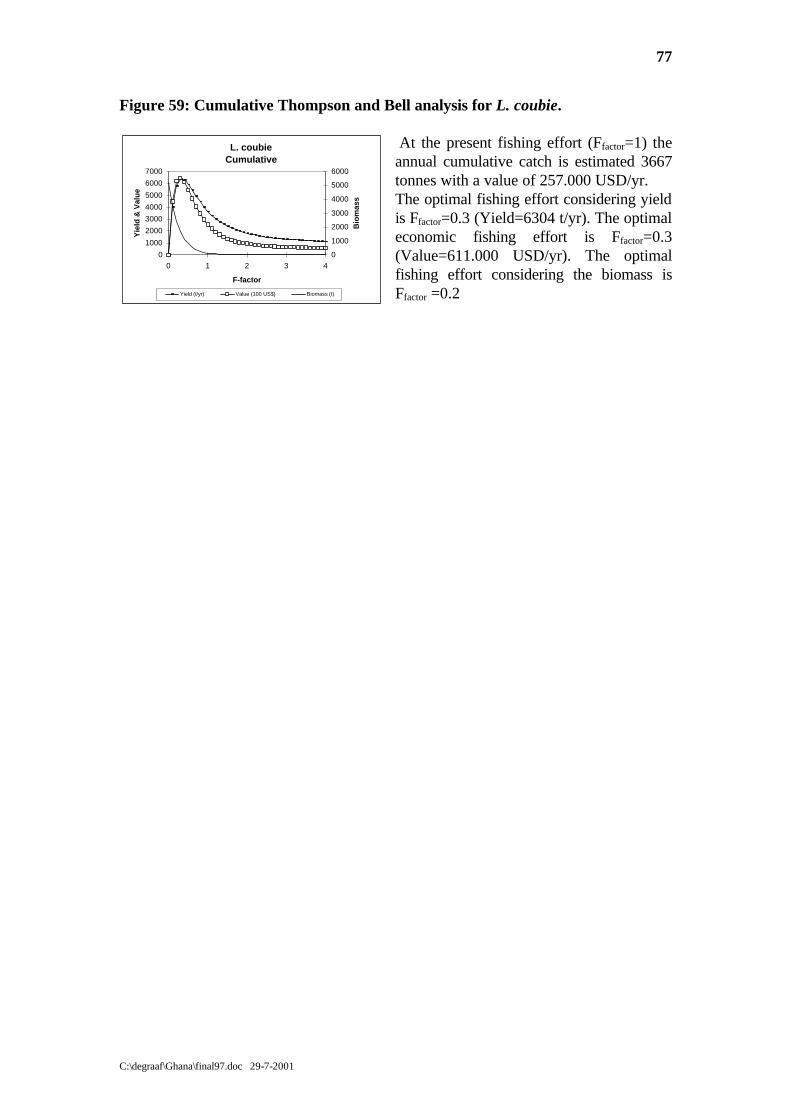
77
C:\degraaf\Ghana\final97.doc 29-7-2001
Figure 59: Cumulative Thompson and Bell analysis for L. coubie.
At the present fishing effort (Ffactor=1) the annual cumulative catch is estimated 3667 tonnes with a value of 257.000 USD/yr. The optimal fishing effort considering yield is Ffactor=0.3 (Yield=6304 t/yr). The optimal economic fishing effort is Ffactor=0.3 (Value=611.000 USD/yr). The optimal fishing effort considering the biomass is Ffactor =0.2
L. coubieCumulative
0
1000
2000
3000
4000
5000
6000
7000
0 1 2 3 4
F-factor
Yie
ld &
Val
ue
0
1000
2000
3000
4000
5000
6000
Bio
mas
s
Yield (t/yr) Value (100 US$) Biomass (t)
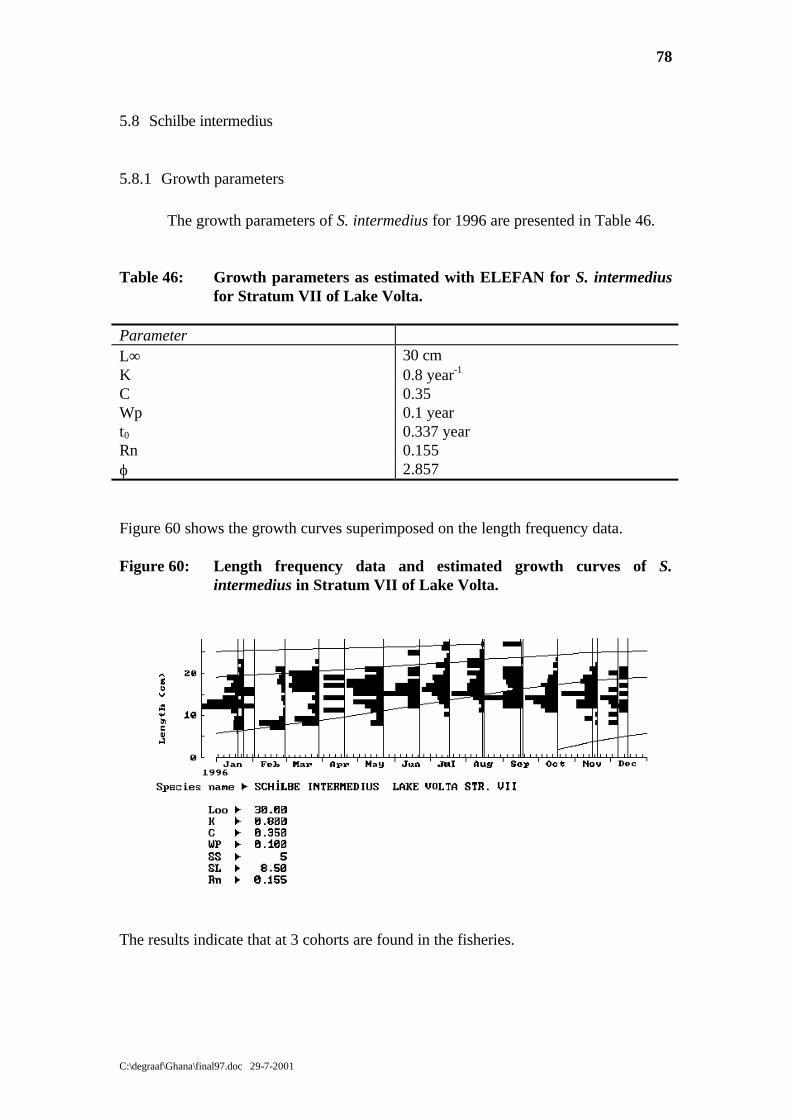
78
C:\degraaf\Ghana\final97.doc 29-7-2001
5.8 Schilbe intermedius
5.8.1 Growth parameters
The growth parameters of S. intermedius for 1996 are presented in Table 46. Table 46: Growth parameters as estimated with ELEFAN for S. intermedius
for Stratum VII of Lake Volta. Parameter L∞ 30 cm K 0.8 year-1 C 0.35 Wp 0.1 year t0 0.337 year Rn 0.155 ϕ 2.857 Figure 60 shows the growth curves superimposed on the length frequency data. Figure 60: Length frequency data and estimated growth curves of S.
intermedius in Stratum VII of Lake Volta.
The results indicate that at 3 cohorts are found in the fisheries.

79
C:\degraaf\Ghana\final97.doc 29-7-2001
The length weight relationship could be described with:
W = 0.006 L 3.23
5.8.2 Gillnets
5.8.2.1 Mortality rates The linearised catch curve of S. intermedius for gillnets is presented in Figure 61. Figure 61: The length converted catch curve of S. intermedius for gillnets in
stratum VII of Lake Volta.
Parameter estimates as obtained from the catch curve are presented in Table 47. Table 47: Parameter estimates as obtained from a length converted catch
curve for S. intermedius caught by gillnets in Stratum VII of Lake Volta.
Parameter Total mortality (Z, year-1) 4.49 Natural mortality (M, year-1) 1.59 Fishing mortality (F, year-1) 2.90 Exploitation rate (E) 0.65 Cut-off length (L’, cm) 11.5 Mean length (from L’, cm) 15.9 L25 (cm) 10.6 L50 (cm) 11.4 L75 (cm) 12.1

80
C:\degraaf\Ghana\final97.doc 29-7-2001
5.8.2.2 Virtual Population Analysis The fishing mortality (F) of gillnets per length group as obtained from a VPA is presented in Figure 62. Figure 62: Fishing mortality from gillnets for S. intermedius in stratum VII of
Lake Volta.
The fishing mortality starts at a length of 11 cm and reaches it peak at a length of 16 cm. The total catch of S. intermedius by gillnets in 1996 was 1307 tonnes.
5.8.2.3 Yield per Recruit Analysis The results of the Relative Yield per Recruit Analysis is presented in Figure 63. Figure 63: Relative Yield per Recruit of S. intermedius caught by gill nets.
The present Exploitation rate was estimated at 0.65 (see table 47) and is indicated by a arrow. The analysis indicated a maximum exploitation rate of 0.57, a E0.1 =0.50 and a E0,5 of B/R = 0,32. If all data are representative it would mean that the exploitation rate of the gillnets is too high.
Relative Yield per Recruit, S. intermedius, Gillnets
0
0,005
0,01
0,015
0,02
0,025
0,03
0 0,1 0,2 0,3 0,4 0,5 0,6 0,7 0,8 0,9 1
Exploitation Rate (E)
Rel
ativ
e Y
ield
/Rec
ruit
0
0,1
0,2
0,3
0,4
0,5
0,6
0,7
0,8
0,9
1
Rel
ativ
e B
iom
ass/
recr
uit
Y'/R B'/R
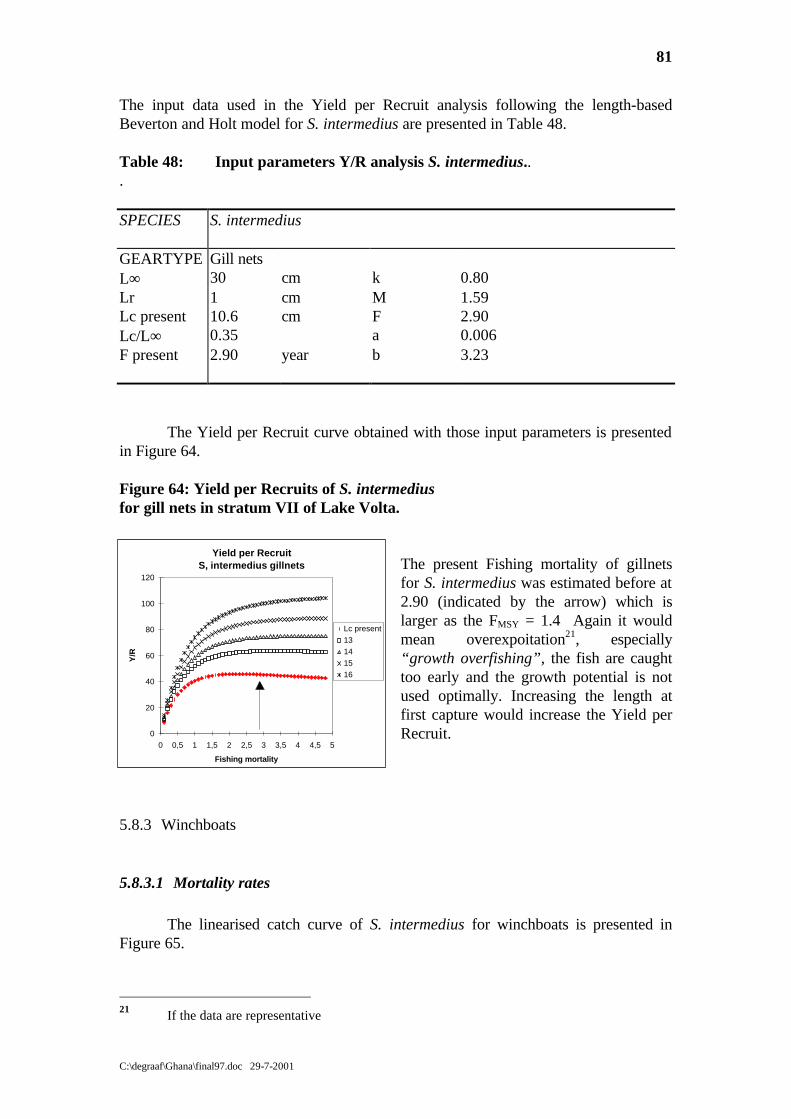
81
C:\degraaf\Ghana\final97.doc 29-7-2001
The input data used in the Yield per Recruit analysis following the length-based Beverton and Holt model for S. intermedius are presented in Table 48. Table 48: Input parameters Y/R analysis S. intermedius.. . SPECIES S. intermedius
GEARTYPE Gill nets L∞ 30 cm k 0.80 Lr 1 cm M 1.59 Lc present 10.6 cm F 2.90 Lc/L∞ 0.35 a 0.006 F present 2.90 year b 3.23 The Yield per Recruit curve obtained with those input parameters is presented in Figure 64. Figure 64: Yield per Recruits of S. intermedius for gill nets in stratum VII of Lake Volta.
The present Fishing mortality of gillnets for S. intermedius was estimated before at 2.90 (indicated by the arrow) which is larger as the FMSY = 1.4 Again it would mean overexpoitation21, especially “growth overfishing”, the fish are caught too early and the growth potential is not used optimally. Increasing the length at first capture would increase the Yield per Recruit.
5.8.3 Winchboats
5.8.3.1 Mortality rates The linearised catch curve of S. intermedius for winchboats is presented in Figure 65.
21 If the data are representative
Yield per RecruitS, intermedius gillnets
0
20
40
60
80
100
120
0 0,5 1 1,5 2 2,5 3 3,5 4 4,5 5
Fishing mortality
Y/R
Lc present13141516
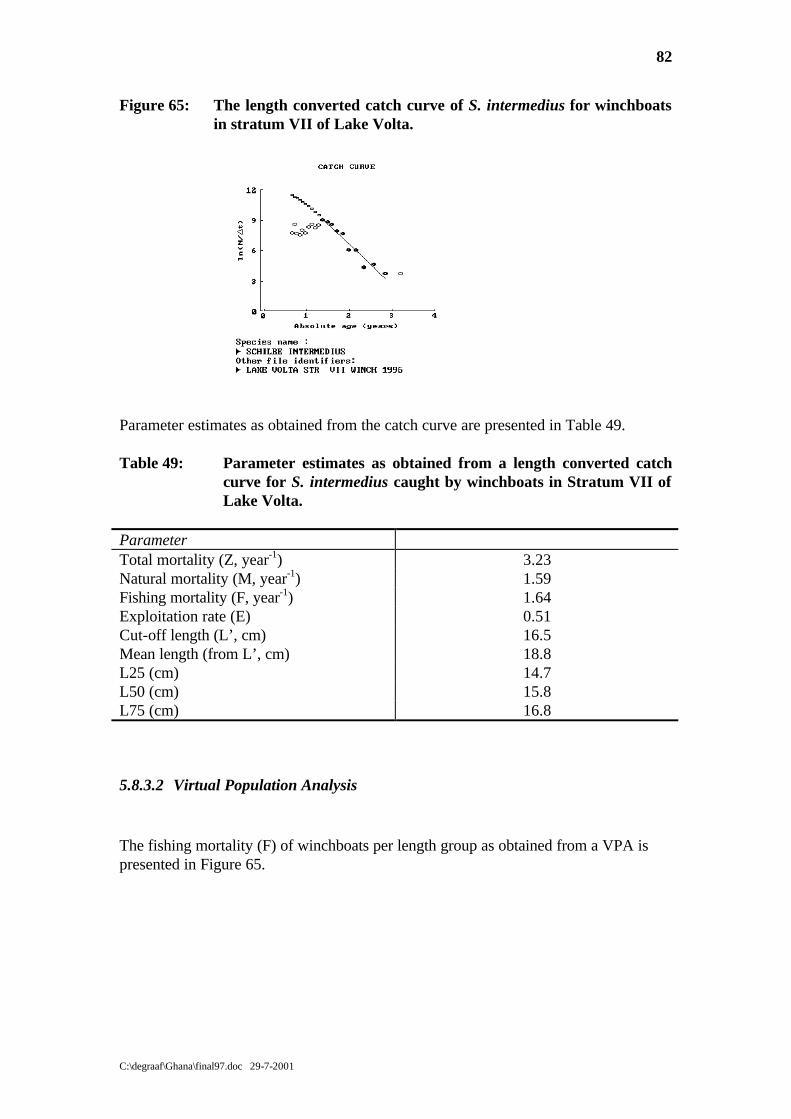
82
C:\degraaf\Ghana\final97.doc 29-7-2001
Figure 65: The length converted catch curve of S. intermedius for winchboats in stratum VII of Lake Volta.
Parameter estimates as obtained from the catch curve are presented in Table 49. Table 49: Parameter estimates as obtained from a length converted catch
curve for S. intermedius caught by winchboats in Stratum VII of Lake Volta.
Parameter Total mortality (Z, year-1) 3.23 Natural mortality (M, year-1) 1.59 Fishing mortality (F, year-1) 1.64 Exploitation rate (E) 0.51 Cut-off length (L’, cm) 16.5 Mean length (from L’, cm) 18.8 L25 (cm) 14.7 L50 (cm) 15.8 L75 (cm) 16.8
5.8.3.2 Virtual Population Analysis
The fishing mortality (F) of winchboats per length group as obtained from a VPA is presented in Figure 65.

83
C:\degraaf\Ghana\final97.doc 29-7-2001
Figure 65: Fishing mortality from winchboats for S. intermedius in stratum VII of Lake Volta.
The fishing mortality starts at a length of 15 cm and reaches it peak at a length of 20 cm. The total catch of S. intermedius by gillnets in 1996 was 155 tonnes.
5.8.3.3 Yield per Recruit Analysis The results of the Relative Yield per Recruit Analysis is presented in Figure 66. Figure 66: Relative Yield per Recruit of S. intermedius caught by winchboats.
The present Exploitation rate was estimated at 0.51 (see table 49) and is indicated by a arrow. The analysis indicated a maximum exploitation rate of 0.57, a E0.1 =0.55 and a E0,5 of
B/R = 0,33. It would mean that the present exploitation rate almost reached its maximum.
The input data used in the Yield per Recruit analysis following the length-based Beverton and Holt model for S. intermedius are presented in Table 50.
Relative Yield per Recruit, S. intermedius, Winch
0
0,005
0,01
0,015
0,02
0,025
0 0,1 0,2 0,3 0,4 0,5 0,6 0,7 0,8 0,9 1
Exploitation Rate (E)
Rel
ativ
e Y
ield
/Rec
ruit
0
0,1
0,2
0,3
0,4
0,5
0,6
0,7
0,8
0,9
1
Rel
ativ
e B
iom
ass/
recr
uit
Y'/R B'/R
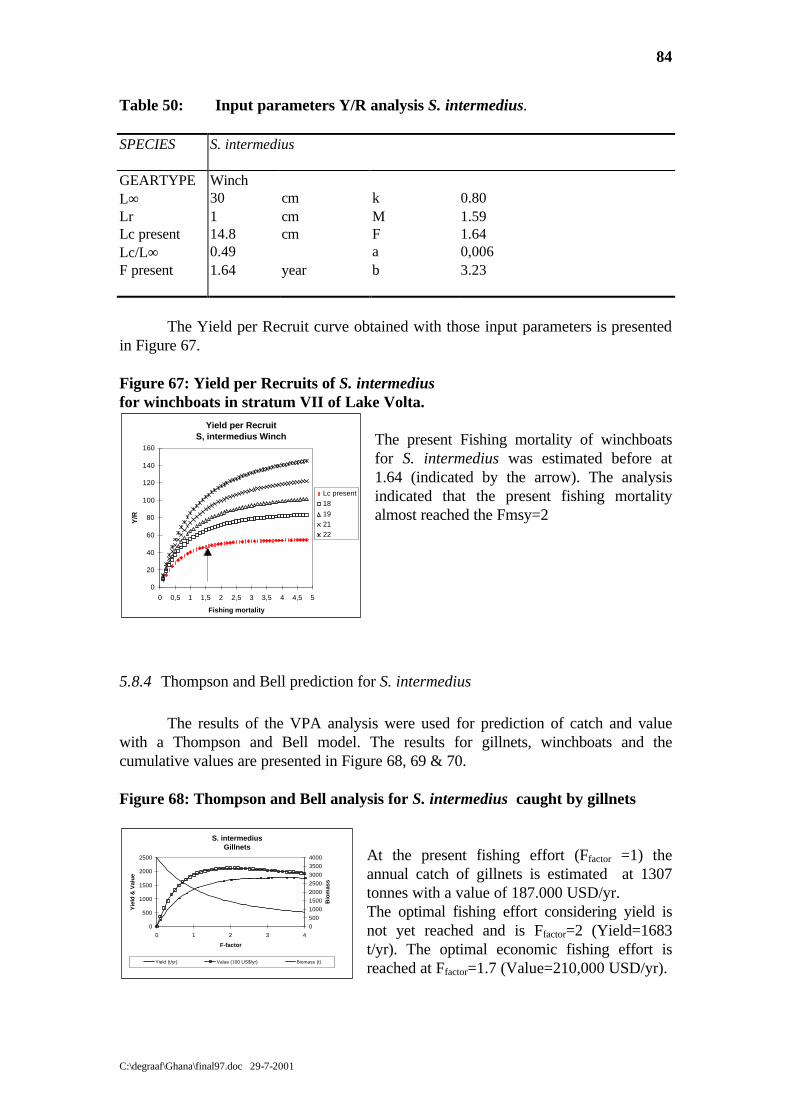
84
C:\degraaf\Ghana\final97.doc 29-7-2001
Table 50: Input parameters Y/R analysis S. intermedius. SPECIES S. intermedius
GEARTYPE Winch L∞ 30 cm k 0.80 Lr 1 cm M 1.59 Lc present 14.8 cm F 1.64 Lc/L∞ 0.49 a 0,006 F present 1.64 year b 3.23
The Yield per Recruit curve obtained with those input parameters is presented in Figure 67. Figure 67: Yield per Recruits of S. intermedius for winchboats in stratum VII of Lake Volta.
The present Fishing mortality of winchboats for S. intermedius was estimated before at 1.64 (indicated by the arrow). The analysis indicated that the present fishing mortality almost reached the Fmsy=2
5.8.4 Thompson and Bell prediction for S. intermedius
The results of the VPA analysis were used for prediction of catch and value with a Thompson and Bell model. The results for gillnets, winchboats and the cumulative values are presented in Figure 68, 69 & 70. Figure 68: Thompson and Bell analysis for S. intermedius caught by gillnets
At the present fishing effort (Ffactor =1) the annual catch of gillnets is estimated at 1307 tonnes with a value of 187.000 USD/yr. The optimal fishing effort considering yield is not yet reached and is Ffactor=2 (Yield=1683 t/yr). The optimal economic fishing effort is reached at Ffactor=1.7 (Value=210,000 USD/yr).
Yield per RecruitS, intermedius Winch
0
20
40
60
80
100
120
140
160
0 0,5 1 1,5 2 2,5 3 3,5 4 4,5 5
Fishing mortality
Y/R
Lc present
18
19
21
22
S. intermedius Gillnets
0
500
1000
1500
2000
2500
0 1 2 3 4
F-factor
Yie
ld &
Val
ue
0
500
1000
1500
2000
2500
3000
3500
4000
Bio
mas
s
Yield (t/yr) Value (100 US$/yr) Biomass (t)

85
C:\degraaf\Ghana\final97.doc 29-7-2001
Figure 69: Thompson and Bell analysis for S. intermedius caught by winchboats.
At the present fishing effort (Ffactor=1) the annual catch of winchboats is estimated 155 tonnes with a value of 19.000 USD/yr. The optimal fishing effort considering yield is Ffactor=1.4 (Yield=165 t/yr). The optimal economic fishing effort is Ffactor=1.1 (Value=19.500 USD/yr).
Figure 70: Cumulative Thompson and Bell analysis for S. intermedius.
At the present fishing effort (Ffactor=1) the annual cumulative catch is estimated 1462 tonnes with a value of 206.000 USD/yr. The optimal fishing effort considering yield is Ffactor=3.3 (Yield=1920 t/yr). The optimal economic fishing effort is Ffactor=1.9 (Value=229.000 USD/yr). The optimal fishing effort considering the biomass is Ffactor =1.2.
S. intermediusWinch
0
50
100
150
200
250
0 1 2 3 4
F-factor
Yie
ld &
Val
ue
0
100
200
300
400
Bio
mas
s
Yield (t/yr) Value (100 US$/yr) Biomass (t)
S. intermediusCumulative
0
500
1000
1500
2000
2500
0 1 2 3 4
F-factor
Yie
ld &
Val
ue
050010001500200025003000350040004500
Bio
mas
s
Yield (t/yr) Value (100 US$) Biomass (t)
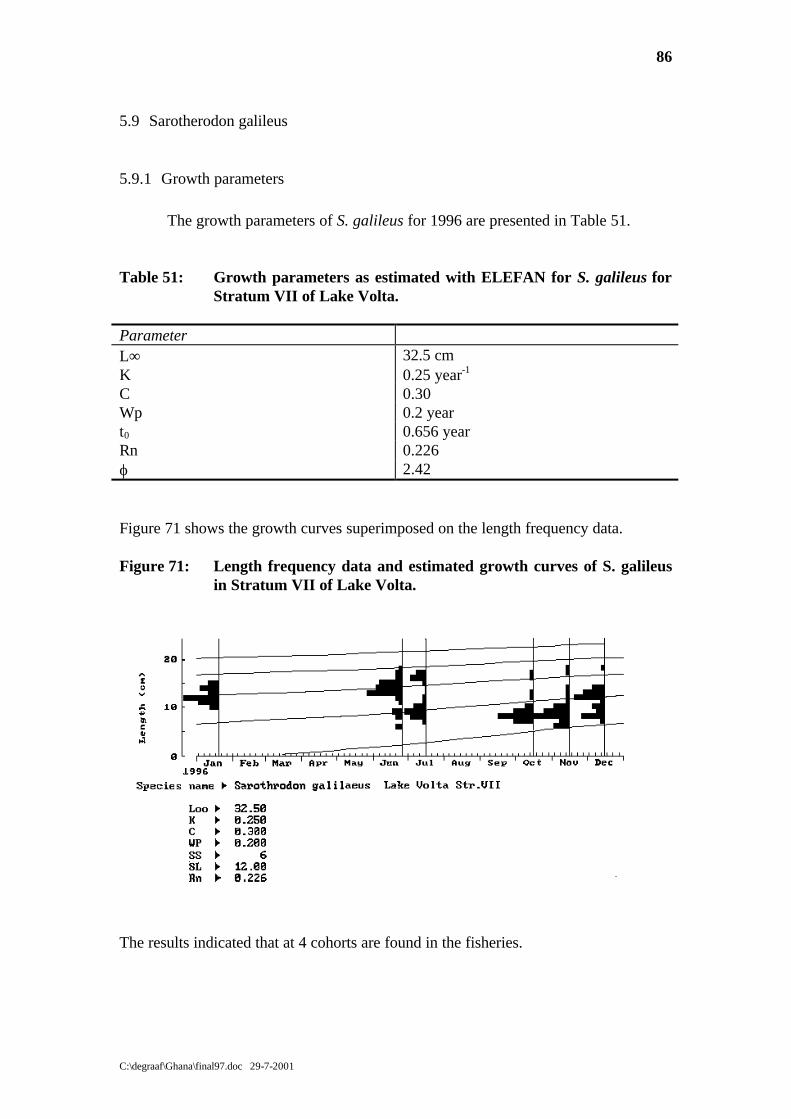
86
C:\degraaf\Ghana\final97.doc 29-7-2001
5.9 Sarotherodon galileus
5.9.1 Growth parameters
The growth parameters of S. galileus for 1996 are presented in Table 51. Table 51: Growth parameters as estimated with ELEFAN for S. galileus for
Stratum VII of Lake Volta. Parameter L∞ 32.5 cm K 0.25 year-1 C 0.30 Wp 0.2 year t0 0.656 year Rn 0.226 ϕ 2.42 Figure 71 shows the growth curves superimposed on the length frequency data. Figure 71: Length frequency data and estimated growth curves of S. galileus
in Stratum VII of Lake Volta.
The results indicated that at 4 cohorts are found in the fisheries.

87
C:\degraaf\Ghana\final97.doc 29-7-2001
The length weight relationship could be described with:
W = 0.0125 L 3.01
5.9.2 Gillnets
S. galileus was not caught by the winchboats. Therefore the stock-assessments analysis the results of gillnets only
5.9.2.1 Mortality rates The linearised catch curve of S. galileus for gillnets is presented in Figure 72. Figure 72: The length converted catch curve of S. galileus for gillnets in
stratum VII of Lake Volta. Parameter estimates as obtained from the catch curve are presented in Table 52. Table 52: Parameter estimates as obtained from a length converted catch
curve for S. galileus caught by gillnets in Stratum VII of Lake Volta.
Parameter Total mortality (Z, year-1) 1.84 Natural mortality (M, year-1) 0.73 Fishing mortality (F, year-1) 1.84 Exploitation rate (E) 0.60 Cut-off length (L’, cm) 7.5 Mean length (from L’, cm) 11.3 L25 (cm) 6.6 L50 (cm) 7.5 L75 (cm) 8.42

88
C:\degraaf\Ghana\final97.doc 29-7-2001
5.9.2.2 Virtual Population Analysis The fishing mortality (F) of gillnets per length group as obtained from a VPA is presented in Figure 73.
Figure 73: Fishing mortality from gillnets for S. galileus in stratum VII of Lake Volta.
The fishing mortality starts at a length of 6 cm and reaches it peak at a length of 19 cm. The total catch of S. galileus by gillnets in 1996 was 998 tonnes.
5.9.2.3 Yield per Recruit Analysis The results of the Relative Yield per Recruit Analysis is presented in Figure 74. Figure 74: Relative Yield per Recruit of S. galileus caught by gill nets.
The present Exploitation rate was estimated at 0.60 (see table 52) and is indicated by a arrow. The analysis indicated a maximum exploitation rate of 0.46, a E0.1 =0.41 and a E0,5 of B/R = 0,27. If all data are representative it would mean that the exploitation rate of the gillnets is too high.
Relative Yield per Recruit, S. galileus, Gillnets
0
0,002
0,004
0,006
0,008
0,01
0,012
0 0,1 0,2 0,3 0,4 0,5 0,6 0,7 0,8 0,9 1
Exploitation Rate (E)
Rel
ativ
e Y
ield
/Rec
ruit
0
0,1
0,2
0,3
0,4
0,5
0,6
0,7
0,8
0,9
Rel
ativ
e B
iom
ass/
recr
uit
Y'/R B'/R

89
C:\degraaf\Ghana\final97.doc 29-7-2001
The input data used in the Yield per Recruit analysis following the length-based Beverton and Holt model for S. galileus are presented in Table 53. Table 53: Input parameters Y/R analysis S. galileus. SPECIES S. galileus
GEARTYPE Gill nets L∞ 32.5 cm k 0.25 Lr 1 cm M 0.73 Lc present 7.5 cm F 1.11 Lc/L∞ 0.23 a 0.0125 F present 1.11 year b 3.01 The Yield per Recruit curve obtained with those input parameters is presented in Figure 75. Figure 75: Yield per Recruits of S. galileus for gill nets in stratum VII of Lake Volta.
The present Fishing mortality of gillnets for S. galileus was estimated before at 1.11 (indicated by the arrow) which is larger as the FMSY = 0.9 Again it would mean overexpoitation22, especially “growth overfishing”, the fish are caught too early and the growth potential is not used optimally. Increasing the length at first capture would increase the Yield per Recruit.
5.9.3 Thompson and Bell prediction for S. galileus
The results of the VPA analysis were used for prediction of catch and value with a Thompson and Bell model. The results for gillnets, winchboats and the cumulative values are presented in Figure 76.
22 If the data are representative
Yield per RecruitS, galileus gillnets
0
10
20
30
40
50
60
0 0,5 1 1,5 2 2,5 3 3,5 4 4,5 5
Fishing mortality
Y/R
Lc present
910
1111
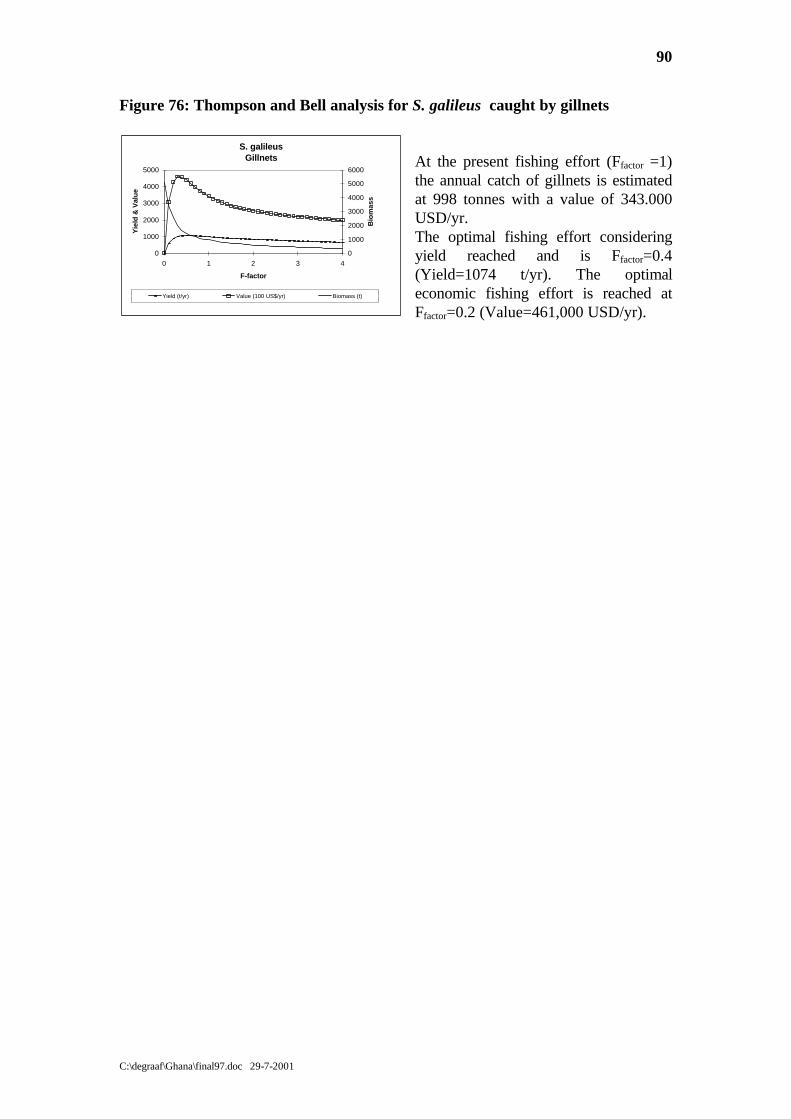
90
C:\degraaf\Ghana\final97.doc 29-7-2001
Figure 76: Thompson and Bell analysis for S. galileus caught by gillnets
At the present fishing effort (Ffactor =1) the annual catch of gillnets is estimated at 998 tonnes with a value of 343.000 USD/yr. The optimal fishing effort considering yield reached and is Ffactor=0.4 (Yield=1074 t/yr). The optimal economic fishing effort is reached at Ffactor=0.2 (Value=461,000 USD/yr).
S. galileus Gillnets
0
1000
2000
3000
4000
5000
0 1 2 3 4
F-factor
Yie
ld &
Val
ue
0
1000
2000
3000
4000
5000
6000
Bio
mas
s
Yield (t/yr) Value (100 US$/yr) Biomass (t)

91
C:\degraaf\Ghana\final97.doc 29-7-2001
5.10 Oreochromis niloticus
5.10.1 Growth parameters
The data set for O. niloticus did not give a reliable fit (Rn = 0.070) when a class interval of 1 cm was used. The results improved when the data set was regrouped using a class interval of 2 cm. Within the analysis this class interval was further used The growth parameters of O. niloticus for 1996 are presented in Table 54. Table 54: Growth parameters as estimated with ELEFAN for O. niloticus for
Stratum VII of Lake Volta. Parameter L∞ 33.5 cm K 0.35 year-1 C 0.6 Wp 0.95 year t0 0.45 year Rn 0.191 ϕ 2.59 Figure 77. shows the growth curves superimposed on the length frequency data. Figure 77: Length frequency data and estimated growth curves of O. niloticus
in Stratum VII of Lake Volta.

92
C:\degraaf\Ghana\final97.doc 29-7-2001
The results indicated that at 5-6 cohorts are found in the fisheries. The length weight relationship could be described with:
W = 0.081 L 2.777
5.10.2 Gillnets
O. niloticus was not caught by the winchboats. Therefore the stock-assessments analysis the results of gillnets only
5.10.2.1 Mortality rates The linearised catch curve of O. niloticus for gillnets is presented in Figure 78. Figure 78: The length converted catch curve of O. niloticus for gillnets in
stratum VII of Lake Volta. Parameter estimates as obtained from the catch curve are presented in Table 55. Table 55: Parameter estimates as obtained from a length converted catch
curve for O. niloticus caught by gillnets in Stratum VII of Lake Volta.
Parameter Total mortality (Z, year-1) 1.28 Natural mortality (M, year-1) 0.90 Fishing mortality (F, year-1) 0.38 Exploitation rate (E) 0.3 Cut-off length (L’, cm) 14.0 Mean length (from L’, cm) 18.4 L25 (cm) 9.6 L50 (cm) 11.4 L75 (cm) 13.3
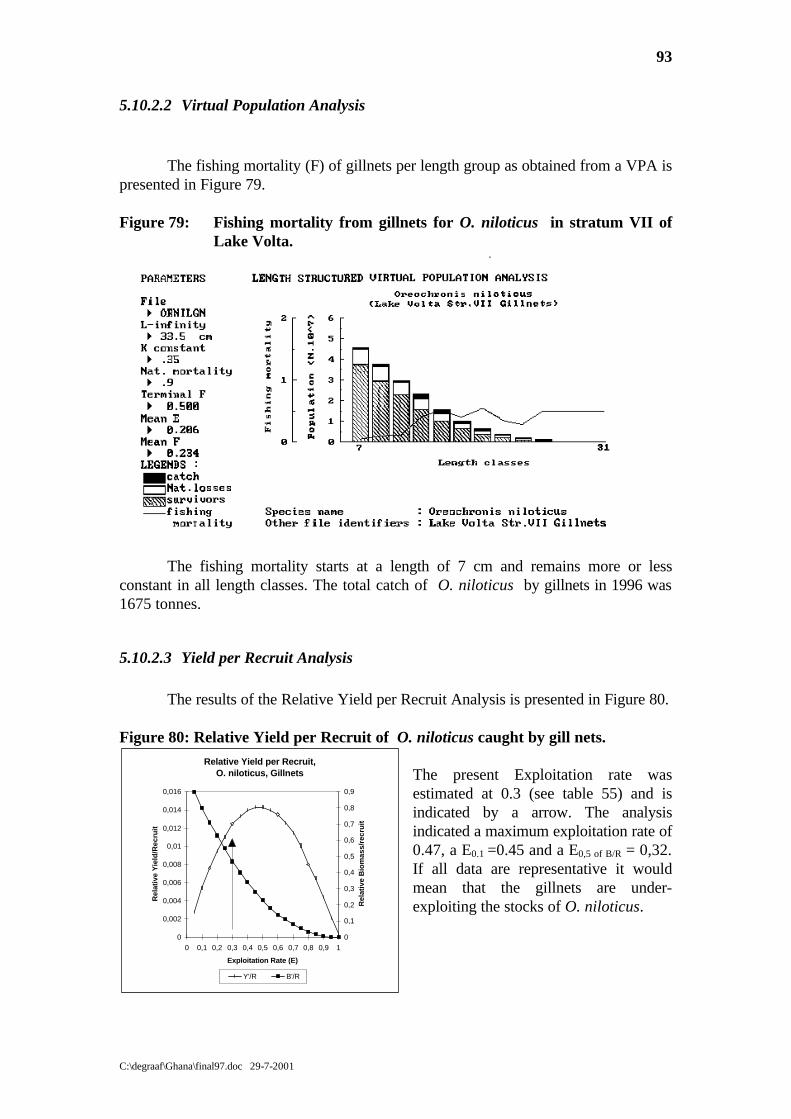
93
C:\degraaf\Ghana\final97.doc 29-7-2001
5.10.2.2 Virtual Population Analysis The fishing mortality (F) of gillnets per length group as obtained from a VPA is presented in Figure 79. Figure 79: Fishing mortality from gillnets for O. niloticus in stratum VII of
Lake Volta.
The fishing mortality starts at a length of 7 cm and remains more or less constant in all length classes. The total catch of O. niloticus by gillnets in 1996 was 1675 tonnes.
5.10.2.3 Yield per Recruit Analysis The results of the Relative Yield per Recruit Analysis is presented in Figure 80. Figure 80: Relative Yield per Recruit of O. niloticus caught by gill nets.
The present Exploitation rate was estimated at 0.3 (see table 55) and is indicated by a arrow. The analysis indicated a maximum exploitation rate of 0.47, a E0.1 =0.45 and a E0,5 of B/R = 0,32. If all data are representative it would mean that the gillnets are under-exploiting the stocks of O. niloticus.
Relative Yield per Recruit, O. niloticus, Gillnets
0
0,002
0,004
0,006
0,008
0,01
0,012
0,014
0,016
0 0,1 0,2 0,3 0,4 0,5 0,6 0,7 0,8 0,9 1
Exploitation Rate (E)
Rel
ativ
e Y
ield
/Rec
ruit
0
0,1
0,2
0,3
0,4
0,5
0,6
0,7
0,8
0,9
Rel
ativ
e B
iom
ass/
recr
uit
Y'/R B'/R

94
C:\degraaf\Ghana\final97.doc 29-7-2001
The input data used in the Yield per Recruit analysis following the length-based Beverton and Holt model for O. niloticus are presented in Table 56. Table 56: Input parameters Y/R analysis O. niloticus. SPECIES O. niloticus
GEARTYPE Gill nets L∞ 33.5 cm k 0.35 Lr 1 cm M 0.90 Lc present 11.5 cm F 0.38 Lc/L∞ 0.34 a 0.081 F present 0.38 year b 2.777 The Yield per Recruit curve obtained with those input parameters is presented in Figure 81. Figure 81: Yield per Recruits of S. galileus for gill nets in stratum VII of Lake Volta.
The present Fishing mortality of gillnets for O. niloticus was estimated before at 0.38 (indicated by the arrow) which is lower as the FMSY = 1.2 It would mean again that the stocks of O. niloticus are under exploited by the gillnets. Increasing the length at first capture would increase the Yield per Recruit.
5.10.3 Thompson and Bell prediction for O. niloticus
The results of the VPA analysis were used for prediction of catch and value with a Thompson and Bell model. The results for gillnets, winchboats and the cumulative values are presented in Figure 82.
Yield per RecruitO. niloticus gillnets
0
100
200
300
400
500
600
700
800
900
0 0,5 1 1,5 2 2,5 3 3,5 4 4,5 5
Fishing mortality
Y/R
Lc present14
1516
17
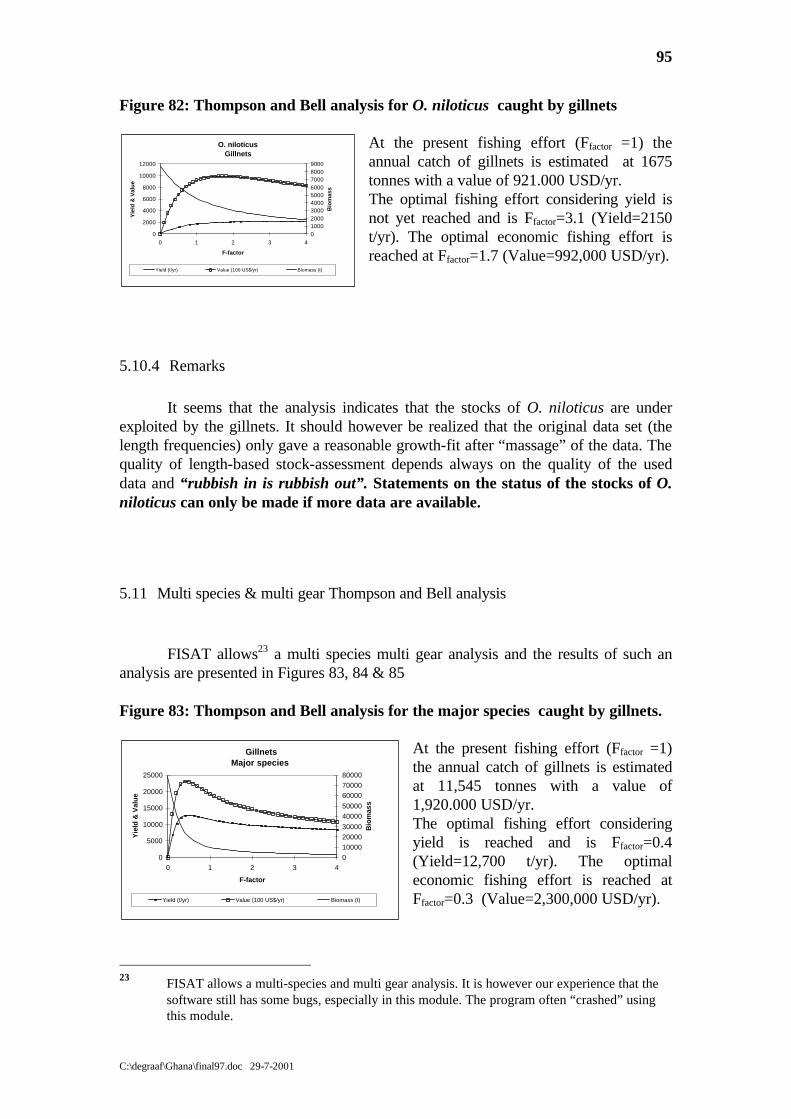
95
C:\degraaf\Ghana\final97.doc 29-7-2001
Figure 82: Thompson and Bell analysis for O. niloticus caught by gillnets
At the present fishing effort (Ffactor =1) the annual catch of gillnets is estimated at 1675 tonnes with a value of 921.000 USD/yr. The optimal fishing effort considering yield is not yet reached and is Ffactor=3.1 (Yield=2150 t/yr). The optimal economic fishing effort is reached at Ffactor=1.7 (Value=992,000 USD/yr).
5.10.4 Remarks
It seems that the analysis indicates that the stocks of O. niloticus are under exploited by the gillnets. It should however be realized that the original data set (the length frequencies) only gave a reasonable growth-fit after “massage” of the data. The quality of length-based stock-assessment depends always on the quality of the used data and “rubbish in is rubbish out”. Statements on the status of the stocks of O. niloticus can only be made if more data are available.
5.11 Multi species & multi gear Thompson and Bell analysis
FISAT allows23 a multi species multi gear analysis and the results of such an analysis are presented in Figures 83, 84 & 85 Figure 83: Thompson and Bell analysis for the major species caught by gillnets.
At the present fishing effort (Ffactor =1) the annual catch of gillnets is estimated at 11,545 tonnes with a value of 1,920.000 USD/yr. The optimal fishing effort considering yield is reached and is Ffactor=0.4 (Yield=12,700 t/yr). The optimal economic fishing effort is reached at Ffactor=0.3 (Value=2,300,000 USD/yr).
23 FISAT allows a multi-species and multi gear analysis. It is however our experience that the
software still has some bugs, especially in this module. The program often “crashed” using this module.
O. niloticus Gillnets
0
2000
4000
6000
8000
10000
12000
0 1 2 3 4
F-factor
Yie
ld &
Val
ue
0100020003000400050006000700080009000
Bio
mas
s
Yield (t/yr) Value (100 US$/yr) Biomass (t)
GillnetsMajor species
0
5000
10000
15000
20000
25000
0 1 2 3 4
F-factor
Yie
ld &
Val
ue
0
10000
20000
30000
40000
50000
60000
70000
80000
Bio
mas
s
Yield (t/yr) Value (100 US$/yr) Biomass (t)
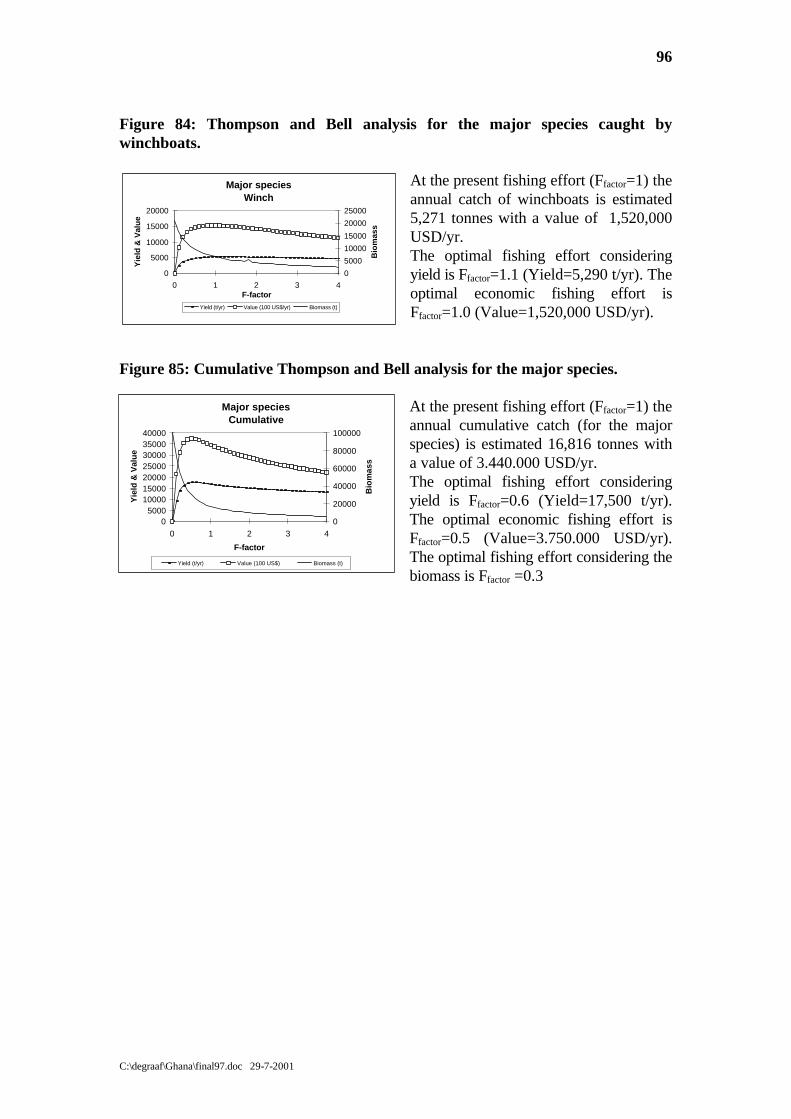
96
C:\degraaf\Ghana\final97.doc 29-7-2001
Figure 84: Thompson and Bell analysis for the major species caught by winchboats.
At the present fishing effort (Ffactor=1) the annual catch of winchboats is estimated 5,271 tonnes with a value of 1,520,000 USD/yr. The optimal fishing effort considering yield is Ffactor=1.1 (Yield=5,290 t/yr). The optimal economic fishing effort is Ffactor=1.0 (Value=1,520,000 USD/yr).
Figure 85: Cumulative Thompson and Bell analysis for the major species.
At the present fishing effort (Ffactor=1) the annual cumulative catch (for the major species) is estimated 16,816 tonnes with a value of 3.440.000 USD/yr. The optimal fishing effort considering yield is Ffactor=0.6 (Yield=17,500 t/yr). The optimal economic fishing effort is Ffactor=0.5 (Value=3.750.000 USD/yr). The optimal fishing effort considering the biomass is Ffactor =0.3
Major speciesWinch
0
5000
10000
15000
20000
0 1 2 3 4F-factor
Yie
ld &
Val
ue
0
5000
10000
15000
20000
25000
Bio
mas
s
Yield (t/yr) Value (100 US$/yr) Biomass (t)
Major speciesCumulative
05000
10000150002000025000300003500040000
0 1 2 3 4
F-factor
Yie
ld &
Val
ue
0
20000
40000
60000
80000
100000
Bio
mas
s
Yield (t/yr) Value (100 US$) Biomass (t)