ICSC Fall 2015 Webinar Slides
22
You will receive a recorded copy of this webinar within 24 hours.
-
Upload
andrew-garrett -
Category
Documents
-
view
144 -
download
0
Transcript of ICSC Fall 2015 Webinar Slides

You will receive a recorded copy of this webinar within 24 hours.

Market Trends & Analysis for 2015
ISCS Professional Development Webinar August 27, 2015
Andrew Garrett Director, Development

Agenda
Canadian Outlook for 2015 Economic Outlook Retail Outlook
Retail Trends Category Growth Luxury Expansion
Growth Markets Growth by Region Growth by Class
Q&A
Canadian Outlook
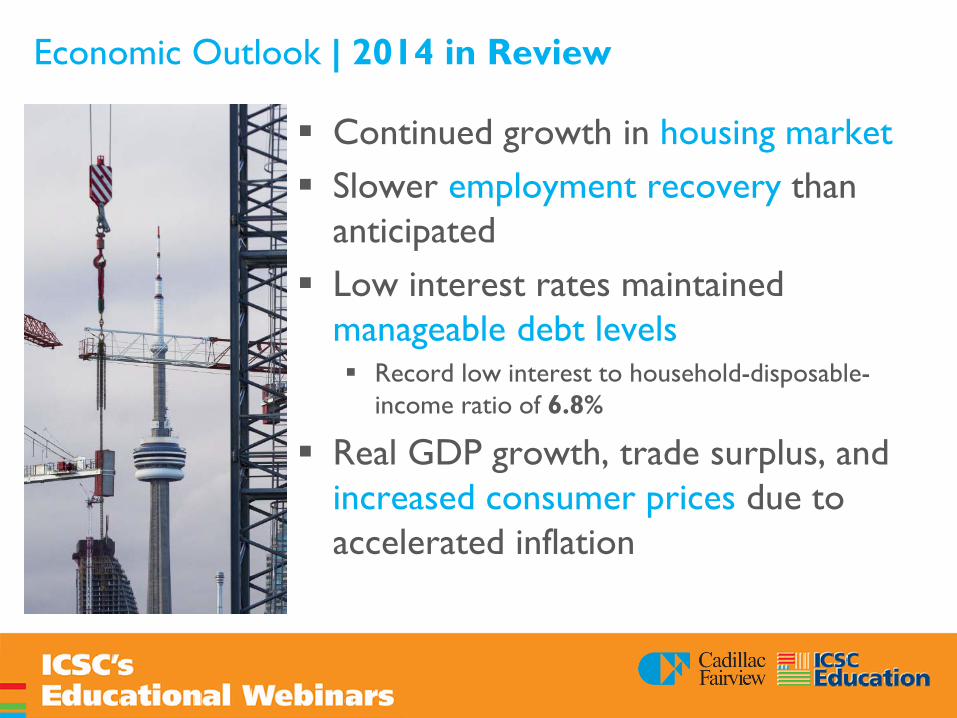
Economic Outlook | 2014 in Review
Continued growth in housing market Slower employment recovery than
anticipated Low interest rates maintained
manageable debt levels Record low interest to household-disposable-
income ratio of 6.8%
Real GDP growth, trade surplus, and increased consumer prices due to accelerated inflation

Economic Outlook | 2015 Forecast
Sinking commodity and oil prices Record high household debt-income
ratio of 162.6% Bank of Canada overnight interest rate
cut to 0.5% Exports and investment outlays to increase as a
result
Cheaper Canadian dollar may curb cross-border shopping
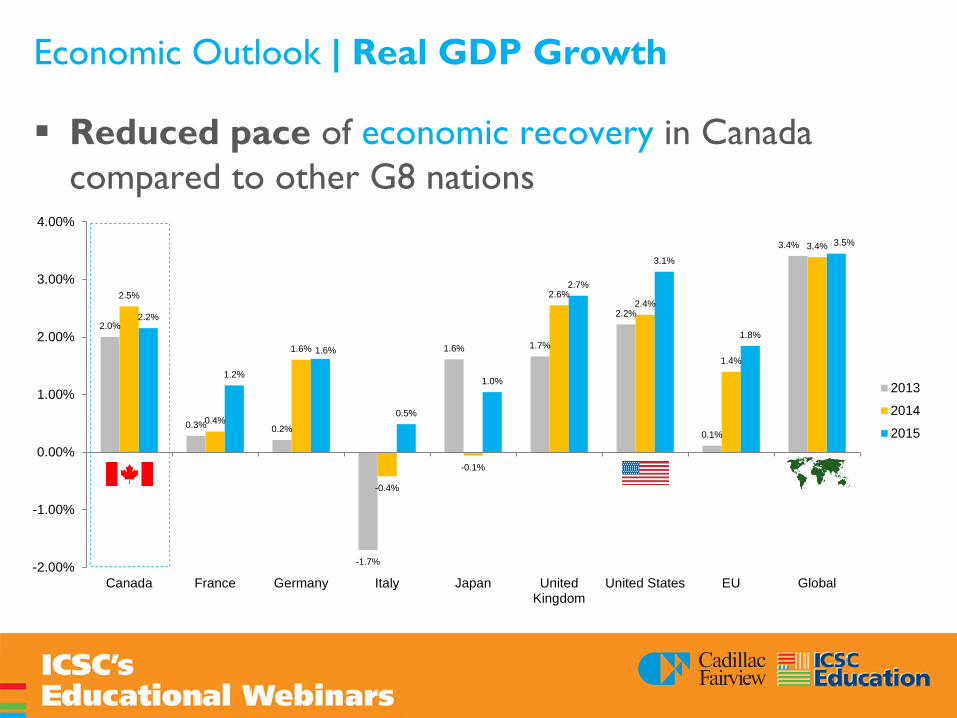
Economic Outlook | Real GDP Growth
Reduced pace of economic recovery in Canada compared to other G8 nations
2.0%
0.3% 0.2%
-1.7%
1.6% 1.7%
2.2%
0.1%
3.4%
2.5%
0.4%
1.6%
-0.4%
-0.1%
2.6% 2.4%
1.4%
3.4%
2.2%
1.2%
1.6%
0.5%
1.0%
2.7%
3.1%
1.8%
3.5%
-2.00%
-1.00%
0.00%
1.00%
2.00%
3.00%
4.00%
Canada France Germany Italy Japan UnitedKingdom
United States EU Global
2013
2014
2015
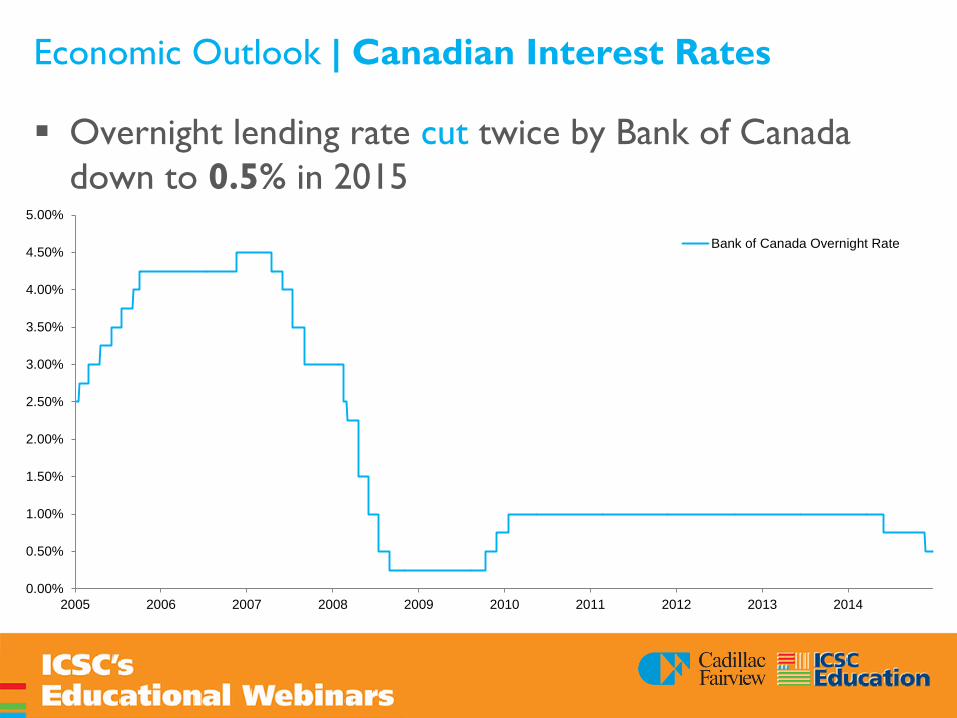
Economic Outlook | Canadian Interest Rates
Overnight lending rate cut twice by Bank of Canada down to 0.5% in 2015
0.00%
0.50%
1.00%
1.50%
2.00%
2.50%
3.00%
3.50%
4.00%
4.50%
5.00%
2005 2006 2007 2008 2009 2010 2011 2012 2013 2014
Bank of Canada Overnight Rate
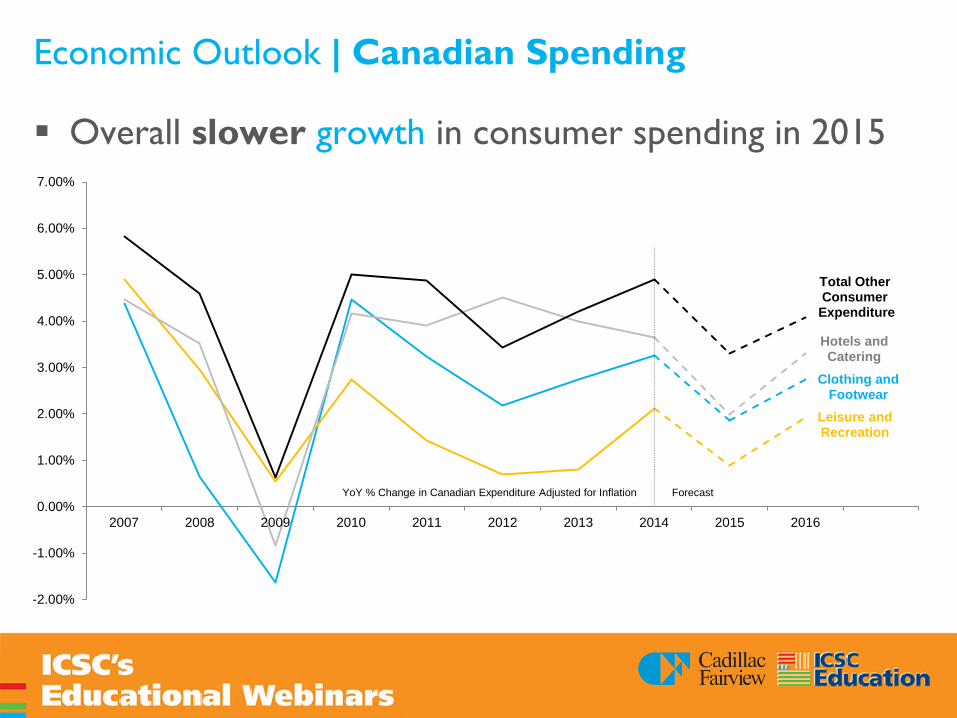
Economic Outlook | Canadian Spending
Overall slower growth in consumer spending in 2015
Clothing and Footwear
Leisure and Recreation
Hotels and Catering
Total Other Consumer
Expenditure
-2.00%
-1.00%
0.00%
1.00%
2.00%
3.00%
4.00%
5.00%
6.00%
7.00%
2007 2008 2009 2010 2011 2012 2013 2014 2015 2016
Forecast YoY % Change in Canadian Expenditure Adjusted for Inflation

Shopping Centre Outlook | Supply
Total shopping centre GLA plateauing at 542M SF
525.6
532.6
541.8 541.9
515
520
525
530
535
540
545
2010 2011 2012 2013
Tota
l Sho
ppin
g C
entre
GLA
in C
anad
a (m
illion
s of
SF)
Five Largest Canadian Shopping Centre Owners
47,878,000 SF
28,100,000 SF
27,816,000 SF
24,564,000 SF
24,555,000 SF
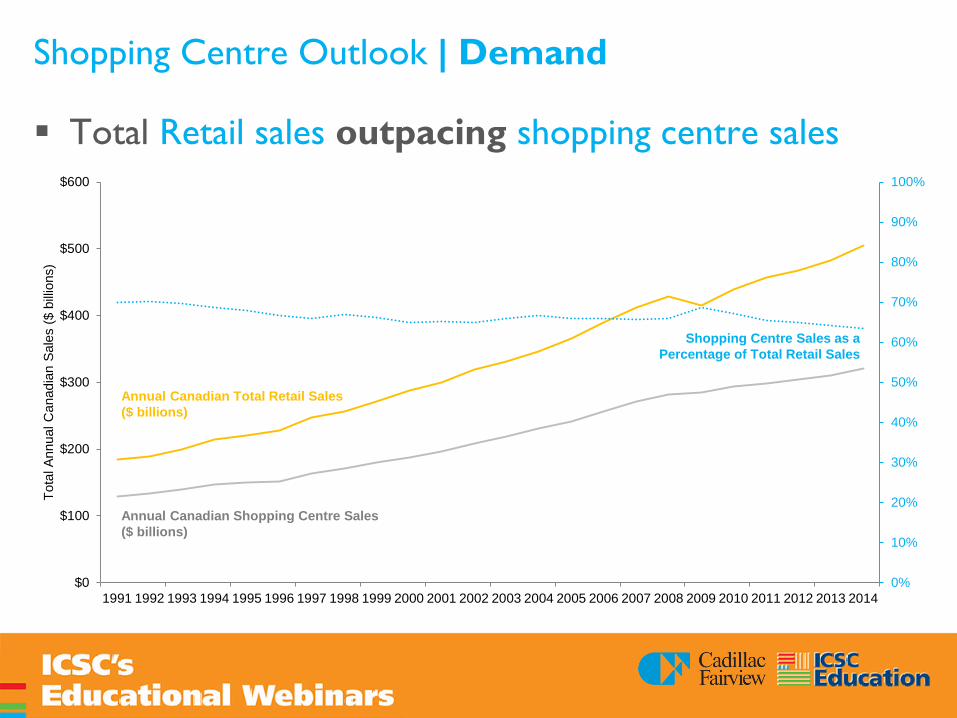
Shopping Centre Outlook | Demand
Total Retail sales outpacing shopping centre sales
0%
10%
20%
30%
40%
50%
60%
70%
80%
90%
100%
$0
$100
$200
$300
$400
$500
$600
1991 1992 1993 1994 1995 1996 1997 1998 1999 2000 2001 2002 2003 2004 2005 2006 2007 2008 2009 2010 2011 2012 2013 2014
Tota
l Ann
ual C
anad
ian
Sale
s ($
billi
ons)
Shopping Centre Sales as a Percentage of Total Retail Sales
Annual Canadian Total Retail Sales ($ billions)
Annual Canadian Shopping Centre Sales ($ billions)
Retail Trends
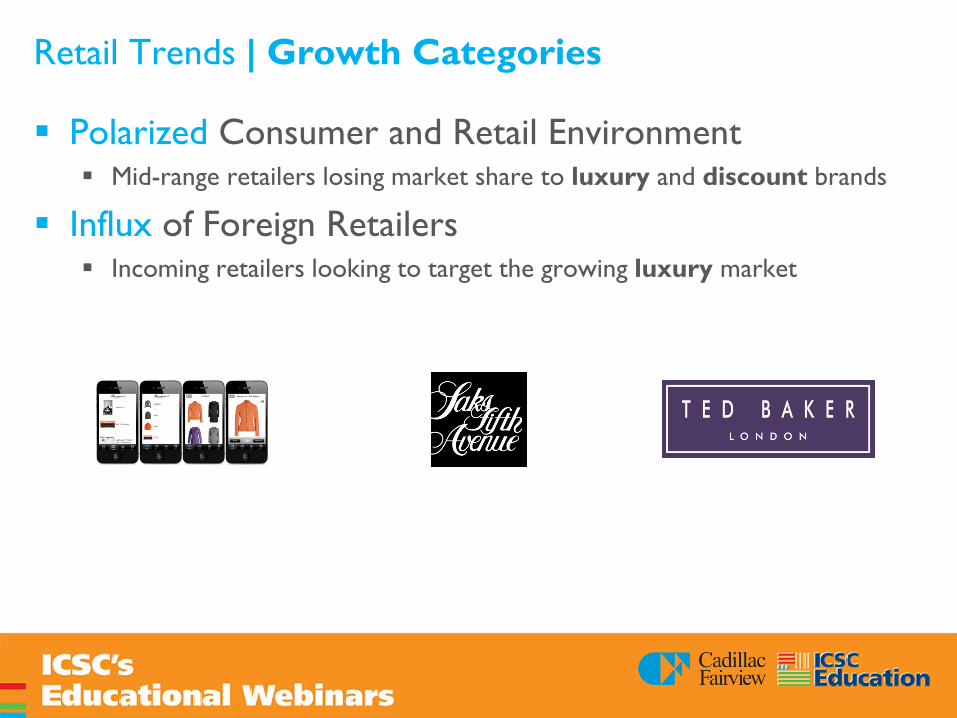
Polarized Consumer and Retail Environment Mid-range retailers losing market share to luxury and discount brands
Influx of Foreign Retailers Incoming retailers looking to target the growing luxury market
Retail Trends | Growth Categories
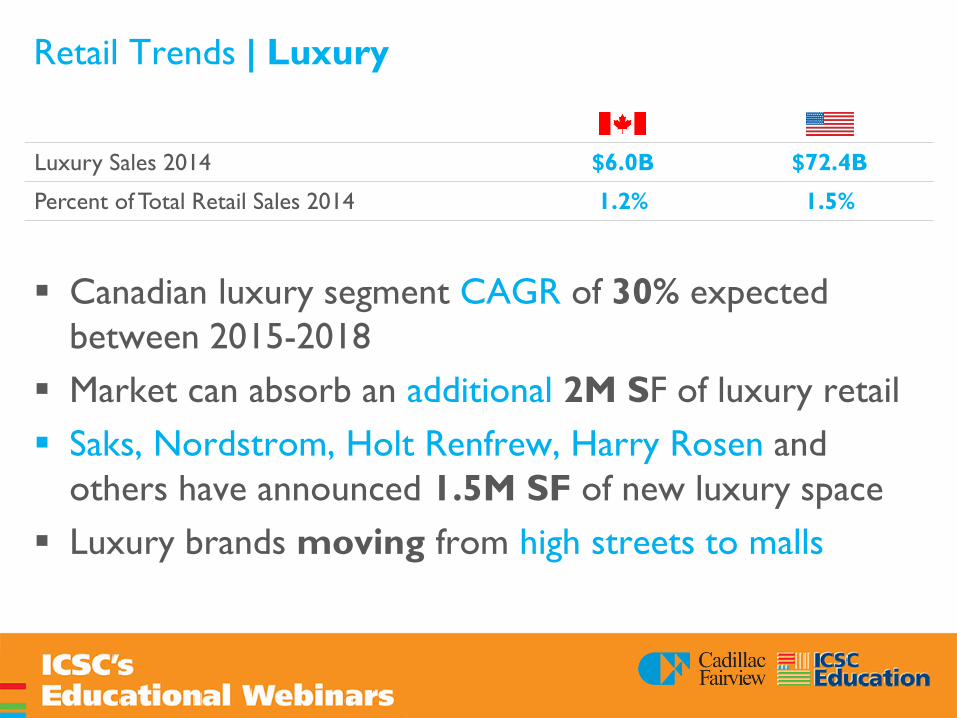
Retail Trends | Luxury
Canadian luxury segment CAGR of 30% expected between 2015-2018
Market can absorb an additional 2M SF of luxury retail Saks, Nordstrom, Holt Renfrew, Harry Rosen and
others have announced 1.5M SF of new luxury space Luxury brands moving from high streets to malls
Luxury Sales 2014 $6.0B $72.4B
Percent of Total Retail Sales 2014 1.2% 1.5%

Growth Markets
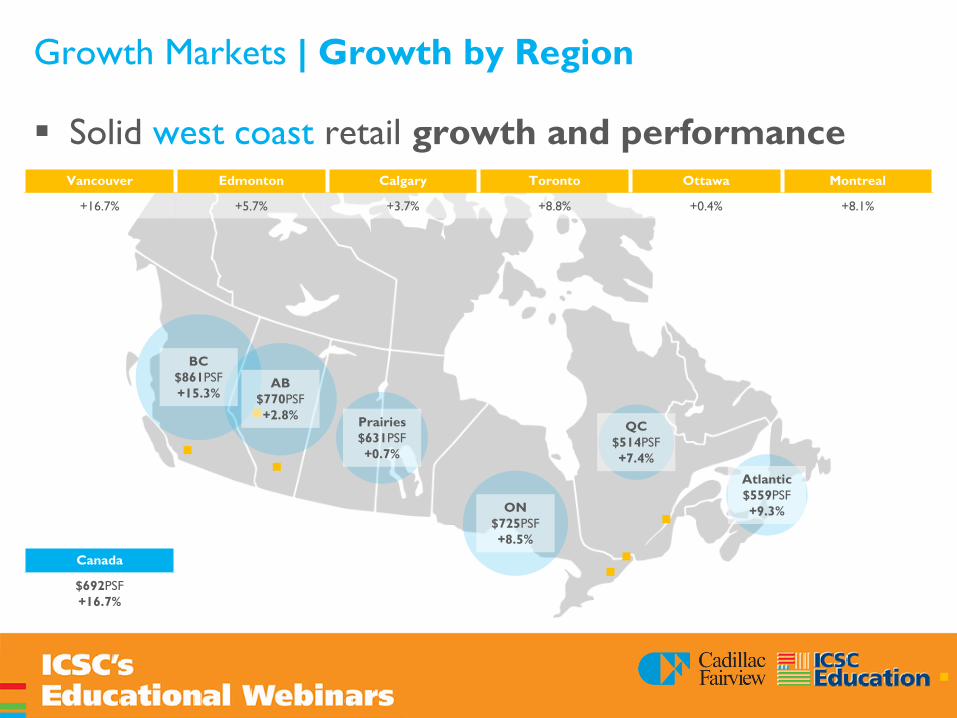
Growth Markets | Growth by Region
Solid west coast retail growth and performance
BC $861PSF +15.3%
Prairies $631PSF +0.7%
ON $725PSF +8.5%
QC $514PSF +7.4%
Atlantic $559PSF +9.3%
Vancouver Edmonton Calgary Toronto Ottawa Montreal
+16.7% +5.7% +3.7% +8.8% +0.4% +8.1%
AB $770PSF +2.8%
Canada
$692PSF +16.7%

Thank you. Questions?
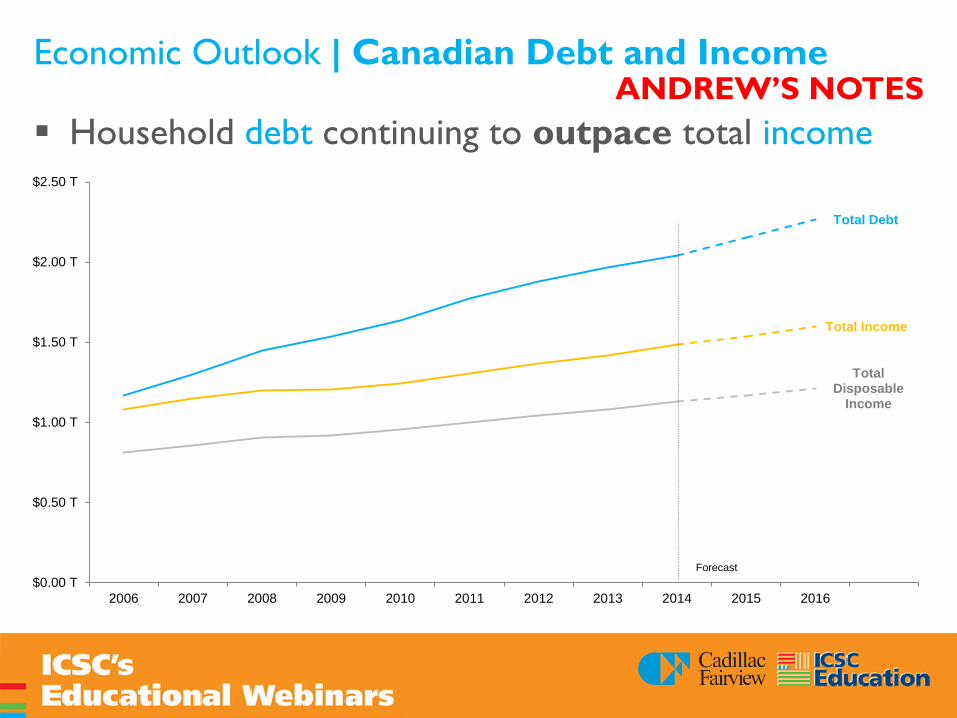
Economic Outlook | Canadian Debt and Income
Household debt continuing to outpace total income
Total Debt
Total Income
Total Disposable
Income
$0.00 T
$0.50 T
$1.00 T
$1.50 T
$2.00 T
$2.50 T
2006 2007 2008 2009 2010 2011 2012 2013 2014 2015 2016
Forecast
ANDREW’S NOTES
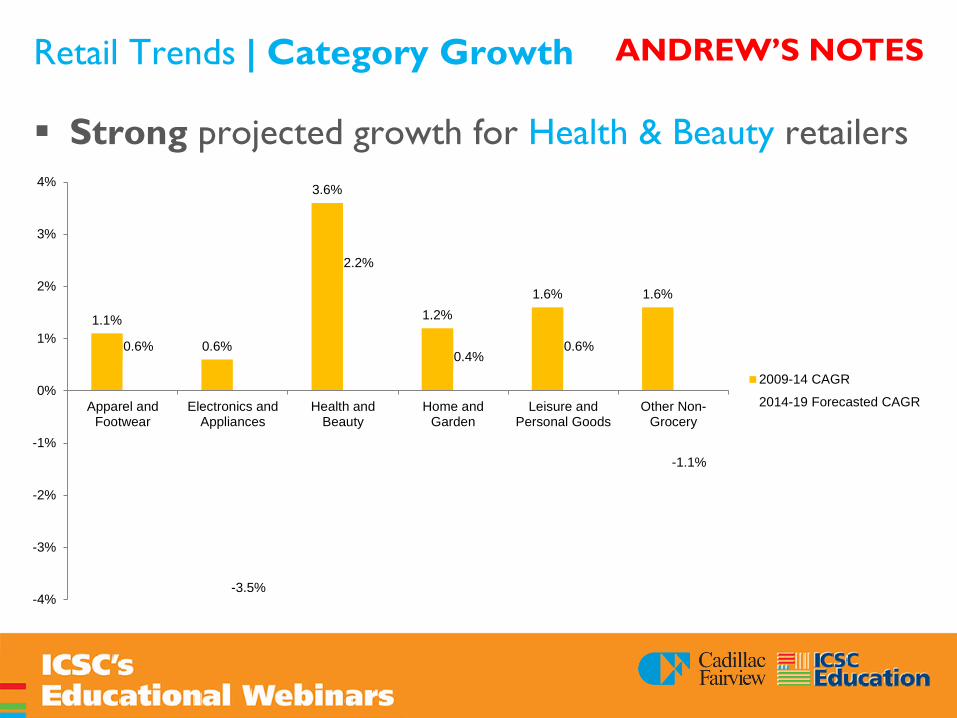
Retail Trends | Category Growth
Strong projected growth for Health & Beauty retailers
1.1%
0.6%
3.6%
1.2% 1.6% 1.6%
0.6%
-3.5%
2.2%
0.4% 0.6%
-1.1%
-4%
-3%
-2%
-1%
0%
1%
2%
3%
4%
Apparel andFootwear
Electronics andAppliances
Health andBeauty
Home andGarden
Leisure andPersonal Goods
Other Non-Grocery
2009-14 CAGR
2014-19 Forecasted CAGR
ANDREW’S NOTES
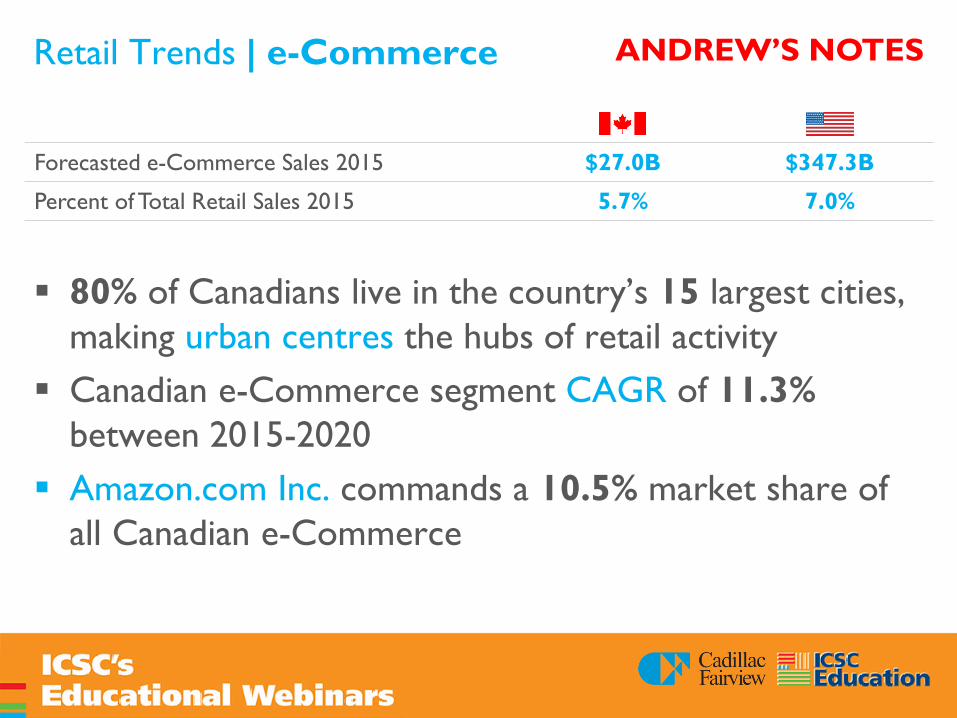
Retail Trends | e-Commerce
80% of Canadians live in the country’s 15 largest cities, making urban centres the hubs of retail activity
Canadian e-Commerce segment CAGR of 11.3% between 2015-2020
Amazon.com Inc. commands a 10.5% market share of all Canadian e-Commerce
Forecasted e-Commerce Sales 2015 $27.0B $347.3B
Percent of Total Retail Sales 2015 5.7% 7.0%
ANDREW’S NOTES
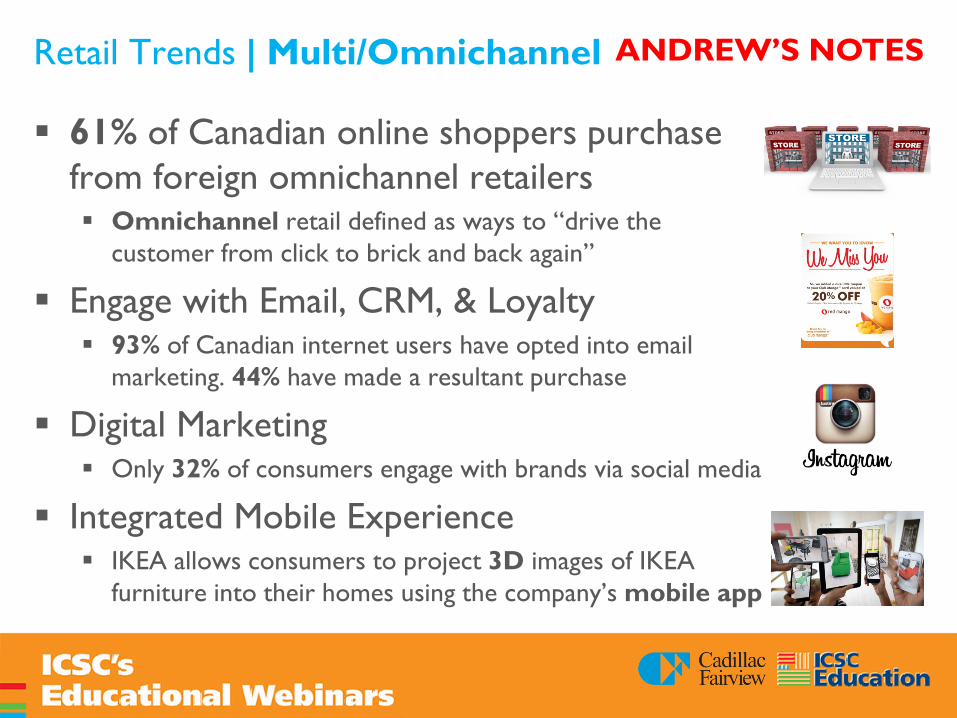
Retail Trends | Multi/Omnichannel
61% of Canadian online shoppers purchase from foreign omnichannel retailers Omnichannel retail defined as ways to “drive the
customer from click to brick and back again”
Engage with Email, CRM, & Loyalty 93% of Canadian internet users have opted into email
marketing. 44% have made a resultant purchase
Digital Marketing Only 32% of consumers engage with brands via social media
Integrated Mobile Experience IKEA allows consumers to project 3D images of IKEA
furniture into their homes using the company’s mobile app
ANDREW’S NOTES

Growth Markets | Growth by Class Neighbourhood Regional Power Centre
NET RENT 6 MO. TREND
VACANCY RATE
6 MO. TREND NET RENT 6 MO.
TREND VACANCY
RATE 6 MO.
TREND NET RENT 6 MO. TREND
VACANCY RATE
6 MO. TREND
Victoria High $24 ↓ 4.5% ↑ $38 ↓ 6.3% ↑ $27 ↓ 1.6% ↑ Low $16 0.0% $30 0.0% $20 0.0%
Vancouver High $30 ↓ 10.0% ↑ $200 ↔ 7.0% ↔ $20 ↑ 3.0% ↔ Low $14 5.0% $28 3.0% $10 2.0%
Kelowna High $28 ↔ 15.0% ↑ $110 ↔ 10.0% ↑ $30 ↓ 5.0% ↑ Low $22 5.0% $50 5.0% $20 0.0%
Calgary High $32 ↔ 1.5% ↔ $200 ↔ 2.0% ↔ $80 ↑ 2.0% ↔ Low $24 1.5% $60 1.8% $35 1.0%
Edmonton High $35 ↔ 3.0% ↔ $35 ↔ 3.0% ↔ $40 ↔ 3.0% ↔ Low $22 1.0% $25 1.0% $25 1.0%
Saskatoon High $36 ↑ 5.0% ↔ $60 ↑ 25.0% ↑ $34 ↔ 3.0% ↔ Low $26 0.0% $38 5.0% $22 0.0%
Regina High $32 ↔ 3.5% ↔ $50 ↔ 4.0% ↔ $48 ↔ 2.0% ↔ Low $24 1.0% $30 0.0% $26 0.0%
Winnipeg High $32 ↔ 6.0% ↔ $100 ↑ 5.0% ↔ $35 ↔ 4.0% ↑ Low $20 2.0% $40 1.0% $22 0.0%
Toronto High $25 ↓ 8.0% ↔ $130 ↓ 3.0% ↔ $33 ↔ 4.0% ↑ Low $12 5.0% $25 1.0% $18 2.0%
Ottawa High $25 ↔ 10.0% ↔ $100 ↔ 10.0% ↔ $35 ↔ 10.0% ↔ Low $15 5.0% $50 0.0% $15 5.0%
Montreal High $15 ↔ 7.0% ↔ $18 ↔ 5.0% ↔ $20 ↔ 5.0% ↔ Low $10 5.0% $15 3.0% $17 3.0%
Halifax High $25 ↑ 8.0% ↔ $75 ↔ 1.3% ↓ $25 ↑ 3.7% ↑ Low $20 7.0% $70 1.0% $18 3.4%
ANDREW’S NOTES