ICP-5-8-CDMJI-f2 CDM Verification Report · PDF fileFax: +47 67 57 99 11 ... This report...
62
VERIFICATION REPORT DET NORSKE VERITAS VERIFICATION OF INTERIM REDD+ PERFORMANCE INDICATORS UNDER THE GUYANA-NORWAY REDD+ PARTNERSHIP Monitoring Period: 1 January 2012 to 31 December 2012 – Year 3 REPORT NO. 2013-1760 REVISION NO. 01
Transcript of ICP-5-8-CDMJI-f2 CDM Verification Report · PDF fileFax: +47 67 57 99 11 ... This report...

VERIFICATION REPORT
DET NORSKE VERITAS
VERIFICATION OF INTERIM
REDD+ PERFORMANCE
INDICATORS UNDER THE
GUYANA-NORWAY REDD+
PARTNERSHIP
Monitoring Period:
1 January 2012 to 31 December 2012 – Year 3
REPORT NO. 2013-1760 REVISION NO. 01

DET NORSKE VERITAS
VERIFICATION REPORT
Head Office: Veritasvn. 1, N-1322 HØVIK, Norway
DNV CLIMATE CHANGE
SERVICES AS
Veritasveien 1,
1322 HØVIK, Norway
Tel: +47 67 57 99 00
Fax: +47 67 57 99 11
http://www.dnv.com
Org. No: NO 994 774 352 MVA
Date of first issue: Project No.:
17 December 2013 PRJC-467680-2013-CCS-NOR Approved by Organisational unit:
Michael Lehmann Accredited Climate Change Services Client: Client ref.:
Ministry of Environment–
Government of Norway
Maarten van der Eynden
Summary:
DNV Climate Change Services AS (DNV) has been commissioned by the Ministry of
Environment– Government of Norway to perform a verification of the Interim Performance
Indicators reported for the period 1 January 2012 to 31 December 2012 – Year 3 as
described in the Guyana REDD+ Monitoring Reporting and Verification System (MRVS) -
Interim Measures Report, Version 3 dated 6 December 2013 produced by the Guyana
Forestry Commission – Government of Guyana.
This report provides the verification methodology, results and statement.
Report No.: Subject Group:
2013-1760 Environment Indexing terms
Report title: Key words Service Area
Verification of Interim REDD+
Performance indicators under the Guyana-
Norway REDD+ partnership
REDD+
Guyana
Norway
Interim Indicators
Verification
Verification
Market Sector
Forestry
Work carried out by:
Edwin Aalders, Ole Andreas Flagstad,
Vincent Schut
No distribution without permission
from the client or responsible
organisational unit
free distribution within DNV after 3
years
Strictly confidential
Unrestricted distribution
Work verified by:
Andrés B. Espejo
Date of this revision: Rev. No.:
Number of pages:
24 February 2014 01 33
© 2002 Det Norske Veritas AS
All rights reserved. This publication or parts thereof may not be reproduced or transmitted in any form or by any means,
including photocopying or recording, without the prior written consent of Det Norske Veritas AS.

DET NORSKE VERITAS
Report No: 2013-1760, rev. 01
VERIFICATION REPORT
Page i
Table of Content Page
DNV VERIFICATION STATEMENT ...................................................................................... I
1 INTRODUCTION ....................................................................................................... 1
2 BASIS OF VERIFICATION ....................................................................................... 1
2.1 Level of assurance 1
2.2 Objectives 2
2.3 Criteria 2
2.4 Scope 2
2.5 Materiality 3
3 METHODOLOGY ....................................................................................................... 4
3.1 Review of documentation 4
3.2 Site visit 5
3.3 Reporting of findings 5
4 VERIFICATION FINDINGS ...................................................................................... 6
4.1 Interim indicator 1.1 - Gross Deforestation 6
4.2 Interim indicator 2.1 - Verification of the Loss of intact forest landscapes 11
4.3 Interim indicator 2.2 - Verification of Forest Management 12
4.4 Interim indicator 2.3 - Carbon loss as indirect effect of new infrastructure 17
4.5 Interim indicator 2.4 – Emissons resulting from subsistence forestry, land
use and shifting cultivationlands (i.e. slahs and burn agriculture) 19
4.6 Interim indicator 2.5 - Emissions resulting from illegal logging activities 19
4.7 Interim indicator 2.6 - Emissions resulting from anthropogenically caused
forest fires 20
4.8 Interim indicator 3.1 – Encouragement of increasing carbon sink capacity of
non-forest and forest land 20
5 COMMENTS BY STAKEHOLDERS TO REPORT ............................................... 21
5.1 Received comments and response by the Guyana Forestry Commission 22
Appendix A Corrective action requests, clarification requests and forward action requests
Appendix B Curricula vitae of the verification team members
DET NORSKE VERITAS
Report No: 2013-1760, rev. 01
VERIFICATION REPORT
Page i
DNV VERIFICATION STATEMENT
Verification Objective
DNV Climate Change Services AS (DNV) has been commissioned by the Norwegian Ministry of
Environment* to perform a verification of the Interim Performance Indicators under the Guyana-
Norway partnership on REDD+ as reported in the Interim Measures Report†
Verification Scope
The relevant list of indicators for this verification is found from the most recent version of the Joint
Concept Note (31 March 2011). The scope of this verification covers the following deforestation and
degradation indicators.
Report Measure Measure Ref Indicator
Deforestation
Indicators
1 Indicator 1: Gross Deforestation rate
Degradation
Indicators
2 Indicator 2.1: Loss of intact forest landscapes
3 Indicator 2.2: Forest Management (i.e. selective logging
activities in natural or semi natural forests
2b Indicator 2.3: Carbon loss as indirect effect of new
infrastructure.
4 Indicator 2.5: Emissions resulting from illegal logging
activities.
5 Indicator 2.6: Emissions resulting from anthropogenic
forest fires.
For this monitoring period there are a few indicators that are not relevant and therefore have not been
considered. These are:
Degradation
Indicators
6 Indicator 2.4: Emissions resulting from subsistence
forestry, land use and shifting cultivation
lands (i.e. slash and burn agriculture)
Indicator on
increased carbon
removals
7 Indicator 3.1: Encouragement of increasing carbon sink
capacity of non-forest and forest land
In addition, DNV has assessed if the changes in the methodology applied for the determination of each
Interim Performance Indicator in the previous verification period, particularly those obtained via
geographical analysis, follows good practices as defined by a number reference documents (see
below).
The geographical boundary of the verification is Guyana and the time period covered is
1 January 2012 to 31 December 2012 – Year 3.
* Contract and scope signed between The Norwegian Ministry of Environment and DNV on 10 January 2011 † Guyana REDD+ Monitoring Reporting and Verification System (MRVS) - Interim Measures Report, Guyana Forestry
Commission, 16 March 2011

DET NORSKE VERITAS
Report No: 2013-1760, rev. 01
VERIFICATION REPORT
Page ii
Materiality
No level of materiality has been fixed by the Norwegian Ministry of Environment for this verification
so any individual or aggregate errors, omissions and misrepresentations which result in discrepancies
have been considered as material and requested to be corrected. This does not include individual or
aggregate level of error associated with technical equipment (e.g. sensors) or remote sensing methods
(e.g. visual interpretation). However, for Indicator 1 – gross deforestation rate, this has been addressed
by an independent accuracy assessment.
Verification criteria
The following reference requirements have been considered during the verification by DNV:
Join Concept Note on REDD+ cooperation between Guyana and Norway, Section 3: REDD-plus
performance Indicators (dated 9 November 2009 and its amendment of March 2010 and March
2011).
GOFC-GOLD REDD Source Book (2012).
IPCC Guidelines for National Greenhouse Gas Inventories (2006) – Volume 4 Agriculture,
Forestry and Other Land Use.
Good Practice Guidance and Uncertainty Management in National Greenhouse Gas Inventories
(2000) – Chapter 4: Agriculture; Chapter 6:Quantifying; Chapter 8:Quality Assurance and Quality
Control.
Good Practice Guidance for Land Use, Land-Use Change and Forestry (2003).
Verification activities
The verification has been guided by the provisions of ISO 14064-3 (1 ed., 2006) that cover the
validation and verification of greenhouse gas assertions.
The verification took place from 01 October 2013 until 24 February 2014 and included desk reviews
of relevant documentation and datasets as listed in the verification report and an on-site assessment in
Guyana from 21 November 2013 to 26 November 2013.
As part of the verification, the results of the independent accuracy assessment included in the Interim
Measures Report dated 6 December 2013 were verified.
Conclusions
It is DNV‘s opinion that the results provided in the Interim Measures Report by Guyana Forestry
Commission dated 6 December 2013:
have been obtained applying methodologies in accordance with internationally accepted good
practices as defined by the verification criteria;
are free from omissions and misrepresentations that could lead to material misstatements.
Furthermore, recommendations for improvements in future monitoring periods are summarised as
Minor Corrective Action Requests (MINORs) or Observations. These MINORs and Observations are
listed in Appendix A of the Verification Report.

DET NORSKE VERITAS
Report No: 2013-1760, rev. 01
VERIFICATION REPORT
Page iii
DNV has verified that the values for the interim indicators in this monitoring period (1 January 2012
to 31 December 2012 – Year 3) are:
Measure
Ref
Indicator Year 3 results
1 Indicator 1: Gross Deforestation rate in Year 3 0.079%
2 Indicator 2.1: Loss of intact forest landscapes 7.60 million ha
2b Indicator 2.3: Carbon loss as indirect effect of new infrastructure. 1 963 ha
3 Indicator 2.2: Forest Management 2 159 151 tCO2
4 Indicator 2.5: Emissions resulting from illegal logging activities. 11 217 tCO2
5 Indicator 2.6: Emissions resulting from anthropogenic forest
fires.
208 ha/year
Statement Issuing date
24 February 2014
Edwin Aalders Michael Lehmann
Team Leader Managing Director
DNV Climate Change Services AS
-----END OF STATEMENT----

DET NORSKE VERITAS
Report No: 2013-1760, rev. 01
VERIFICATION REPORT
Page iv
Abbreviations
ALOS AVNIR2
Advanced Land Observing Satellite Advanced Visible and Near Infrared
Radiometer type 2
AVHRR Advanced Very High Resolution Radiometer
ASAR Phased Array Type C-band Synthetic Aperture Radar
CAR Corrective Action Request
CBERS China Brazil Earth Resource Satellite
CBM Cubic Meter
CH4 Methane
CL Clarification request
CO2 Carbon dioxide
CO2e Carbon dioxide equivalent
CoC Chain of Custody
DMC Disaster Monitoring Constellation
DNV Det Norske Veritas
DOS Dark Object Subtraction
EVI Enhanced Vegetation Index
FAR Forward Action Request
FIRMS Fire Information Resource Management System
GFC Guyana Forestry Commission
GHG Greenhouse gas(es)
GIS Geographic Information System
GOES Geostationary Operational Environmental Satellite
GOFC-GOLD Global Observation of Forest Cover - Global Observation of Land Dynamics
GPG Good Practice Guidelines
GWP Global Warming Potential
IFL Intact Forest Landscapes
IMR Interim Measures Report
INPE Instituto Nacional de Pesquisas Espaciais
IRS Indian Remote Sensing Satellite
JCN Joint Concept Note
MMU Minimum Mapping Unit
MODIS Moderate Resolution Imaging Spectroradiometer
MP Monitoring Plan
MRVS Monitoring Reporting and Verification System
P1 Benchmark Period 1 – from 1990 to 2000
P2 Benchmark Period 2 – from 2000 to 2005
P3 Benchmark Period 3 – from 2005 to 2009
PIF Pseudo Invariant Features
QA/QC Quality Assurance / Quality Control
REDD+ Reducing Emissions from Deforestation and Degradation
RP Responsible Party of the assertions - GFC
RSB REDD Sourcebook
SOP Standard Operating Procedures
SPOT Satellite Pour l'Observation de la Terre
TOR Terms of Reference

DET NORSKE VERITAS
Report No: 2013-1760, rev. 01
VERIFICATION REPORT
Page v
UNFCCC United Nations Climate Change Convention
USGS United States Geological Survey
VCS Verified Carbon Standard GHG programme
Year 2
Year 3
Second monitoring period from October 1, 2010 to December 31, 2011
Third monitoring period from January 1, 2012 to December 31, 2012

DET NORSKE VERITAS
Report No: 2013-1760, rev. 01
VERIFICATION REPORT
Page 1
1 INTRODUCTION
DNV Climate Change Services AS (DNV) has been contracted by the Ministry of
Environment– Government of Norway to perform a non-accredited Verification of Interim
REDD+ Performance indicators under the Guyana-Norway REDD+ partnership. According to
the Joint Concept Note (JCN) signed between both parties, these indicators will serve to
evaluate Guyana‘s performance regarding REDD+ until a MRV system is in place which will
serve to accurately monitor the emissions from deforestation /53/.
DNV has been tasked to verify the results in deforestation and forest degradation as measured
using the interim indicators established in the Joint Concept Note, specifically as outlined
below and as detailed in the JCN Table 2, pages 18-24 /53/:
Gross Deforestation in the period from 1 January 2012 to 31 December 2012 – Year 3;
Loss of intact forest landscapes;
Forest Management;
Carbon loss as indirect effect of new infrastructure;
Emissions resulting from illegal logging activities;
Emissions resulting from anthropogenically caused forest fires;
2 BASIS OF VERIFICATION
In order to verify the Interim Performance Indicators, DNV has followed the principles and
requirements for verifying GHG inventories and validating or verifying GHG projects defined
by ISO 14064-3 /20/. This standard has served as guidance for the definition of the
verification plan but it is important to note that this is not an accredited verification applying
ISO 14064-3.
2.1 Level of assurance
According to ISO 14064-3, the level of assurance is used to determine the depth of detail that
a verifier designs into their validation or verification plan to determine if there are any
material errors, omissions or misrepresentations /20/. There are two levels of assurance,
reasonable or limited. The level of assurance affects the relative degree of confidence the
Verification of Interim Performance Indicators – 2 STEP PROCESS
1. Validation of Methodology:
The methodology employed for the
determination of each Interim
Performance Indicator will be
validated against relevant Criteria.
2. Verification of results:
A verification that the approved
methodology has been applied
correctly and give consistent results
to those reported.
ISO 14064-Part 3: Specification with guidance for the validation and verification of
greenhouse gas assertions

DET NORSKE VERITAS
Report No: 2013-1760, rev. 01
VERIFICATION REPORT
Page 2
verifier requires in order to make a conclusion /20/ and the wording in the validation or
verification statements.
For a reasonable level of assurance, the validator or verifier provides a reasonable, but not
absolute, level of assurance that the responsible party's assertion is materially correct /20/.
A limited level assurance is distinguishable from a reasonable level assurance in that there is
less emphasis on detailed testing of data and information supplied to support the assertion
/20/.
The verification team has designed the verification plan in order to attain a reasonable level of
assurance in the verification of the Interim Performance Indicators.
2.2 Objectives
The objective of the verification is to provide stakeholders with a professional and
independent verification of the results reported in the Guyana REDD+ Monitoring Reporting
and Verification System (MRVS) - Interim Measures Report (Version 3 of 6 December 2013)
on deforestation and forest degradation as measured using the Interim Measures Indicators.
This includes:
- Methodology validation; conformance of the analysis methodology and the
monitoring system in place against applicable validation/verification criteria;
- Verification that the validated methodology has been followed to obtain the reported
results;
- Verification of the results of the Interim Performance Indicators reported in the IMR;
- Verification that the comments from stakeholders have been taken into account in the
IMR;
2.3 Criteria
According to the ISO14064-3 the validation/verification criteria would be the ―policy,
procedure or requirement used as a reference against which evidence is compared‖ /20/.
Therefore, the validation of the analysis methodology and the verification of the reported
results would be done against these criteria:
- Validation criteria
Main Criteria - Joint Concept Note (i.e. Section 3: REDD-plus performance
Indicators) /53/;
GOFC-GOLD REDD Source Book, 2012 /54/;
IPCC Good Practice Guidance /56//57//58/ and Guidelines /55/;
Approved REDD methodologies under the VCS programme /64/;
Peered reviewed publications /33//61/
2.4 Scope
According to ISO 14064-3, in determining the validation or verification scope, the validator
or verifier should consider the extent and boundaries of the validation or verification process
/20/. Taking into consideration the TOR of the assignment /59/ and the provisions of the JCN
/53/ the scope of the verification consists in the verification of the following deforestation and
degradation Interim Measures Indicators as described in the JCN /53/:

DET NORSKE VERITAS
Report No: 2013-1760, rev. 01
VERIFICATION REPORT
Page 3
Report Measure Measure Ref Indicator
Deforestation
Indicators
1 Indicator 1: Gross Deforestation rate
Degradation
Indicators
2 Indicator 2.1: Loss of intact forest landscapes
3 Indicator 2.2: Forest Management (i.e. selective logging
activities in natural or semi natural forests
2b Indicator 2.3: Carbon loss as indirect effect of new
infrastructure.
4 Indicator 2.5: Emissions resulting from illegal logging
activities.
5 Indicator 2.6: Emissions resulting from anthropogenic
forest fires.
Furthermore the specific verification scope for these indicators is:
- Geographical boundaries: Guyana
- Organizational boundaries: Guyana Forestry Commission (GFC)
- Physical infrastructure, activities, technologies and processes of the organization: GFC
Geographic Information System and Wood Chain of Custody System.
- Time period(s) to be covered:
o Monitoring period: Year 3 (1 January 2012 to 31 December 2012)
- Frequency of subsequent verification processes: Yearly verification
- Intended user for the verification statement: Government of Norway and Government of
Guyana
2.5 Materiality
According to ISO 14064-3 materiality is the ―concept that individual or the aggregation of
errors, omissions and misrepresentations could affect the assertion and could influence the
intended users decisions‖ /59/. The concept of materiality is used when designing the
validation or verification and sampling plans to determine the type of substantive processes
used to minimize risk that the verifier will not detect a material discrepancy /59/.
In order to be consistent with the stated level of assurance, a verification plan and an intensive
sampling plan have been designed to minimize risks that a material discrepancy would not be
detected.
No level of materiality has been fixed so any individual or aggregate errors, omissions and
misrepresentations that can be quantified which result in discrepancies have been considered
as material and requested to be corrected. This does not include individual or aggregate level
of error associated with technical equipment (e.g. sensors) or remote sensing methods (e.g.
visual interpretation). However, for Indicator 1 – gross deforestation rate, this has been
addressed by the independent accuracy assessment /18/.
DET NORSKE VERITAS
Report No: 2013-1760, rev. 01
VERIFICATION REPORT
Page 4
3 METHODOLOGY
The verification of the results has assessed all factors and issues that constitute the basis for
the interim measures indicator‘s results. These include:
i) Guyana REDD+ Monitoring Reporting and Verification System (MRVS) - Interim
Measures Report /1/;
ii) Geo-database with all the raw and processed datasets /2/;
iii) Database of wood harvesting declarations of wood extraction activities in lands
classified as State Forest /5/;
iv) Database of wood harvesting declarations of wood extraction activities in lands
classified as Amerindian or Private Property /6/;
v) Database of Procedural Breaches for the four forestry divisions of Bce, Dem, Ess and
Nwd /4/;
vi) Database of Illegal logging activities for the four forestry divisions of Bce, Dem, Ess
and Nwd /3/;
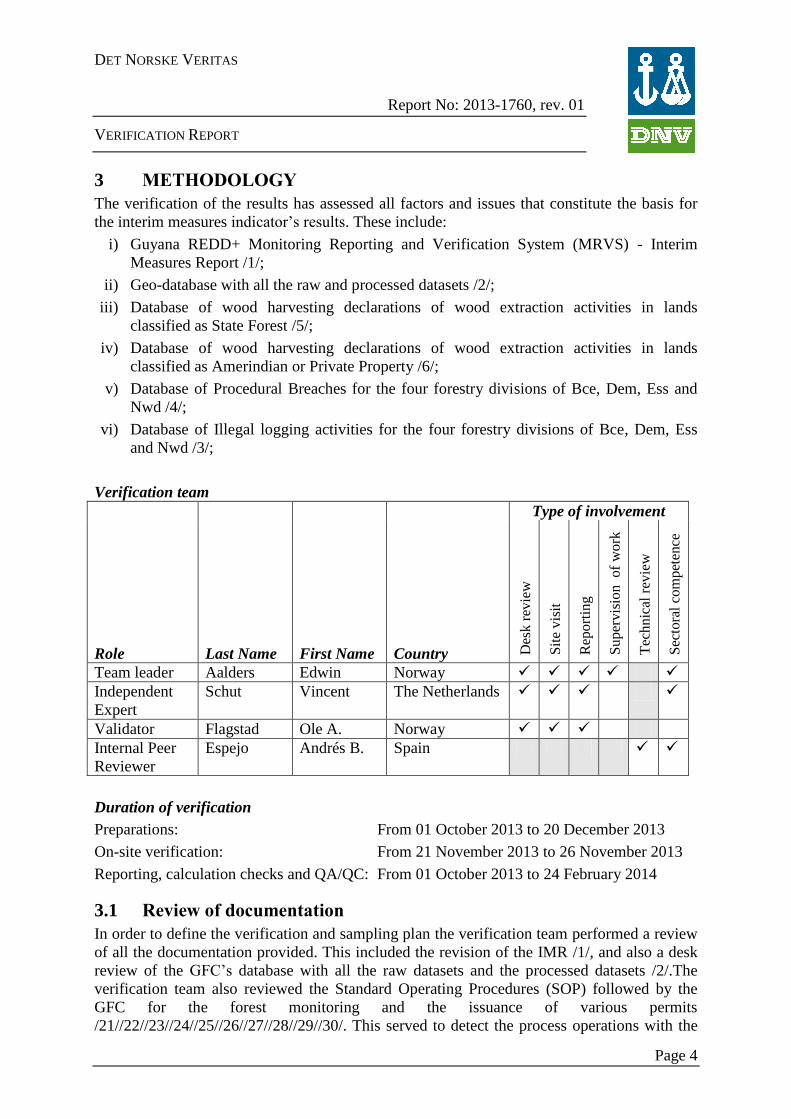
Verification team
Role Last Name First Name Country
Type of involvement D
esk
rev
iew
Sit
e vis
it
Rep
ort
ing
Super
vis
ion
of
work
Tec
hnic
al r
evie
w
Sec
tora
l co
mpet
ence
Team leader Aalders Edwin Norway
Independent
Expert
Schut Vincent The Netherlands
Validator Flagstad Ole A. Norway
Internal Peer
Reviewer
Espejo Andrés B. Spain
Duration of verification
Preparations: From 01 October 2013 to 20 December 2013
On-site verification: From 21 November 2013 to 26 November 2013
Reporting, calculation checks and QA/QC: From 01 October 2013 to 24 February 2014
3.1 Review of documentation
In order to define the verification and sampling plan the verification team performed a review
of all the documentation provided. This included the revision of the IMR /1/, and also a desk
review of the GFC‘s database with all the raw datasets and the processed datasets /2/.The
verification team also reviewed the Standard Operating Procedures (SOP) followed by the
GFC for the forest monitoring and the issuance of various permits
/21//22//23//24//25//26//27//28//29//30/. This served to detect the process operations with the

DET NORSKE VERITAS
Report No: 2013-1760, rev. 01
VERIFICATION REPORT
Page 5
highest levels of risk of material discrepancy, and to consequently design the verification and
sampling plan on the basis of this information.
3.2 Site visit
An on-site assessment was performed from 21 November 2013 to 26 November 2013; partly
in GFC‘s main headquarters located in Georgetown, and partly in GFC‘s forest stations of
Linden, Bamboo Landing and the base camp of Variety Woods and mining areas around Port
Kaituma/Matthews Ridge.
After the definition of the final verification and sampling plan, the actual verification on-site
assessment was performed. During these days two different verification teams were created to
focus on specific indicators:
- Team 1 – remote sensing and GIS: This team carried out the verification of the Indicators
1, 2.1, 2.3, 2.5 and 2.6. This verification took place in GFC‘s GIS office and by on-site
verification in the area around Port Kaituma/Matthews Ridge.
- Team 2 – forest management and illegal logging: This team carried out the verification of
Indicators 2.2, 2.5 and 2.6. A verification of GFC‘s databases was carried out on the last
day of the audit, and which was supported by a field visit to GFC‘s forest stations and
was carried out in the forest concession in and around Variety Woods, Linden station to
allow cross-checking of information.
On 26 November 2013 a closing meeting with a preliminary reporting of the findings of the
verification took place in the GFC‘s headquarters.
3.3 Reporting of findings A major corrective action request (MAJOR) is issued, where:
i. the evidence provided to prove conformity is insufficient;
ii. mistakes have been made in applying assumptions, data or calculations which could
have a material influence on the results;
iii. non-compliance with relevant criteria;
A minor corrective action request (MINOR) is issued where: i. the evidence provided to prove conformity is insufficient but does not lead to
breakdown in the systems delivery;
ii. mistakes have been made in applying assumptions, data or calculations which could
have an influence on the future results;
iii. if a certain aspect has to be verified in the next verification event (e.g. foreseen
modifications, etc.)
An observation shall be raised by the team as a team‘s recommendation in relation to future
improvements of the analysis process or the monitoring of the interim measures indicators.
During the audit the team can also raise a clarification request (CL) when it has found that
information is insufficient or not clear enough to validate or verify against applicable criteria.
The results are discussed in Chapter 4 and findings are listed in Annex A.

DET NORSKE VERITAS
Report No: 2013-1760, rev. 01
VERIFICATION REPORT
Page 6
4 VERIFICATION FINDINGS
4.1 Interim indicator 1.1 - Gross Deforestation
4.1.1 Methodology validation
a Methodology description
While the Year 1 method relied completely on Landsat images, and the Year 2 method had
partial coverage with 5m resolution RapidEye and still relied on 30m Landsat for the rest of
the country, for Year 3 RP has acquired full coverage of RapidEye images for entire Guyana,
with multiple acquisitions for most of the country. In total, 1380 RapidEye datasets were
downloaded and processed, with imaging dates ranging from August to December 2012. This
effectively finishes the transition from 30m Landsat to 5m RapidEye as base imagery for
mapping that was started in Year 2. As the Year 2 mapping based on RapidEye appeared very
accurate, this is seen as a welcome improvement by the audit team. It will further reduce the
dependency on Landsat and improve mapping accuracy, both spatial and with regard to the
ability to directly map forest degradation. Additionally, full Landsat coverage was
downloaded and pre-processed by RP to account for areas with persistent cloud cover on all
available RapidEye datasets.
Noteworthy is also the agreement that has been made between RP and RapidEye that
RapidEye will use the Ground Control Points created in Year 3 by RP for coregistration of the
original RapidEye data. This means that the labour intensive work of cooregistration will be
done by RapidEye in Year 4.
RP has also used this much better dataset to take the opportunity to improve their forest/non-
forest base layer (till now based on Landsat), by revisiting areas of doubt, building on the
assumption that areas that are natural mature forest on the Year 3 RapidEye images should be
forest in the forest/non-forest base layer. Areas of forest which were missing in the base layer,
possibly due to cloud cover, or areas which were delineated badly, were updated according to
the new RapidEye images.
Ancillary FIRMS (MODIS) fire hotspot data were acquired and used to aid in the
classification of areas deforested due to fires.
DNV has observed that the Year 3 processing and mapping essentially builds on the methods
developed for Year 2 and can be summarized by the following steps: 1) pre-processing of
RapidEye data; 2) generating EVI based change polygons; 3) manually digitizing forest
change and degradation:
1) In order to improve the geocorrection process, RapidEye data was delivered as level 1A
image swaths to GFC. Those were co-registered to the general Geocover 2005 base layer,
using ground control reference points. The same points can be used to different
acquisitions of the same swath, and RP has made an agreement with RapidEye to supply
their ground control points, which will then be used by RapidEye to apply the
geocorrection for Year 4 acquisitions. Therefore, in Year 3 this was a relatively labour
intensive process for GFC. It is envisaged that RapidEye will use these ground control
points as a reference and deliver fully co-registered geocorrected data to GFC. After
geocorrection, the RapidEye swaths were cut into squares of manageable size to allow for
easier further handling.

DET NORSKE VERITAS
Report No: 2013-1760, rev. 01
VERIFICATION REPORT
Page 7
2) Next step in the processing was radiometric normalization by Dark Object Subtraction
(DOS) and calculating reflectance values from the raw data values. Then the EVI was
calculated. To create a non-forest delineation from the EVI image, the EVI image is
‗thresholded‘, starting with a default value which is then adapted to local scene conditions
(e.g. vegetation composition, soil moisture content, shadow) by visual and numerical
inspection and comparison of the result and the original DOS-corrected image while
checking both forest and non-forest areas and their border. This is possible because in
Guyana there is, in general, little to no gradual change from forest to non-forest in
deforested areas; the change is normally very sudden. The higher and enhanced resolution
of RapidEye in comparison to the Landsat images allows for an accurate delineation of the
boundaries between forest and non-forest areas.
3) Once a suitable EVI threshold has been found, the threshold is applied to generate a non-
forest image. Then the non-forest areas are filtered (using a clump-and-sieve filter) to get
rid of most of the single-pixel noise and polygons are generated from the filtered areas.
The resulting polygons are cleaned manually from influence of cloud, shadow, and
ultimately intersected with the Year 2 forest map to get only the Year 3 forest change.
The resulting intermediate images from each processing, step and the EVI threshold value
used are saved for later reference.
A persistent cloud map is generated with the areas that are cloudy in all available images. For
these areas, if possible, alternative imagery is used (preferably Landsat), even though the
much lower resolution does not allow for a detailed mapping in these areas. When recent
over-flight photos were available, these were used as an additional mapping source. Because
for Year 3 for almost all areas three RapidEye images were available, the total percentage of
persistent cloud was lowered from almost 3% in Year 2 to less than 1% in Year 3.
This finishes the pre-processing phase, which has largely been automated. From here on, the
mapping process starts, which is entirely manual..- The EVI based polygons go into the GIS
system, and a GIS operator visits these polygons one by one (in a 1 km x1 km block-wise
manner so as to structure the process). Then for each polygon, a visual inspection is done
using the original RapidEye image and if necessary other RapidEye images from other dates
and/or other imagery. If the polygon coincides indeed with a deforestation event and exceeds
the 1 ha MMU, the extent of the polygon is edited (if necessary). In order to establish the
changes over time, reference images from the other periods (e.g. P1, P2, P3, Year 1*) are
used, whereby the current landcover, the driver of the change, a reference to the image on
which the change was based and the last image in the database where the area was still forest
are entered and saved into the GIS database. As part of the quality control measures set up by
GFC, a toolbar has been developed to ease this process and ensure that all data is complete
and that no invalid combinations can be entered. After all polygons in the block have been
inspected, the block is inspected for changes that the EVI threshold might have missed. Areas
that are identified as being missed areas of deforestation and that exceed the MMU threshold
are consequently mapped and included in the GIS database.
Finally, before the operator visits the next block, a degradation analysis is done for the newly
found areas with the block that represent a change, and older mining or infrastructure
* P1=1990-1999, P2=2000-2005, P3=2005-2009 and Year 1=2009-2010. These periods are defined in Year 1 Verification
Report/63/

DET NORSKE VERITAS
Report No: 2013-1760, rev. 01
VERIFICATION REPORT
Page 8
deforestation polygons are revisited to check for possible new degradation around these
features. For this the same toolbar is being used.
When the GIS operator is finished with a block, it is saved in a standardized way into the
system and passed onto Quality Control. During QC the data in the database is checked for
inconsistencies, and the mapped polygons are checked visually for correctness. Errors are
corrected, and discussed with the relevant GIS operator.
DNV has verified this process with the mapping guide (Annex 9 of the report) /1/ and
confirms that the team operates in line with the guide. The system is set up to automate those
steps that can be automated, thereby minimizing risk of errors, and the mapping process itself
is structured by using a series of toolbars which guides the operator through the process and
performs basic checks to ensure that all data has been entered.
b Validation criteria and Indicators
Criteria noted in the JCN /53/ requires: 1) assessment of the rate of conversion of forest area
as compared to an agreed reference level; 2) forests are defined by Guyana in accordance with
the Marrakech accords; 3) conversion of natural forests to tree plantations shall count as
deforestation with full carbon loss; 4) forest area converted to new infrastructure, including
logging roads, shall count as deforestation with full carbon loss; 5) forest cover on 1 October
2010 will be used as a baseline for monitoring gross deforestation; 6) reporting is to be based
on medium resolution satellite imagery and in-situ observations where necessary; and, 7)
monitoring shall detect and report on expansion of human infrastructure (e.g. new roads,
settlements, pipelines, mining/agriculture activities etc.). The provisions made in the JCN /53/
were considered in the definition of the analysis methodology.
The verification team examined each area of the GIS and remote sensing methods used
against recommended and suggested actionable criteria in the guidance documents (JCN /53/,
GOFC-GOLD REDD Sourcebook /54/, and UNFCCC Good Practice Guidance (GPG) and
Guidelines (GL) /55//56//57//58/ to validate the methodology for measurement of gross
deforestation followed by the RP. Specific areas included: geometric correction, radiometric
normalization, cloud-masking, forest/non-forest assessment, and mapping quality control and
assessment. In addition an independent accuracy assessment has been performed by the
Durham University.
c Validation of methodology against criteria
Generation of deforestation datasets
RP follows a hybrid method of automated and manual mapping. Automated tasks are used for
procedures that are largely independent of local image circumstances, and manual processing
is used where automated processing would probably introduce errors due to inconsistencies in
image characteristics, which automation often has difficulties to deal with. The main reason
for using manual digitizing is the excess in cloud cover of the datasets which made it
practically impossible to use automated methods as recommended in the REDD sourcebook
/54/. However, the applied methods are in line with the REDD Sourcebook as they rely on
multi-date imagery and focusing on the forest change by updating forest cover maps of
previous epochs (pre-classification). Furthermore, the RP applied QA/QC measures through
the revisiting of 100% of the 10 km x 10 km grid cells used for aiding the visual interpretation
which has been verified as having reduced the human error /1/.

DET NORSKE VERITAS
Report No: 2013-1760, rev. 01
VERIFICATION REPORT
Page 9
Independent accuracy assessment
The verification team checked the methodology followed for this assessment /18/. According
to this document /18/, the accuracy assessment randomly-sampled forested and non-forested
locations using 5 km x 15 km grids stratified into regions of high and low risks of
deforestation based on inclusion of such risk-based criteria as logging camps, settlements of
greater than 1 000 persons, mining dredges or intersection with roads or trails using data made
available by the RP. New in Year 3 is the use of GeoVantage airborne multi-spectral data.
Main advantage is less dependency on the availability of Very High Resolution (VHR)
satellite data, as the GeoVantage system allows for custom planning of flying missions. The
GeoVantage imagery is also the reason for a switch from 10x10km to 5x15km grid size for
sampling, because these rectangular grids allow for more efficient flying path of the
GeoVantage plane. For a small part of the country, which was hard to fly with the
GeoVantage system, additional VHR satellite images were used. Within each sampled grid, a
systematic sample of points at regular 200 m intervals was created, yielding more than 300
points which also intersected with the acquired GeoVantage images per 5x15 grid block. Each
point was enlarged/buffered into 1 ha sample circles - to meet the MMU and was used for
direct manual assessment of cloud-free GeoVantage data. In all, a dataset of 55 119
(compared to 18 050 in Year 2) 1 ha sample circles were analyzed in a binary fashion to
assess the Year 3 deforestation map and using a confusion matrix to measure accuracies.
The methodology followed meet best practice guidelines in terms of sample design and
accounting for national conditions and capabilities /54/.
Conclusion
The verification team concluded that considerable progress is being made with the mapping
methodology by the transition to country wide coverage of RapidEye images .The verification
team also concludes that the analysis methodology used by the RP meets the applicable
criteria, defined by the JCN /53/, GOFC-GOLD REDD Sourcebook /54/, and UNFCCC Good
Practice Guidance (GPG) and Guidelines (GL) /55//56//57//58/. The verification team also
concludes that the use of the GeoVantage system to create airborne very high resolution
images for the accuracy assessment is a clear improvement over the use of available very high
resolution satellite images, and allows for a much higher sample size and more accurate
interpretation.
4.1.2 Verification of Indicator
Image processing
Radiometric normalization technique used the Dark Object Subtraction (DOS)/1/. Cloud-
shadow masking methods used ‗thresholding‘ in the blue band and additional manual
inspection. These methods are adequate and in line with the REDD Sourcebook /54/. Least
cloud cover RapidEye input images were selected and geometric correction of images was
considered adequate. An examination of a selection of the input satellite scenes demonstrated
that the RP had produced products meeting the 1 pixel accuracy, as suggested by guidance
materials, for all periods.
Analysis methods
Deforestation in Year 3: Deforestation in Year 2 was obtained through visual interpretation of
RapidEye images, guided by automated delineation of non-forest features. Taking into
account the fact that the same procedure was used for Year 2, but now with full coverage, and
that an independent accuracy report /18/ has been produced confirming the accuracy of the

DET NORSKE VERITAS
Report No: 2013-1760, rev. 01
VERIFICATION REPORT
Page 10
mapping of RP, verification focused on conformance between the SOP (in this case: the
mapping guide) and the actual mapping process. The verification team had the operators
demonstrate the entire process for several different areas, and found that the operators
followed the SOP. The verification team interviewed the operators and found their level of
understanding of the processing and mapping tasks to be very good. It should be noted that
operators are all local persons (Guyanese) and GFC staff.
An Excel sheet was developed for Year 3 to aid in the conversion from the GIS mapping
output to the final figures on the indicators. The verification team has inspected this sheet and
cross-checked the calculations, which were found to be correct. One inconsistency was found,
which led to the issuance of CAR 1, due to not using the ―Adopted Reference Measure‖ to
calculate the final figures.
Accuracy assessment
The verification team checked the results of the independent accuracy assessment performed
by the University of Durham /18/ and provided by the RP. According to this assessment the
overall accuracy of the Year 3 deforestation mapping is equal to 99.76%, which exceeds the
minimum accuracy acceptable for the mapping according to the REDD sourcebook /54/ and
other applicable criteria /64/. The verification team has verified the results of the accuracy
assessment by having the validation process demonstrated and checked for 1 validation tile.
Also, the excel sheets used to calculate the final accuracy values were inspected and found to
be correct.
Conclusion
Taking into consideration all the findings obtained with the verification and sampling plan
applied as stated above, and the final results provided for the independent accuracy
assessment, the verification team considers that the validated methodology has been followed
correctly and that reported results are free from omissions and misrepresentations that could
lead to material misstatements.
The verification confirms the gross deforestation rate in Year 3 is 0.079%.

DET NORSKE VERITAS
Report No: 2013-1760, rev. 01
VERIFICATION REPORT
Page 11
4.2 Interim indicator 2.1 - Verification of the Loss of intact forest
landscapes
4.2.1 Methodology validation
a Methodology description
The methodology followed by the RP to prepare the Year 1 intact forest landscape (IFL) layer
uses the existing global IFL GIS layer as a starting point and then buffers various P1, P2, P3,
Year 1, Year 2 and Year 3 land use layers and excludes them /61/. Layers buffered and
excluded are water bodies (including navigable rivers and shorelines), settlements and
municipalities, agricultural concessions, and deforested areas. The deforested areas had been
pre-selected to contain forestry roads, infrastructure roads, mining, and/or mining roads /61/.
Forestry concessions were also extracted and are considered as logging at an industrial scale,
though at low intensity. Once the deforested areas have been removed, the polygons allowed
to remain in the resulting GIS layer will be larger than 50 000 hectares and capable of
enclosing a circular object of 10 km radius. An assessment is made to ensure that at least a
2 km wide corridors or appendages are observed to and from areas meeting the applicability
conditions. All of the buffering, exclusion, areal calculation, and area-based selection are
performed using ArcGIS v.10 modeling code /61/. Final identification of polygons meeting
suitable width criteria is performed manually. Furthermore, in order to refine the IFL map,
cleanup of island polygons which would fail either the 10 km size or 2 km width test was
performed.
The RP has included this operation in their procedures, though still as a manual post-
processing operation. Given the fact that this operation involves only 9 large and non-
complex polygons, the manual character of the operation is not deemed a problem.
b Validation criteria and Indicators
Criteria used to validate this landscape methodology included the existence of appropriate
input data layers, and defined prerequisite processes for estimation (buffering and exclusion
from the input layers) were sourced from Potapov et al. (2008) /62/, as referred by JCN /53/.
The JCN specifically states that ―the total area of intact forest landscapes within the country
should remain constant. Any loss of intact forest landscapes shall be accounted as
deforestation with full carbon loss‖. Potapov et al. also suggests that monitoring and
estimation should use similar methods as for forest area change estimation. A footnote defines
IFL ―as a territory within today’s global extent of forest cover which contains forest and non-
forest ecosystems minimally influenced by human economic activity, with an area of at least
500 km2 (50 000 ha) and a minimal width of 10 km (measured as the diameter of a circle that
is entirely inscribed within the boundaries of the territory).‖ Potapov et al. /62/ had an
additional size criteria stating that corridors or appendages to areas that meet the
aforementioned spatial conditions must be at least 2 km wide.
Potapov et al. /62/ did their seminal work with a historical series of Landsat images, and
wrote that construction of the IFL layer should start with the study area and then
systematically identify and eliminate locations of human development. The specific areas of
human influence that should be eliminated are: 1) settlements; 2) infrastructure used for
transportation between settlements or for industrial development of natural resources,
including roads (except unpaved trails), railways, navigable waterways (including seashore),
pipelines, and power transmission lines; 3) areas used for agriculture and timber production;

DET NORSKE VERITAS
Report No: 2013-1760, rev. 01
VERIFICATION REPORT
Page 12
and 4) areas affected by industrial activities during the last 30-70 years, such as logging,
mining, oil and gas exploration and extraction, peat extraction, etc. /62/. Buffers of 1 km were
applied to settlements and transportation infrastructure. Burned areas from forest fires causing
stand-replacing wildfires in the vicinity of infrastructure or developed areas should be
eliminated.
c Validation of methodology against criteria
During the Year 2 verification the IFL value had been recalibrated by GFC to exclude all the
land under mining licenses regardless whether the license holder already commenced mining
or not. Following the Initial Comments of the Norwegian Government and the findings of
Year 2 verification the JCN valid for the Year 3 audit required the GFC to revert back to the
original IFL area calculation, which resulted that the Year 2 and Year 3 values are calculated
in the same manner as during the year 1 Interim Report /65/. The verification team concludes
that the analysis methodology used by the RP meets the definition and concept of Intact
Forest Landscape /63/ and is in line with the recommendations of Potapov et al. /62/.
4.2.2 Verification of Indicator
The methodology of verification used by the verification team examined the existing GIS
layers; spatial modeling code used by the RP, and output layers and had the operator
demonstrate the procedure step by step.
The verification team concludes that the calculation of IFL is correct and, that the corrected
benchmarks IFL figure for year 3 is 7.60 million ha. In Year 3 there was a loss in IFL area of
174 ha, with 101 ha of that being accounted for by newly entitled Amerindian land.
4.3 Interim indicator 2.2 - Verification of Forest Management
4.3.1 Methodology validation
a Methodology description
The RP has in place a forest monitoring system which has enforcement of forest legality
amongst its main objectives /9/. The monitoring system has four main components in place:
- Forest Concession Monitoring: This part of the monitoring system consists of the
monitoring of the concessions from a legal point of view (i.e., permitting, payment of
royalties,…) and the strictness of the forest management activities performed by the
concessionaires;
- Monitoring of forest produce in transit: This is the Chain of Custody (CoC) system that
has been implemented in Guyana since the year 2000 /9/. This CoC system, of which the
Log Tracking System is a main part, has as the main objective to verify the origin of raw
material and to control the level of harvesting within State Forests/9/;
- Sawmills and Lumberyards monitoring: This component consists of the verification of
the legality of sawmills and Lumberyards and their operation /23/
- Exports: This component of the monitoring system seeks to control all exportations and
to check the legality of the produce to be exported /24/.
As in Year 1 and 2, all data used to calculate the Interim Indicator 3 for Year 3 is sourced
from the monitoring of the forest production transit component and the verification has
therefore concentrated on this.

DET NORSKE VERITAS
Report No: 2013-1760, rev. 01
VERIFICATION REPORT
Page 13
The existing CoC system is based on the traceability through the use of tags with a unique
identification code on each unit of produce (i.e. log, lumber, etc.) /19/. The CoC system starts
by the on-stand tagging of the forest produce (i.e. logs, lumber piles, poles and posts); once a
tree is felled, the stump and the bole are tagged with the same sequence of numbers. This tag
number provides a reference for the name of the operator and the geographic origin of the
forest produce within the forest estate. This is required for any forest operation regardless of
whether it is located in State Forest lands, Amerindian lands or private properties /19/.
The link between the tagging system and the produce information (e.g. origin, destination,
volume, type of produce) is done through the volume declarations included in the removal
permits.
The monitoring process of the extracted volumes varies depending on whether the operation:
- Takes place in a State Forest lands and is not a procedural breach;
- Takes place in the private properties / Amerindian lands and is not a procedural
breach;
- It is a procedural breach (i.e. State Forest lands or private properties / Amerindian
lands);
- It is illegal logging.
The forest monitoring has written procedures which are now in place, as DNV was able to
confirm.
State Forest lands
The monitoring process for extracted volume from State Forest Lands remains the same as
reported in Year 1 & 2 verification /65//66/. The operator has to request for the issuance of a
removal permit in any of the existing forest stations /19/ (Figure 3) before the logging
operations commence. The removal permit will be filled-out with the operator‘s details. Each
forest station records the issuance of the removal permit in specific books /38/. Once the
operator is ready to transport forest produce beyond their regularized boundaries, they are
required to complete the removal permit stating the date of removal, destination, vehicle type,
vehicle identification, name of driver/captain, specification of forest produce and associated
tags (tags must be listed according to species and product type), volume and total tags used
and any other relevant information /19/. As part of the QA/QC measures in place, the produce
transported and the correctness of the removal permit are checked by one or various GFC
strategically located check-points. This check is recorded in books stating the removal permit
license, the type of produce, volumes and date of when the removal permit and the produce
were checked. The issued removal permits are valid only for 30 days, and once the produce
has reached the destination, concessionaires would have to declare the volume to the nearest
forest station within 24 hours /19/. Every month, these removal permits are sent to the GFC‘s
headquarters to be recorded in a specific database. Specific QA/QC measures are in place to
assure that the recording errors are reduced to a minimum (i.e., by using formulae that check
the consistency of data, regular consistency checks, restricted access to the database, etc.).

DET NORSKE VERITAS
Report No: 2013-1760, rev. 01
VERIFICATION REPORT
Page 14
Figure 3. Monitoring process flow chart – State Forest Lands
Private Properties / Amerindian lands:
As in Year 1 & 2, the owner is not required to request a removal permit before the logging
commences, however they are required to have a removal permit filled-out once the produce
is to be transported outside the regular boundaries of the property (Figure 4). From that point
forward, the monitoring system is similar to that of the State Forest lands.
Rem. Perm with declared
volume
Issuance removal
permit
Logging operation –
tagging
Removal
Permit
Book
record
Removal Permit
filled-out Readytrans
Transportation
of produce
Control of removal
permit info.
Book
record
Forest station
Check point
Removal Permit stating
control
Arrival to
destination
Rem. per. inc.declared
volume
Monthly forwarding
to HQ
Input in
Data Base
Book
record
Data
Base
Forest station
GFC HQ

DET NORSKE VERITAS
Report No: 2013-1760, rev. 01
VERIFICATION REPORT
Page 15
Figure 4 Monitoring process flow chart - Private Properties / Amerindian lands
Procedural breach or an illegal logging breach
Just as in Year 1 & 2, in case the operator does not have a removal permit or a removal permit
has inconsistencies, the amount removed is recorded respectively in the Illegal Logging
Databases or in the Procedural Breaches Database /30/. Also, only in the case it is
demonstrated after investigation that a certain operation is not considered legal logging or a
procedural breach, the respective record is cancelled from this database and is added to the
State Forest or private property/Amerindian databases.
The reported results of the interim performance indicator for Year 3 are the total volume
extracted in tCO2 (expressed as CBM) obtained from all the removal permits (or estimations
by the authorities in case no removal permit is present) recorded in the four data bases: Forest
state lands; Amerindian and private properties; Illegal logging database; and Procedural
breaches database. In the case of Logs and Sawn-wood, values reported by the GFC officer
reporting the illegal activity are divided by 0.7852 and 0.5 respectively, as the declared
volume is not the real volume felled but the commercial volume extracted.
In 2011 & 2012, RP made progress towards developing a methodology and factors that relate
total carbon emissions from biomass damage due to logging activities (collateral damage) to
the volume of timber extracted. This has been achieved through a technical report by Winrock
International (S. Brown et al.) for the GFC: Collateral Damage and Wood Products from
Logging Practices in Guyana, December 2011 /7/ and Guyana FCMS Conversion Factor
Handbook – Revised October 2013 /13/. The methodology applies the logging damage factor
(0.98 tC/m3), wood density of commercially harvested timber (0.38 tC/m
3/gap), logging
infrastructure factor (skid trails, etc.) (34.11 tC/km) and the conversion factor for tC to tCO2
Re. Per. With
declared
volume
Issuance removal
permit
Logging operation –
tagging
Removal
Permit
Book
record
Removal Permit
filled-out
Ready trans
Transportation
of produce
Control of removal
permit info.
Book
record
Forest station
Check point
Re. Per. stating
control
Arrival to
destination
Re. Per. With declared
volume
Monthly forwarding
to HQ
Input in
Data Base
Book
record
Data
Base
Forest station
GFC HQ

DET NORSKE VERITAS
Report No: 2013-1760, rev. 01
VERIFICATION REPORT
Page 16
in the conversion of total volume in CBMs to tCO2, and also includes storage in long term
wood products /11/. Total carbon stock in long-term wood products was estimated from the
extracted biomass carbon using Winjum et al 1998 formula and the approach in the approved
VCS Module VMD0005- REDD Methodology Module: ―Estimation of carbon stocks in the
long-term wood products pool‖ which DNV cross-checked and confirmed. This computation
was based on all extracted wood biomass (including exports) captured by GFC‘s with the data
available of wood harvested for during 1 January 2012 and 31 December 2012 (i.e. Year 3).
b Validation criteria and Indicators
According to the Joint Concept Note (JCN) on REDD+ cooperation between Guyana and
Norway /53/ one of the degradation indicators deals with forest management (i.e. selective
logging) activities in natural or semi-natural forests:
- ―All areas under forest management should be rigorously monitored and activities
documented (i.e. concession activities, harvest estimates, timber imports/exports).‖
- ― Increases in total extracted volume (as compared to mean volume 2003 – 2008) will be
accounted as increased forest carbon emissions unless otherwise can be documented
using the gain-loss or stock difference methods as described by the IPCC for forests
remaining as forests. In addition to the harvested volume, an appropriate expansion
factor of 25% (applied to the hole population of trees under forest management, i.e.
harvested + remnant trees) shall be used to take account of carbon loss caused by
collateral damage, etc, unless it is document that this has already been reflected in the
recorded extracted volume.‖
According to the JCN, the way monitoring and estimation of the indicator shall be done is
through ―Data on extracted volumes is collected by the Forestry Commission. Independent
forest monitoring will act as an additional data source on forest management to complement
this information. Accounting of this indicator should be done in terms of carbon units referred
as close as possible to extraction of biomass from the above ground carbon pool. ‖ /53/.
In line with the findings during the first and second verification /65/ it is understood that this
would imply that the extracted volume makes reference to the total biomass removed from the
above-ground carbon pool, which is closer to giving a reference on the forest degradation than
the commercial volume harvested. Therefore, the methodology shall take this provision into
account.
c Validation of methodology against criteria
In order to validate the methodology followed and the monitoring system in place, the
verification team carried out a process-based assessment similar to Year 1 & 2. This involves
verification of each operation of the monitoring process: the data collection, QA/QC
procedures for data collection, intermediate data recording, and data recording in the main
data base, QA/QC procedures for data recording, reporting and QA/QC procedures for data
reporting. For each of these operations, the verification team checked the training of
personnel/31//32//35//38/ via interviews, which checked the GFC staff‘s knowledge of the
procedures in place. Furthermore, the verification team performed spot checks of removal
permits in order to verify the consistency of the information of each database, with the
information in the removal permit (or illegal logging forms) and with the records available at
the transit & forest stations (Linden (Transit station), Bamboo Landing (Forest station at

DET NORSKE VERITAS
Report No: 2013-1760, rev. 01
VERIFICATION REPORT
Page 17
Variety Woods Ltd) and the Forest station at Basecamp of Variety Woods Ltd were audited)
/32//42//43//44//50//52//51/.
The RP demonstrated the knowledge of the procedures in place, and no evidence was
identified that could lead to believe that the monitoring system is not robust. The staff was
well trained and during the audit showed great level of involvement and dedication to not only
implementing the procedures but also seeking changes to them when this would lead to an
overall improvement of the system. Since the last audit the RP has finalised and updated its
procedures based on the findings of the Year 2 verification /9//10//13//14//17//66/.
The preliminary data that has come out of the work that the GFC and Winrock has done show
high level of consistency and predictability on the level of damage and impacts per cubic
meter harvested. In addition to the effective implementation of these procedures GFC also
was able to demonstrate its overall commitment to environmental protection and stakeholder
consultation. During the visit to Variety Woods the audit team was able to verify how in
collaboration with the logging company GFC had implemented a protective zoning area
around the nesting area of a Harpy Eagle an endangered species native to Guyana.
The verification team concludes that the analysis methodology used by the RP meets
provisions of the JCN /53/.
4.3.2 Verification of Indicator
In order to verify the reported assertions of Indicator 3, the verification team performed the
following checks:
- Consolidation, calculation and reporting: Confirmation that the total reported in the
database is consistent with the figure reported in the IMR;
- Recording: Database records were randomly chosen and data was compared with the
hard copy documents;
- Collection: Hard copy records and books located in Linden (Transit station), Bamboo
Landing (Forest/Transit station at Variety Woods Ltd) and the Forest station at
Basecamp of Variety Woods Ltd forest stations were cross-checked against database
records.
- Calculation: DNV checked the database spread-sheets in the Forest Resources
Management Division‘s REDD Secretariat and can confirm that the calculations
embedded in the tool for estimating emissions and removals due to timber extraction
reflected those described in the IMR and the VCS Module VMD0005.
The verification team did not detect any discrepancy that the reported assertions on Interim
indicator 3 - Forest Management is equal to 2 195 151 tCO2.
4.4 Interim indicator 2.3 - Carbon loss as indirect effect of new
infrastructure
4.4.1 Methodology validation
a Methodology description
The Year 3 methodology to calculate the loss of carbon as an indirect effect of new
infrastructure was achieved through visual inspection and manual digitizing of degraded areas
visible in the RapidEye imagery, within a buffer of 100 m (but possibly extending outside of
this buffer) around new or existing mining areas and around roads related to mining, forestry,

DET NORSKE VERITAS
Report No: 2013-1760, rev. 01
VERIFICATION REPORT
Page 18
and infrastructure, but excluding existing deforested lands that intersected the degradation
buffer (such as those from roads and infrastructures built during P1, P2, P3 or Year 1 & 2) /1/.
b Validation criteria and Indicators
The main validation criteria is the JCN /53/ guidance document, as there are no other criteria
listed in other guidance materials specific to detecting degradation from establishment of
transportation infrastructure. Interpretation and mapping of new mining and roads related to
mining, forestry, and infrastructure use the same methodology and criteria for verification
found in the estimation of gross deforestation (see Section 4.1).
The JCN /53/ notes that the establishment of new infrastructure in forest areas often
contributes to forest carbon loss outside the areas directly affected by the constructions. ―It
calls for detection of degradation in a 100m buffer surrounding new infrastructure (incl.
mining sites, roads, pipelines, reservoirs etc.) As well as it applies a benchmark of a
degradation area of 4 368 ha. Any degradation above this benchmark for the years after year 2
will lead to a reduced compensation unless other emission factors can be documented through
the MRVS, these areas shall be accounted with a 50% annual carbon loss through forest
degradation.‖ Validation of methodology against criteria
RP has fully adopted the degradation mapping method agreed upon in the JCN. Degradation
is manually mapped using high-resolution images, starting within a buffer of 100 m from the
outside edge of existing infrastructure. The verification team has checked the degradation
mapping by the RP in the field by measuring degradation along 2 transects, starting from the
mining-forest border, one through an area mapped as degraded, and one outside the area
mapped as degraded. The team has found the degradation mapping to be consistent with the
situation in the field.
The verification team concludes that the analysis methodology used by the RP meets
provisions of the JCN /53/ and that the degradation mapping using RapidEye images is
accurate.
Accuracy assessment
Additionally, the verification team checked the final results of the independent accuracy
assessment performed by the University of Durham /18/ and provided by the RP. According
to this assessment the overall accuracy of the Year 3 degradation mapping would be equal to
99.69% (97.08% in Year 2), which would confirm the acceptable accuracy of the mapping
according to the REDD sourcebook /54/ and to other applicable criteria /63//64/. The
verification team has verified the results of the accuracy assessment by having the process
being demonstrated and checked for one (1) validation tile, and by inspecting the excel sheets
used to calculate the final accuracy values.
4.4.2 Verification of Indicator
The verification team has visually inspected several parts of the RapidEye imagery and visited
a mining area with degradation mapped next to the area, and has confirmed correspondence
between the situation in the field and the mapping by measuring degradation along 2
transects. As a result the verification team concludes that the Year 3 method of mapping
degradation is correct.
The verification team had the GIS operators re-map the degradation for several areas and
compared the results with the initial degradation polygons. Based on its findings the
verification team concludes that the mapping of degradation is done correctly.

DET NORSKE VERITAS
Report No: 2013-1760, rev. 01
VERIFICATION REPORT
Page 19
The verification team has interviewed the GIS operators about their understanding of the
degradation mapping method and concludes that the GIS operators are following their
procedures /15/ and understand the reasoning behind it.
As a result, the verification team concludes that the Year 3 method conforms to the JCN
requirements, and concludes that the value for indicator 2.3 for Year 3 is equal to 1 963 ha.
4.5 Interim indicator 2.4 – Emissons resulting from subsistence forestry,
land use and shifting cultivationlands (i.e. slahs and burn agriculture)
In line with the JCN /53/ this indicator is presently not monitored till the full MRV is in place.
4.6 Interim indicator 2.5 - Emissions resulting from illegal logging
activities
4.6.1 Methodology validation
a Methodology description
The monitoring of illegal logging is within the main objectives of the forest monitoring
system described in section 4.4.1.a, as the monitoring system serves to enforce legality. Cases
of illegal logging are found in the course of routine/impromptu operations performed by the
GFC staff, or through information of these occurrences by stakeholders. In the case where
investigation demonstrates that a certain operation is not considered illegal logging or a
procedural breach, the respective record is cancelled from the illegal logging database and is
added to the State Forest or private property/Amerindian databases.
b Validation criteria and Indicators
According to the Joint Concept Note (JCN) /53/ one of the degradation indicators has to cover
illegal logging activities:
- ―Illegal logging results in unsustainable use of forest resources while undermining
national and international climate change mitigation policies‖
- ―Areas and processes of illegal logging should be monitored and documented as far as
practicable‖
The JCN specifies the way the indicator has to be monitored and estimated: ―The monitoring
of illegal logging is within the main objectives of the GFC’s forest monitoring system, and is
informed by an illegal logging database. In addition to reporting on illegal logging via the
database, Independent Forest Monitoring will support performance monitoring of forest
legality through the IFM framework. Should IFM detect potentially significant challenges
with the established forest monitoring system, this indicator will be reassessed. In the
absence of hard data on volumes of illegally harvested wood, a default factor of 15% (as
compared to the legally harvested volume) will be used. This factor can be adjusted up- and
downwards depending on documentation on illegally harvested volumes, inter alia from
Independent Forest Monitoring‖. Furthermore, it states that another means of monitoring
should include ―Medium resolution satellite to be used for detecting human infrastructure
and targeted sampling of high-resolution satellite for selected sites, and Accounting of this
indicator should be done in terms of carbon units referred as close as possible to extraction
of biomass from the above ground carbon pool.‖.

DET NORSKE VERITAS
Report No: 2013-1760, rev. 01
VERIFICATION REPORT
Page 20
c Validation of methodology against criteria
The verification team concluded that the analysis methodology used by the RP meets the
requirements of JCN /53/, and if applied correctly it will lead to assertions with minimum
material discrepancies.
4.6.2 Verification of Indicator
In order to verify the reported assertions of Indicator 4 in Year 3, the verification team
performed the following checks:
- Consolidation, calculation and reporting: Confirmation that the total reported in the
database is consistent with the figure reported in the IMR;
- Recording: Database records were randomly chosen and data was compared with the
hard copy documents;
- Collection: Hard copy records in the Linden (Transit station), Bamboo Landing
(Forest/Transit station at Variety Woods Ltd) and the Forest station at Basecamp of
Variety Woods Ltd were checked with the database records;
The estimated emissions from illegal logging rate for Year 3 is equal to 11 217 tCO2.
4.7 Interim indicator 2.6 - Emissions resulting from anthropogenically
caused forest fires
4.7.1 Methodology validation
MODIS Fire Hotspot data (FIRMS) are being used by RP to indicate the location of
anthropogenic fires. High-resolution RapidEye data is being used to determine the extent of
the burnt areas. The detection of burnt areas has been integrated into the mapping procedures
for deforestation and degradation, where fire is one of the possible drivers for a deforestation
or degradation event. The combined use of high-resolution multispectral images with FIRMS
fire hotspot data is in accordance with the GOFC GOLD Sourcebook.
4.7.2 Verification of Indicator
The audit team has verified the correct operation of the GIS mapping team regarding mapping
the extent of deforestation and degradation and their drivers, including fire, and found their
mapping to be concise and consistent with their mapping SOP.
According to the reported assertions, the total burned area (degradation, not deforestation) in
the analysis period was 208 ha/year. While much higher than the figure from year 2 (28
ha/year), this is still considerably lower than the initially estimated total of 1 706 ha/year
/1//65/. Although Guyana has, during this monitoring period, seen a higher total number of ha
affected by burning most if not all observed fires occurred in non-forested & savanna areas.
The verification team confirmed that the figure of 208 ha/year is consistent with the
verification result.
4.8 Interim indicator 3.1 – Encouragement of increasing carbon sink
capacity of non-forest and forest land
In line with the JCN /53/ this indicator is presently not monitored till the full MRV is in place.

DET NORSKE VERITAS
Report No: 2013-1760, rev. 01
VERIFICATION REPORT
Page 21
5 COMMENTS BY STAKEHOLDERS TO REPORT
The Interim Measures Report was published for public comments from 16 October 2013 to 16
November 2013 in Guyana Forestry Commission‘s web page as well as distributed to a list of
63 individual stakeholders of 37 different stakeholder organisations. A Public Notice was
placed in the local media over the 4-week period. Comments received during this period are
given in the below text box. Response from the RP to these comments and the verification
team‘s assessment are included.
Table 1: list of Stakeholders consulted by the Guyana Forestry Commission
Name Agency Role Name Agency Role
1 His Excellency President
Donald Ramotar
Government of Guyana,
Office of the President
33 David Singh Conservation International
(CI)
2 Former President Dr.BharratJagdeo
Government of Guyana 34 Annette Arjoon-Martins Independent Member of Civil Society
3 Dr Roger Luncheon Office of the President 35 Joe Singh Individual Capacity
4 Minister Dr Ashni Singh Ministry of Finance 36 David James Individual Capacity
5 Minister Robert Persaud Ministry of Natural Resources and Environment
37 Charles Hutchinson World Wildlife Fund (WWF)
6 Minister Dr. Leslie
Ramsammy
Ministry of Agriculture 38 Kapil Mohabir Project management office, PO
7 Minister Pauline Sukhai Ministry of Amerindian Affairs
39 Derrick John National Toshaos Council (NTC)
8 ShyamNokta Office of the President 40 Nikolaus Oudkerk Project management office, PO
9 Andrew Bishop Office of the President 41 PreeyaRampersaud Office of Climate Change
10 Shereeda Yusuf Office of the President 42 Dane Gobin Iwokrama
11 James Singh Guyana Forestry Commission 43 Colin Sparman Guyana Gold & Diamond Miners Association
12 Pradeepa Bholanath Guyana Forestry Commission 44 Donald Singh Guyana Geology & Mines
Commission
13 IndarjitRamdass Environmental Protection
Agency
45 Geeta Singh Environmental Protection
Agency
14 George Jarvis Ministry of Agriculture 46 NaseemNasir Guyana Lands & Surveys
Commission
15 Peter Persaud The Amerindian Action Movement of Guyana
(TAAMOG)
47 Mohindra Chand Forest Producers Association
16 Romel Simon The National Amerindian Development Foundation
(NADF)
48 Gregory Hodge University of Guyana
17 Alfred King Ministry of Culture 49 Herold Martin GOFC-GOLD
18 HilbertusCort Forest Producers Association (FPA)
50 Sandra Brown Winrock International
19 Ronald Webster Private Sector Commission
(PSC)
51 Nancy Harris Winrock International
20 Carvil Duncan Federation of Independent Trade Unions of Guyana
(FITUG)
52 Silvia Petrova Winrock International
21 Hymawattie Lagan Women‘s Affairs Bureau 53 Felipe Casarim Winrock International

DET NORSKE VERITAS
Report No: 2013-1760, rev. 01
VERIFICATION REPORT
Page 22
Name Agency Role Name Agency Role
20 Raquel Thomas-Caesar Independent memeber 54 Katherine Goslee Winrock International
23 Janice Bollers Guyana Geology and Mines
Commission (GGMC)
55 William Salas Applied Geosolutions
24 Yvonne Pearson Ministry of Amerindian
Affairs
56 Bobby Braswell Applied Geosolutions
25 PamelaMendonca The Amerindian Action
Movement of Guyana
(TAAMOG)
57 Dr James Baker Clinton Climate Initiative
26 Ashton Simon The National Amerindian Development Foundation
(NADF)
58 Maria Sanz Sanchez UN REDD
27 Colin Klautky Guyana Organisation of Indigenous People (GOIP)
59 Dr Jim Penman IPCC Expert
28 George Norton Guyana Organisation of
Indigenous People (GOIP)
60 Rodrigo Martinez IDB
29 Bertie Xavier North Rupununi Development Board
(NRDDB)
61 Ken Andrasko FCPF
30 Edward Shields Guyana Gold and Diamond
Miners Association
(GGDMA)
62 Maarten van der Eynden Government of Norway
31 Gillian Burton Trade Unions Congress
(TUC)
63 Edwin Aalders DNV
32 Paulette Bynoe University of Guyana (UG)
5.1 Received comments and response by the Guyana Forestry
Commission
Comment by: Norwegian Ministry of the Environment, Ronald E. McRoberts and The
Amerindian Action Movement of Guyana
NGO Party Other Stakeholders
Sent on: 04 - 10 November 2013
Subject: Comments on GFC/Indufor report
Comment 1:
Comment by Norwegian Ministry of the Environmen and Ronald E. McRoberts: First of all, we would like to
take this opportunity to congratulate you on submitting the third Interim Measures Report under the Guyana-
Norway partnership. The work on MRV Guyana is doing is of high relevance not only to this partnership, but to
the global REDD+ discussions in general. The authors are commended for a comprehensive and detailed report.
Progress in estimating emissions factors and in-country building capacity is particularly encouraging. Comment
from The Amerindian Action Movement of Guyana: TAAMOG congratulates the GFC for the Third Performance
Report, which is very comprehensive and accurate produced jointly with Indufor as part of MRVS roadmap for
REDD+, and Performance Reporting process under the Memorandum of Understanding (MOU) between the
Governments of Guyana and Norway. This is a significant achievement.
Response GFC:
As we progressively build the elements of the MRV System, we aim to achieve a high quality of routine, accurate,
complete, and consistent performance reporting that covers deforestation and forest degradation aspects that

DET NORSKE VERITAS
Report No: 2013-1760, rev. 01
VERIFICATION REPORT
Page 23
integrates robust mechanism of monitoring and independent verification. In this context, we indeed hope to
contribute to national and international discussions on REDD+ and MRVS.
DNV:
The verification team assessed the comment and the response to be satisfactory.
Comment by: Norwegian Ministry of the Environment, The Amerindian Action Movement
of Guyana
NGO Party Other Stakeholders
Sent on: 07 – 10 November 2013
Subject: Comments on GFC/Indufor report
Comment 2:
Norwegian Ministry of the Environment: A notable feature of the report is that the deforestation rate seems to
have gone up in the third year compared to previous years. While this is of course a result that should be taken
seriously, it is also important to keep in mind that the progress on MRV in Guyana now makes us all able to be
more informed about these results. Understanding what happens makes it possible to tailor interventions, and
this is an important element to consider.
The Amerindian Action Movement of Guyana (edited): TAAMOG views the report as technically sound and
moreso its technical analysis which show that there is an increase of 0.079% in Deforestation as a result of
Mining. For the year 2 reporting period Guyana’s deforestation rate was 0.054%. But given this increase
Guyana’s deforestation rate continues to remain very very low far less that .1% which is among the lowest in the
world, provides a sound indicator that Guyana continues to effectively practice Sustainable Forestry
Management.
Response GFC:
We share this view and continue to develop the MRVS as an objective and technical instrument that serves a
broader purpose beyond informing on deforestation rate. At the same time, in all instances, including those
when there is an increase in deforestation rate, these results are submitted at the policy level with an objective of
informing discussions and programmes in relevant areas.
DNV:
The verification team assessed the comment and the response to be satisfactory.
Comment by: Norwegian Ministry of the Environment
NGO Party Other Stakeholders
Sent on: 07 November 2013
Subject: Comments on GFC/Indufor report
Comment 3:
We note with substantial interest that the time series that is being built up seems to make it possible to learn
more about the dynamic of forest converting drivers in the country, and the MRVS could potentially be a highly
significant policy development tool in this regard.
Another interesting finding is that all Year 3 deforestation falls inside the footprint of historical change areas.
This shows again that the MRVS can also inform policy development and interventions.
Response GFC:
The intention of the MRV System is to inform policy and programmes for overall natural resources management
and REDD+ development in Guyana. At the inception stage of the MRVS development, the Roadmap for the
MRVS for Guyana proposes the development of the System based on drivers of deforestation and forest

DET NORSKE VERITAS
Report No: 2013-1760, rev. 01
VERIFICATION REPORT
Page 24
degradation. Over the last three years in the implementation of the MRVS Roadmap, we have undertaken a
policy based approach which speaks to drivers of forest change that are systematically monitored over time and
reported on at every reporting period. As the time series is further strengthened, we now have a very useful
instrument to inform monitoring and management programmes for natural resources planning and utilization,
which is intended to inform policy development.
DNV:
The verification team assessed the comment and the response to be satisfactory.
Comment by: Norwegian Ministry of the Environment
NGO Party Other Stakeholders
Sent on: 07 November 2013
Subject: Comments on GFC/Indufor report
Comment 4:
We want to highlight that the phasing out of this indicator is subject to other progress as described in the JCN of
2012, and that the implementation of the monitoring system alone is therefore not a sufficient justification for
phasing out the indicator.
Response GFC:
We agree that the JCN is of course seen as the guiding document. It does however, need to be acknowledged that
Guyana can be viewed as exceeding good practice guidelines as set out for forest monitoring for MRVs and a
more advanced approach has been applied. Given that the country is now covered at 5 m resolution any change
in forest state at and below the minimum mapping unit are very evident. This makes for a transparent unbiased
assessment of forest change. The accuracy of the mapping is subject to two independent assessments, a formal
accuracy assessment and an overall audit. It is suggested that IFL and the context that this proxy has been
applied under is now outdated. The IFL concept is really meant to provide a high level assessment of regional
change using medium resolution imagery. Guyana has since year 2 moved beyond medium resolution enabling it
to provide spatially explicit assessment of forest change that extends beyond the boundary of the IFL.
DNV:
The verification team assessed the comment and the response to be satisfactory.
Comment by: Norwegian Ministry of the Environment and Ronald E. McRoberts
NGO Party Other Stakeholders
Sent on: 04 & 07 November 2013
Subject: Comments on GFC/Indufor report
Comment 5:
Norwegian Ministry of the Environment: This is a very helpful table. One thing that we have also commented in
previous years is that it would be very interesting to also see an assessment of uncertainty on the reported
change rate (0.079 % for Year 3). We are aware that the accuracy assessment will be available in a few weeks.
Will this year’s accuracy assessment also include uncertainty assessment on the change rate? If not, could you
please explain why it is not possible to present this uncertainty?
Ronald E. McRoberts (comment summarised): The authors state that the accuracy assessment for 2013 is yet to
be completed. What are the impacts of this missing assessment on annual estimates of deforestation? Two issues
are of concern. First, without an assessment of uncertainty, where is the evidence that differences between year
3 and previous years are statistically significantly different? If they are not statistically significantly different,
then the differences should be attributed to factors such as classification and random sampling errors rather

DET NORSKE VERITAS
Report No: 2013-1760, rev. 01
VERIFICATION REPORT
Page 25
than to actual change on the ground. Second, none of the estimates was adjusted for classification error. A map
estimate is subject to classification error which, if it is systematic, induces bias into the estimation process.
The overall classification accuracy for 2012 was stated to be 98.6% (Section 8.2). Although that is an excellent
accuracy, it does not necessarily indicate that the map-based estimates of change are not influenced by
classification error.
Response GFC:
For historic periods, deforestation rate for periods presented were annualised. Uncertainty assessment is
presented for the rate of change using a model-assisted difference estimator for which bias and variance within
sampled statra are subject to assessment using probability-based estimators. Please refer to the Appendix for the
full report on Accuracy Assessment. Page 23 of the Accuracy Assessment Report notes that: Although the
expectation is that probability-based estimators are unbiased, this cannot be assumed. An elegant approach that
combines the advantages of simple random sampling with model-based estimators is the model-assisted
difference estimator (McRoberts 2010; McRobertset al. 2010a; McRoberts et al. 2010b, Næsset et al. 2011). A
model-assisted estimator used map data to make an initial inference but uses the probability-based sample to
validate the result (McRoberts and Walters 2012). In this analysis the model-assisted difference estimator has
been applied separately to each stratum since forest area can be calculated easily from the GIS. Bias and
Variance are estimated from the probability-based sample within each stratum.
DNV:
The verification team assessed the comment and concluded that GFC response had not addressed all the
elements raised by the stakeholder consequently CAR 2 has been raised by the audit team.
REVISED RESPONSE GFC Following CAR2:
For historic periods, deforestation rate for periods presented were annualised. Uncertainty assessment is
presented for the rate of change using a model-assisted difference estimator for which bias and variance within
sampled strata are subject to assessment using probability-based estimators. Please refer to the Appendix for the
full report on Accuracy Assessment. Page 23 of the Accuracy Assessment Report notes that: Although the
expectation is that probability-based estimators are unbiased, this cannot be assumed. An elegant approach that
combines the advantages of simple random sampling with model-based estimators is the model-assisted
difference estimator (McRoberts 2010; McRobertset al. 2010a; McRoberts et al. 2010b, Næsset et al. 2011). A
model-assisted estimator used map data to make an initial inference but uses the probability-based sample to
validate the result (McRoberts and Walters 2012). In this analysis the model-assisted difference estimator has
been applied separately to each stratum since forest area can be calculated easily from the GIS. Bias and
Variance are estimated from the probability-based sample within each stratum. The Norwegian Ministry of
Environment raise an important question about presenting uncertainty on deforestation rates. The rate of
change of forest cover is calculated from measured deforestation in year n divided by measured forest area from
year n-1. There are uncertainties associated with both the forest cover change (numerator) and the initial forest
cover (denominator) in this calculation. The confidence intervals associated with these values are based on
separate accuracy assessments, albeit using the same model-assisted difference estimator (McRoberts, 2010) to
derive a Confidence Interval (CI). It should certainly be recognised that the rate is based on data with differing
levels of certainty; Year 3 forest cover CI is smaller than Year 2 and based on a larger sample.
Comment by: Norwegian Ministry of the Environment
NGO Party Other Stakeholders
Sent on: 07 November 2013
Subject: Comments on GFC/Indufor report
Comment 6:
We note that the forest area has been reassessed based on availability of higher resolution satellite imagery.
Could you please briefly explain how consistency with the existing maps from previous years was ensured?
Response GFC:

DET NORSKE VERITAS
Report No: 2013-1760, rev. 01
VERIFICATION REPORT
Page 26
The delineation of forest area was conducted with RapidEye 5 m imagery. At this resolution it is more readily
apparent if areas meet the elected forest definition. In particular, areas previously identified as non-forest in
1990 were re-assessed and re-allocated as appropriate. This improvement work has resulted in an updated
forest area. The intention is that this revised area be used as the benchmark from year 3 onwards.
DNV:
The verification team assessed the comment and the response to be satisfactory.
Comment by: Ronald E. McRoberts
NGO Party Other Stakeholders
Sent on: 04 November 2013
Subject: Comments on GFC/Indufor report
Comment 7:
The Report states that the stock-change method was used to estimate deforestation. Was this really the case?
Based on the extensive use of classified satellite imagery, it seems more likely that the gain-loss method which
focuses on estimating activity areas (change classes) was used. Section 7.1 indicates that classification of
change from forest to non-forest was based on comparisons of maps. This sounds a lot like the stock change
rather than the gain-loss method?
Response GFC:
This aspect of the discussion focuses on the forest carbon monitoring system and not the forest area assessment
aspect. The FCMS is another aspect of the MRVS development.
DNV:
The verification team assessed the comment and the response to be satisfactory.
Comment by: The Norwegian Ministry of the Environment
NGO Party Other Stakeholders
Sent on: 07 November 2013
Subject: Comments on GFC/Indufor report
Comment 8:
We are encouraged also to see the progress Guyana seems to be making on adapting the monitoring format to
IPCC standards and on developing operational methods to measure emissions from shifting cultivation as well
as carbon sinks in the form of enhancements.
Response GFC:
Work has started in these areas in 2012, in the development of methodologies, and is planned to further advance
in the next reporting period.
DNV:
The verification team assessed the comment and the response to be satisfactory.
Comment by: Norwegian Ministry of the Environment
NGO Party Other Stakeholders
Sent on: 07 November 2013
Subject: Comments on GFC/Indufor report

DET NORSKE VERITAS
Report No: 2013-1760, rev. 01
VERIFICATION REPORT
Page 27
Comment 9:
It is very interesting to see that Guyana has created a Protected Areas Commission. Is there already an assigned
focal point for REDD+ relevant work in this Commission?
Response GFC:
The Protected Areas Commission comes under the Ministry of Natural Resources and the Environment. Within
the Ministry, there is a focal person for Climate Change and REDD+.
DNV:
The verification team assessed the comment and the response to be satisfactory.
Comment by: Norwegian Ministry of the Environment
NGO Party Other Stakeholders
Sent on: 07 November 2013
Subject: Comments on GFC/Indufor report
Comment 10:
It is stated that changes from non-forest land to forest land is being reported. We cannot seem to find
information on this in the report. Is this because this reporting is not part of the interim measures reporting (that
only accounts for gross deforestation – i.e. without regrowth)?
Response GFC:
Currently the monitoring methods developed are being evaluated. These areas are historical deforestation sites
that could potentially regenerate. These areas are tracked, but further work is required to assess the potential
carbon stocks across these sites. These are currently not part of the interim measures for reporting in this period
as gross deforestation is the main indicator reported on for deforestation.
DNV:
The verification team assessed the comment and the response to be satisfactory.
Comment by: Norwegian Ministry of the Environment
NGO Party Other Stakeholders
Sent on: 07 November 2013
Subject: Comments on GFC/Indufor report
Comment 11:
The section on forest degradation monitoring is very interesting. As these methods were developed for the Year 2
reporting, we are aware that these methods are described in more detail in the Year 2 IMR. On the other hand,
these experiences could be of high value to other countries trying to achieve degradation monitoring. Are you
and your partners planning on submitting the experiences related to degradation monitoring to scientific
journals?
Response GFC:
Yes, this is being considered. The methods adopted are well developed and functional for Guyana.
DNV:
The verification team assessed the comment and the response to be satisfactory.
Comment by: Norwegian Ministry of the Environment

DET NORSKE VERITAS
Report No: 2013-1760, rev. 01
VERIFICATION REPORT
Page 28
NGO Party Other Stakeholders
Sent on: 07 November 2013
Subject: Comments on GFC/Indufor report
Comment 12:
It is very interesting to see that in mining sites revisited (1990 – 2012), no forest cover have regenerated. This
indicated that the environmental impacts of mining methods used in the past are indeed significant. We agree
that a long term measurement plan is a good idea.
Response GFC:
Land reclamation is found to be a prerequisite for regeneration and reforestation activities to occur. A
Technical Work Group led by the Ministry of Natural Resources through the GGMC has been formed to
coordinate these efforts. These are part of a longer term programme of work.
DNV:
The verification team assessed the comment and the response to be satisfactory.
Comment by: Norwegian Ministry of the Environment
NGO Party Other Stakeholders
Sent on: 07 November 2013
Subject: Comments on GFC/Indufor report
Comment 13:
Another interesting finding is that all Year 3 deforestation falls inside the footprint of historical change areas.
This shows again that the MRVS can also inform policy development and interventions.
Response GFC:
Yes, it allows for targeted intervention and potentially further improvements in compliance monitoring.
DNV:
The verification team assessed the comment and the response to be satisfactory.
Comment by: Norwegian Ministry of the Environment
NGO Party Other Stakeholders
Sent on: 07 November 2013
Subject: Comments on GFC/Indufor report
Comment 14:
It is proposed that IFL change within Amerindian areas is not accounted for in the calculation of the financial
remuneration. In our view, the IFL indicator is meant to assess performance in keeping IFL areas intact at an
overall, national level, and that all change to IFL should therefore be calculated. As commented previously, any
amendments to the IFL indicator relates to progress also on other deliverables in the JCN of 2012, and until this
more overarching discussion takes place, we suggest keeping the indicator in its current form.
Response GFC:
The continued retention of a less scientific measure such as the IFL is not really in keeping with the overall
intention of the JCN, Once on detection as part of the MRV and then again due to enforcement of this
rudimentary proxy deforestation measure. Further, IFL intentionally makes provisions for ―exclusions‖ and
settlements such as titled Amerindian areas, qualify for such exclusions. The fact that these cannot all be

DET NORSKE VERITAS
Report No: 2013-1760, rev. 01
VERIFICATION REPORT
Page 29
determined upfront as the process of land titling in Guyana is a continuous one, should not, in our view, be
reason to prevent these from being excluded when titles are granted for Amerindian Villages. This, in our view,
may be seen as an unintended disadvantage of the continuous land titling programme for Amerindian Villages.
DNV:
The verification team assessed the comment and the response to be satisfactory. During this years audit the
verification team paid special attention to the IFL indicator in relation to newly entitled Amerindian land, and
found it to be in agreement with the JCN.
Comment by: Norwegian Ministry of the Environment
NGO Party Other Stakeholders
Sent on: 07 November 2013
Subject: Comments on GFC/Indufor report
Comment 15:
It is good to see that measurements of existing mining sites have been integrated within mapping protocols.
Revisiting degradation sites is important, as degradation is a process that could happen over several years. This
realization was also the reason why the original indicator was formulated as ―50 % carbon loss per year‖. Of
course, the new mapping method eliminates the need for applying such a default factor, but the sites should still
be revisited to capture any degradation that happens after the first year.
Response GFC:
Yes, the aim is to also continue to refine and improve the methodology.
DNV:
The verification team assessed the comment and the response to be satisfactory. The verification team paid
special attention to the mapping of degradation around older mining sites.
Comment by: Norwegian Ministry of the Environment
NGO Party Other Stakeholders
Sent on: 07 November 2013
Subject: Comments on GFC/Indufor report
Comment 16:
A question out of mere curiosity; Do you have knowledge about the reason for the historical fire rates in Guyana
being so massively higher than in the recent few years? Was the El Niño event described in the footnote that
severe, or could there be other reasons?
Response GFC:
In 2000 there was a major fire event located around Linden. This occurred during an extended period of dry
weather which was associated with the El Niño.
DNV:
The verification team assessed the comment and the response to be satisfactory.

DET NORSKE VERITAS
Report No: 2013-1760, rev. 01
VERIFICATION REPORT
Page 30
6 REFERENCES
Documents provided by the Project Participants. These have been used as direct sources of
evidence for the periodic verification conclusions, and are usually further checked through
interviews with key personnel.
/1/ Guyana Forestry Commission Guyana REDD+ Monitoring Reporting&Verification
System (MRVS) Interim Measures Report, Version 1 dated16 October 2013,Version 2
dated 17 November 2013 and Version 3 dated 6 December 2013
/2/ Guyana Forestry Commission: Geodatabase with all raw and processed datasets,
November 2013
/3/ Guyana Forestry Commission: Data Base of Illegal logging activities for the four
forestry divisions of Bce, Dem, Ess and Nwd – 1 January 2012 to 31December 2012 –
Year 3
/4/ Guyana Forestry Commission: Data Base of Procedural Breaches for the four forestry
divisions of Bce, Dem, Ess and Nwd – 1 January 2012 to 31December 2012 – Year 3
/5/ Guyana Forestry Commission: Data Base of wood harvesting declarations of wood
extraction activities in lands classified as State Forest– 1 January 2012 to 31December
2012 – Year 3
/6/ Guyana Forestry Commission: Data Base of wood harvesting declarations of wood
extraction activities in lands classified as Amerindian or Private Property– 1 January
2012 to 31December 2012 – Year 3
/7/ Winrock International: Collateral Damage and Wood Products from Logging Practices
in Guyana- December 2011
/8/ Salas, W. Hagen, S, et al. Winrock International and Applied GeoSolution: A Pilot
Study to Assess Forest Degradation Surrounding New Infrastructure. Guyana Forestry
Commission. February, 2012.
/9/ Guyana Forestry Commission: Sampling Design and Implementation Plan for
Guyana’s REDD+ Forest Carbon Monitoring System (FCMS) – July 2012
/10/ Guyana Forestry Commission: Spatial Analyses for Forest Carbon Stratification and
Sampling Design for Guyana’s FCMS: Phase II – June 2013
/11/ Logging_Plots_ALL TREES_May 14 2012.xls
/12/ Carbon Stock Calcualtions_MA-GFC_2013-v6_6.xls
/13/ Guyana Forestry Commission: Guyana FCMS Conversion Factor Handbook – Revised
October 2013
/14/ Guyana Forestry Commission: Establishing a Reference Level for REDD+ in Guyana
– June 2012
/15/ The Guyana Forestry Commission and Indufor: Standard Operating Procedures for
Forest Change Assessment: A Guide for Remote Sensing Processing & GIS Mapping
/16/ Sist, Plinio: 2000: Reduced-impact logging in the tropics: objectives, principles and
impacts. International Forestry Review 2(I), 2000. Pages 3-10.
/17/ Guyana Forestry Commission: Standard Operating Procedures for the Forest Carbon
Monitoring System of Guyana – September 2012
/18/ Durham University: Appenidix 2 to IMR –Accuracy Assessment Report, November
2013
DET NORSKE VERITAS
Report No: 2013-1760, rev. 01
VERIFICATION REPORT
Page 31
Background documents related to the design and/or methodologies employed in the design or
other reference documents.
/19/ Guyana Forestry Commission: Manual of Procedures of Key Area of Forest Monitoring
/20/ ISO 14064-3: Greenhouse gases — Part 3: Specification with guidance for the
validation and verification of greenhouse gas assertions, First edition, 1 March 2006
/21/ Guyana Forestry Commission: Detention and Seizure Procedure
/22/ Guyana Forestry Commission: Forest Monitoring Operating Procedure
/23/ Guyana Forestry Commission: Procedure for Export of Forest Produce
/24/ Guyana Forestry Commission: Procedure for Issuance of Sawmill Licence
/25/ Guyana Forestry Commission: Procedure for issuing SFEP,
http://www.forestry.gov.gy/publications.html
/26/ Guyana Forestry Commission: Procedure for issuing SFP,
http://www.forestry.gov.gy/publications.html
/27/ Guyana Forestry Commission: Procedure for issuing TSA or WCL ,
http://www.forestry.gov.gy/publications.html
/28/ Guyana Forestry Commission: Procedure for Timber Dealers Licence
/29/ Guyana Forestry Commission: Forest inspector supervisory check list – Daily
supervision of a forest station, midmonth and month end supervision, routine checks by
forest rangers at forest stations, basic field verification, January 2007
/30/ Guyana Forestry Commission: forest station internal audit control record
Persons interviewed during the initial verification, or persons who contributed with other
information that are not included in the documents listed above.
/31/ Tasreef Khan, Deputy Commissioner of Forests – GFC
/32/ Pradeepa Bholanath, Head, PDD-GFC
/33/ Monitoring Inspectors& Supervisor Bamboo Landing, Linden and Port Kaituma Forest
station - GFC
/34/ NashetaDewnath, Programme Officer – REDD Section
/35/ Pete Watt, Consultant – Indufor
/36/ Jeff Pickering , Consultant – Indufor
/37/ Rosa Rivas Palma, Consultant – Indurfor
/38/ HaimwantPersuaud, Resource Information Officer – GFC
/39/ Jagdesh Singh – Deputy Commissioner, Forest Resources Management Division - GFC
/40/ Kerry Anne Cort – GIS/Remote Sensing Officer, Forest Resources Information Unit –
GFC
/41/ Chandroutie Sookdeo – GIS/Remote Sensing Officer, Forest Resources Information
Unit – GFC
/42/ Carey Bhojedat – Project Officer, REDD Secretariat – GFC
/43/ Nasheta Dewnath, Programme Officer, REDD Secretariat
/44/ Hansrajie Sookdeo, Project Officer – Data Management, REDD Secretariat
/45/ Danny Donoghue, Durham University
/46/ Abu Rushed Jamil Mahmood, Durham University

DET NORSKE VERITAS
Report No: 2013-1760, rev. 01
VERIFICATION REPORT
Page 32
/47/ Niko Galiatsatos, Royal School of Military Survey
/48/ Sandra Brown, Winrock International
/49/ Felipe Casarim, Winrock International
/50/ GFC Station staff Bamboo Landing
/51/ GFC Station staff Variety Woods Base Camp
/52/ GFC Station staff Linden
Criteria of validation and verification
/53/ Government of Norway and Government of Guyana: Joint Concept Note on REDD+
cooperation between Guyana and Norway, 9 November 2009, March 2011 &
December 2012
/54/ GOFC-GOLD, 2012, A sourcebook of methods and procedures for monitoring and
reporting anthropogenic greenhouse gas emissions and removals associated with
deforestation, gains and losses of carbon stocks in forests remaining forests, and
forestation. GOFC-GOLD Report version COP18-1, (GOFC-GOLD Land Cover
Project Office, Wageningen University, The Netherlands).
/55/ IPCC (2006): 2006 IPCC Guidelines for National Greenhouse Gas Inventories,
Prepared by the National Greenhouse Gas Inventories Programme. Eggleston H.S.,
Buendia L., Miwa K., Ngara T. and Tanabe K. (eds).Published: IGES, Japan
/56/ IPCC (1997). Revised 1996 IPCC Guidelines for National Greenhouse Inventories.
Houghton J.T., MeiraFilho L.G., Lim B., Tréanton K., Mamaty I., Bonduki Y., Griggs
D.J. Callander B.A. (Eds). Intergovernmental Panel on Climate Change (IPCC),
IPCC/OECD/IEA, Paris, France.
/57/ IPCC (2000). Good Practice Guidance and Uncertainty Management in National
Greenhouse Gas Inventories. Penman J., Kruger D., Galbally I., Hiraishi T., Nyenzi B.,
Emmanuel S., Buendia L., Hoppaus R., Martinsen T., Meijer J., Miwa K., Tanabe K.
(Eds). Intergovernmental Panel on Climate Change (IPCC), IPCC/OECD/IEA/IGES,
Hayama, Japan.
/58/ IPCC (2003). Good Practice Guidance for Land Use, Land-Use Change and Forestry.
Penman J., Gytarsky M., Hiraishi T., Krug, T., Kruger D., Pipatti R., Buendia L., Miwa
K., Ngara T., Tanabe K., Wagner F. (Eds).Intergovernmental Panel on Climate Change
(IPCC), IPCC/IGES, Hayama, Japan.
/59/ Consultancy Assignment Agreement between Det Norske Veritas and Norwegian
Ministry of Environment including Appendices to the agreement, 10 January 2011&
Extension Agreement, 07 February 2012, 16 May 2013
/60/ Guyana Forestry Commission: Code of Practice for Timber Harvesting 2nd
Edition,
Final Version, November 2002
/61/ Poyry: ArcToolbox model for the establishment of an IFL
/62/ Potapov, P., A. Yaroshenko, S. Turubanova, M. Dubinin, L. Laestadius, C. Thies, D.
Aksenov, A. Egorov, Y. Yesipova, I. Glushkov, M. Karpachevskiy, A. Kostikova, A.
Manisha, E. Tsybikova, and I. Zhuravleva. 2008. Mapping the world’s intact forest
landscapes by remote sensing. Ecology and Society 13(2): 51.
[online] URL: http://www.ecologyandsociety.org/vol13/iss2/art51/
/63/ Intact Forest Landscapes: Concept and definition of IntactForest Landscape,

DET NORSKE VERITAS
Report No: 2013-1760, rev. 01
VERIFICATION REPORT
Page 33
http://www.intactforests.org/concept.html
/64/ Voluntary Carbon Standard Association: REDD Methodology Modules (REDD-MF),
Approved VCS Methodology VM0007 Version 1.2
/65/ Det Norske Veritas: Verification of Interim REDD+ Performance Indicators under the
Guyana-Norway REDD+ Partnership, Monitoring Period: 01 October 2009 to 30
September 2010 – Year 1, 18 February 2011
/66/ Det Norske Veritas: Verification of Interim REDD+ Performance Indicators under the
Guyana-Norway REDD+ Partnership, Monitoring Period: 01 October 2010 to 31
December 2011 – Year 2, 16 September 2012
- o0o -

DET NORSKE VERITAS
APPENDIX A
CORRECTIVE ACTION REQUESTS, CLARIFICATION REQUESTS
AND OBSERVATIONS

DET NORSKE VERITAS
Page A-1
MINOR Corrective action requests and Observations of the previous year’s audit
CAR ID Major/
Minor
Corrective action request Response by Project Participants DNV’s assessment of response by
Project Participants
CAR 3 MINOR Requirement: Interim indicator 2b –
Carbon los as indirect effect of new
infrastructure
Non-Compliance: Accuracy
assessment contains too few sample
plots to provide sufficient accuracy on
the degradation levels
Objective evidence:
During the current accuracy
assessment it was concluded that
current sample plan resulted in too few
plots that contained degradation and
not a high enough confidence interval
can be achieved
The following recommendations have been
added to the Independent Accuracy
Assessment - Appendix 10 pg 36,
recommendation 10.
Allow sufficient time for the independent
validation. The sample size used in 2012
appears insufficient for a full quantitative
analysis of degradation drivers, particularly
when sampling low-risk strata.
We estimate that a sample of 80—100
Primary Sampling units will provide a
sufficiently large sample to yield an area
estimate, particularly if the additional PSUs
are allocated to the high-risk stratum where
Year 2 degradation is most like to be
found.
The changes applied to the Independent
Accuracy Assessment have been found
adequate, however, in order to close out
the CAR DNV will verify the
implementation and effectiveness during
the year 3 assessment
CAR: Open till next verification.
Audit 2013:
Accuracy Assessment was able to have a
significant higher sample size during this
year‘s audit and demonstrated an overall
accuracy of 99.76% which is an
acceptable accuracy according to GOFC-
GOLD REDD Sourcebook which
indicates a significant lower acceptable
overall accuracy.
CAR is closed
CAR 5 MINOR Requirement: Stakeholder
consultation
Non-Compliance: Stakeholder
consultation not completed
Objective evidence:
Following the stakeholder
consultation GFC provided full
feedback on all the stakeholder
comments received and integrated
them in version 2 of the interim report,
however did not follow up with the
individual stakeholders on GFC
All Stakeholders have received feedback on
comments sent.
On 14th July, 2012, Version 2 of the Report
was finalised and integrated stakeholder
comments received during the public
release period which ended on 6th July,
2012.
The Report integrated identification, in
relevant sections, of stakeholder comments
DNV has been able to verify that all
responding stakeholders have been
contacted and been informed about the
GFC response to their comments.
CAR is closed

DET NORSKE VERITAS
Page A-2
CAR ID Major/
Minor
Corrective action request Response by Project Participants DNV’s assessment of response by
Project Participants
response to their individual comments
with the exception of the Norway
Government
made and a response on each comment.
Additionally, on Monday 16th July, 2012,
all stakeholders received feedback directly
on their comments.
Emails to this effect, were forwarded to
DNV on 20th July, 2012.
CAR 7 MINOR Requirement: Interim Measure 2b –
Carbon loss and indirect effect of new
infrastructure
Non-Compliance: Degradation only
includes new degradations from newly
established mines but not the re-
opening of existing mines
Objective evidence: While the GFC is
currently assuming active degradation
will only occur around recently active
mining areas. During the field
assessment it has become apparent that
mining companies do come back to
older sites to investigate the potential
for extension by digging prospection
pits (of about 1.5 by 2 meters). From
the current text it is unclear whether
this would be falling under the
definition of new or not.
The intention is to revisit areas mapped as
degradation in the Year 2 assessment, to
see if the extent has changed. If
detected, then the extent is updated and
the change is accounted for in the
current mapping period.
This is only possible due to the planned
acquisition of high resolution RapidEye
identified for Year 3 which will
essentially form the second layer in the
data series at 5m resolution. The SOPs
as they relate to mapping have been
updated to reflect this, as has the main
report.
Additional information has been added to
the following pages, tables and figures.
Appendix 9: SoP for Forest Change
Assessment:
• Page 5, 24
• Table 2
• Figure 7
DNV agrees with the update made by
GFC however the CAR will not be closed
till the next verification once clarity has
been obtained from the Norwegian
government as well as the Year 3 data has
been assessed and the current proposed
process has showed to address the
observations of the audit team.
CAR to be closed out during next
verification
Audit 2013:
During the audit special attention was
given to the data interpretation and in
particularly in relation to changes over
time. The team found that GFC were able
to identify any need for updating based on
the consistent usage of high resolution
RapidEye images throughout Guyana as
well as events where such updates were
made.
CAR is closed

DET NORSKE VERITAS
Page A-3
CAR ID Major/
Minor
Corrective action request Response by Project Participants DNV’s assessment of response by
Project Participants
• p. 21 section added titled Mapping
Expanding Degradation
• p.22 & p.23 - Table degradation around
new infrastructure
Updates also reflected in the main Report:
• Figure 33 p.67
• Table 7-1 p. 68
P.72 section added titled Mapping
Expanding Degradation
We would like to add that the method that
was applied for this indicator was
consistent from year 1 to year 2.
The GFC would follow up with the
Government of Norway for the needed
clarification in this area, to inform year 3
assessment.
Observations
CAR ID Corrective action request Response by Project Participants
DNV’s assessment of response by
Project Participants
Obs1 Requirement: Interim indicator 3 Forest
management
Potential Non-Compliance: Errors in
Mapping of activities due to the existing
and passed way of position recording
Objective evidence: During the field
visit to Mabura audit team was not able
to locate stumps using GFC GPS due to
the fact that past GPSpositions were not
properly converted to current used
In the starting phase (2010/2011) of the work on the
forest carbon monitoring system, preliminary data were
required to be collected to inform the full design of the
system and importantly, to inform the Standard
Operating Procedure to be used.
The current national GIS procedure for Guyana requires
for all data to be recorded in Provisional South American
Datum of 1956 (PSAD 56). This procedure is currently
being updated to the WGS 84 datum and it is expected
DNV assessment team has taken note of
the explanation and will continue to
observe if during future audits similar
issues case problems in the execution of
the audit work.

DET NORSKE VERITAS
Page A-4
CAR ID Corrective action request Response by Project Participants
DNV’s assessment of response by
Project Participants
GPScoordinates. that this process will be updated in the near future.
It should be noted that the difference in conversion
between the PSAD 56 and the WGS 84, is 400m.
The first field data collection for the system was
conducted in Maburaand the data were collected in
PSAD 56 but represented on the map as WGS 84.
The Mabura plots have since been converted to the
consistent data projection system.
Obs2 Requirement: Interim indicator 1, 2 and
3
Potential Non-Compliance: Errors in
data processing & delay timelines
Objective evidence:
In order to achieve the highest
level of cloud free images GFC
currently waits till end ofthe year
to start image interpretation
which leaves little time for the
overall process of interpretation,
accuracy assessment and interim
reporting.
GFC does not apply the same
level of risk assessment in their
project planning as they apply in
their sampling technique in
which low risk and high risk
areas are treated differently in the
sampling levels and project
management
Good process requires for annual report to, as much as
possible, use data from the end of the period of
assessment. The GFC ensures that this is done as far as
possible.
The GFC indeed conducts risk assessment in project
planning.
GFC however acknowledge this comment and would like
the opportunity to release a revised timetable for the
Year 3 assessment for consideration by Norway. This
work plan would take into consideration the elements
and timelines required to meet the Interim Measures
(IM).
• image acquisition period
• image pre-processing
• Studies required to report additional IM
• Change mapping
• QA/QC of mapping
• Independent Accuracy assessment
• Reporting & stakeholder consultation
• External Audit of the interim measures.
This is in part due to the requirement to report change as
close to the end of the reporting period (December).
DNV assessment team has taken note of
the explanation and will continue to
observe if during future audits similar
issues may potentially case problems that
may affect the ability of GFC in
delivering auditable results.

DET NORSKE VERITAS
Page A-5
CAR ID Corrective action request Response by Project Participants
DNV’s assessment of response by
Project Participants
Once all images are acquired, work starts on the highest
threat areas. This is therefore a key consideration in the
project planning.
As such, the second point raised, is not the case. The
GFC does prioritise area based on risk.
Permission to use imagery earlier than December for
Year 2, has now been granted by Norway (4 June 2012)
A sample grid 24 x 24 km is overlaid and as completed
these grids are colour coded. This process allows for
forward planning as the team are then able to calculate
the resources required to complete the task.
Further, the GFC notes that there continues to be delays
in the receipt of finances by the GFC to commence the
preliminary work on time. For example, for year 3
(January to December 2012) assessment year, no
financing has been received by the GFC (as at end of
July, 2012) to commence this work. This significantly
inhibits the smooth work flow and effective planning

DET NORSKE VERITAS
Page A-6
Corrective action requests this year’s audit
CAR ID
Major/
Minor/
Obs Corrective action request Response by Project Participants
DNV’s assessment of response by
Project Participants
CAR 1 MAJOR Requirement: Interim Measures 2.6 (5*)
Emissions resulting from forest fires
Non-Compliance: Performance Year 3
versus reference level not correctly
reported
Objective evidence:
Table S1: Interim Measures of
the Interim Report MRVS
Interim Measures Report – Year
3 Version 2.pdf whilst presenting
the correct Year 3 total, does not
present the correct total for
difference to reference measure.
The difference of Year 3 reported total for the
indicator on Forest Fires of 208 ha was
compared to the reduced balance of the
Reference Level subtracting Year 2 total.
A change was made to deduct the Year 3 total
from the original total in the Reference Level
and not the reduced total following the Year 2
deduction. This results with a Difference of
Year 3 to Reference Measure being 1,498 ha
and not 1,470 ha. The reported total for Year
3 of 208 ha remains the same.
Corrective Action adopted in Version 3 of
Report.
DNV has been able to verify the
corrections and confirm the corrections
to be correct.
CAR is closed
*Number used in table S1 of the MRVS Interim Measures Report - Year 3 Version 2.pfd

DET NORSKE VERITAS
Page A-7
CAR ID
Major/
Minor/
Obs Corrective action request Response by Project Participants
DNV’s assessment of response by
Project Participants
CAR 2 MAJOR Requirement: Interim Measures 1.1 (11)
Gross Deforestation, Interim Measures
2.1 (21) Loss of intact forest and Interim
Measures 2.3 (2b1)
Non-Compliance: Stakeholder
comments not fully responded in one
instance.
Objective evidence: A comment from
Norwegian Ministry of the Environment
on table S1 is only partly answered by
the response by GFC. This is as regards
to uncertainty assessment on the rate of
deforestation whereby no explanation on
why it is not possible to present on the
uncertainty of change rate was provided.
The Norwegian Ministry of Environment raise
an important question about presenting
uncertainty on deforestation rates. The rate of
change of forest cover is calculated from
measured deforestation in year n divided by
measured forest area from year n-1. There are
uncertainties associated with both the forest
cover change (numerator) and the initial forest
cover (denominator) in this calculation. The
confidence intervals associated with these
values are based on separate accuracy
assessments, albeit using the same model-
assisted difference estimator (McRoberts,
2010) to derive a Confidence Interval (CI). It
should certainly be recognised that the rate is
based on data with differeing levels of
certainty; Year 3 forest stock CI is smaller
than Year 2 and based on a larger sample.
Full response on the presenting of an
uncertainty on the rate of change but rather on
forest cover and deforestation, is provided.
Corrective action adopted in Version 3 of the
Report.
DNV has been able to verify revised
Response in version 3 of the interim
report and found it fully respond to the
issues raised by the stakeholder.
CAR is closed

DET NORSKE VERITAS
Page A-8
CAR ID
Major/
Minor/
Obs Corrective action request Response by Project Participants
DNV’s assessment of response by
Project Participants
CAR 3 MINOR Requirement: Interim Measures 1.1 (11)
Gross Deforestation, Interim Measures
2.1 (21) Loss of intact forest and Interim
Measures 2.3 (2b1)
Non-Compliance: Clarity on transition
plan relating to internal capacity building
and maintenance
Objective evidence: Current
management and oversight of the GIS
unit is due to transition to a local actors,
and it is not clear how GFC is able to
ensure continued internal capacity
building and maintenance which ensures
the high level of delivery of GIS services
Within the year 3 (2012) assessment period,
the most significant involvement of local
resources was seen over the past 3 years. In
this period, a separate and dedicated unit was
established to perform MRV assessments and
saw the contracting of 4 new staff for this
purpose. This has brought the local staffing
complement of the GFC, dedicated to this
effort to 6 persons.
For the 2012 assessment, whilst oversight was
provided by a full time specialist of Indufor
who was stationed in Guyana for 1 year, this
effort was directed at building local capacities
for not only GIS and RS mapping and
analyses, but also project management and
oversight. Evidence of this leadership role by
GFC staff is evidenced by the degree of
involvement in both mapping and
management aspects of the Year 3 assessment
process. It should be recognised that ongoing
technical assistance is a feature of all
international MRV systems – especially
during the initial development phase. The
GFC is mindful of this and will continue to
use technical assistance as required to ensure
future reporting adheres to GPG and meets the
stipulated requirements.
DNV agrees with proposed planning of
GFC however the CAR will not be
closed till the next verification once the
evidence of the implementation can be
verified.
CAR to be closed out during next
verification

DET NORSKE VERITAS
Page A-9
CAR ID
Major/
Minor/
Obs Corrective action request Response by Project Participants
DNV’s assessment of response by
Project Participants
The plan in moving forward towards the Year
4 assessment is to maintain efficient planning
for all activities related to forest cover
monitoring and mapping, as well as
capitalising on the experiences built within
the new unit to fully and effectively manage
and execute the analysis to be done.

DET NORSKE VERITAS
Page A-10
CAR ID
Major/
Minor/
Obs Corrective action request Response by Project Participants
DNV’s assessment of response by
Project Participants
CAR 4 MINOR Requirement: Interim Measure 2.2 (31)
Non-Compliance: Expanding Staff
Capacity in forest carbon monitoring
beyond current levels.
Objective evidence: Although the GIS
staff has seen expansion within the
staffing the Forest Carbon Monitoring
relays heavily on a few individuals and
current work load may be heavy for
existing local personnel under the
programme.
The Forest Carbon Monitoring Unit within the
GFC, has built significant capacity over the
past 3 years in managing and implementing
the activities involved in the execution of the
monitoring programme.
This is evidenced by dedicated staff who work
on the management aspect of this activity, full
time, as well as a cadre of field staff from the
GFC Forest Resources Management division,
who have been trained to perform activities
such as data collection, recording and
processing. All field activities are managed
and executed by local staff, with support from
external specialists in the area of design and
future system development areas.
There is scope to increase the number of local
staff in the management aspect of the forest
carbon monitoring system from its current
level. However, this expansion will be
managed with keen consideration to the fact
that field work may be more extensive in the
current design phase but perhaps less
intensive in the full operational stage when
relevant system elements would have already
been established.
DNV agrees with proposed planning of
GFC however the CAR will not be
closed till the next verification once the
evidence of the implementation can be
verified.
CAR to be closed out during next
verification

DET NORSKE VERITAS
Page A-11
CAR ID
Major/
Minor/
Obs Corrective action request Response by Project Participants
DNV’s assessment of response by
Project Participants
CAR 5 MINOR Requirement: Overall Guyana MRV
programme
Non-Compliance: Current system does
not establish tolerance levels as part of a
QA/QC design framework, necessary for
an MRV system
Objective evidence:
Current manuals cover the
activities to be undertaken
however it does not cover
predefined fall back options for
errors in the system
Current QA&QC focus on fixing
the problems found but not what
the relevancies of the error and
whether this has an effect on
other data sets.
Manuals of Procedures as seen in Sample
Design, Standard Operating Procedures, and
Mapping Protocols define system processes
for both forest carbon and forest cover
monitoring.
QA and QC processes are embedded within
these systems are designed to reflect best
practice as recommended by IPCC, GOFC
GOLD as well as methods outlined in peer
reviewed, published scientific studies.
Current systems are designed to achieve as
high accuracy and precisions levels that are
possible. For example, main elements of the
forest carbon monitoring system aim for
statistical results that reflect 95% confidence
level +/_ 15% of the mean.
Although of minimal occurrence, in instances
of errors in data collection and processing,
currently, full system checks are performed
across datasets.
General tolerance levels for main components
the forest area and forest carbon monitoring
systems may be beneficial to the overall
operation of the MRVS as well as integration
within the relevant SOPs an aspect on the
treatment and classification of known types of
errors.
DNV agrees with proposed planning of
GFC however the CAR will not be
closed till the next verification once the
evidence of the implementation can be
verified.
CAR to be closed out during next
verification
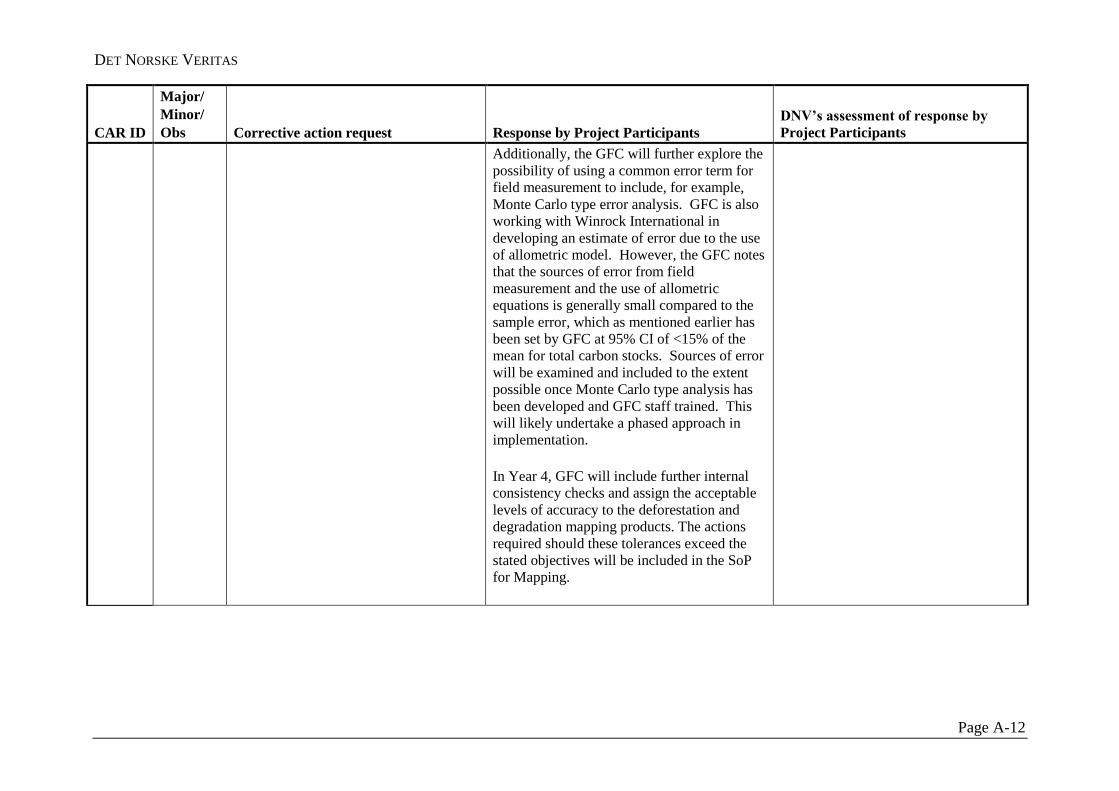
DET NORSKE VERITAS
Page A-12
CAR ID
Major/
Minor/
Obs Corrective action request Response by Project Participants
DNV’s assessment of response by
Project Participants
Additionally, the GFC will further explore the
possibility of using a common error term for
field measurement to include, for example,
Monte Carlo type error analysis. GFC is also
working with Winrock International in
developing an estimate of error due to the use
of allometric model. However, the GFC notes
that the sources of error from field
measurement and the use of allometric
equations is generally small compared to the
sample error, which as mentioned earlier has
been set by GFC at 95% CI of <15% of the
mean for total carbon stocks. Sources of error
will be examined and included to the extent
possible once Monte Carlo type analysis has
been developed and GFC staff trained. This
will likely undertake a phased approach in
implementation.
In Year 4, GFC will include further internal
consistency checks and assign the acceptable
levels of accuracy to the deforestation and
degradation mapping products. The actions
required should these tolerances exceed the
stated objectives will be included in the SoP
for Mapping.

DET NORSKE VERITAS
Page A-13
CAR ID
Major/
Minor/
Obs Corrective action request Response by Project Participants
DNV’s assessment of response by
Project Participants
Obs 1 OBS Requirement: Interim indicator 1, 2 and
3
Potential Non-Compliance: Accuracy
assessment‘s sampling plan and estimate
of standard error of the model-assisted
estimator.
Objective evidence:
The DU has assumed the 1ha-plot as unit
of observation and that it is stratified
SRS. This is evidenced from the
calculations such as the ones provided
11-8 for the High Risk Stratum, where
the confusion matrix and all the
calculations of the model-assisted
estimator and its variance have been
made considering the 1-ha plot as
sampling unit (i.e. 24125 units in the
matrix). Hence, it has been assumed that
it is a SRS within that stratum, which
differs from the sampling design.
GFC Response:
The accuracy assessment report clearly states
that ―A two-stage sampling with stratification
of the primary units was adopted to provide
precise estimates of forest area.‖ The first
stage sample units are 15 by 1 Km rectangular
areas derived from SRS (simple random
sampling) of each of the two strata. The
second stage systematically samples 1 ha
mapping areas within each unit. The rationale
is to calculate within-stratum means and
variances and then weighted estimates of
forest area, where the weights are proportional
to the stratum sizes. The stratum size is
derived from the analysis of deforestation risk
carried out using relevant GIS data layers. As
with SRS variance estimators, stratified
estimators can be biased when used with
systematic sampling. However, stratification
of the model assisted difference estimator is,
in this case, used to increase the precision of
the forest area estimates; a variable closely
related to the variable on which the
stratification is based. The calculations were
done separately by stratum and weights
applied when combined.
DNV GL will follow up during
upcoming audit

DET NORSKE VERITAS
Page A-14
CAR ID
Major/
Minor/
Obs Corrective action request Response by Project Participants
DNV’s assessment of response by
Project Participants
This may have some implications as:
a) The formulae for the model-assisted
estimator and its variances sourced
from Roberts & Walters (2012)
assumes a SRS.
GFC Response:
The formulae used is for the model assisted
difference estimator is taken from McRoberts,
Tomppo and Naesset (2010) Scandinavian
Journal of Forest Research, 25, 368-381 and
McRoberts (2010) Remote Sensing of
Environment, 114, 1017-1025. and Sarndal
and Swensson (1987) International Statistical
Review, 55, 279-294 and McRoberts (pers
comm to Indufor).
The DNV notes suggest that the interim
measures report might have used different
terminology. The model assisted difference
estimator uses the difference between a model
(what Sarndall and Swensson refer to as a
naïve estimator) and a probability-based
sample. The DU accuracy assessment used a
probability-based sample for the first stage
and systematically sampled within this;
potential bias was examined and an additional
analysis of the sample sizes between the strata
is presented below. There is no evidence of
any systematic bias although the discussion in
the report could have been clearer.

DET NORSKE VERITAS
Page A-15
CAR ID
Major/
Minor/
Obs Corrective action request Response by Project Participants
DNV’s assessment of response by
Project Participants
b) Stehman (1997) proves that estimating
the overall accuracy of a cluster
sampling (with equal-size clusters; in
the Guyana case are unequal-size
clusters) with formulae from a SRS
may bias the results of the standard
errors.
As said above, bias is always a problem in any
systematic sampling procedure. The DNV
feedback highlights possible bias associated
with the GeoVantage flights not always
mapping 15 km2 precisely. Durham
University have looked at the distributions of
the primary sampling units and these are
shown in the density plots below. Analysis of
variance shows that there is no significant
difference in means between the two strata
and standard deviations are very similar.
[Bartlett‘s test of equal variances between
Strata Chi2 = 0.8709; Prob>chi2 = 0.351].
Therefore, although it is not ideal to have
variability in the size of the primary sample
units, this was an unavoidable consequence of
using an aircraft flying a low altitude over a
rainforest; in some cases the imaging failed
and only part of these data were collected, in
other cases additional data were collected.
There was no systematic pattern to this. In
previous years, cloud cover resulted in some
unevenness in sampling.

DET NORSKE VERITAS
Page A-16
CAR ID
Major/
Minor/
Obs Corrective action request Response by Project Participants
DNV’s assessment of response by
Project Participants
In view of this, the reported results in the
Accuracy Assessment on areas and
confidence intervals may be biased.
GFC are encouraged to improve this
potential issue.
GFC Response:
The land cover (LULC) change categories
Guyana are Forest, Degraded Forest and
various non-forest classes. The data that for
land cover transitions are captured in the
MRV and are replicated in the independent
Accuracy Assessment; that is the drivers of
change are recorded where possible. Some of
the LULC change categories are very small in
area (forest to Cropland is a good example)
and robust statistical assessment of such
change in Year 4 needs to be balanced against
the priority of assessing deforestation and
forest degradation due to mining and logging.
GFC are aware that the use of stratified
sampling and validation of satellite-based
mapping with aerial GeoVantage data has
reduced uncertainty in the aerial estimate of
forest change for Year 3. If a similar approach
is taken in Year 4, the estimate of
deforestation rate will also be improved. It is
appropriate that the Accuracy Assessment
team be asked to model this uncertainty and
where possible to comment on uncertainly by
land cover type / change driver.
The GFC mapping is based on expert manual
interpretation of 5 m resolution satellite
imagery. It is not a machine-based
classification because cloud cover and image
data quality over the entire country make it
near impossible to create a national data set
that would allow automatic classification;
hence the trained expert interpretation team
and QC procedures.

DET NORSKE VERITAS
Page A-17
CAR ID
Major/
Minor/
Obs Corrective action request Response by Project Participants
DNV’s assessment of response by
Project Participants
GFC should note that this is in fact
required by the 2006 IPCC GL for
Tier1/2 + Approach 2/3 where the
reporting is made over change categories
and uncertainty has to be reported for the
change categories (i.e. ForestLand to
CropLand), not the LULC categories (i.e.
ForestLand). So a future MRV compliant
with 2006 IPCC GL will require
determining the uncertainty in the
estimation of change.
GFC Response:
As a next step in Accuracy Assessment efforts
when the full MRVS is in place, land cover
change confusion matrix will be developed
and uncertainties will be attached to each land
use/cover category, thereby giving uncertainty
in the estimate of change. At this point, the
MRVS is in its final interim stage.
- o0o -

DET NORSKE VERITAS
APPENDIX B
CURRICULA VITAE OF THE VERIFICATION TEAM MEMBERS

DET NORSKE VERITAS
Edwin Aalders
Mr Aalders has 20 years of experience as an assessor in Environmental Auditing and Policy
and Management. Mr Aalders started his career in SGS in 1992 were he quickly became
involved in the development of new environmental certification & control services. In 2004
he became the Director of the International Emission Trading Association (IETA) which he
held till 2009. In addition to his role as Director in IETA he was the first CEO for the
Verified Carbon Standard Association (VCSa) between November 2007 and October 2008.
After leaving IETA Mr Aalders became a Partner with IDEAcarbon before joining DNV as at
their Climate Change and Sustainable Development Department in 2011.
Throughout his career Mr Aalders lived and worked in the various developing and developed
countries, particularly Latin America, Africa and Australasia, involved in developing new
environmental markets services. At SGS his work covered the development of environmental
programmes such as SGS’ Services in for Climate Change, Marine Stewardship Council
(MSC), Organic, GLOBALGAP and Forest Stewardship Council (FSC). Whilst within IETA
he had the operational responsibility of IETAs overall activities and in particularly those
related to the UNFCCC process (CDM & JI) as well as the voluntary market which ultimately
led to the setting up of the VCSa.
Mr Aalders is and has been an elected member of roster of experts for the Methodology &
Accreditation Panel Expert of the CDM & JI, member of the JI Accreditation Panel, and is
currently member of the VCSa AFOLU Steering Committee and the Pacific Carbon Trust
Advisory Panel.
Vincent Schut
Vincent Schut has over 10 years’ experience in earth observation image analysis and received
his MSc in Tropical Agriculture at Wageningen University in 2001. At SarVision, he
coordinates the development of advanced optical image processing chains and supporting
algorithms and software for semi-automated forest and land cover change monitoring in
tropical forest areas. He is also responsible for the setup and maintenance of the processing
computer systems and local area network. Vincent is an experienced programmer (python,
idl, C, C++, java) working with ENVI/IDL, Quantum GIS, openJump. Over the years he has
executed several field work campaigns in South East Asia and has good knowledge of the
relation between imagery and land cover characteristics. He has successfully executed image
processing assignments in support of national REDD MRV system development in Suriname,
Colombia and Indonesia as well as private sector VCS projects.
Ole Andreas Flagstad
Ole Andreas Flagstad holds a Master Degree in thermodynamics/energy efficiency and has
an overall working experience of more than 20 years. He has worked both in public and
private sector, including 5 years with a research institute (IFE) where specific responsibilities
included running an energy efficiency network in the food industry and direct intervention
with the industry.
Other work experience includes working in European research programmes, administring
national research programmes and International Energy Agency annexes.

DET NORSKE VERITAS
Ole worked for 5 years in DNV's research programme on energy covering topics in energy
efficiency and sustainability issues in internal projects as well as national and international
collaborations.
Ole has more than 6 years experience in validation and verification of projects within CDM,
JI and other carbon credit schemes. His qualifications and experience in carbon credit
schemes (primarily CDM and JI), qualifies him for different roles in a broad group of
technical areas.
Andres B. Espejo
Andres Espejo is the founder and president of AFOLU Global Services. He has 10 years of
experience in forest management and operations plus climate change. Andrés Espejo is a
Natural Resource and Forestry Engineer, with strong technical expertise in quantification
and modelling of biomass and carbon in the Agriculture, Forestry, and Other Land Use
(AFOLU) sector, and also with extensive experience in monitoring, reporting and verification
(MRV) of AFOLU carbon offset projects, programmes and initiatives under the main
standards. In the climate change field, he has worked in a CDM DOE (Det Norske Veritas)
and has been involved in more than 30 validations/verifications/assessments of Agriculture,
Forestry and Other Land Use (AFOLU) initiatives, including the assessment of various
REDD methodologies and projects and the assessment of two REDD national and sub-
national MRV/RELs, including emission sources related to biomass burning in all cases. Mr.
Espejo has a profound knowledge of AFOLU methodologies and requirements, REDD
relevant COP decisions, 2006 IPCC GL, GOFC-GOLD REDD Sourcebook, etc. Additionally
he has expertise in forest inventory, cruising, forest management and operations, forest
certification, and financial analysis of various types of projects.