ICO Market Research Q1 2018 - icorating.com Market Research 1 21 1 icorating.com ICO Market Research...
42
ICO Market Research Q1 2018 Secondary Contact: Steven Campbell Sales & Partnerships Manager +1 646 943 0806 [email protected] New York City The Rating Agency for the ICO Market Primary Contact: Mikhail Mironov Head of Partnerships +31 6 83624781 [email protected] Amsterdam
Transcript of ICO Market Research Q1 2018 - icorating.com Market Research 1 21 1 icorating.com ICO Market Research...
1ICO Market Research Q1 2018
icorating.com
ICO Market ResearchQ1 2018
Secondary Contact: Steven Campbell Sales & Partnerships Manager+1 646 943 0806 [email protected] York City
The Rating Agency for the ICO Market
Primary Contact:Mikhail MironovHead of Partnerships+31 6 [email protected]

2ICO Market Research Q1 2018
icorating.com
About the CompanyICORating is the global market leader for independent, non-affiliated analytical research on ICO projects, conducting detailed evaluations and assigning them investment ratings.
$2B+collective AUM of the crypto funds
≈300reviewed or rated projects
20+crypto funds
50+in-house analysts
Our main aim is to create transparency in the market and provide investors with the tools they need to make informed and evidence-based decisions in order to bridge capital and transparent ICOs.
Our team of over 50 analysts have 6 years of experience on average in companies including hedge funds, large investment banks, major consulting groups, and venture funds. Two years of analyzing the ICO market combined with this diverse set of skills and experience has enabled us to develop a unique multidisciplinary approach. We’ve evaluated over 300 ICO projects for both private and institutional clients since we started doing business in September 2016.
Over 20 crypto-focused funds with a combined $2 billion AUM regularly receive our weekly newsletter featuring ICO projects that we’ve analyzed. These funds rely on our analysis to decide which ICO projects are worthy of sending on to their in-house analysts for a closer look. Our detailed and unbiased reports evaluate ICO project technical elements, business models and tokenomics, teams, and other critical factors.

3ICO Market Research Q1 2018
icorating.com
Welcome MessageThe report for Q1 of 2018 is devoted to the most significant trends in the ICO world. We have tried to widen and deepen information on the market in order to give readers more understanding of current trends in the development of the industry.
From the standpoint of a rating agency, we observe dynamic development in the industry, but the market is still at an early stage of its development. A significant number of projects still allow miscalculations in their business models and tokenomics; most importantly, they are approaching the analysis of consumer expectations very subjectively.
Project teams often have a superficial approach to forecasting development scenarios. Many teams ignore the necessity and relevance tokens have for business models still under construction. A similar situation can be seen with projects based on operating businesses.
Having a traditional business does not always rule out their use of blockchain with their products, however this can sometimes create some discord amongst the perceptions of entrepreneurs. From this point of view, the market for the last quarter is slightly different than in the second half of 2017. A change in the role of profile funds and a significant increase in regulators’ attention to the industry cannot be overlooked.
We see that the key market trend in 2018 is a sharp increase in the share of institutional capital and a decline in the number of private investors. This actually leads to a situation where project requirements increase and the funds raised during an ICO depend on how well projects co-operate with investment funds.
Sasha Kamshilov, Chief Executive Officer

ICO market review
Tokens and products
Industry review of ICO campaigns
ICO geography
Post ICO performance
Crypto funds
Forecasts and comments
9 — 16
17 — 24
24 — 30
31 — 34
35 — 37
38 — 40
41
Table of Contents

5ICO Market Research Q1 2018
icorating.com
Review of Q1
for the quarter is the total funds raised by 412 projects whilst $3,145,410,005 was collected in the fourth quarter of 2017. Thus, there has been a 5% increase for the 1st quarter of 2018. The total amount of funds raised by ICOs in the past year was $6,184,529,460. Of the total amount of investments for the quarter, only the raised funds of rounds that completed/passed in 2018 were taken into account. Pre-sales, which were held in 2017, are not taken into account.
of ICO projects were able to collect more than $100,000. Along with this, the quarter ended with a decline in funding during March by half, in comparison with January and February. The funding during public rounds has started to noticeably lag behind the infusion of institutional capital.
For example, amount of investments for the Telegram project (TON) (not included in the statistics) amounted to $1.7 billion; this is more than half of all raised funds for the last 3 months, compared to the results for the whole quarter.
$3,331,005,381
Only half

6ICO Market Research Q1 2018
icorating.com
30 days → 2 months
Legality problems
Review of Q1
The average duration of fundraising campaigns increases from 30 days to 2 months on average in comparison with the past year. However, considering the rate of fundraising amongst the top 20 ICOs for the current quarter, there are still projects that close their sale on the first day of their ICO. For example Zeepin, Neuromation and Arcblock.
Currently, many projects planning an ICO have problems with the legality of their campaigns; legal issues are the hottest topic of early 2018. Despite this, a quarter of projects in Q1 of 2018 (109 projects out of 412) had no legal entity at the time of their ICO. In comparison, 24% of projects had a legal entity in 2017, which nevertheless indicates a positive trend for projects being more transparent to potential investors.

7ICO Market Research Q1 2018
icorating.com
Review of Q1
of the total number of projects in Q1 had no development before their ICO campaign, which is a negative factor for the industry in general.
of projects had a functioning business before their ICO, which indicates interest from representatives of real business in the tokenization of their companies.
are the most popular industries for projects that decide to stage an ICO. Exchanges, Blockchain Infrastructure and Financial Services are also the leading industries for the amount of funds raised. It is interesting to note that the list of the most popular industries has not changed compared to 2017: Blockchain Infrastructure, Financial Services, Gaming & VR, and Exchanges & Wallets.
46.6% 9%
Exchanges, Financial Services,Gaming, and Blockchain Infrastructure
8ICO Market Research Q1 2018
icorating.com
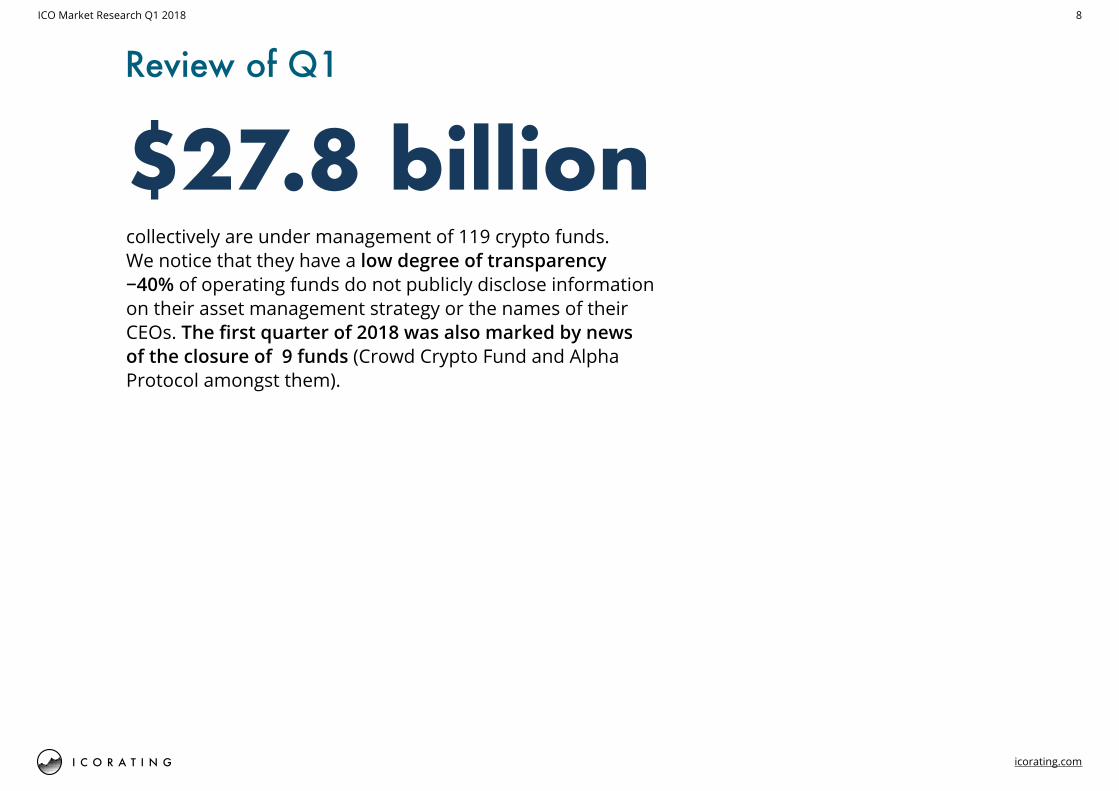
collectively are under management of 119 crypto funds. We notice that they have a low degree of transparency −40% of operating funds do not publicly disclose information on their asset management strategy or the names of their CEOs. The first quarter of 2018 was also marked by news of the closure of 9 funds (Crowd Crypto Fund and Alpha Protocol amongst them).
Review of Q1
$27.8 billion

ICO Market Review
10ICO Market Research Q1 2018
icorating.com
Jan
Jan
Feb
Feb
Mar
Mar
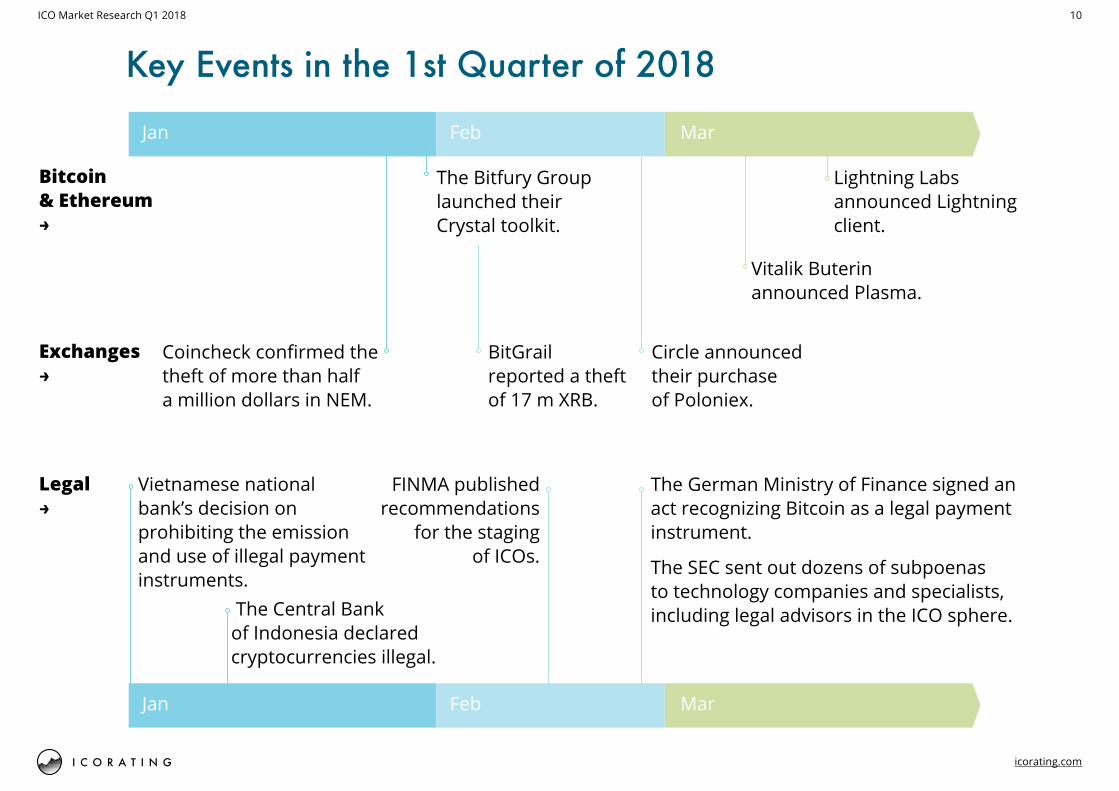
Vitalik Buterin announced Plasma.
Lightning Labs announced Lightning client.
Vietnamese national bank’s decision on prohibiting the emission and use of illegal payment instruments.
The Central Bank of Indonesia declared cryptocurrencies illegal.
Coincheck confirmed the theft of more than half a million dollars in NEM.
BitGrail reported a theft of 17 m XRB.
FINMA published recommendations
for the staging of ICOs.
Circle announced their purchase of Poloniex.
Bitcoin& Ethereum→
Exchanges→
Legal→
The German Ministry of Finance signed an act recognizing Bitcoin as a legal payment instrument.
The SEC sent out dozens of subpoenas to technology companies and specialists, including legal advisors in the ICO sphere.
Key Events in the 1st Quarter of 2018
The Bitfury Group launched their Crystal toolkit.
11ICO Market Research Q1 2018
icorating.com
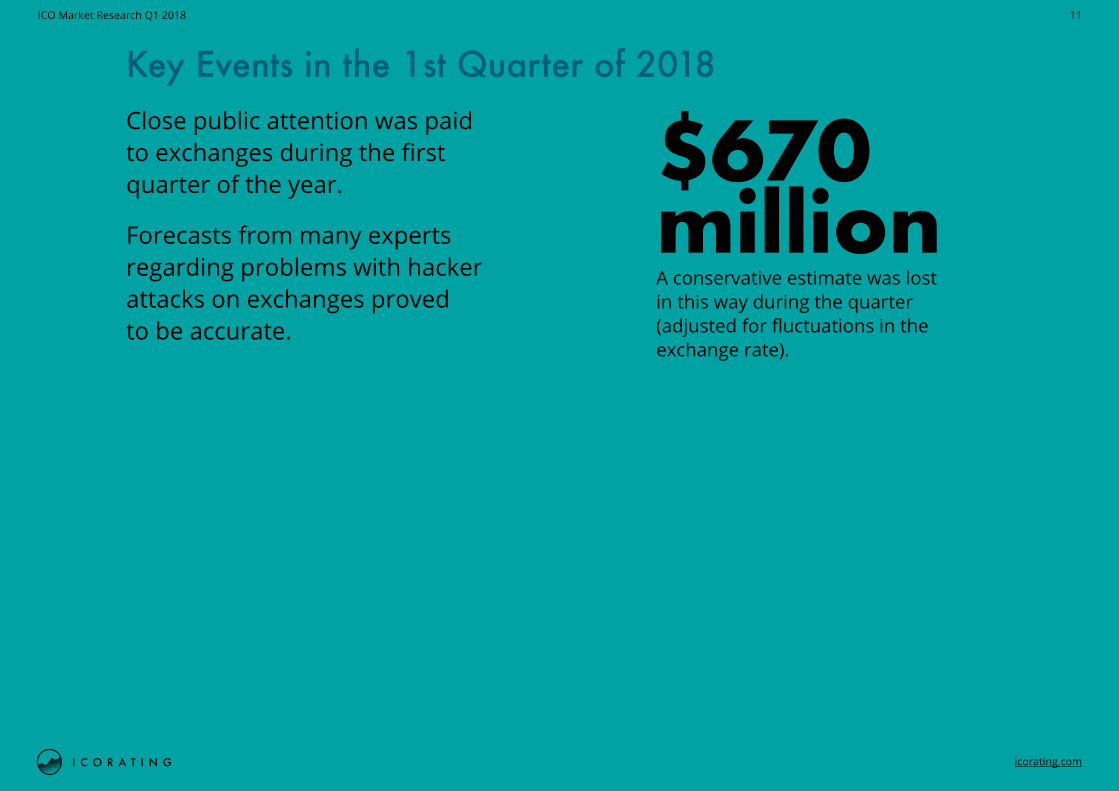
Close public attention was paid to exchanges during the first quarter of the year.
Forecasts from many experts regarding problems with hacker attacks on exchanges proved to be accurate.
A conservative estimate was lost in this way during the quarter (adjusted for fluctuations in the exchange rate).
$670million
Key Events in the 1st Quarter of 2018
12ICO Market Research Q1 2018
icorating.com
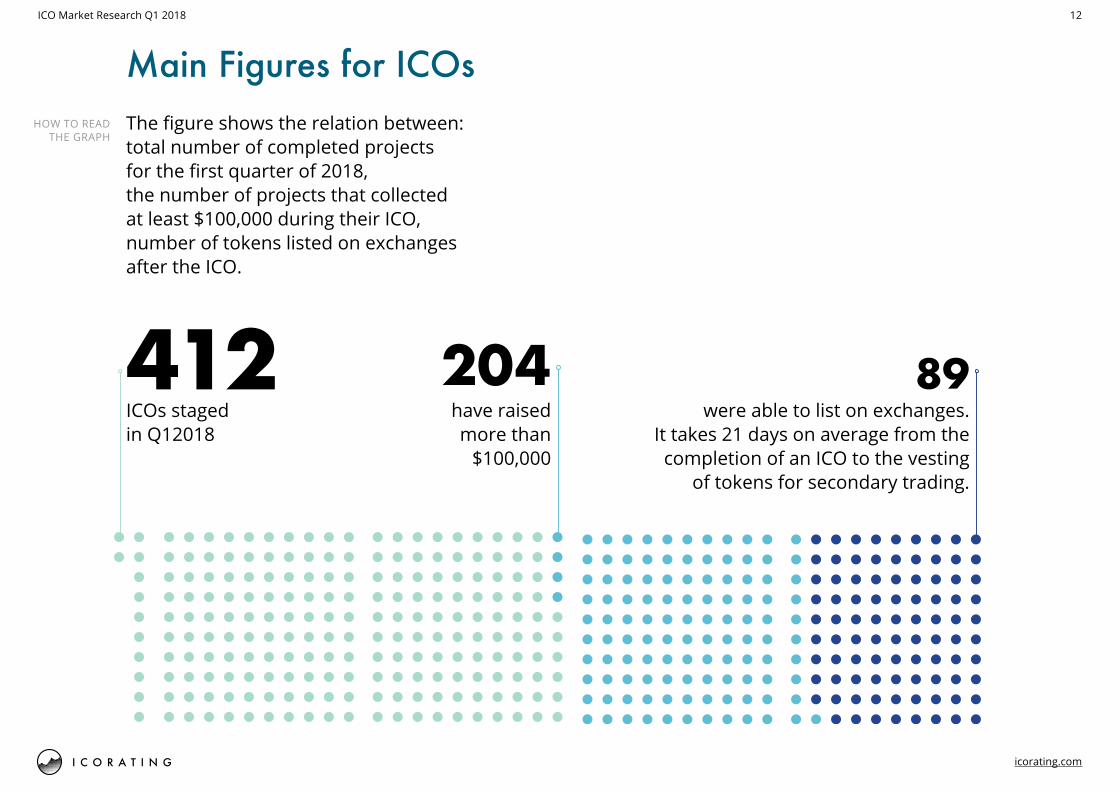
Main Figures for ICOsThe figure shows the relation between: total number of completed projects for the first quarter of 2018, the number of projects that collected at least $100,000 during their ICO, number of tokens listed on exchanges after the ICO.
HOW TO READ THE GRAPH
204 89have raised more than
$100,000
ICOs staged in Q12018
412were able to list on exchanges.
It takes 21 days on average from the completion of an ICO to the vesting
of tokens for secondary trading.

13ICO Market Research Q1 2018
icorating.com
Mar '18Feb '18Jan '18Dec '17Nov '17Oct '17
$600 m
$900 m
$1200 m
$1500 m
40
60
80
↑Total funding
for projects
↑Numberof successful projects
The average amount of funding fell by 2 times in March in comparison with January and February, which is primarily due to market correction (a decrease from $830 billion in January to $258 billion total market cap at the beginning of April) which continued throughout March and due to a decline in the declared hard cap for projects.
Median hard cap fell from $22.5 million in February to $14 million in March.
Number of Successful Projects and Their FundingThe graph shows the relation of total project funding during ICOs by month to the number of successful* projects by month.
*A project is considered successful if a soft cap was reached or the project raised more than $0.5 million in case of the absence of a soft cap.
HOW TO READ THE GRAPH
14ICO Market Research Q1 2018
icorating.com
$100—150 m
$50—100 m
$25—50 m
$10—25m
$5—10 m
$1—5 m
$0.5—1 m
$0—0.5 m
250200150100500Number ofprojects →
Funds raised↓
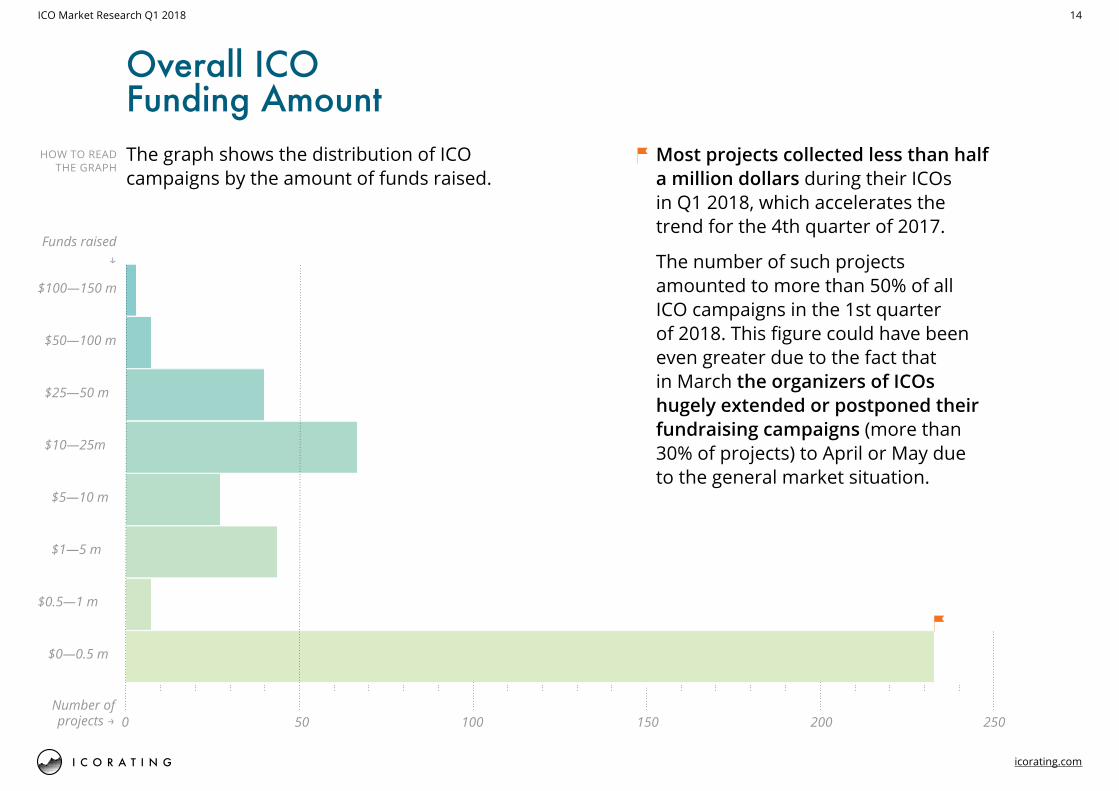
Most projects collected less than half a million dollars during their ICOs in Q1 2018, which accelerates the trend for the 4th quarter of 2017.
The number of such projects amounted to more than 50% of all ICO campaigns in the 1st quarter of 2018. This figure could have been even greater due to the fact that in March the organizers of ICOs hugely extended or postponed their fundraising campaigns (more than 30% of projects) to April or May due to the general market situation.
Overall ICO Funding AmountThe graph shows the distribution of ICO campaigns by the amount of funds raised.
HOW TO READ THE GRAPH
15ICO Market Research Q1 2018
icorating.com
Mobius
YGGDRASH
Hurify
Datawallet
WePower
Nucleus Vision
Fusion
Bloom
Arcblock
Lendroid
Odyssey
Leadcoin
Celsius
SwissBorg
Crypterium
Neuromation
Elastos
Zeepin
Envion
Bankera
$150 million$100 million$50 million0Raised funds →
Projects↓
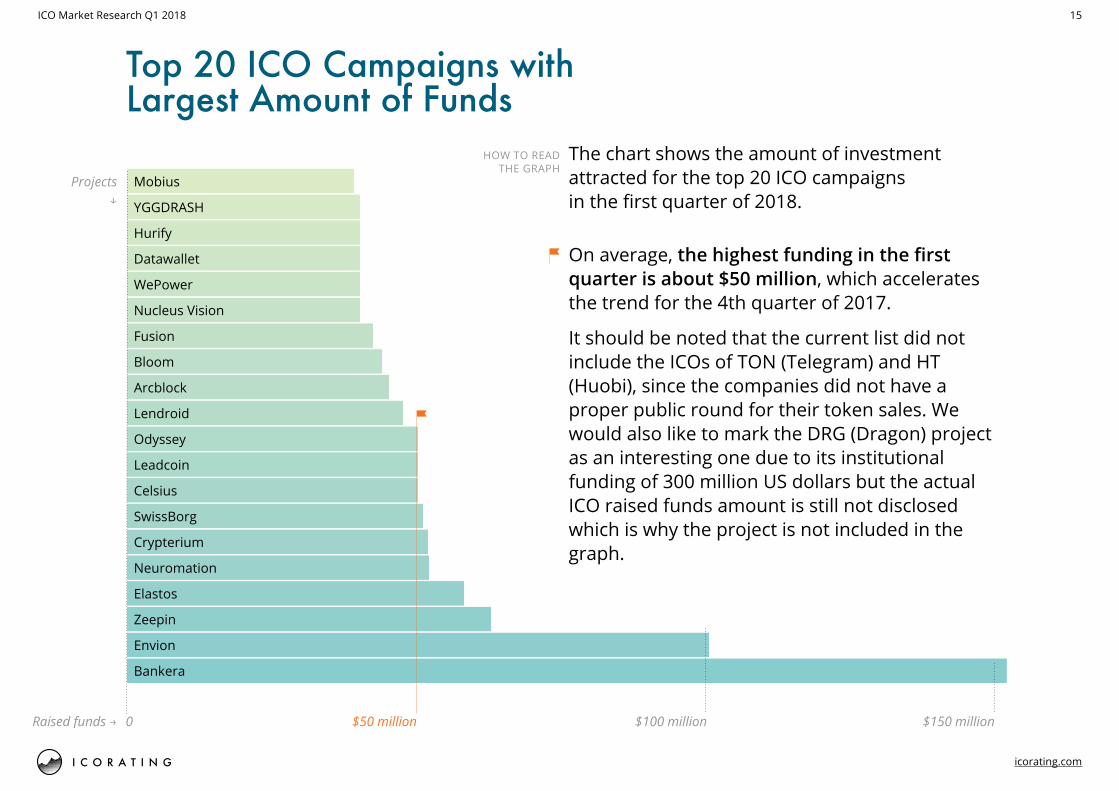
On average, the highest funding in the first quarter is about $50 million, which accelerates the trend for the 4th quarter of 2017.
It should be noted that the current list did not include the ICOs of TON (Telegram) and HT (Huobi), since the companies did not have a proper public round for their token sales. We would also like to mark the DRG (Dragon) project as an interesting one due to its institutional funding of 300 million US dollars but the actual ICO raised funds amount is still not disclosed which is why the project is not included in the graph.
Top 20 ICO Campaigns with Largest Amount of Funds
The chart shows the amount of investment attracted for the top 20 ICO campaigns in the first quarter of 2018.
HOW TO READ THE GRAPH
16ICO Market Research Q1 2018
icorating.com
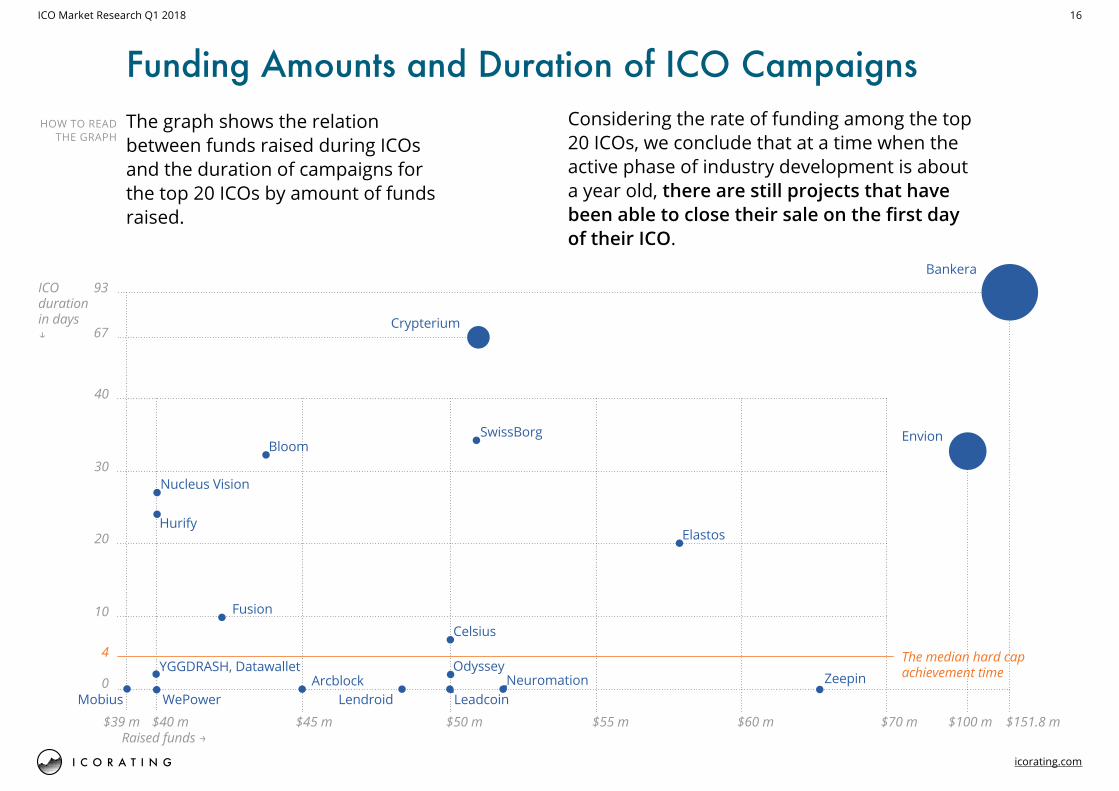
Funding Amounts and Duration of ICO Campaigns
Mobius LeadcoinNeuromation
Odyssey
Celsius
Fusion
LendroidArcblock
Elastos
$50 m $55 m $60 m $70 m$45 m$40 m $151.8 m$100 m$39 m
10
0
4
20
30
67
93
40
Raised funds →
ICOdurationin days↓
Nucleus Vision
Hurify
BloomSwissBorg Envion
Crypterium
Bankera
ZeepinThe median hard capachievement time
WePower
YGGDRASH, Datawallet
The graph shows the relation between funds raised during ICOs and the duration of campaigns for the top 20 ICOs by amount of funds raised.
Considering the rate of funding among the top 20 ICOs, we conclude that at a time when the active phase of industry development is about a year old, there are still projects that have been able to close their sale on the first day of their ICO.
HOW TO READ THE GRAPH

Tokens and Products

18ICO Market Research Q1 2018
icorating.com
Having analyzed statistics from ICO campaigns, we determined:
What value and meaning organizers give to the token they aim to sell.
Stage of development of the product offered to the market. How many projects are planning to tokenize an existing business.
Tokens and Products
A
B
C
19ICO Market Research Q1 2018
icorating.com
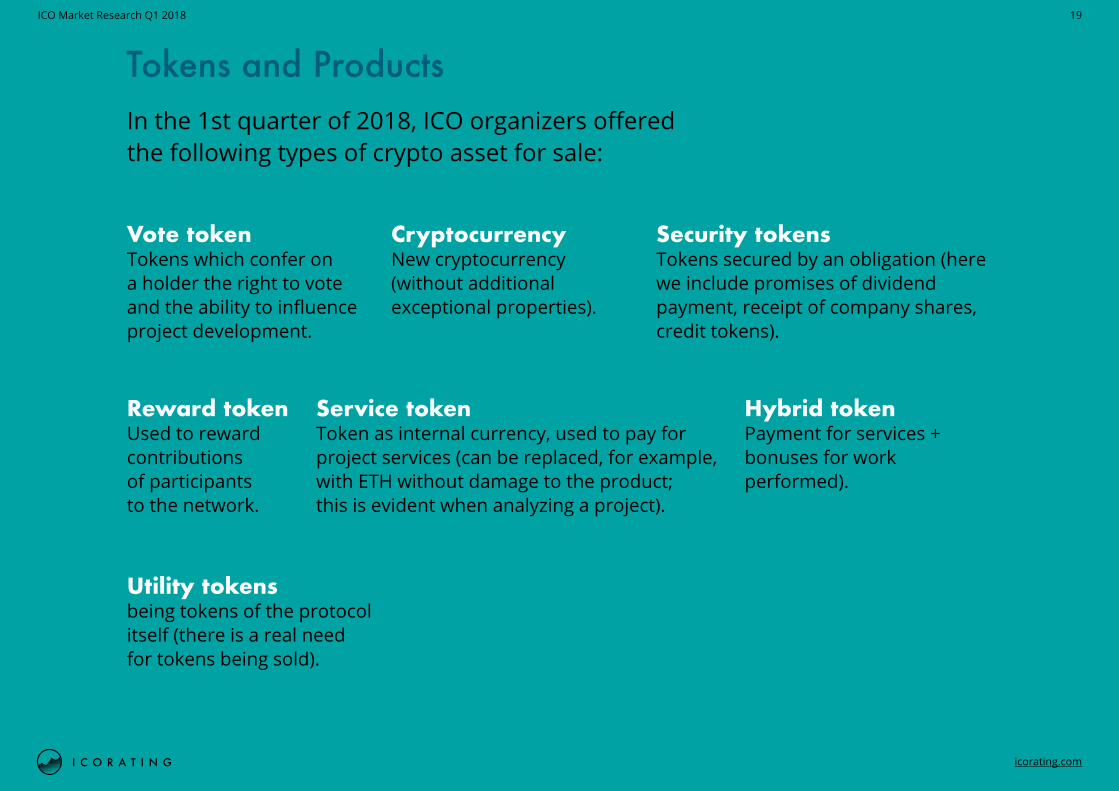
Vote token Tokens which confer on a holder the right to vote and the ability to influence project development.
In the 1st quarter of 2018, ICO organizers offered the following types of crypto asset for sale:
Security tokens Tokens secured by an obligation (here we include promises of dividend payment, receipt of company shares, credit tokens).
Cryptocurrency New cryptocurrency (without additional exceptional properties).
Reward token Used to reward contributions of participants to the network.
Service token Token as internal currency, used to pay for project services (can be replaced, for example, with ETH without damage to the product; this is evident when analyzing a project).
Hybrid token Payment for services + bonuses for work performed).
Utility tokens being tokens of the protocol itself (there is a real need for tokens being sold).
Tokens and Products
20ICO Market Research Q1 2018
icorating.com
3.8% Cryptocurrency3.6% Utility token
2.9% Reward token
1.7% Vote token
13.1%Securitytoken
9.3%Hybridtoken
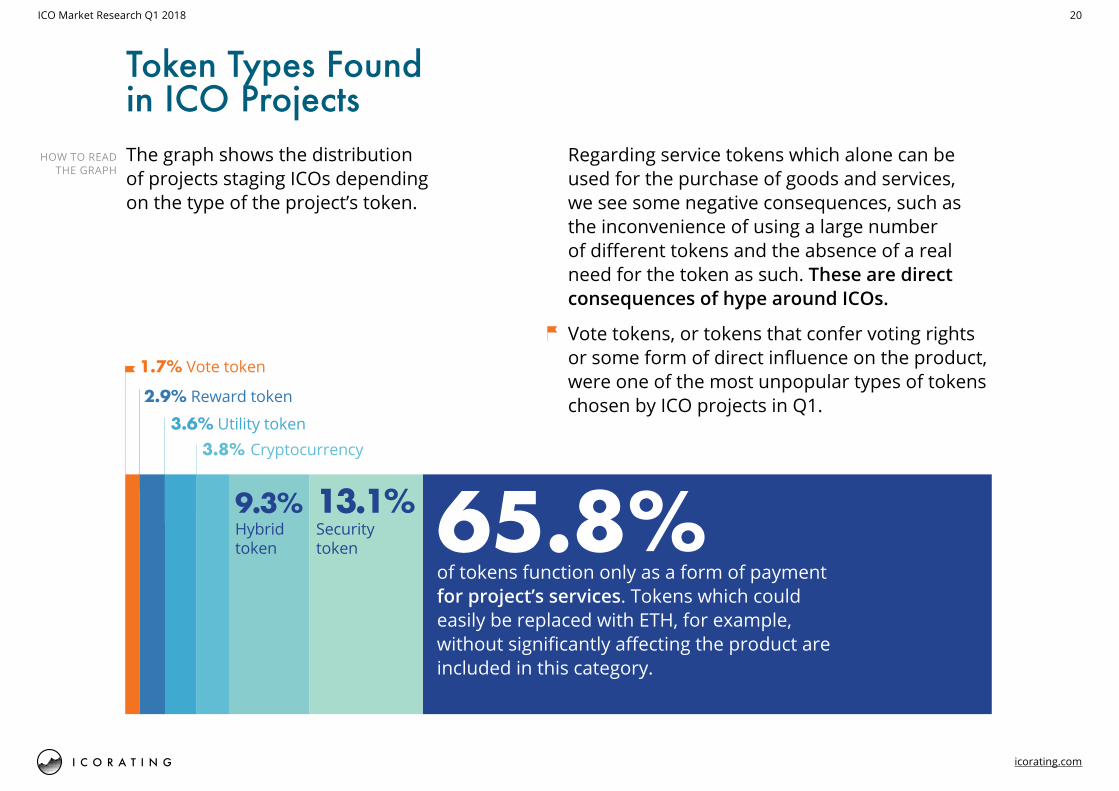
Token Types Found in ICO ProjectsThe graph shows the distribution of projects staging ICOs depending on the type of the project’s token.
Regarding service tokens which alone can be used for the purchase of goods and services, we see some negative consequences, such as the inconvenience of using a large number of different tokens and the absence of a real need for the token as such. These are direct consequences of hype around ICOs.
Vote tokens, or tokens that confer voting rights or some form of direct influence on the product, were one of the most unpopular types of tokens chosen by ICO projects in Q1.
of tokens function only as a form of payment for project’s services. Tokens which could easily be replaced with ETH, for example, without significantly affecting the product are included in this category.
65.8%
HOW TO READ THE GRAPH

21ICO Market Research Q1 2018
icorating.com
Mean ICO Funds Raised by Token Type
Vote
Utility
Hybrid
Reward
Security
Service
Cryptocurrency
$20 million$15 million$10 million$5 million0Funds raised →
Tokentypes
↓
The graph shows the distribution of mean funds raised during ICO depending on the type of the project’s token.
While also considering the median raised funds by project’s token type, the most profitable were the projects where tokens were implemented as either a Hybrid token or a part of the ecosystem (Utility token): 14,400,000 USD for Hybrid tokens and 10,450,000 USD for Utility tokens. The median raised funds of the projects with Security, Service and Cryptocurrency tokens were equal to 0.
HOW TO READ THE GRAPH
22ICO Market Research Q1 2018
icorating.com
Number of Unsuccessful ICOs by Token Type
3002001000Projects that raised less than $0.5 million →Overal number of projects →
Tokentypes
↓
Vote
Utility
Hybrid
Reward
Security
Service
Cryptocurrency
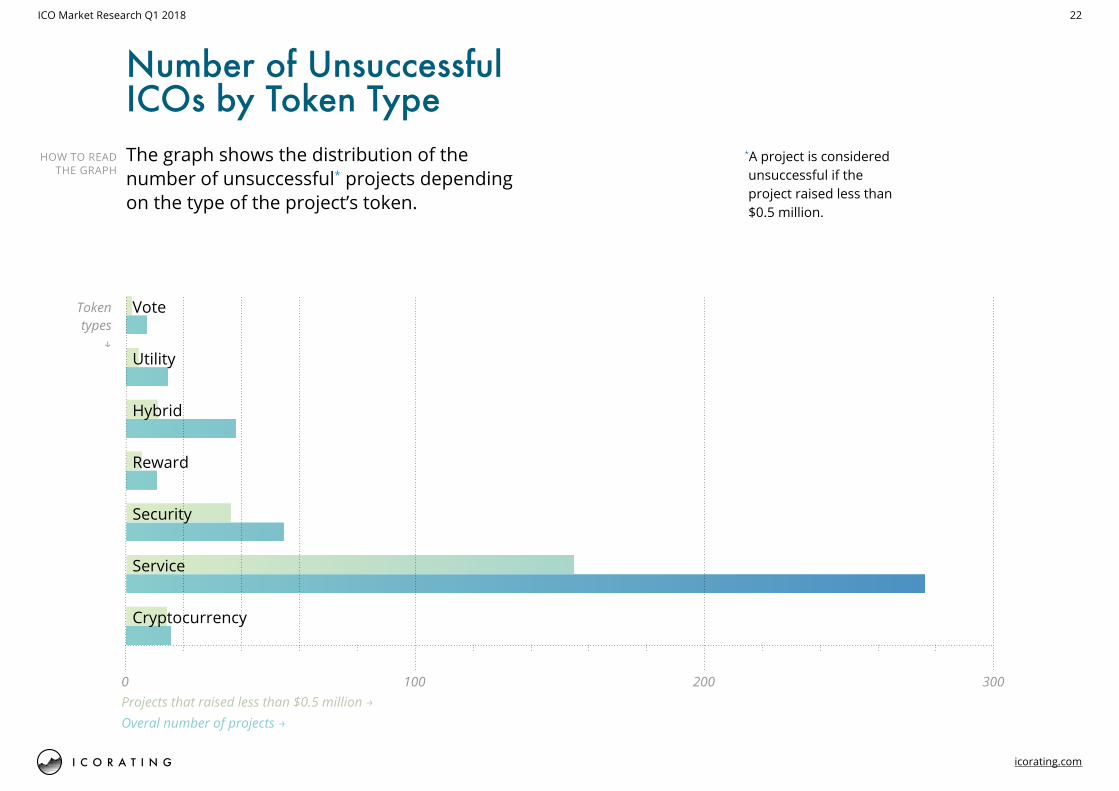
The graph shows the distribution of the number of unsuccessful* projects depending on the type of the project’s token.
*A project is considered unsuccessful if the project raised less than $0.5 million.
HOW TO READ THE GRAPH

23ICO Market Research Q1 2018
icorating.com
11.2%Beta
0.5%Code26.2%
MVP
15.5%Alpha
Development Stages of ICO ProjectsThe graph shows the distribution of projects staging an ICO by development stage of the product at time of the start of their ICO*
Only 37 of 412 projects had a working business before their ICO.
*defined by the project’s team
About half of ICO campaigns did not have any development, which is a negative factor for the industry as such.
Idea46.6%
HOW TO READ THE GRAPH
25ICO Market Research Q1 2018
icorating.com
Commerce & Retail
Blockchain Infrastructure
Computing & Data Storage
Banking & Payments
Gaming & VR
Crowdfunding & Lending
Recruitment & Crowdsourcing
Real Estate
Energy & Utilities
Marketing & Advertising
Social Media & Communication
Identity & Reputation
Data Analytics
Prediction Markets
Gambling & Betting
Business Services
Science & Research
Financial services
Mining
Privacy & Security
$150 m$50 million$20 million0Meanhard cap →
Industries↓
Top 20 Project Industries by Mean Hard Cap
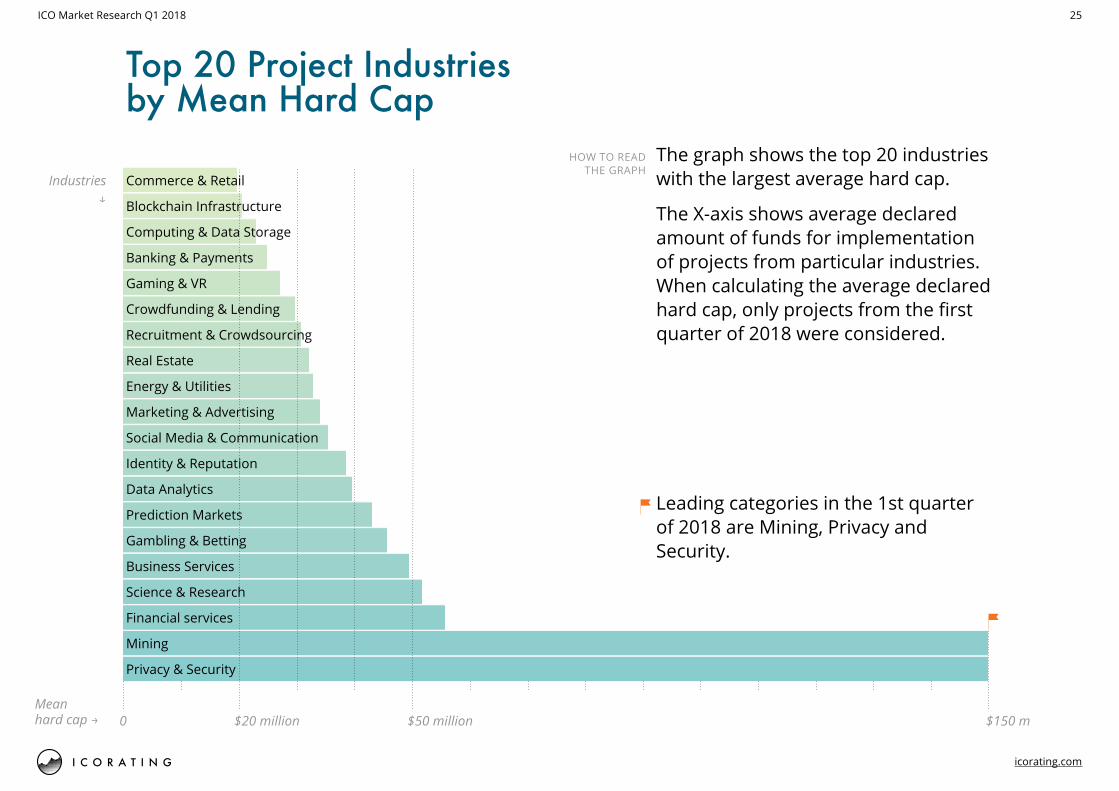
The graph shows the top 20 industries with the largest average hard cap.
The X-axis shows average declared amount of funds for implementation of projects from particular industries. When calculating the average declared hard cap, only projects from the first quarter of 2018 were considered.
Leading categories in the 1st quarter of 2018 are Mining, Privacy and Security.
HOW TO READ THE GRAPH

26ICO Market Research Q1 2018
icorating.com
Top 10 Most Popular IndustriesThe graph shows the top 10 industries by the number of projects belonging to these industries.
Gambling & Betting
Recruitment & Crowdsourcing
Trading
Commerce & Retail
Social Media & Communication
Drugs & Healthcare
Gaming & VR
Marketing & Advertising
Blockchain Infrastructure
Exchanges & Wallets
Financial Services
403020100Number ofprojects →
Industries↓
The most popular industries are still Exchanges, Financial Services, Gaming and Blockchain Infrastructure.
Comparing the most popular industries in Q1 2018 (by number of projects staging an ICO) with results from 2017, we see only minor changes.
HOW TO READ THE GRAPH
27ICO Market Research Q1 2018
icorating.com
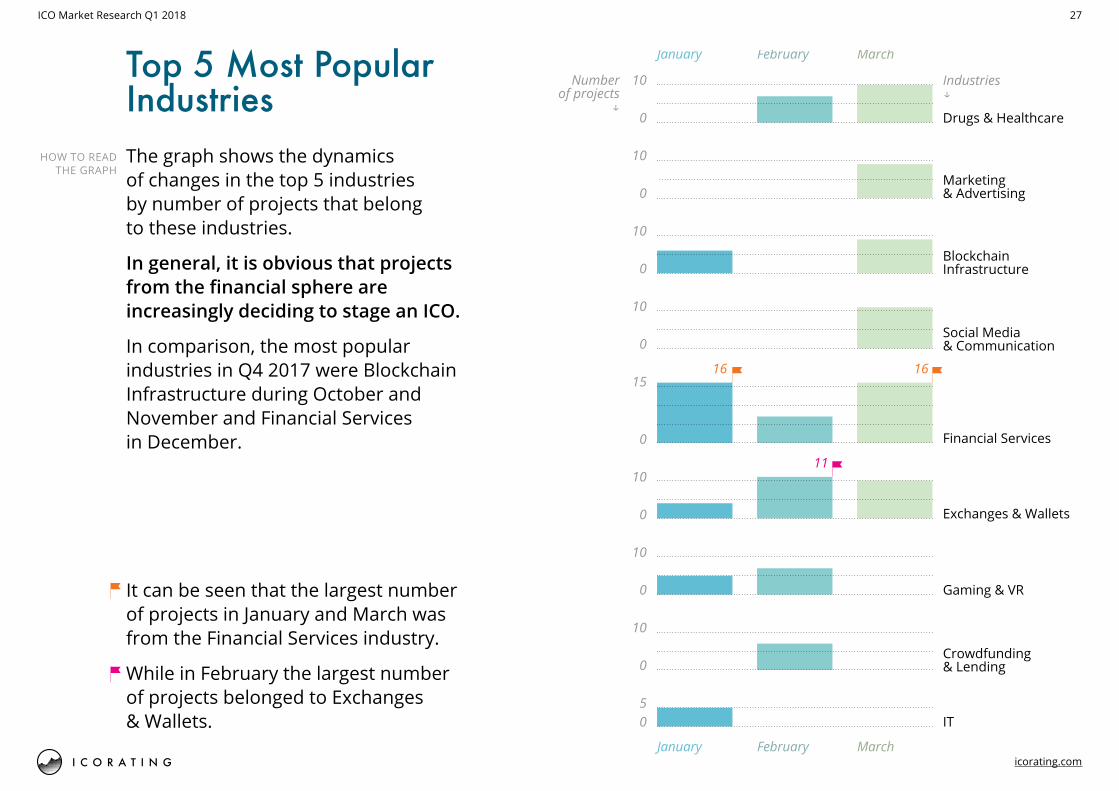
Top 5 Most Popular IndustriesThe graph shows the dynamics of changes in the top 5 industries by number of projects that belong to these industries.
In general, it is obvious that projects from the financial sphere are increasingly deciding to stage an ICO.
In comparison, the most popular industries in Q4 2017 were Blockchain Infrastructure during October and November and Financial Services in December.
It can be seen that the largest number of projects in January and March was from the Financial Services industry.
While in February the largest number of projects belonged to Exchanges & Wallets.
0
10
0
10
0
10
0
10
January
Drugs & Healthcare
Marketing& Advertising
Financial Services
Exchanges & Wallets
0
15
0
10
0
10
0
10
05
February March
January February March
Gaming & VR
Crowdfunding& Lending
IT
Social Media& Communication
BlockchainInfrastructure
Industries↓
Numberof projects
↓
16 16
11
HOW TO READ THE GRAPH

28ICO Market Research Q1 2018
icorating.com
Top 10 Industries by Funds Raised During Q1 2018The graph shows the top 10 industries by amount raised.
Mining
IT
Commerce & Retail
Computing & Data Storage
Marketing & Advertising
Crowdfunding & Lending
Exchanges & Wallets
Blockchain Infrastructure
Banking & Payments
Financial Services
$300 million $400 m$200 million$100 million0Fundsraised →
Industries↓
Leading industries for funds raised such as Exchanges, Blockchain Infrastructure, and Financial Services match the above-mentioned leaders in number of outgoing projects in their respective categories.
HOW TO READ THE GRAPH
29ICO Market Research Q1 2018
icorating.com
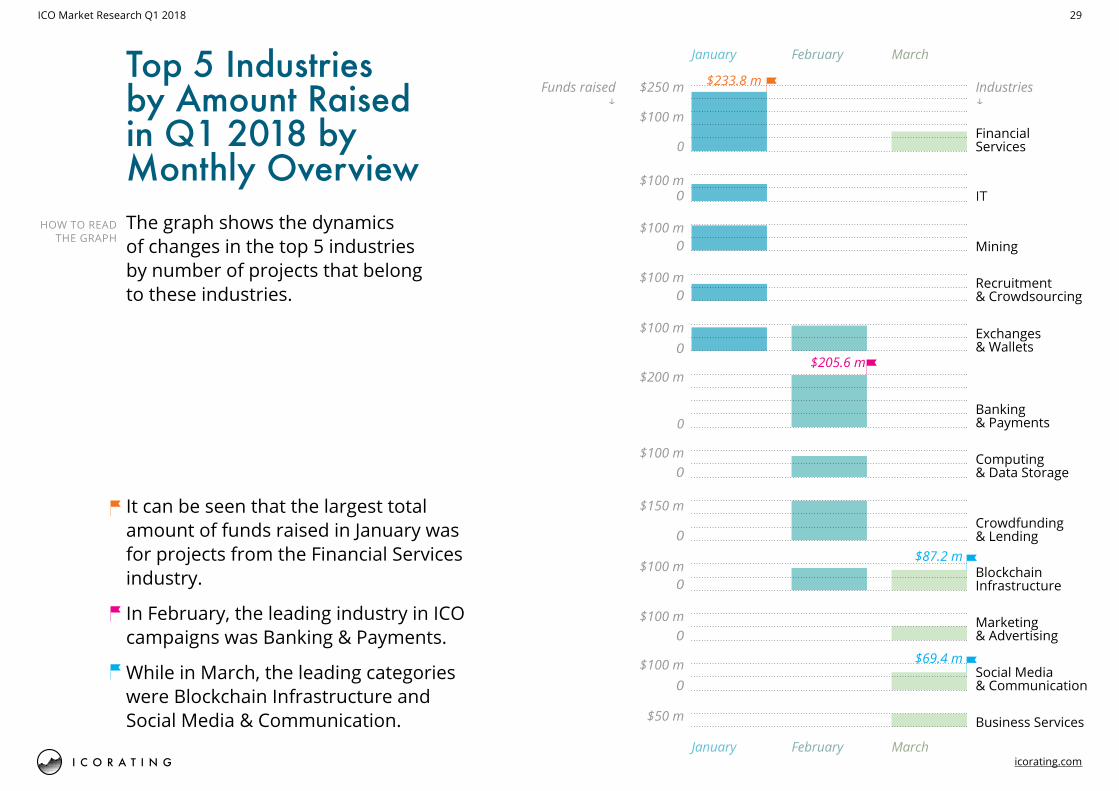
Top 5 Industries by Amount Raised in Q1 2018 by Monthly OverviewThe graph shows the dynamics of changes in the top 5 industries by number of projects that belong to these industries.
It can be seen that the largest total amount of funds raised in January was for projects from the Financial Services industry.
In February, the leading industry in ICO campaigns was Banking & Payments.
While in March, the leading categories were Blockchain Infrastructure and Social Media & Communication.
Recruitment& Crowdsourcing
Mining
IT
0
$100 m
$250 m
0
$200 m
January February March
January February March
Industries↓
Funds raised↓
Business Services
Social Media& Communication
Marketing& Advertising
BlockchainInfrastructure
Computing& Data Storage
Crowdfunding& Lending
Exchanges& Wallets
FinancialServices
Banking& Payments
0$100 m
0$100 m
0$100 m
0$100 m
0$100 m
0$100 m
0$100 m
0$100 m
$50 m
0
$150 m
$233.8 m
$205.6 m
$87.2 m
$69.4 m
HOW TO READ THE GRAPH
30ICO Market Research Q1 2018
icorating.com
Number of Projects Distributed by Industry
Internet & TelecommunicationsTransportInvestment
$125 m $150 m $175 m $200 m $225 m $250m$100 m$75 m $331.6 m$278.9 m$50 m
0
10
15
27
38
20
Raised funds →
Numberof projects
↓
Gaming & VR
Social Media& Communication
ITComputing & Data Storage
Commerce & Retail
Marketing & Advertising
Banking & Payments
Exchanges & Wallets
Financial Services
Science & Research
Identity& Reputation Mining
Energy & UtilitiesBusiness Services
Blockchain Infrastructure
Recruitment & Crowdsourcing
Crowdfunding & Lending
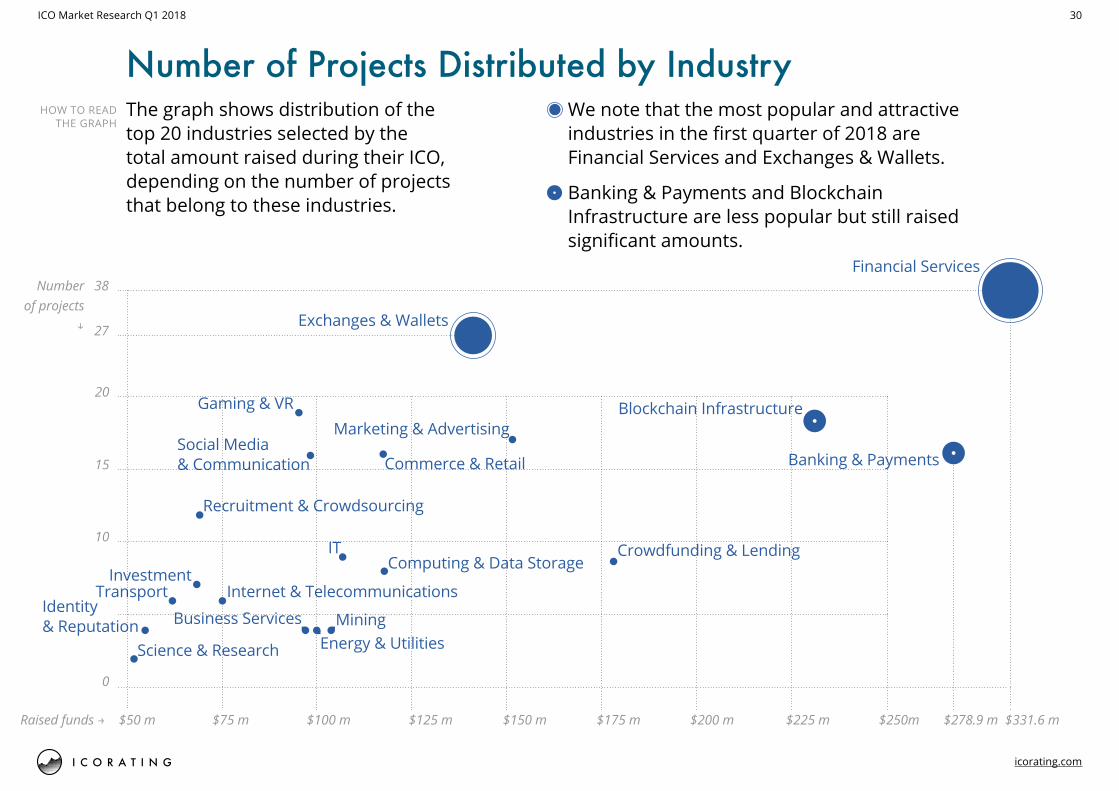
The graph shows distribution of the top 20 industries selected by the total amount raised during their ICO, depending on the number of projects that belong to these industries.
We note that the most popular and attractive industries in the first quarter of 2018 are Financial Services and Exchanges & Wallets.
Banking & Payments and Blockchain Infrastructure are less popular but still raised significant amounts.
HOW TO READ THE GRAPH

ICO Geography

32ICO Market Research Q1 2018
icorating.com
The USA$583.8 m59 projects
Singapore$468.1 m34 projects
The UK$99.7 m26 projects
China$202.1 m9 projects
Switzerland$268.2 m14 projects
Estonia$122.6 m16 projects
Hong Kong$82.1 m13 projects
Russia$20.8 m13 projects
Cayman Islands$96.5 m9 projects British Virgin Islands
$158.5 m5 projects
Canada$16.6 m9 projects
Netherlands$16.8 m6 projects
Gibraltar$133.7 m6 projects
Australia$30 m6 projects
Geographical Distribution for Projects Based on Country of RegistrationThe map shows total investment amount and number of projects, depending on country of registration*
Current leading countries for place of registration are the USA, Singapore and the UK, while in 2017 the leaders were the USA, Singapore, Switzerland, Estonia and the UK.
*Country of registration means the country where the company’s legal entity is registered at the time of the ICO. If a project does not have a legal entity, it is not included in this map. Country of project registration is determined on the basis of open data, including projects’ official websites and open databases of registered companies.
HOW TO READ THE GRAPH

33ICO Market Research Q1 2018
icorating.com
The USA$554 m raised12 projects
Lithuania$242 m raised5 projects China
$312.6 m raised11 projects
Russia$240.6 m raised45 projects
Switzerland$161.6 m5 projects
Singapore$157.4 m10 projects
Ukraine$96 m54 projects
Canada$35.6 m8 projects The UK
$88 m16 projects
India$28.7 m7 projects Indonesia
$35 m1 project
South Korea$76.6 m4 projects
Australia$40.5 m7 projects
France$25.3 m6 projects
Poland$22.6 m5 projects
Slovenia$29.5 m4 projects
Geographical Distribution of Projects Based on Origin of the Project TeamThe map shows total investment amount and number of projects, depending on project country of origin*
The leader countries for staging ICOs are the USA, China, Lithuania and Russia. A quarter of all projects are created by multinational teams. In 2017, the leaders in staging ICOs were the USA, Russia and the UK.
*Country of origin means the country where more than 50% of team members actually reside at the time of the ICO. If projects have an international team, they are not included in this map. Country of origin is determined on the basis of open information about the team, including official project websites and team members’ social media.
HOW TO READ THE GRAPH

34ICO Market Research Q1 2018
icorating.com
Regional Project funding as a Percentage of the Total Amount of Funds RaisedThe map shows project funding as a percentage of total amount raised during the ICO depending on project region. Project region is determined on the basis of data for the country of project origin.
Half of all funds raised are concentrated in projects
from Europe.
5,84%Rest of the world
$139.6 raised funds33 projects
Asia$605.2 raised funds136 projects
North America$589.7 raised funds62 projects
24,68%25,33%Europe 1,054.6 m raised funds 32 projects
46.6%
HOW TO READ THE GRAPH

Post ICO Performance

36ICO Market Research Q1 2018
icorating.com
Growth of Capitalization after ICOThe graph shows the percentage change in market capitalization for projects listed on exchanges.
Current capitalization →
Capitalization change →
$25 m $50 m $75 m $100 m $125 m
0 200% 400% 600% 800% 1,000% 3,457%1,484%
$134.6m $326.5 m0
Projects↓
Token priceexchanges↓
ZilliqaMyTrackNet
FortunaTravelChain
MatrixSoc. Media Market
CreditsTHETA
Nucleus VisionBluzelle
TomoChainTHEKEYTrinity
OriginTrailFusion
BlockportGBX
ArcblockLamdenEthorse
0.0436870.0436870.0440770.015440.4943430.0303380.655630.1182620.0289070.2968390.3710770.0137770.0945420.1113211.930.3278140.1300570.5744030.077290.044518
Raised Funds →
HOW TO READ THE GRAPH

37ICO Market Research Q1 2018
icorating.com
ROI↓
0
$25 m
$50 m
$75 m
$100 m
0
100%
−100%
200%
300%
1,050%
Raisedfunds↓
Projects →
ROI after ICOs of Q1 2018 by Raised FundsThe graph shows the distribution of amount of funds and ROI*
According to results from the 1st quarter of 2018, the median return from tokens is 49.32%. Among those listed on exchanges, 83% of tokens were traded below the ICO price. A large amount of funds raised do not guarantee a high return on investment.
*ROI was calculated using the formula: (Current Value − Beginning Value) / Beginning Value, where Beginning Value is the minimum price for 1 token at the ICO and Current Value is the closing price on March 29, 2018.
During the calculation, 89 tokens from projects of the first quarter of 2018 which were listed on exchanges were considered. Coinmarketcap is the data source.
HOW TO READ THE GRAPH

Crypto Funds

39ICO Market Research Q1 2018
icorating.com
2.4%No info35.2%
Development
8.1%Closed
Number of FundsThe graph shows the distribution of crypto funds by their status at the time of analysis.
Live
119 of the 219 crypto funds analyzed are actively operating. Only 60% of the declared 119 funds currently operating reveal information on their CEO and strategy.
54.3%
The 119 funds indicated collectively have 27.8 billion dollars under their management.
HOW TO READ THE GRAPH

40ICO Market Research Q1 2018
icorating.com
6.7%ICOs, Blockchain Startups
1.4%Crypto, ICOs, BlockchainStartups
4.3%ICOs
2.4%Crypto,
Blockchain Startups
26.7%No information
14.8%ICOs, Crypto
9.5%BlockchainStartups
Distribution of Crypto Funds for Investment ObjectsThe diagram shows the distribution of crypto funds for investment objects at time of analysis.
Around 27% of the funds invest in ICO campaigns.
Cryptocurrencies34.3%
HOW TO READ THE GRAPH

41ICO Market Research Q1 2018
icorating.com
Forecasts and Comments• Funds are ready to invest in ICOs but they are often deterred by
teams’ negligence regarding organization of KYC and AML. These procedures need to be in place, and organized to a high standard, to reduce legal risks.
• Projects considering staging an ICO without any initial development should not attempt to do so, in case of legal issues.
• Post ICO performance is inferior to results from 2017. This is largely due to the lack of value of assets being sold (tokens are not really needed for the system) and their direct correlation with BTC (in 70% of cases).
• Median ROI of tokens in the 1st quarter of 2018 fell by more than 10% compared to ROI of tokens in Q4 2017 (from 60.67% to 49.32%).
• The current market correction will significantly affect the ”perfect performance and huge profitability” of crypto funds shown during 2017. Many funds may be closed, due either to inefficiency or legal problems with regulators. According to results from the first quarter of 2018, the closure of at least 9 funds has already been confirmed. (Crowd Crypto Fund and Alpha Protocol included).
42ICO Market Research Q1 2018
icorating.com
Have a question or want to learn more about market dynamics?Contact us.
You can also subscribe to our weekly market updates at icorating.com and receive fresh market info every week.
The Rating Agency for the ICO Market
Secondary Contact: Steven Campbell Sales & Partnerships Manager+1 646 943 0806 [email protected] York City
Primary Contact:Mikhail MironovHead of Partnerships+31 6 [email protected]