ICMR Symposium on Materials Issues in Hydrogen Generation ... · ICMR Symposium on Materials Issues...
41
Basic Research Needs for the Basic Research Needs for the Hydrogen Economy Hydrogen Economy Mildred Dresselhaus Mildred Dresselhaus Massachusetts Institute of Technology Massachusetts Institute of Technology Cambridge, MA Cambridge, MA ICMR Symposium on Materials Issues in Hydrogen Generation and Storage August 21, 2006 Collaborators H 2 report George Crabtree, ANL Michelle Buchanan, ORNL Collaborators H 2 Research : Gang Chen, MIT Costas Grigoropoulos, UCB Samuel Mao, UC Berkeley Heng Pan, UC Berkeley Xiao Dong Xiang, Intematix Qizhen Xue, Intematix Taofang Zeng, NCSU Vincent Berube, MIT Gregg Radtke, MIT
Transcript of ICMR Symposium on Materials Issues in Hydrogen Generation ... · ICMR Symposium on Materials Issues...
Basic Research Needs for theBasic Research Needs for theHydrogen EconomyHydrogen EconomyMildred Dresselhaus Mildred Dresselhaus
Massachusetts Institute of TechnologyMassachusetts Institute of TechnologyCambridge, MACambridge, MA
ICMR Symposium on Materials Issues in Hydrogen Generation and StorageAugust 21, 2006
Collaborators H2 report
George Crabtree, ANL
Michelle Buchanan, ORNL
Collaborators H2 Research :Gang Chen, MITCostas Grigoropoulos, UCBSamuel Mao, UC BerkeleyHeng Pan, UC BerkeleyXiao Dong Xiang, IntematixQizhen Xue, IntematixTaofang Zeng, NCSUVincent Berube, MITGregg Radtke, MIT
Outline
• Overview of the global energy challenge• Overview of nanostructured materials• Overview of the hydrogen initiative and of
the role that nanoscience and nanotechnology might play
0
2
4
6
8
10
1750 1800 1850 1900 1950 2000 2050
Popu
latio
n (m
illio
ns)
OceaniaN. AmericaS. AmericaEuropeAsiaAfrica
Africa
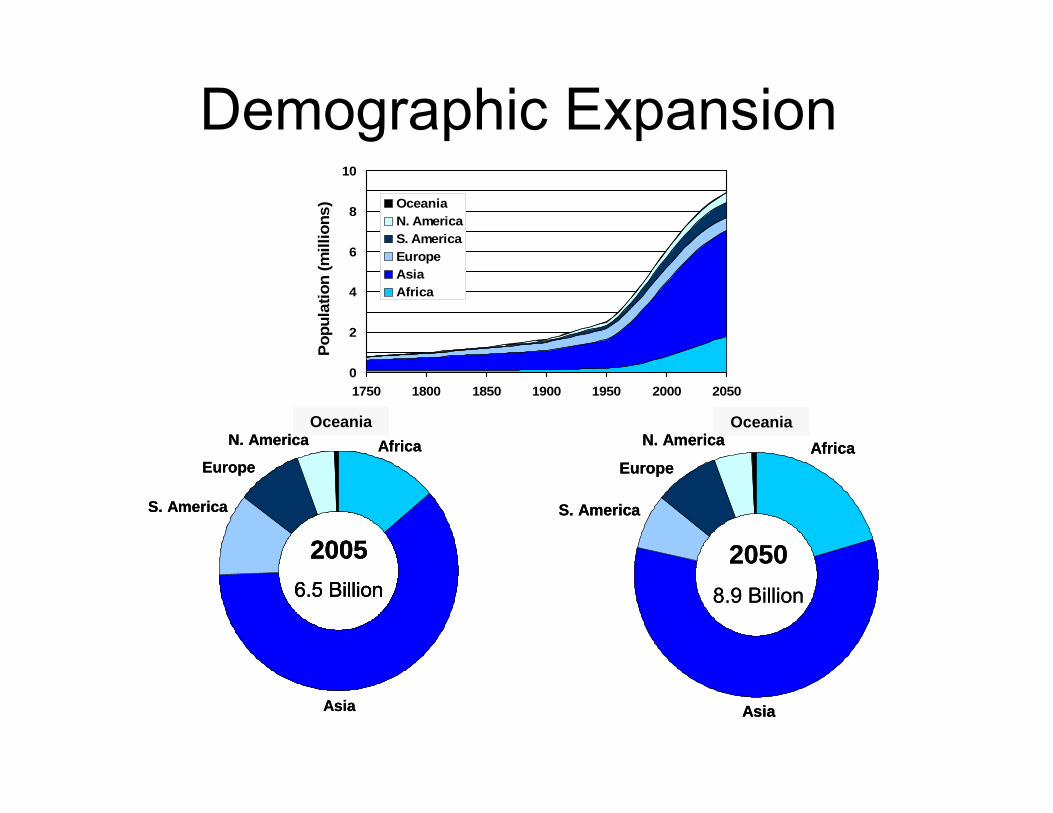
20056.5 Billion
Asia
S. America
Oceana
Europe
N. America Africa
20056.5 Billion
20056.5 Billion
Asia
S. America
Oceana
Europe
N. America
20508.9 Billion
Asia
Africa
S. America
Oceana
Europe
N. America
20508.9 Billion
Asia
Africa
S. America
Oceana
Europe
N. America
Demographic Expansion
Oceania Oceania
0.0
5.0
10.0
15.0
20.0
25.0
1970 1990 2010 2030
TW-y
rs
World Energy Demand total
industrial
developingUS
ee/fsu
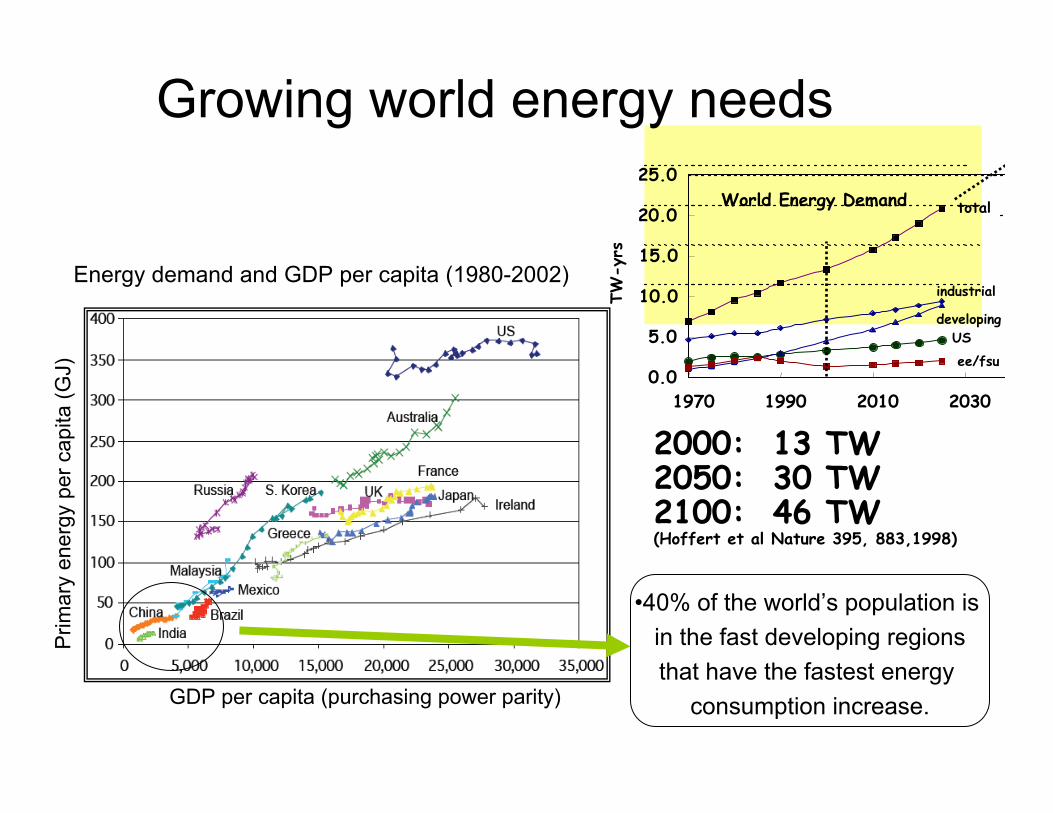
2000: 13 TW2050: 30 TW 2100: 46 TW (Hoffert et al Nature 395, 883,1998)
•40% of the world’s population is in the fast developing regionsthat have the fastest energy
consumption increase.
Prim
ary
ener
gy p
er c
apita
(GJ)
GDP per capita (purchasing power parity)
Energy demand and GDP per capita (1980-2002)
Growing world energy needs
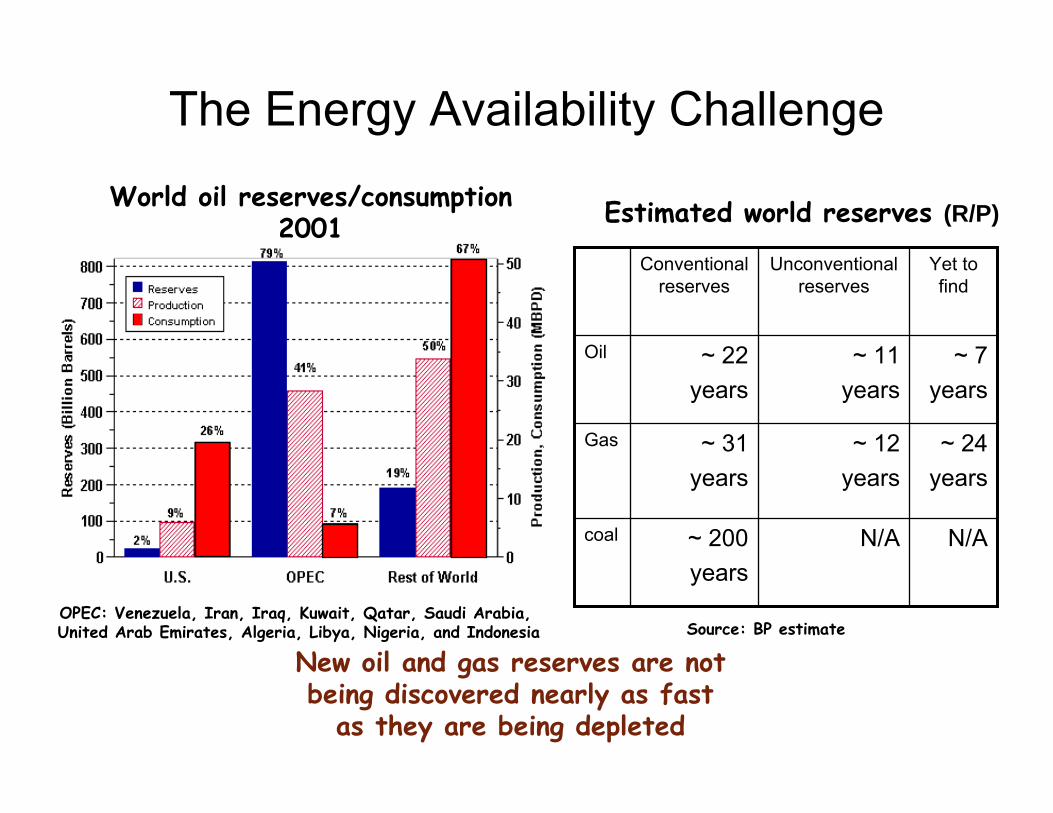
World oil reserves/consumption2001
OPEC: Venezuela, Iran, Iraq, Kuwait, Qatar, Saudi Arabia, United Arab Emirates, Algeria, Libya, Nigeria, and Indonesia
New oil and gas reserves are not being discovered nearly as fast
as they are being depleted
N/AN/A~ 200years
coal
~ 24years
~ 12years
~ 31years
Gas
~ 7years
~ 11years
~ 22years
Oil
Yet to find
Unconventional reserves
Conventional reserves
Source: BP estimate
Estimated world reserves (R/P)
The Energy Availability Challenge
05
101520253035404550
Oil
Coal Gas
Fission
Biomass
Hydroe
lectric
Solar, w
ind, g
eother
mal
0.5%
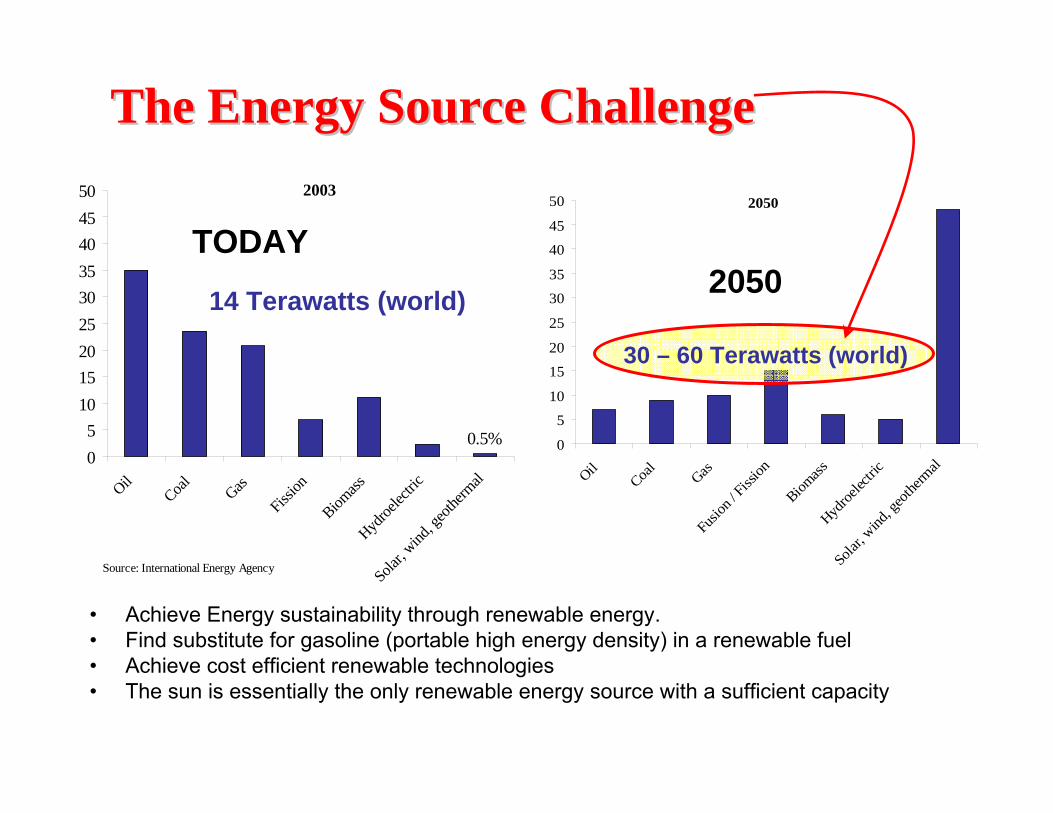
Source: International Energy Agency
2003
0
5
10
15
20
25
30
35
40
45
50
Oil
Coal
GasFusi
on / F
ission
Biomass
Hydroe
lectric
Solar, w
ind, g
eothe
rmal
2050
The Energy Source ChallengeThe Energy Source Challenge
14 Terawatts (world)
30 – 60 Terawatts (world)
TODAY2050
• Achieve Energy sustainability through renewable energy.• Find substitute for gasoline (portable high energy density) in a renewable fuel• Achieve cost efficient renewable technologies• The sun is essentially the only renewable energy source with a sufficient capacity
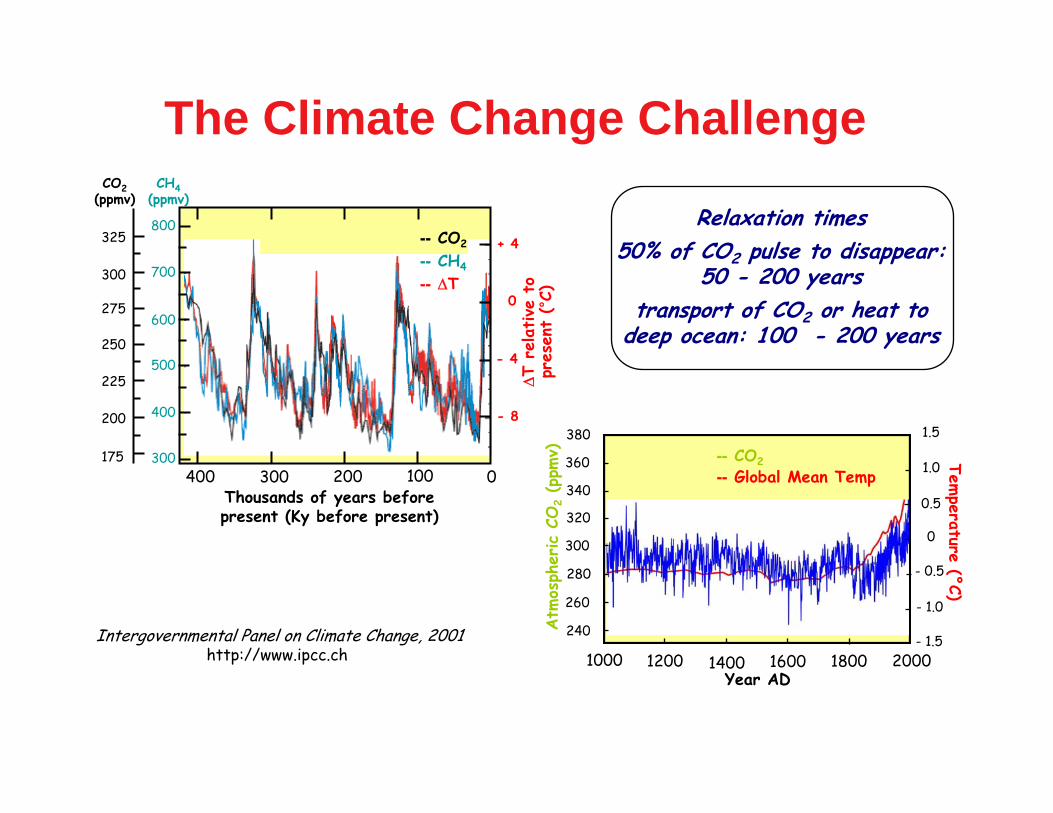
The Climate Change Challenge
300
400
500
600
700
800
- 8
- 4
0
+ 4
400 300 200 100Thousands of years before present (Ky before present)
0
∆T
relative
to
pres
ent
(°C)
CH4(ppmv)
-- CO2
-- CH4
-- ∆T
325
300
275
250
225
200
175
CO2(ppmv)
12001000 1400 1600 1800 2000
240
260
280
300
320
340
360
380
Year AD
Atm
osph
eric C
O2(p
pmv) Tem
perature (°C)
- 1.5
- 1.0
- 0.5
0
0.5
1.0
1.5
-- CO2-- Global Mean Temp
Relaxation times50% of CO2 pulse to disappear:
50 - 200 yearstransport of CO2 or heat to
deep ocean: 100 - 200 years
Intergovernmental Panel on Climate Change, 2001http://www.ipcc.ch
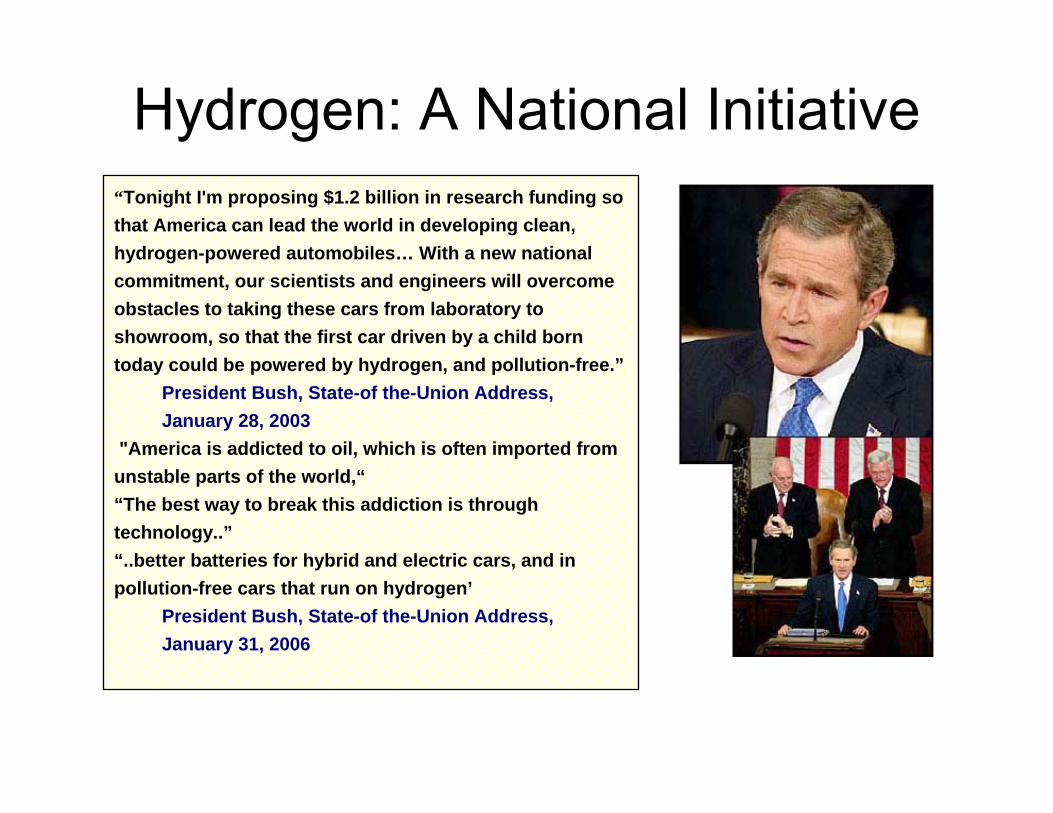
“Tonight I'm proposing $1.2 billion in research funding so that America can lead the world in developing clean, hydrogen-powered automobiles… With a new national commitment, our scientists and engineers will overcome obstacles to taking these cars from laboratory to showroom, so that the first car driven by a child born today could be powered by hydrogen, and pollution-free.”
President Bush, State-of the-Union Address, January 28, 2003
"America is addicted to oil, which is often imported from unstable parts of the world,““The best way to break this addiction is through technology..”“..better batteries for hybrid and electric cars, and in pollution-free cars that run on hydrogen’
President Bush, State-of the-Union Address, January 31, 2006
Hydrogen: A National Initiative
Outline
• Overview of the global energy challenge• Overview of nanostructured materials• Overview of the hydrogen initiative/ the
role that nanoscience and nanotechnology might play
Why Nanostructural materials are important for
energy-based applications
• New desirable properties are available at the nanoscale but not found in conventional 3D materials-e.g., higher diffusion coefficient to promote hydrogen release
• Higher surface area – promotes catalytic interactions
• Independent control of materials parameters which are interdependent for 3D – e.g., strong binding of H2 to substrate and rapid H2 release
0
500
1000
1500
2000
2500
1997 1998 1999 2000 2001 2002
mill
ions
$ /
year
W. EuropeJapanUSAOthersTotal
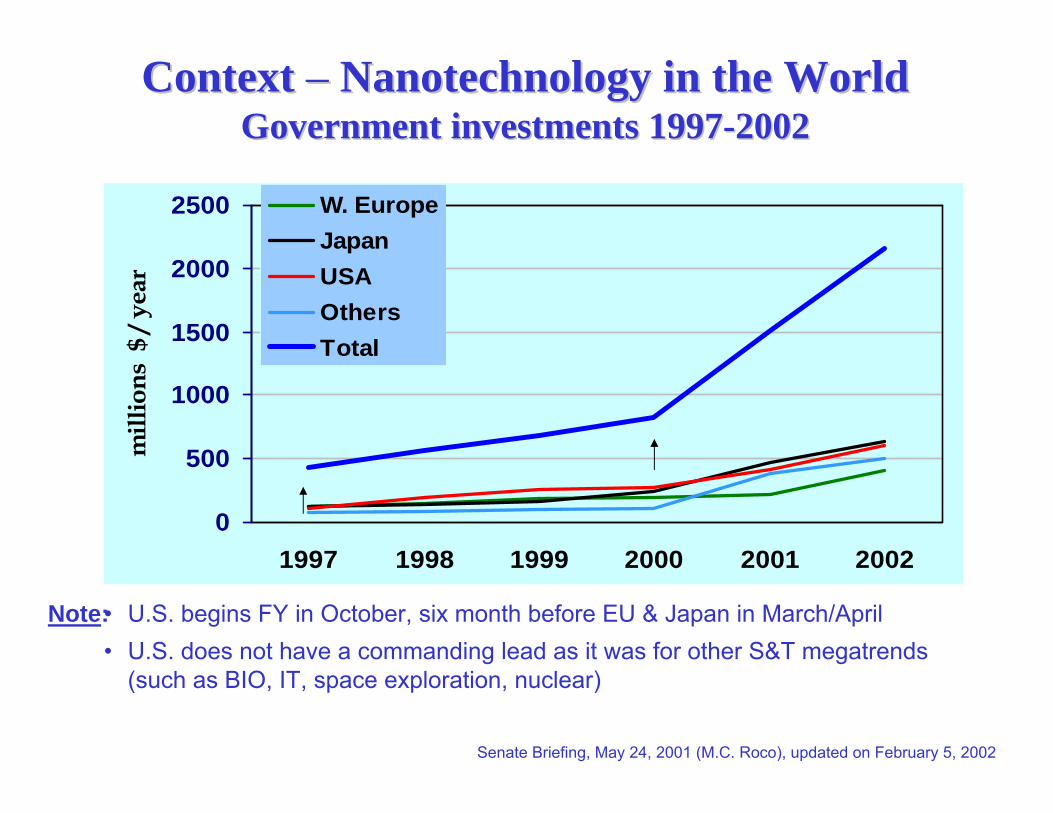
Senate Briefing, May 24, 2001 (M.C. Roco), updated on February 5, 2002
• U.S. begins FY in October, six month before EU & Japan in March/April• U.S. does not have a commanding lead as it was for other S&T megatrends
(such as BIO, IT, space exploration, nuclear)
Context Context –– Nanotechnology in the WorldNanotechnology in the WorldGovernment investments 1997Government investments 1997--20022002
Note:
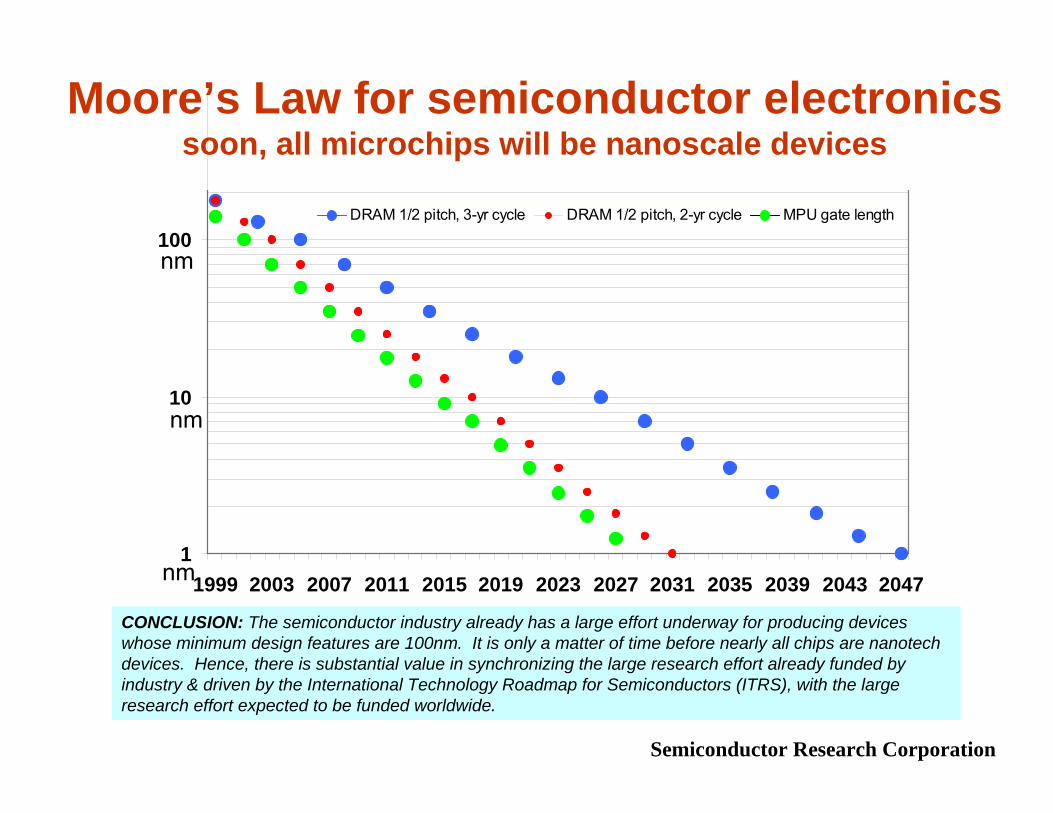
Moore’s Law for semiconductor electronicssoon, all microchips will be nanoscale devices
CONCLUSION: The semiconductor industry already has a large effort underway for producing devices whose minimum design features are 100nm. It is only a matter of time before nearly all chips are nanotech devices. Hence, there is substantial value in synchronizing the large research effort already funded by industry & driven by the International Technology Roadmap for Semiconductors (ITRS), with the large research effort expected to be funded worldwide.
1
10
100
1999 2003 2007 2011 2015 2019 2023 2027 2031 2035 2039 2043 2047
nm
nm
nm
DRAM 1/2 pitch, 3-yr cycle DRAM 1/2 pitch, 2-yr cycle MPU gate length
Semiconductor Research Corporation
Extension of Moore’s Law to the Energy Industry
– Moore’s law has for many years been working to set goals for electronics, opto-electronics, and magneticsindustries.
– We now need to apply Moore’s law to set goals for the energy industry.
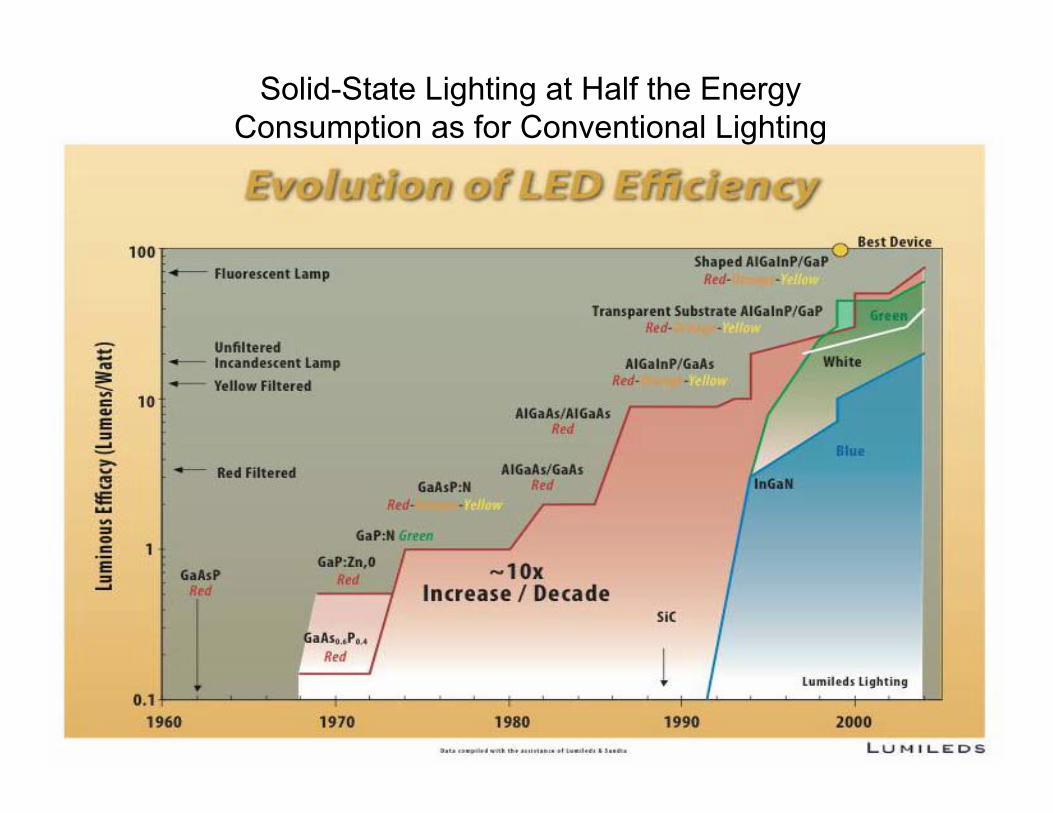
Solid-State Lighting at Half the Energy Consumption as for Conventional Lighting
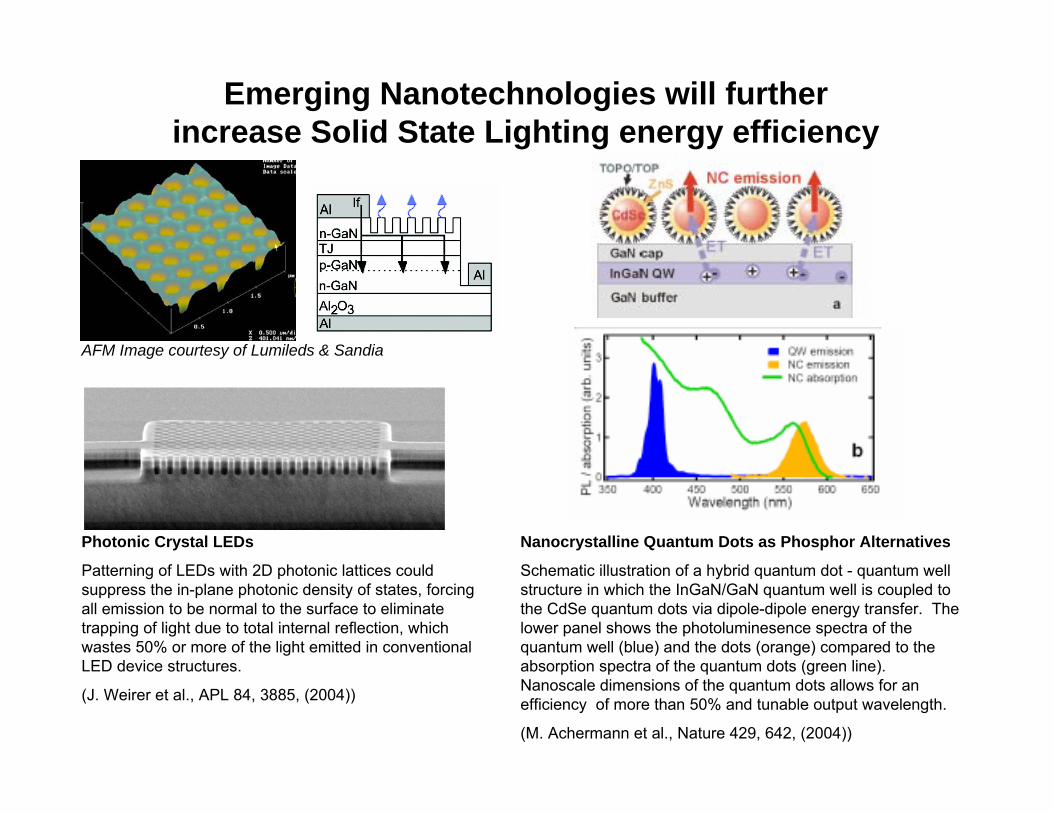
Emerging Nanotechnologies will further increase Solid State Lighting energy efficiency
Nanocrystalline Quantum Dots as Phosphor Alternatives
Schematic illustration of a hybrid quantum dot - quantum well structure in which the InGaN/GaN quantum well is coupled to the CdSe quantum dots via dipole-dipole energy transfer. The lower panel shows the photoluminesence spectra of the quantum well (blue) and the dots (orange) compared to the absorption spectra of the quantum dots (green line). Nanoscale dimensions of the quantum dots allows for an efficiency of more than 50% and tunable output wavelength.
(M. Achermann et al., Nature 429, 642, (2004))
Photonic Crystal LEDs
Patterning of LEDs with 2D photonic lattices could suppress the in-plane photonic density of states, forcing all emission to be normal to the surface to eliminate trapping of light due to total internal reflection, which wastes 50% or more of the light emitted in conventional LED device structures.
(J. Weirer et al., APL 84, 3885, (2004))
AFM Image courtesy of Lumileds & Sandia
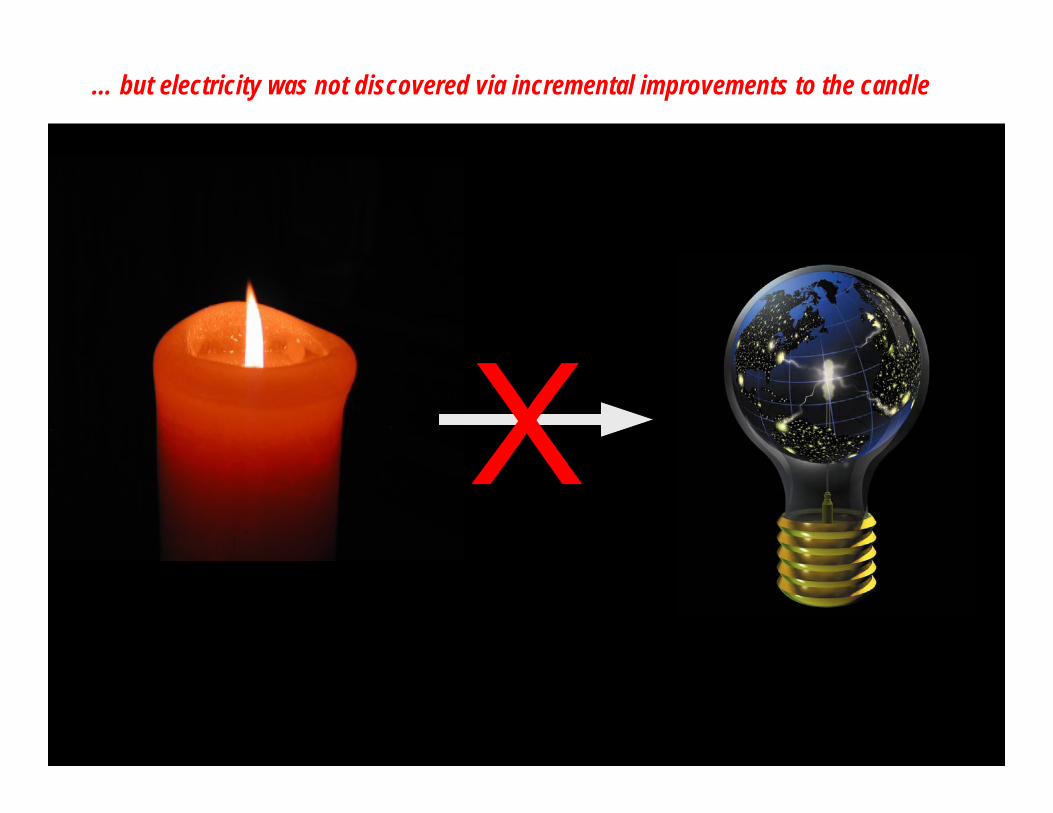
… but electricity was not discovered via incremental improvements to the candle
Outline
• Overview of the global energy challenge• Overview of nanostructured materials• Overview of the hydrogen initiative/ the
role that nanoscience and nanotechnology might play
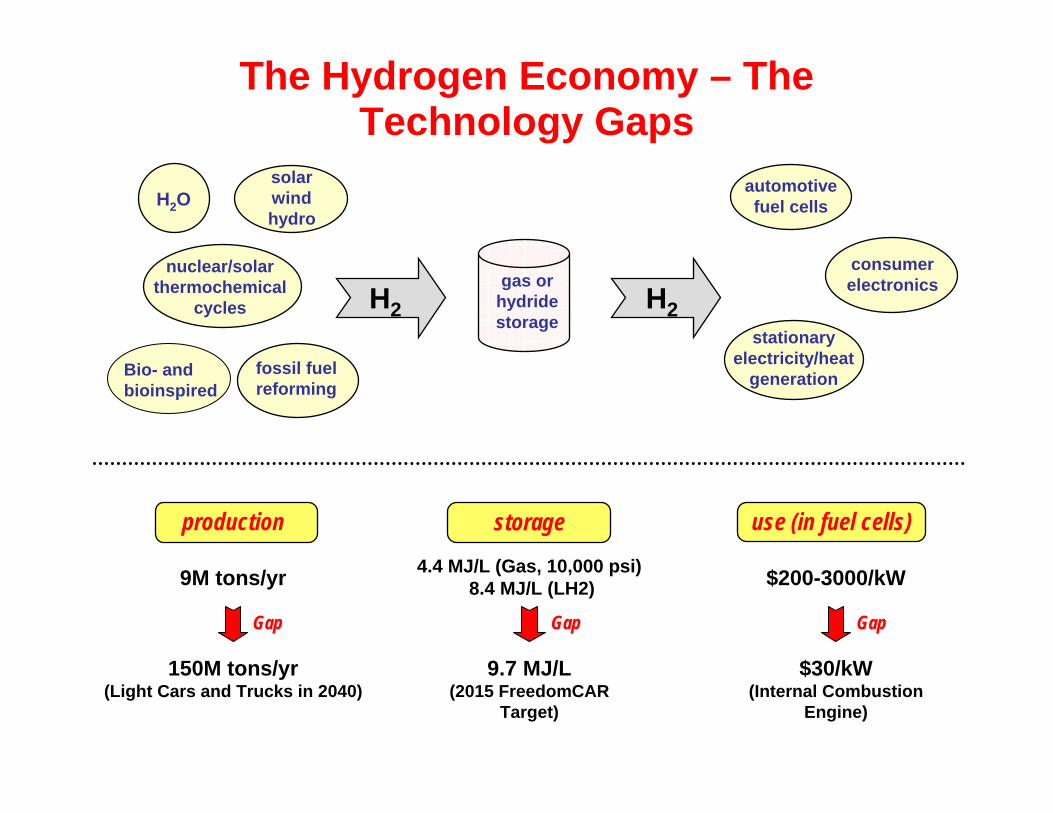
The Hydrogen Economy – TheTechnology Gaps
use (in fuel cells)
gas orhydridestorage
H2 H2
production storage
solarwindhydro
fossil fuelreforming
nuclear/solar thermochemical
cycles
automotivefuel cells
stationaryelectricity/heat
generation
consumerelectronics
H2O
Bio- and bioinspired
9M tons/yr
150M tons/yr(Light Cars and Trucks in 2040)
9.7 MJ/L(2015 FreedomCAR
Target)
4.4 MJ/L (Gas, 10,000 psi)8.4 MJ/L (LH2) $200-3000/kW
$30/kW(Internal Combustion
Engine)
GapGap GapGap GapGap
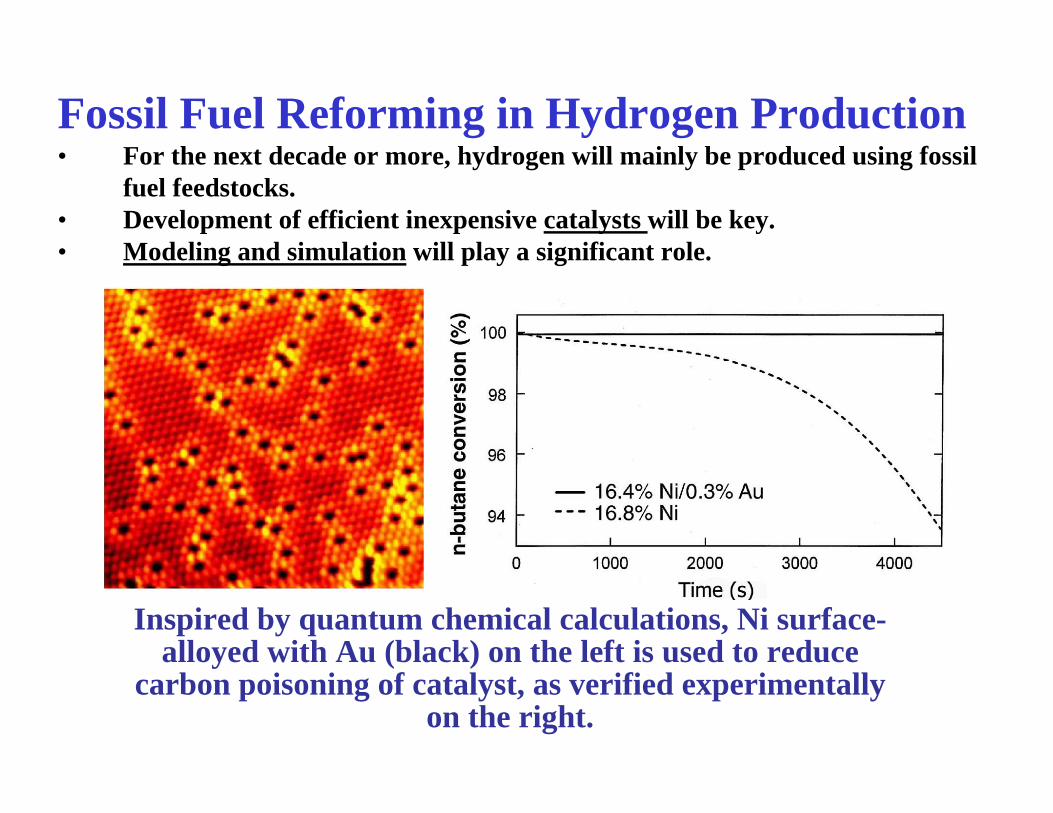
Fossil Fuel Reforming in Hydrogen Production• For the next decade or more, hydrogen will mainly be produced using fossil
fuel feedstocks. • Development of efficient inexpensive catalysts will be key. • Modeling and simulation will play a significant role.
Inspired by quantum chemical calculations, Ni surface-alloyed with Au (black) on the left is used to reduce
carbon poisoning of catalyst, as verified experimentally on the right.
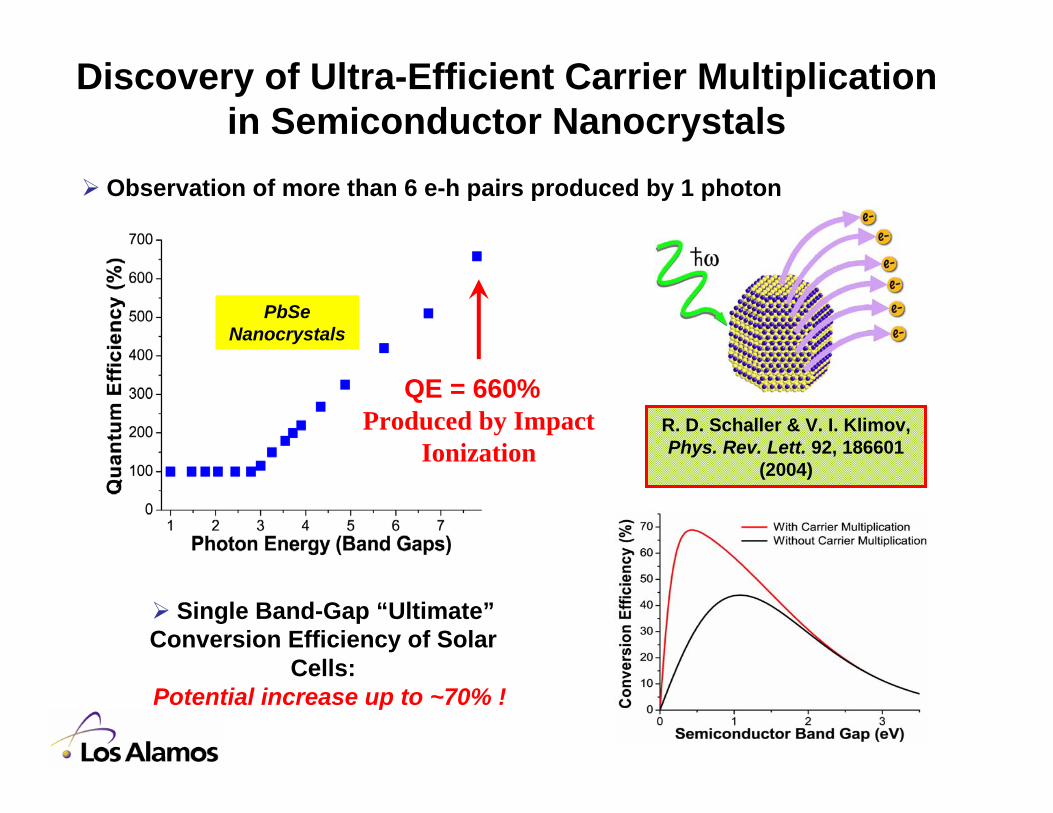
Discovery of Ultra-Efficient Carrier Multiplication in Semiconductor Nanocrystals
R. D. Schaller & V. I. Klimov, Phys. Rev. Lett. 92, 186601
(2004)
Observation of more than 6 e-h pairs produced by 1 photon
Single Band-Gap “Ultimate”Conversion Efficiency of Solar
Cells: Potential increase up to ~70% !
PbSeNanocrystals
QE = 660%Produced by Impact
Ionization
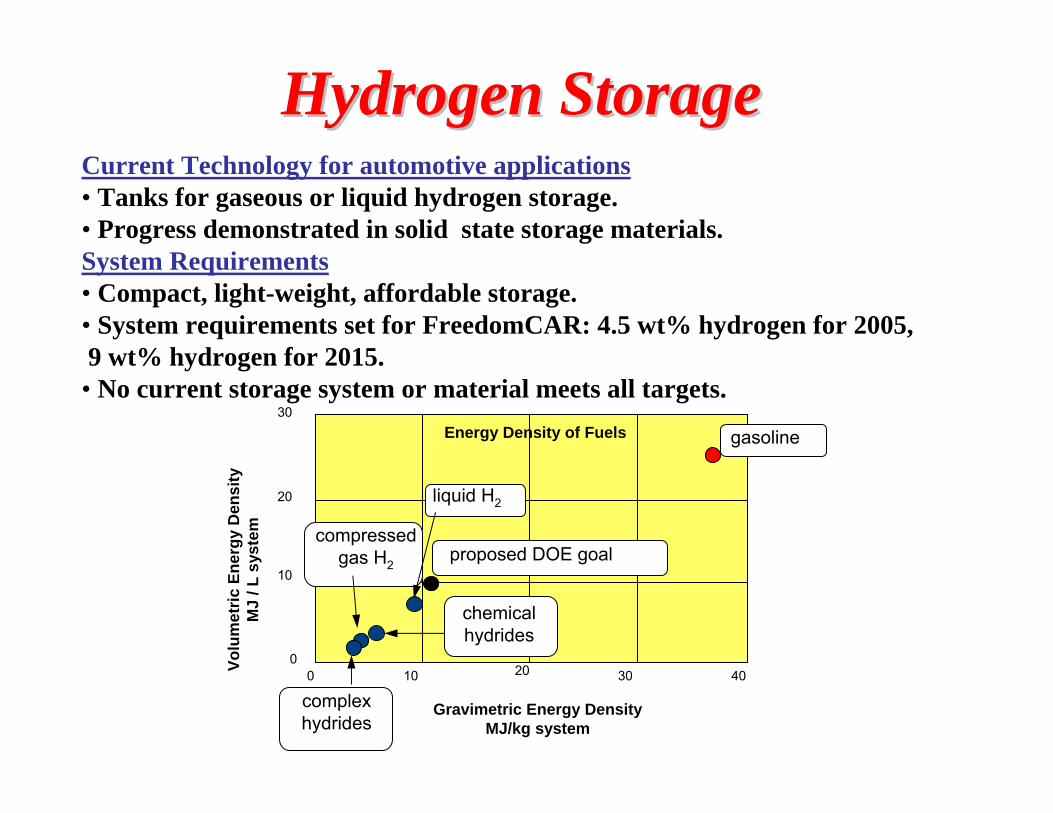
Current Technology for automotive applications• Tanks for gaseous or liquid hydrogen storage. • Progress demonstrated in solid state storage materials.System Requirements• Compact, light-weight, affordable storage. • System requirements set for FreedomCAR: 4.5 wt% hydrogen for 2005, 9 wt% hydrogen for 2015. • No current storage system or material meets all targets.
Hydrogen Storage Hydrogen Storage
Gravimetric Energy DensityMJ/kg system
Volu
met
ric E
nerg
y D
ensi
tyM
J / L
sys
tem
0
10
20
30
0 10 20 30 40
Energy Density of Fuels
proposed DOE goal
gasoline
liquid H2
chemicalhydrides
complex hydrides
compressed gas H2
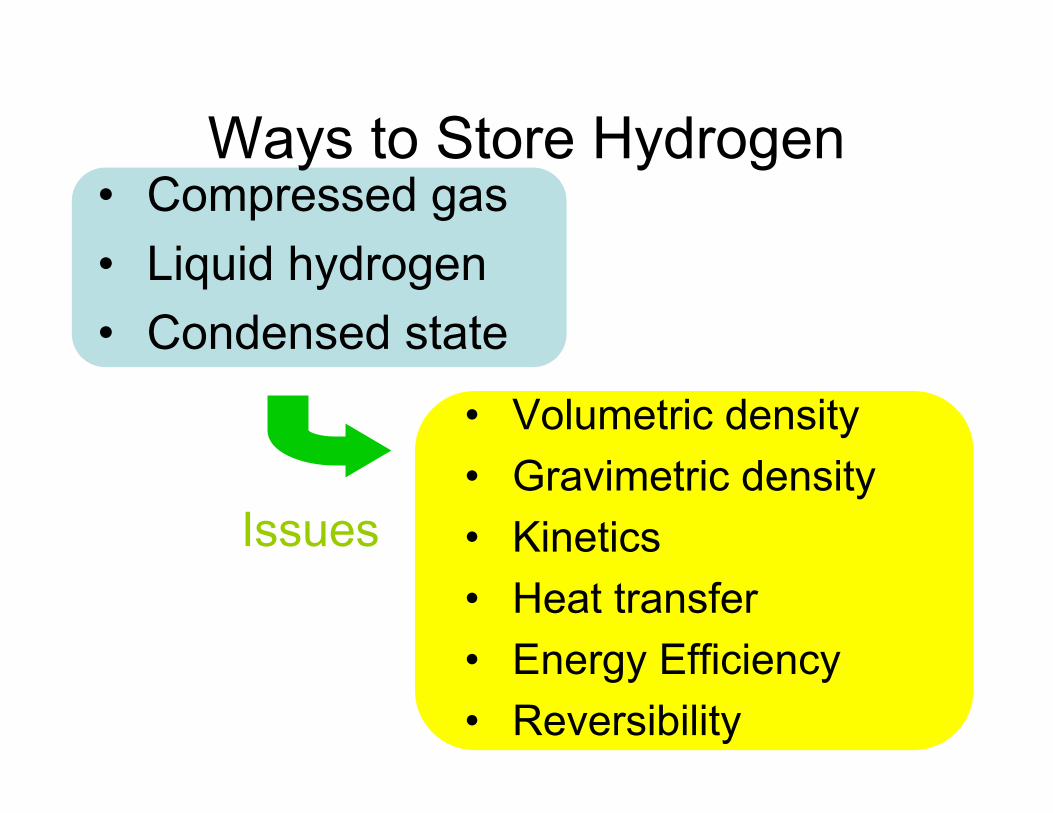
Ways to Store Hydrogen• Compressed gas• Liquid hydrogen• Condensed state
• Volumetric density• Gravimetric density• Kinetics• Heat transfer• Energy Efficiency• Reversibility
Issues
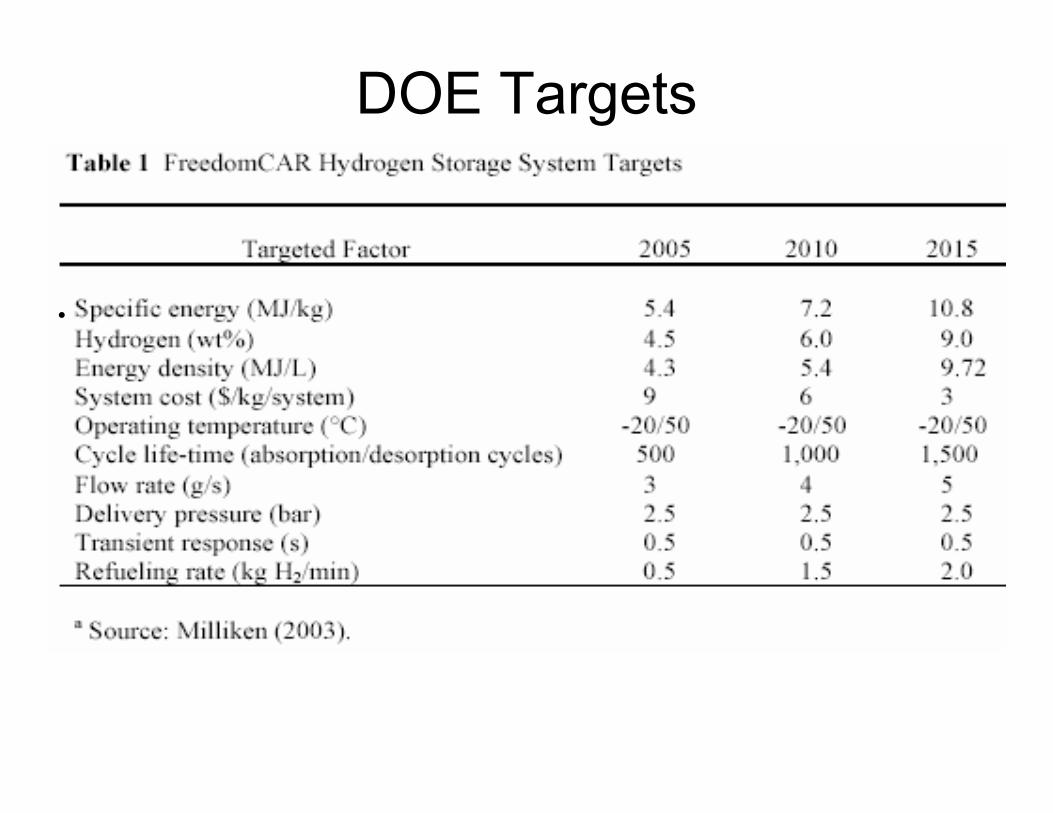
DOE Targets
•
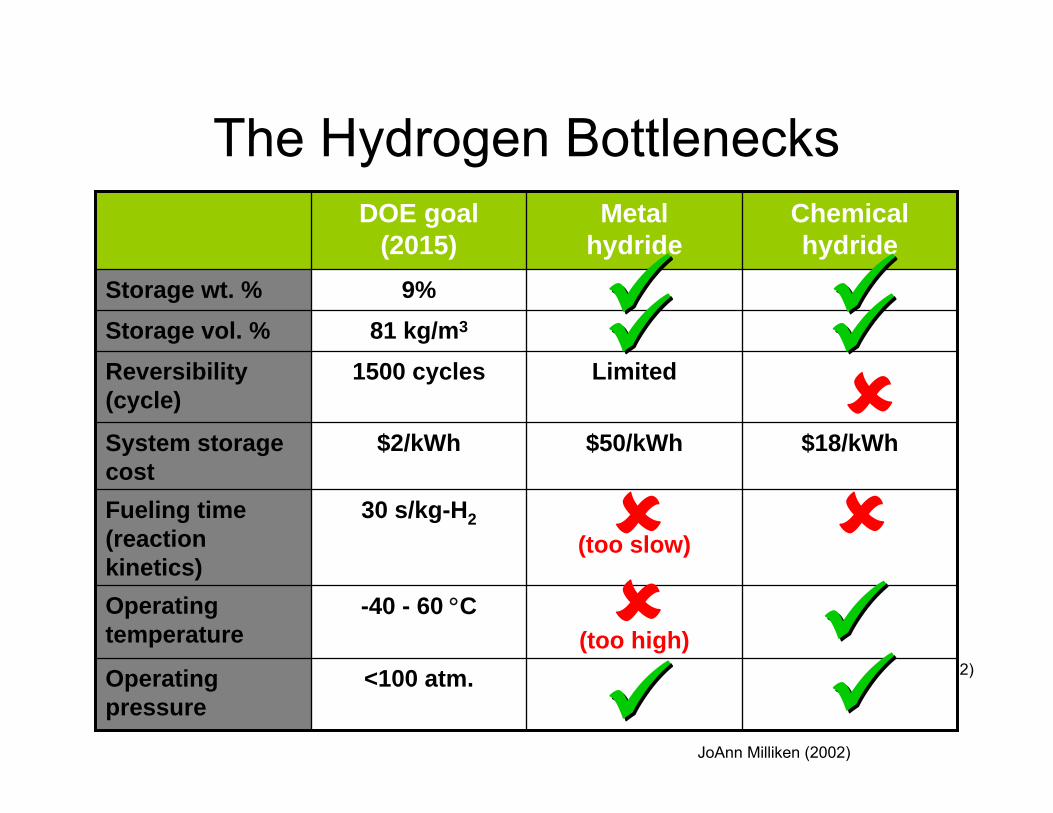
The Hydrogen Bottlenecks
From JoAnn Milliken (2002)<100 atm.Operating pressure
(too high)-40 - 60 °COperating
temperature
(too slow)30 s/kg-H2Fueling time
(reaction kinetics)
$18/kWh$50/kWh$2/kWhSystem storage cost
Limited1500 cyclesReversibility (cycle)
81 kg/m3Storage vol. %9%Storage wt. %
Chemical hydride
Metal hydride
DOE goal (2015)
JoAnn Milliken (2002)
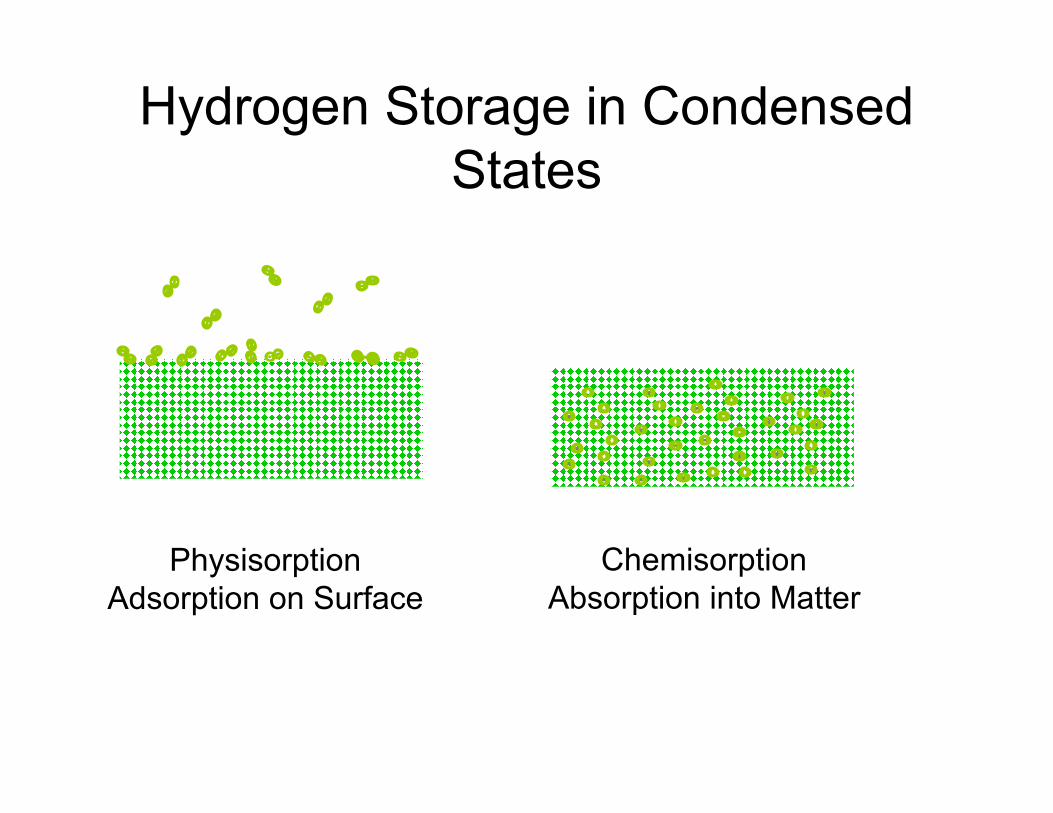
Hydrogen Storage in Condensed States
PhysisorptionAdsorption on Surface
ChemisorptionAbsorption into Matter
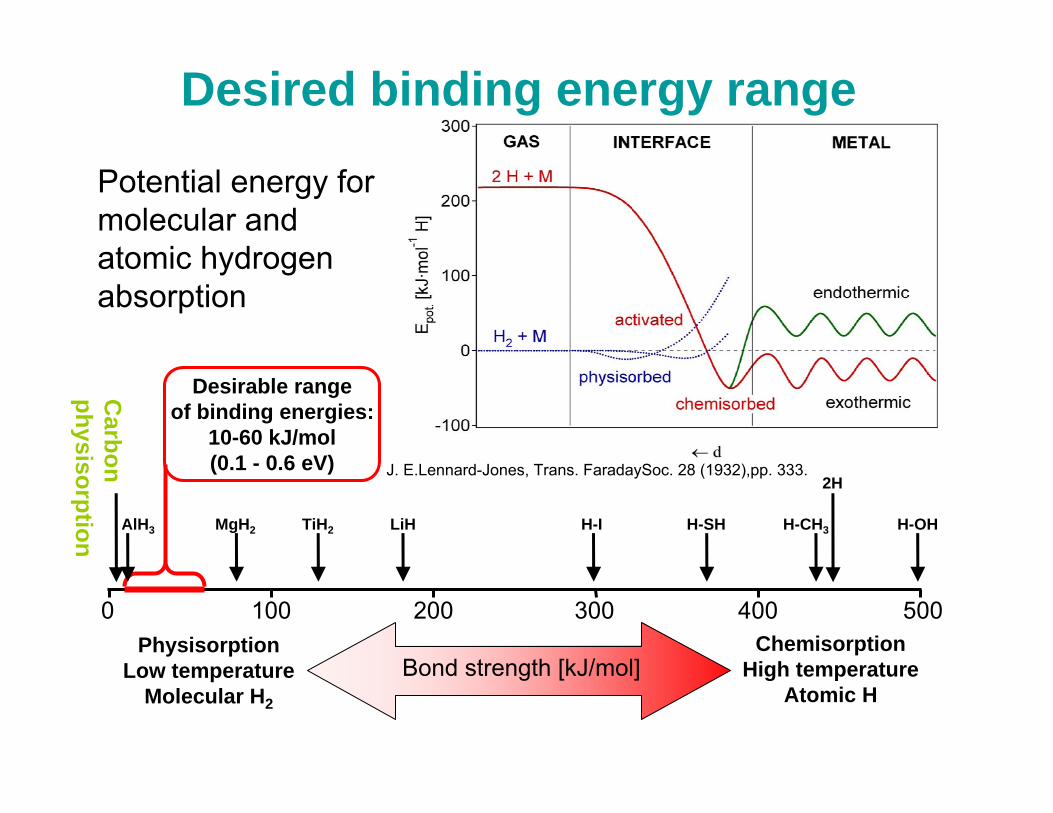
J. E.Lennard-Jones, Trans. FaradaySoc. 28 (1932),pp. 333.
Potential energy for molecular and atomic hydrogen absorption
Desired binding energy range
500 0
AlH3 MgH2 TiH2 LiH H-I H-SH H-CH3 H-OH
Carbon
physisorption
Desirable rangeof binding energies:
10-60 kJ/mol(0.1 - 0.6 eV)
2H
PhysisorptionLow temperature
Molecular H2
Bond strength [kJ/mol]Chemisorption
High temperature Atomic H
400300200100
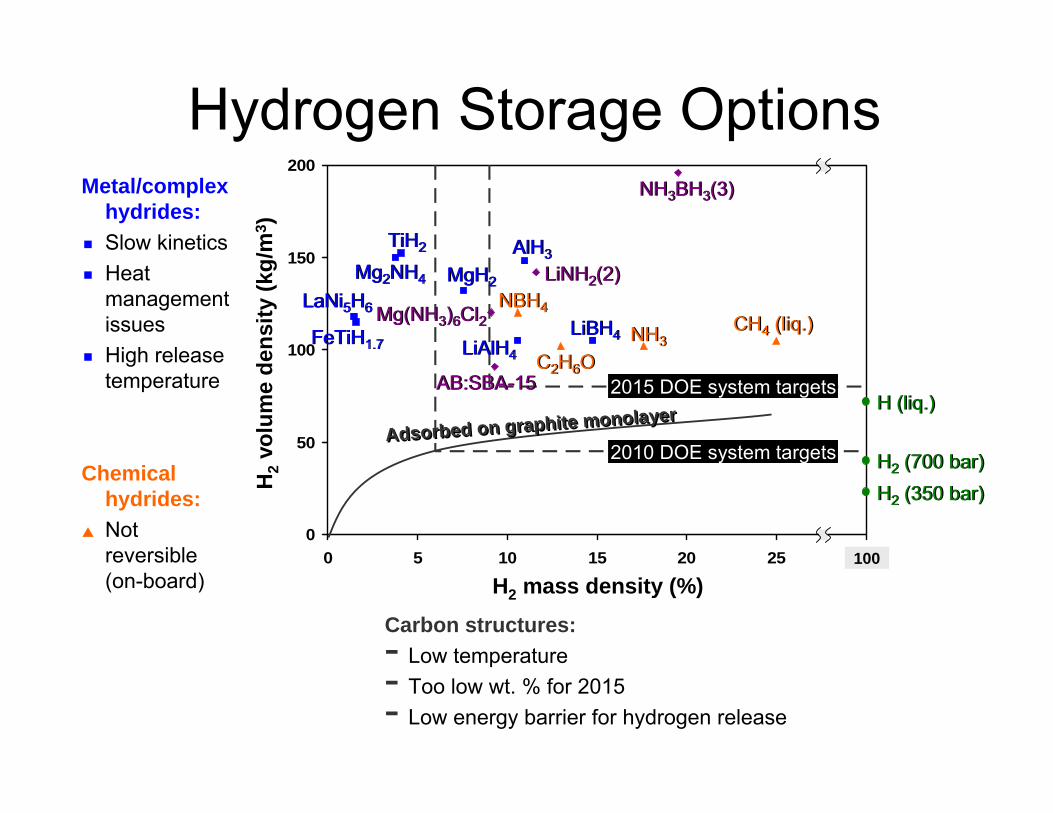
Hydrogen Storage Options
Chemical hydrides:Not reversible (on-board)
0
50
100
150
200
0 5 10 15 20 25 30
H2 mass density (%)
H2
volu
me
dens
ity (k
g/m
3 )
2015 DOE system targets
2010 DOE system targets
Mg2NH4Mg2NH4
TiH2TiH2 AlH3AlH3
MgH2MgH2
LiBH4LiBH4LiAlH4LiAlH4
LaNi5H6LaNi5H6
FeTiH1.7FeTiH1.7
NH3BH3(3)NH3BH3(3)
LiNH2(2)LiNH2(2)
AB:SBA-15AB:SBA-15
100
Mg(NH3)6Cl2Mg(NH3)6Cl2 CH4 (liq.)CH4 (liq.)NH3NH3
C2H6OC2H6O
NBH4NBH4
H (liq.)H (liq.)
H2 (700 bar)H2 (700 bar)H2 (350 bar)H2 (350 bar)
Carbon structures:- Low temperature- Too low wt. % for 2015- Low energy barrier for hydrogen release
Metal/complexhydrides:Slow kineticsHeat management issuesHigh release temperature
Adsorbed on graphite monolayerAdsorbed on graphite monolayer
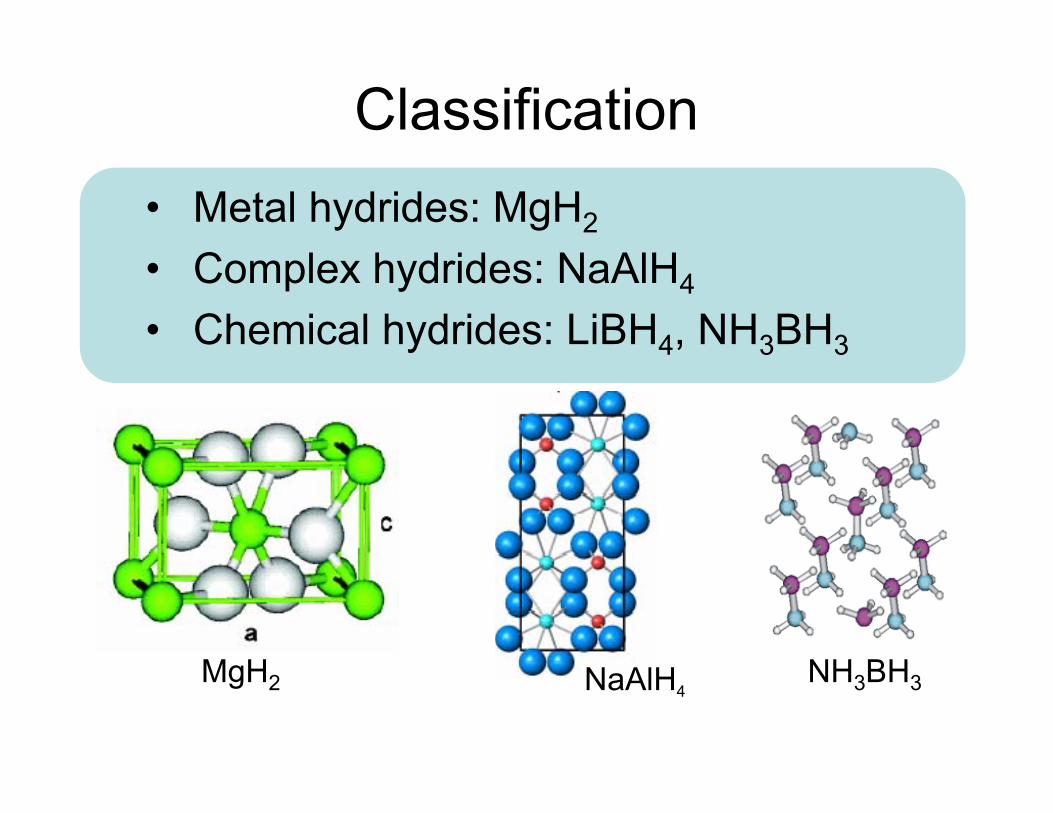
Classification• Metal hydrides: MgH2
• Complex hydrides: NaAlH4
• Chemical hydrides: LiBH4, NH3BH3
MgH2 NaAlH4NH3BH3
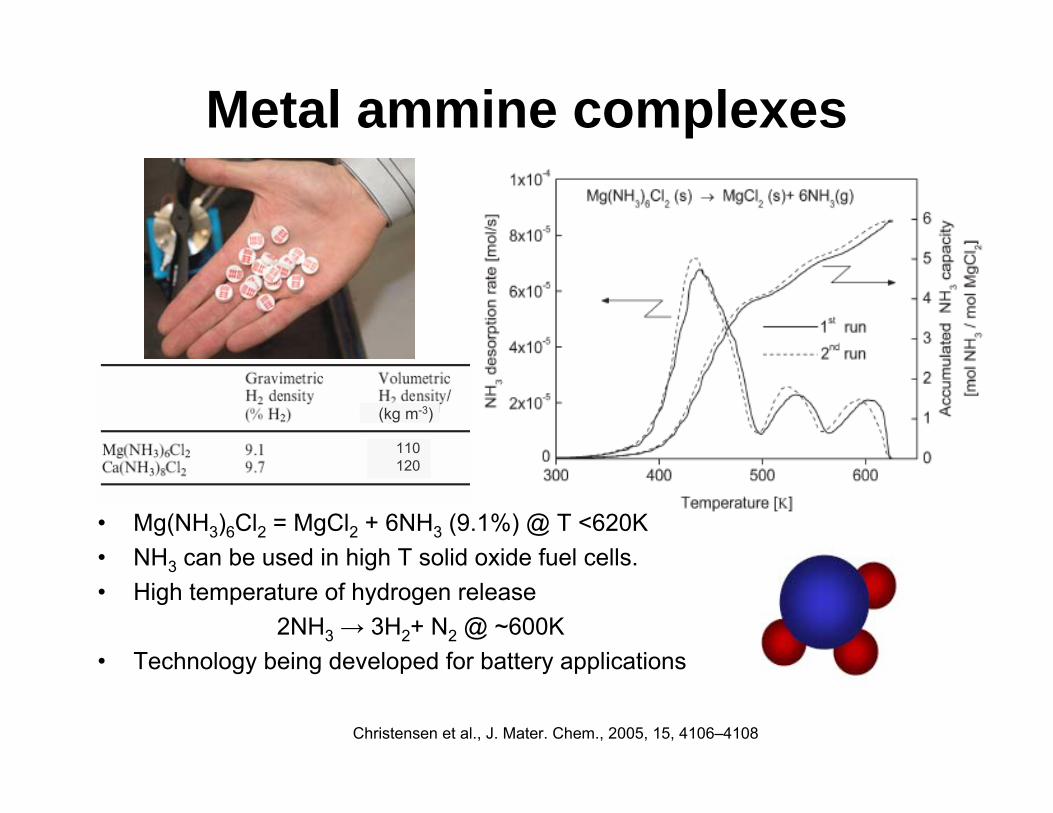
(kg m-3)
110120
Metal ammine complexes
• Mg(NH3)6Cl2 = MgCl2 + 6NH3 (9.1%) @ T <620K• NH3 can be used in high T solid oxide fuel cells.• High temperature of hydrogen release
2NH3 → 3H2+ N2 @ ~600K• Technology being developed for battery applications
Christensen et al., J. Mater. Chem., 2005, 15, 4106–4108
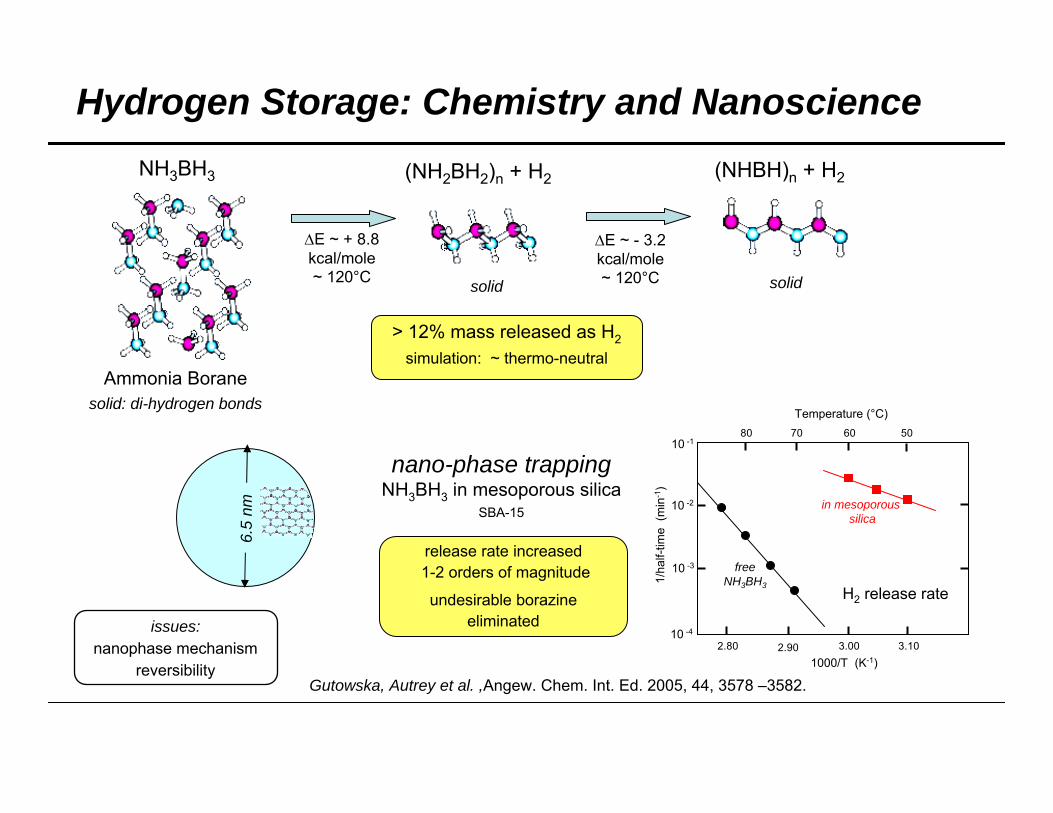
Hydrogen Storage: Chemistry and Nanoscience
Ammonia Boranesolid: di-hydrogen bonds
solid solid
∆E ~ + 8.8 kcal/mole~ 120°C
∆E ~ - 3.2kcal/mole~ 120°C
(NHBH)n + H2 (NH2BH2)n + H2
> 12% mass released as H2
simulation: ~ thermo-neutral
2.80 2.90 3.00 3.10
10 -3
10 -2
10 -1
10 -4
80 70 60 50
Temperature (°C)
1000/T (K-1)1/
half-
time
(min
-1)
H2 release rate
in mesoporoussilica
free NH3BH3
nano-phase trappingNH3BH3 in mesoporous silica
SBA-15
6.5
nm
release rate increased1-2 orders of magnitude
undesirable borazineeliminated
NH3BH3
issues:nanophase mechanism
reversibilityGutowska, Autrey et al. ,Angew. Chem. Int. Ed. 2005, 44, 3578 –3582.
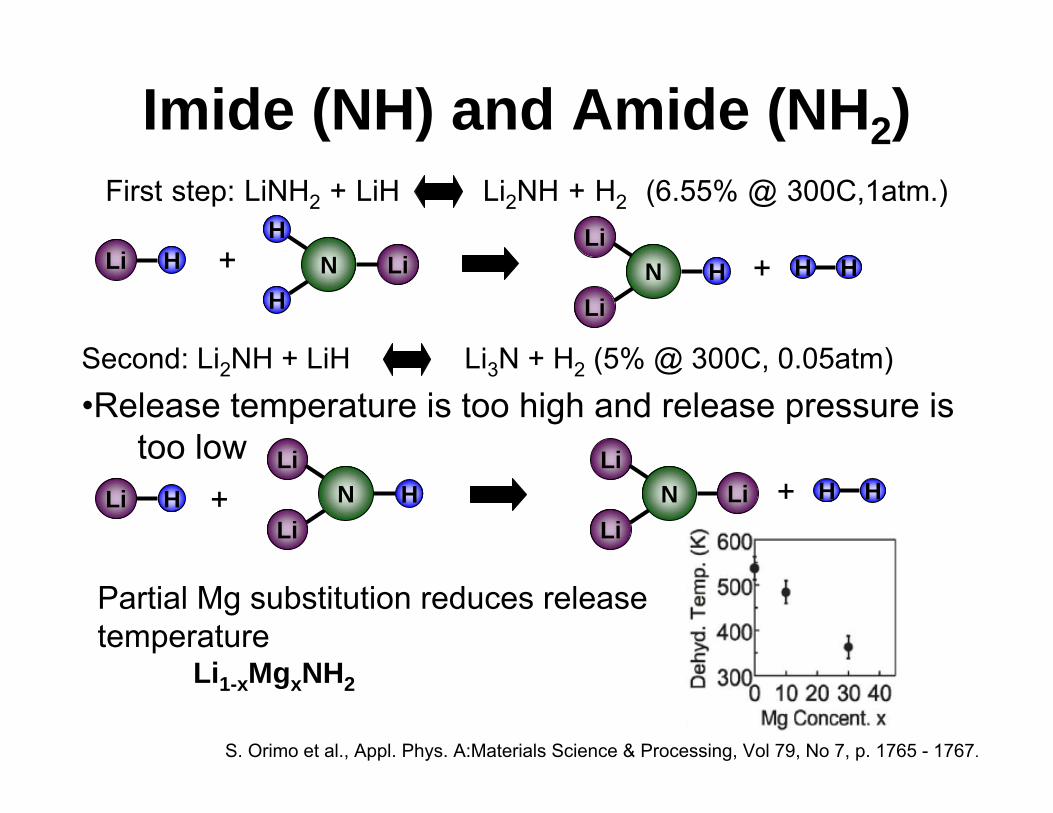
Imide (NH) and Amide (NH2)First step: LiNH2 + LiH Li2NH + H2 (6.55% @ 300C,1atm.)
Li H LiNH
H
LiN H
Li
LiN
LiLi
HH
HH
Second: Li2NH + LiH Li3N + H2 (5% @ 300C, 0.05atm)•Release temperature is too high and release pressure is
too low LiN H
LiLi H
Partial Mg substitution reduces release temperature
Li1-xMgxNH2
S. Orimo et al., Appl. Phys. A:Materials Science & Processing, Vol 79, No 7, p. 1765 - 1767.
+
+
+
+
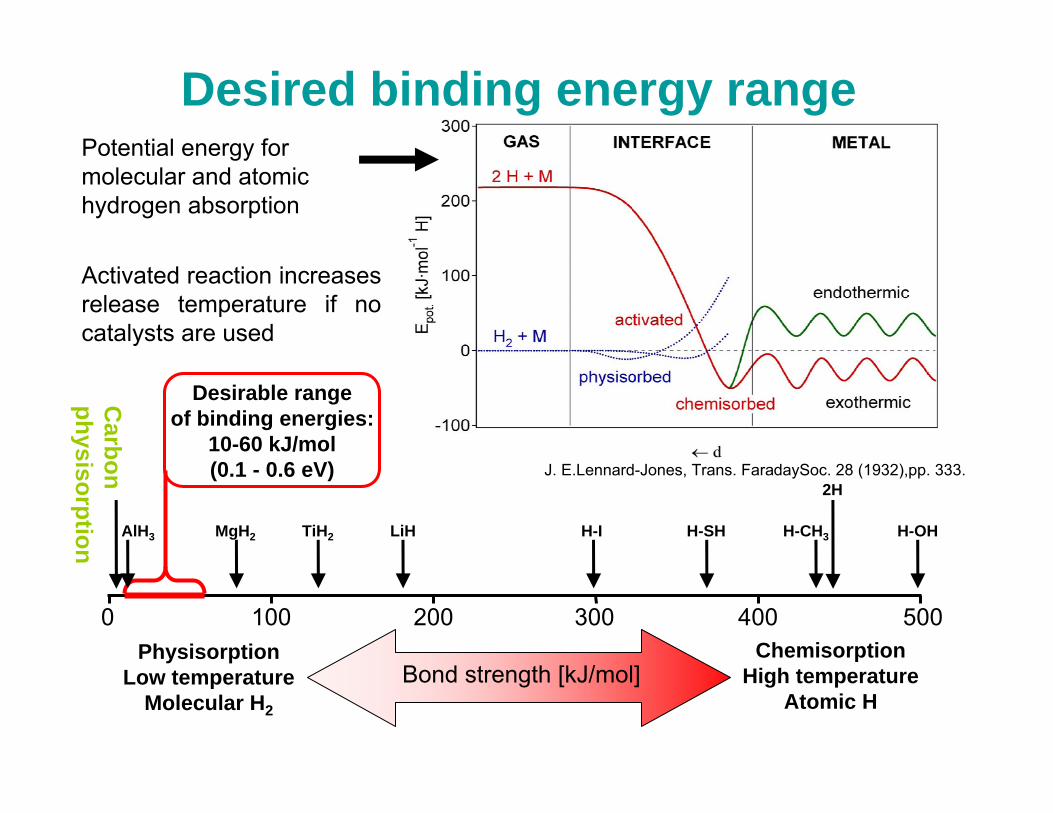
J. E.Lennard-Jones, Trans. FaradaySoc. 28 (1932),pp. 333.
Potential energy for molecular and atomic hydrogen absorption
Desired binding energy range
Activated reaction increases release temperature if no catalysts are used
500 0
AlH3 MgH2 TiH2 LiH H-I H-SH H-CH3 H-OH
Carbon
physisorption
Desirable rangeof binding energies:
10-60 kJ/mol(0.1 - 0.6 eV)
2H
PhysisorptionLow temperature
Molecular H2
Bond strength [kJ/mol]Chemisorption
High temperature Atomic H
400300200100
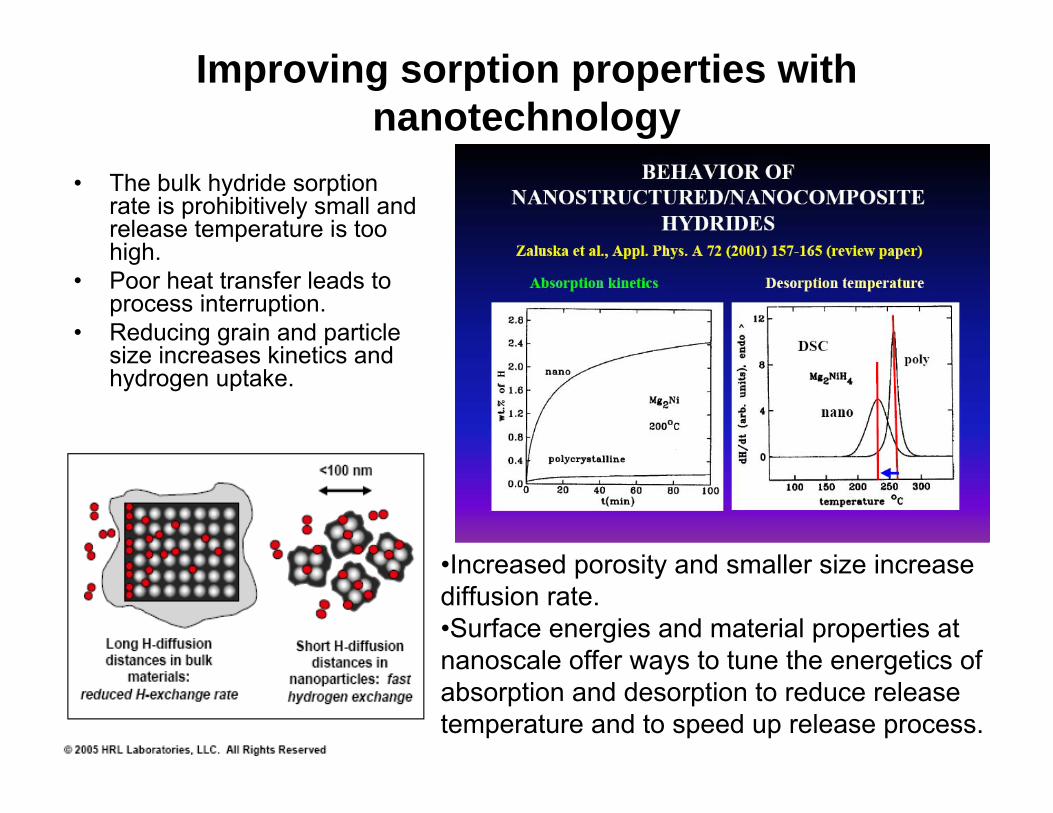
Improving sorption properties with nanotechnology
•Increased porosity and smaller size increase diffusion rate.•Surface energies and material properties at nanoscale offer ways to tune the energetics of absorption and desorption to reduce release temperature and to speed up release process.
• The bulk hydride sorption rate is prohibitively small and release temperature is too high.
• Poor heat transfer leads to process interruption.
• Reducing grain and particle size increases kinetics and hydrogen uptake.
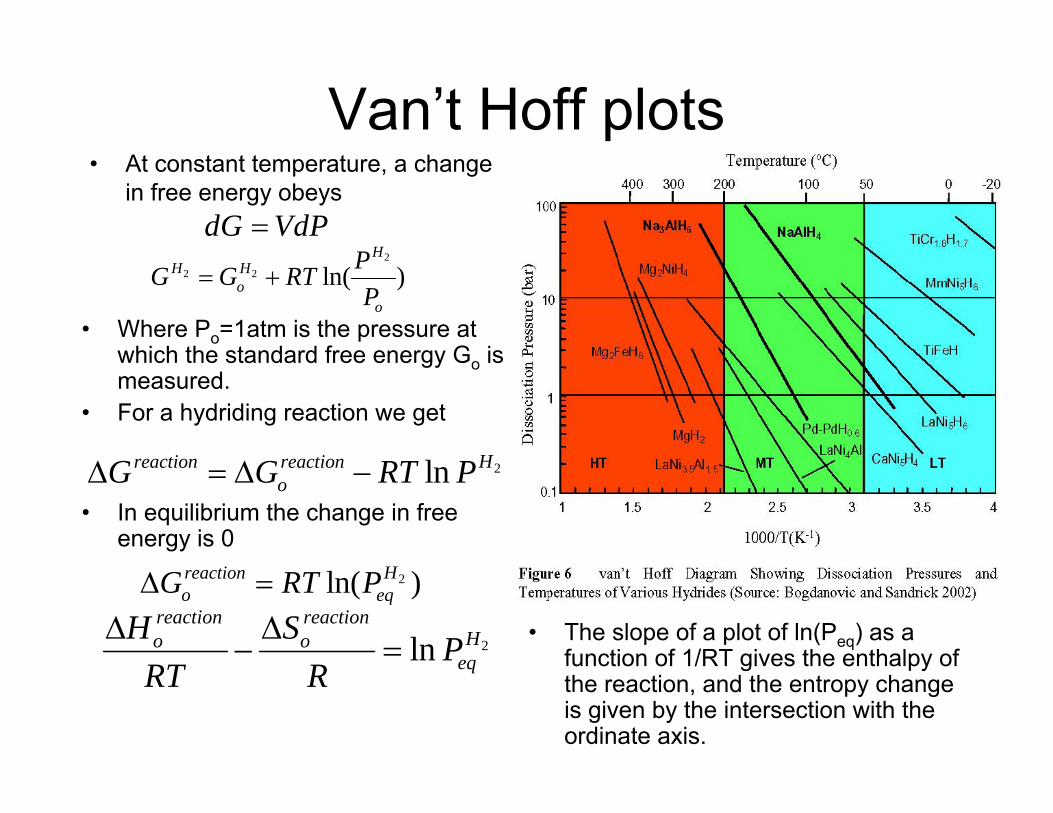
Van’t Hoff plots• At constant temperature, a change
in free energy obeysdG VdP=
• The slope of a plot of ln(Peq) as a function of 1/RT gives the enthalpy of the reaction, and the entropy change is given by the intersection with the ordinate axis.
• Where Po=1atm is the pressure at which the standard free energy Go is measured.
• For a hydriding reaction we get
• In equilibrium the change in free energy is 0
22 2 ln( )
HH H
oo
PG G RTP
= +
2ln Hreaction reactionoG G RT P∆ = ∆ −
2lnreaction reaction
Ho oeq
H S PRT R
∆ ∆− =
2ln( )Hreactiono eqG RT P∆ =
lnlnPPeqeq
11/T/T
Decreasing Decreasing rr
VANVAN’’T HOFF PLOT:T HOFF PLOT:Van’t Hoff plot for a model MH2 hydride
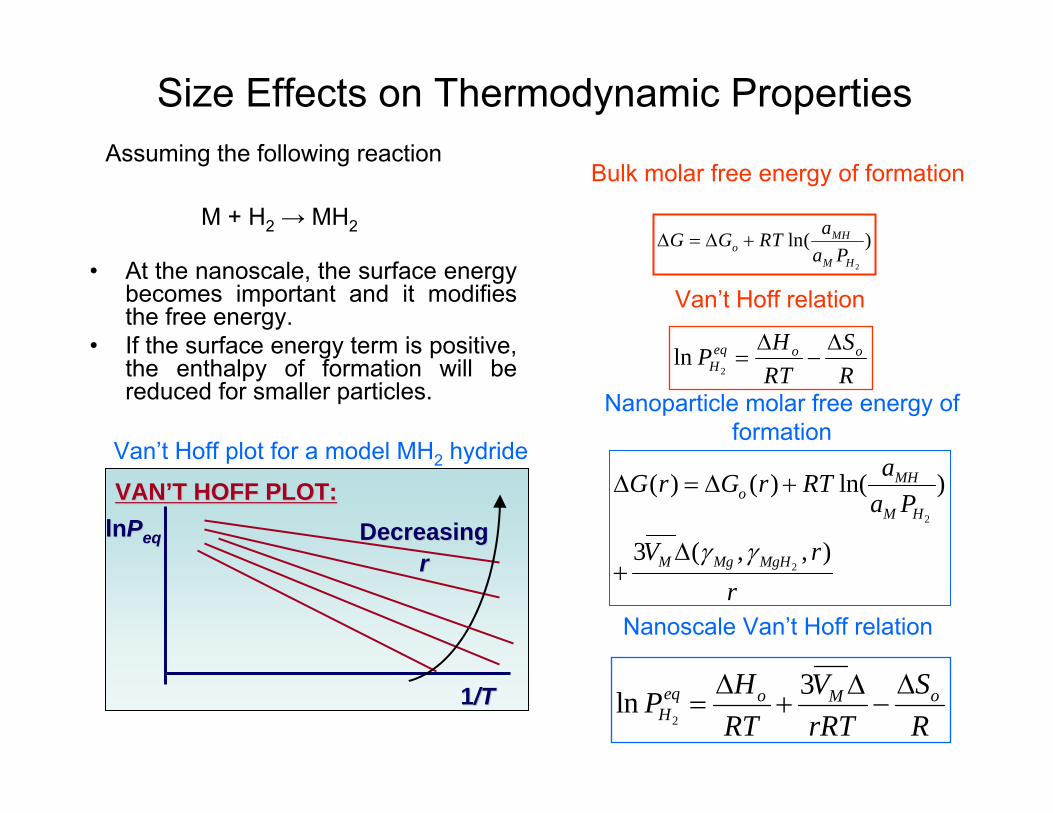
Size Effects on Thermodynamic PropertiesAssuming the following reaction
M + H2 → MH2
2
ln( )MHo
M H
aG G RTa P
∆ = ∆ +
2ln eq o o
HH SP
RT R∆ ∆
= −
2
2
( ) ( ) ln( )
3 ( , , )
MHo
M H
M Mg MgH
aG r G r RTa P
V rr
γ γ
∆ = ∆ +
∆+
Bulk molar free energy of formation
Nanoparticle molar free energy of formation
• At the nanoscale, the surface energy becomes important and it modifies the free energy.
• If the surface energy term is positive, the enthalpy of formation will be reduced for smaller particles.
Nanoscale Van’t Hoff relation
2
3ln eq o oMH
H SVPRT rRT R∆ ∆∆
= + −
Van’t Hoff relation
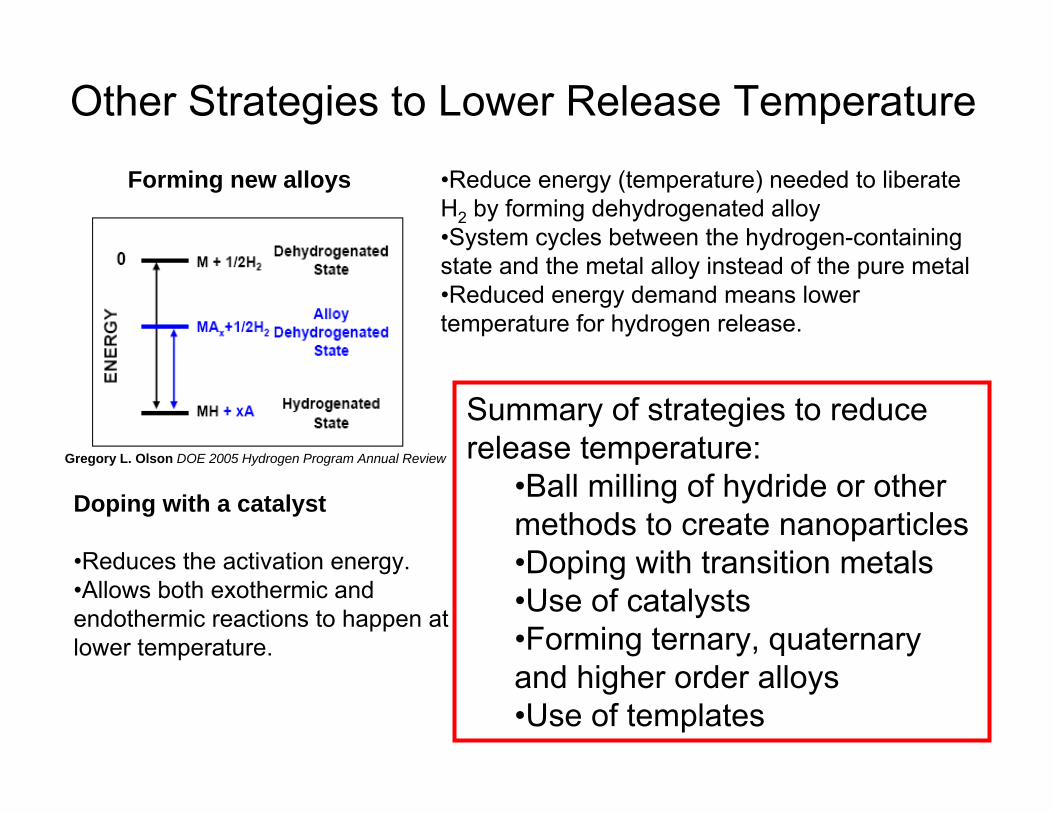
Other Strategies to Lower Release Temperature
•Reduce energy (temperature) needed to liberate H2 by forming dehydrogenated alloy •System cycles between the hydrogen-containing state and the metal alloy instead of the pure metal•Reduced energy demand means lower temperature for hydrogen release.
Doping with a catalyst
•Reduces the activation energy.•Allows both exothermic and endothermic reactions to happen at lower temperature.
Forming new alloys
Gregory L. Olson DOE 2005 Hydrogen Program Annual Review
Summary of strategies to reduce release temperature:
•Ball milling of hydride or other methods to create nanoparticles•Doping with transition metals•Use of catalysts•Forming ternary, quaternary and higher order alloys•Use of templates
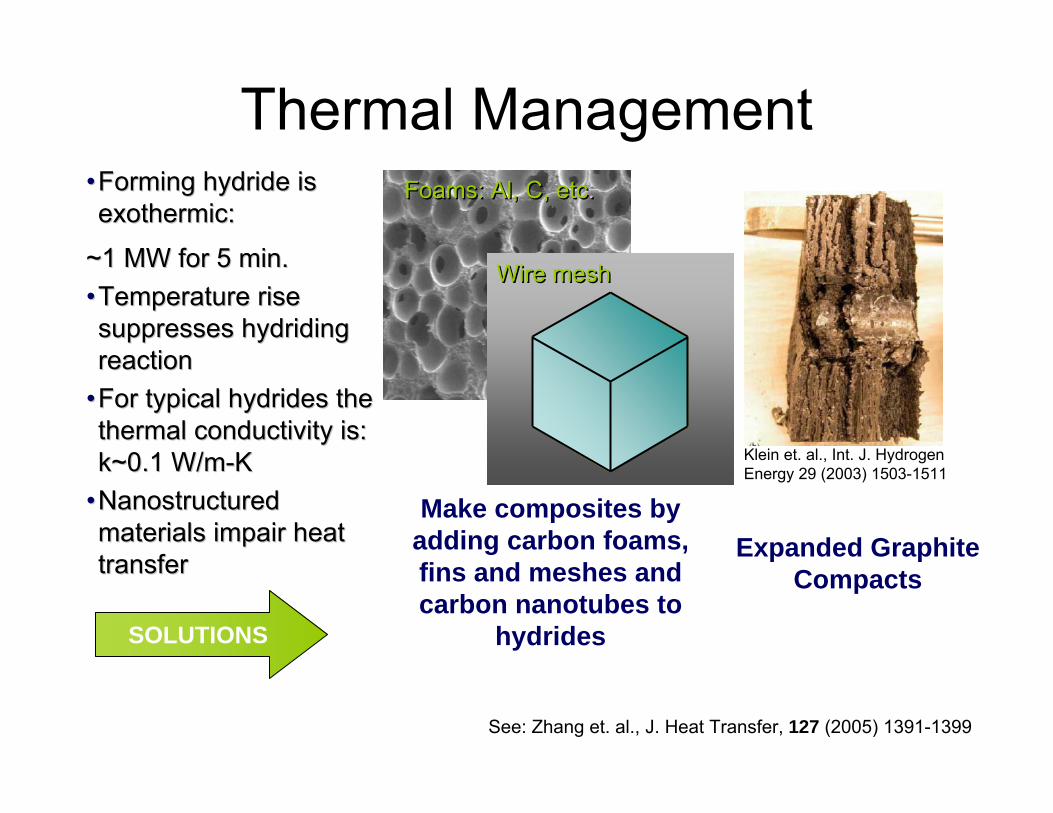
•• Forming hydride is Forming hydride is exothermic: exothermic:
~1 MW for 5 min. ~1 MW for 5 min. •• Temperature rise Temperature rise suppresses suppresses hydridinghydridingreactionreaction
•• For typical hydrides the For typical hydrides the thermal conductivity is: thermal conductivity is: k~0.1 W/mk~0.1 W/m--KK
•• NanostructuredNanostructuredmaterials impair heat materials impair heat transfertransfer
Make composites by adding carbon foams, fins and meshes and carbon nanotubes to
hydrides
Expanded Graphite Compacts
Klein et. al., Int. J. Hydrogen Energy 29 (2003) 1503-1511
See: Zhang et. al., J. Heat Transfer, 127 (2005) 1391-1399
Foams: Al, C, etc.Foams: Al, C, etc.
Wire meshWire mesh
SOLUTIONS
Thermal Management
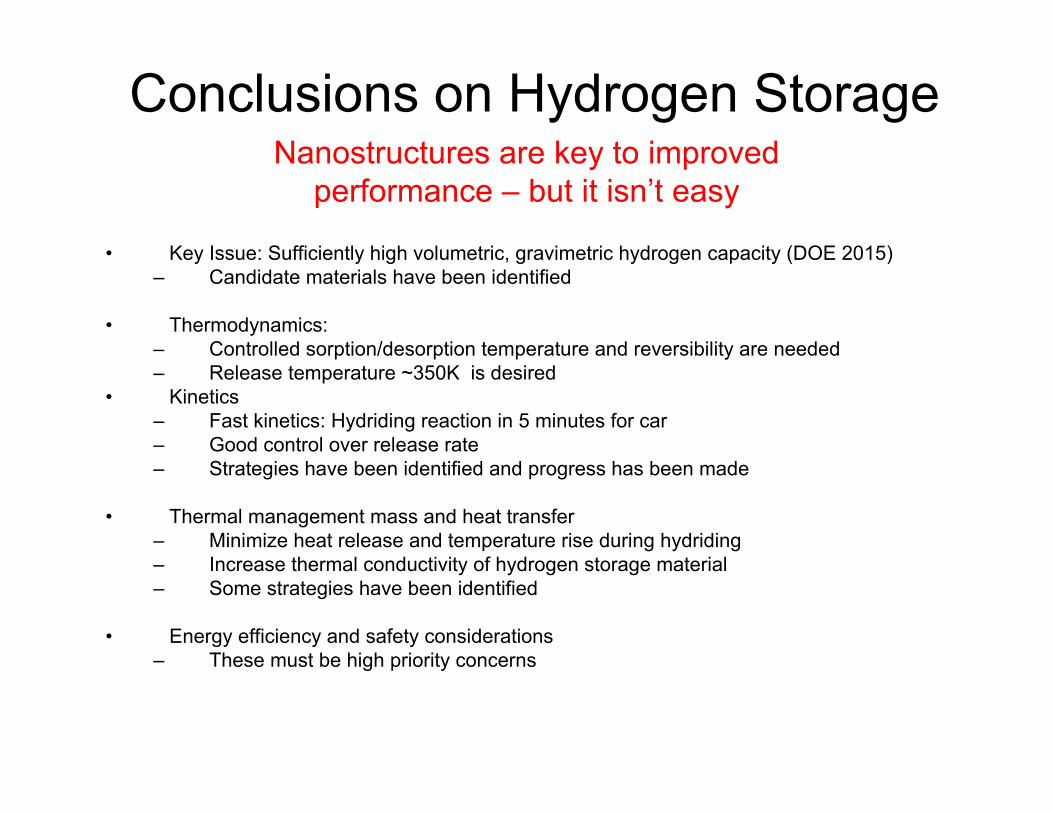
Conclusions on Hydrogen Storage
• Key Issue: Sufficiently high volumetric, gravimetric hydrogen capacity (DOE 2015)– Candidate materials have been identified
• Thermodynamics:– Controlled sorption/desorption temperature and reversibility are needed– Release temperature ~350K is desired
• Kinetics– Fast kinetics: Hydriding reaction in 5 minutes for car – Good control over release rate– Strategies have been identified and progress has been made
• Thermal management mass and heat transfer– Minimize heat release and temperature rise during hydriding– Increase thermal conductivity of hydrogen storage material– Some strategies have been identified
• Energy efficiency and safety considerations– These must be high priority concerns
Nanostructures are key to improved performance – but it isn’t easy
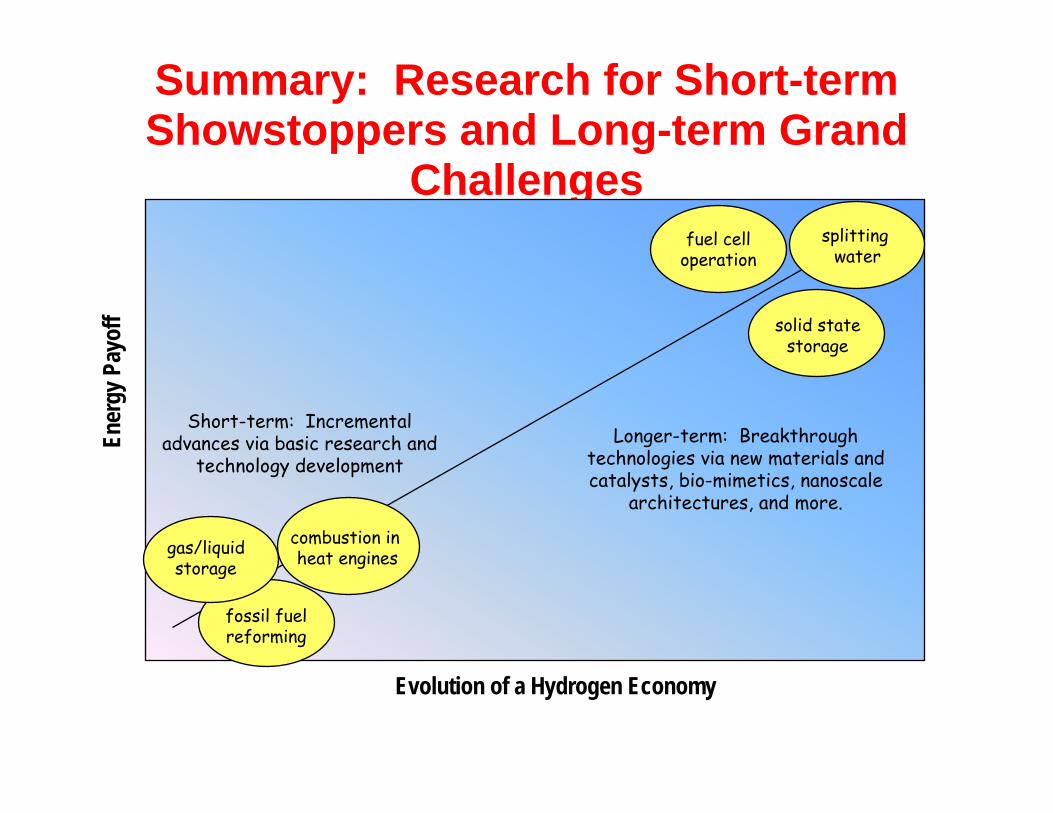
Summary: Research for Short-term Showstoppers and Long-term Grand
Challenges
Evolution of a Hydrogen Economy
Ener
gy P
ayof
f
fossil fuelreforming
gas/liquidstorage
fuel celloperation
solid statestorage
splitting water
combustion inheat engines
Short-term: Incremental advances via basic research and
technology developmentLonger-term: Breakthrough
technologies via new materials and catalysts, bio-mimetics, nanoscale
architectures, and more.

+
-
Outlook: the Mature Hydrogen Economy
+
+
+
+
++
+
+
e-
H2
production:split water renewably
storage:solid state materials
use:fuel cells
science within reachbreakthrough research discoveries
catalysis, membranes, nanoscale architectures, bio-mimetics
high impact on energy challengessupply, security, pollution, climate
H2
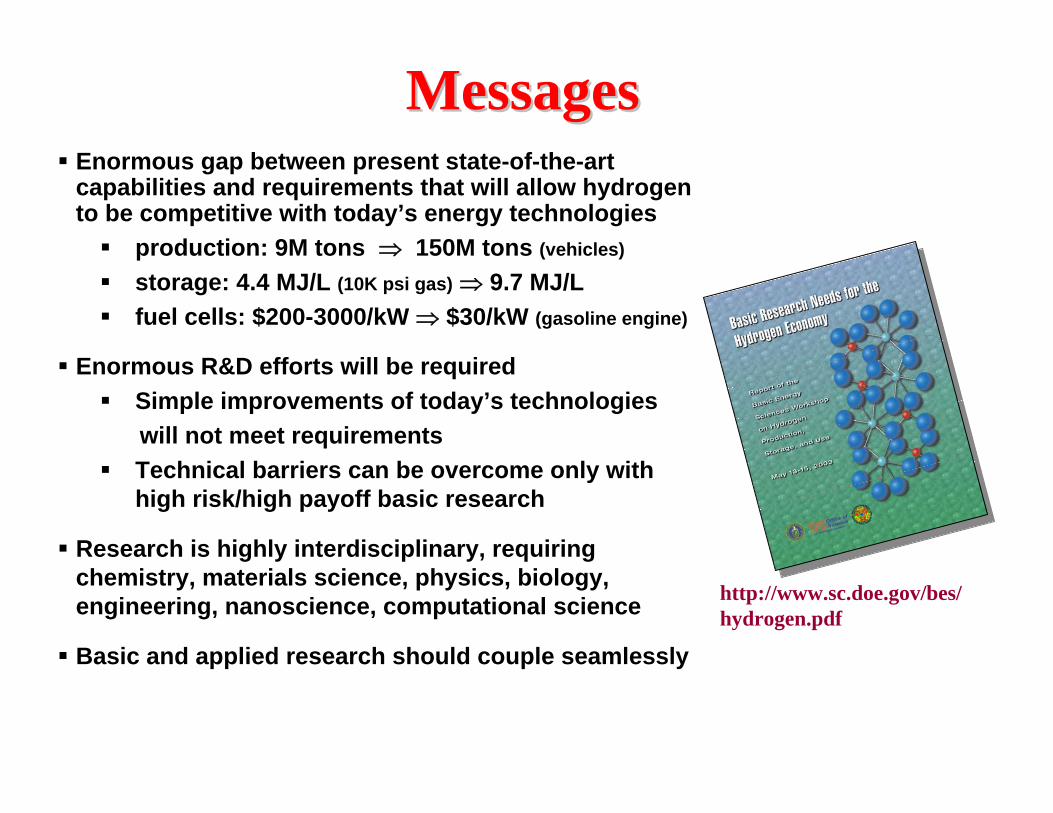
MessagesMessages
http://www.sc.doe.gov/bes/hydrogen.pdf
Enormous gap between present state-of-the-art capabilities and requirements that will allow hydrogen to be competitive with today’s energy technologies
production: 9M tons ⇒ 150M tons (vehicles)
storage: 4.4 MJ/L (10K psi gas) ⇒ 9.7 MJ/Lfuel cells: $200-3000/kW ⇒ $30/kW (gasoline engine)
Enormous R&D efforts will be requiredSimple improvements of today’s technologieswill not meet requirementsTechnical barriers can be overcome only with high risk/high payoff basic research
Research is highly interdisciplinary, requiring chemistry, materials science, physics, biology, engineering, nanoscience, computational science
Basic and applied research should couple seamlessly