Iceland - UNFCCCunfccc.int/resource/docs/natc/icenc3.pdf · Contact addresses Published by the ......
41
The Ministry for the Environment Vonarstraeti 4 150 Reykjavík ICELAND April 2003 GuðjónÓ – vistvæn prentsmiðja Iceland´s Third National Communication under the United Nations Framework Convention on Climate Change
Transcript of Iceland - UNFCCCunfccc.int/resource/docs/natc/icenc3.pdf · Contact addresses Published by the ......
The Ministry for the EnvironmentVonarstraeti 4150 Reykjavík ICELAND
April 2003
GuðjónÓ – vistvæn prentsmiðja
Iceland́s Third National
Communication under the United
Nations Framework Convention
on Climate Change
April 2003
Iceland́s Third National
Communication under the United
Nations Framework Convention
on Climate Change
Contents
Executive summary
Chapter 1National circumstances
Chapter 2Greenhouse gas inventory information
Chapter 3Policies and measures
Chapter 4Projections of emissions and total effect of policies
Chapter 5Impacts and adaptation measures
Chapter 6Financial assistance and technology transfer
Chapter 7Research and systematic observation
Chapter 8Education, training and public awareness
Annex ANational greenhouse gas inventory, 1990-2000
Annex BDecision 14/CP.7
Annex CContact addresses
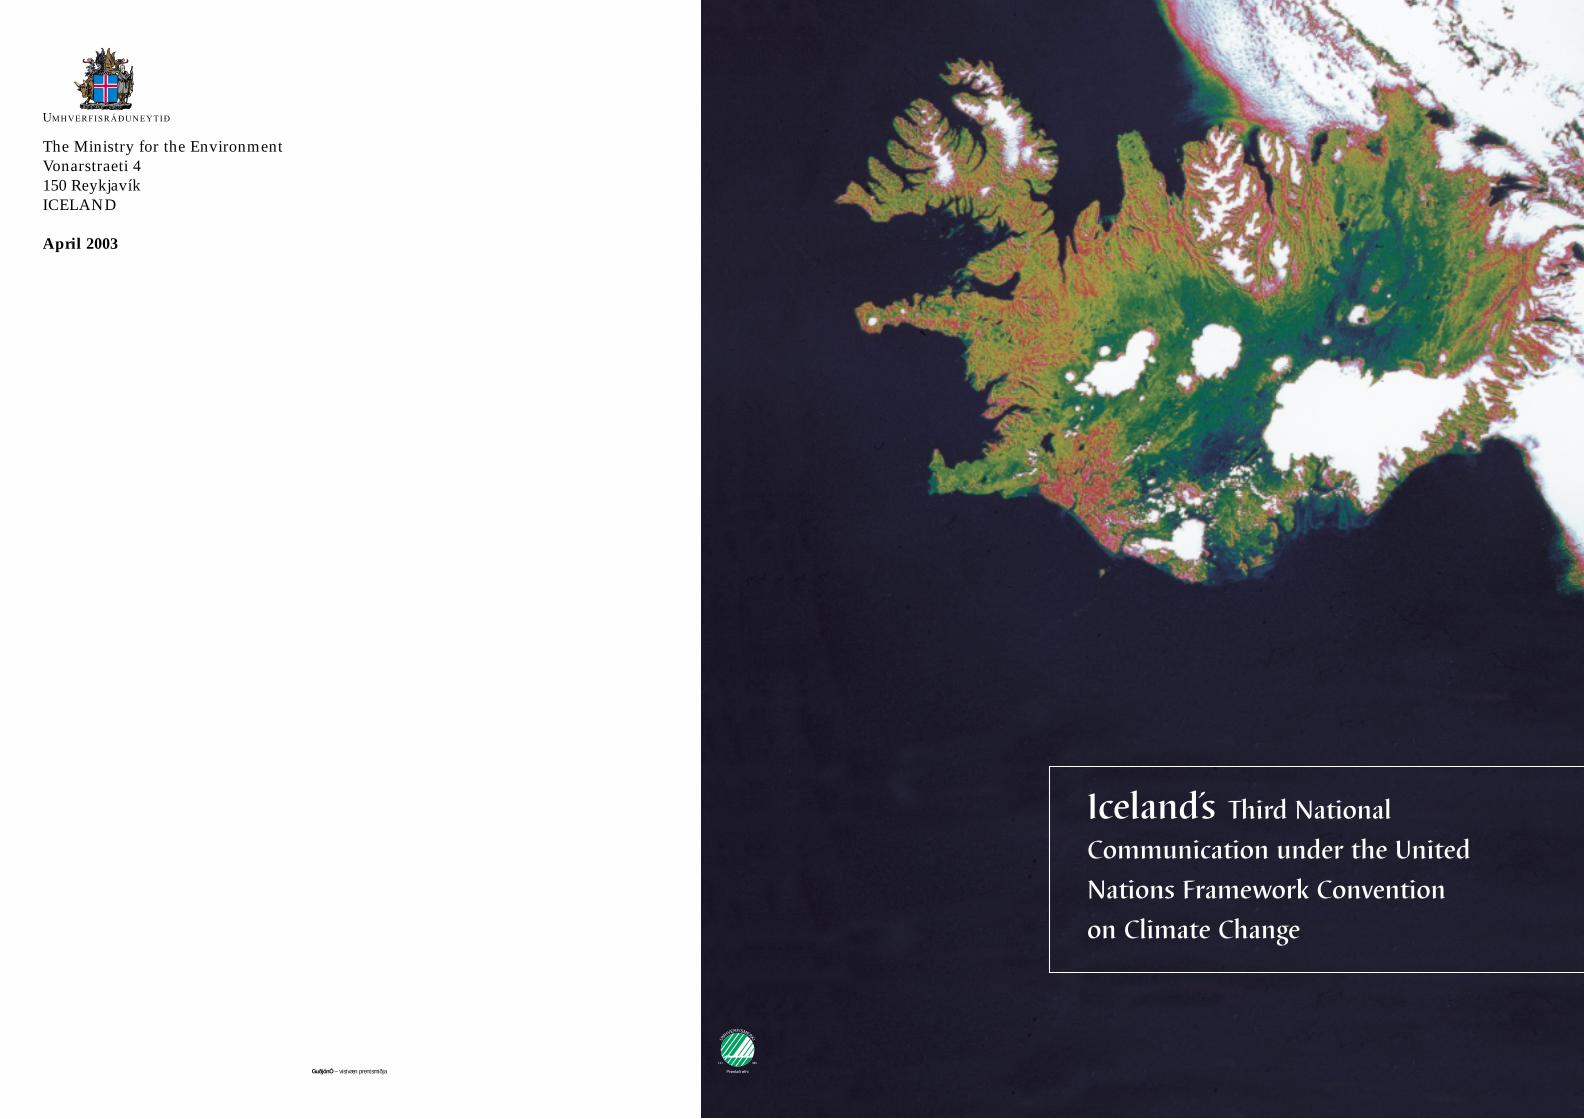
Published by the Ministry for the Environment in IcelandPhoto on front page: Satelite image from HCMM (Heat Capacity Mapping Mission), July 1979 (visable band)Printing: GuðjónÓ
2
National circumstances
Iceland is a parliamentary democracy, and Althingi(the Parliament) has 63 members. Most executivepower rests with the Government, which is headedby a prime minister. The population of Iceland is286,000, and settlement is primarily along the coast.About 62% of the nation lives in the capital, Reykja-vik, and surrounding areas.
Iceland, which is the second largest island in Europeafter Great Britain, has a total area of 103,000 km2.Glaciers are a distinctive feature of the landscape,and rivers and lakes are numerous. Freshwater supp-lies are abundant. Soil erosion and desertification is aproblem, and more than half of the country’s vegeta-tion cover is estimated to have disappeared due toerosion since the settlement period. The country issituated just south of the Arctic Circle but the meantemperature is considerably higher than might beexpected at this latitude. Relatively warm wintersand cool summers characterize the climate.
Iceland is an industrialized country with a high liv-ing standard. The country consistently ranks amongthe top 10 states in the UNDP Human DevelopmentIndex. The service sector dominates the economywith a 62.5% share of GDP in 2001, but generation offoreign revenue is highly dependent on naturalresources. The fishing industry relies on marineresources, the aluminum and ferrosilicon industry onhydropower and geothermal energy and the tourismindustry on nature and natural beauty. In 2001fishing and fish processing accounted for 40% of totalexport; the share of tourism was 12.4%, and alum-inum and ferrosilicon production accounted for14.7% of exports. The use of energy is high percapita, but the proportion of domestic renewableenergy in the total energy budget is 70%, which is amuch larger share than in most other countries. Theuse of fossil fuels for stationary energy is almost non-existent but fossil fuels are used for transport onland, sea and in air.
Three features stand out that make the Icelandicgreenhouse gas emissions profile unusual. First is thehigh proportion of renewable energy of the totalamount of energy used. Second, emissions from thefishing fleet are about one-fourth of total emissions.The third distinctive feature is the fact thatindividual sources of industrial process emissionshave a significant proportional impact on emissionsat the national level.
Greenhouse gas inventory information
The Environment and Food Agency compiles andmaintains the greenhouse gas inventory. In 1990, thetotal emissions of the six greenhouse gases coveredby the Kyoto Protocol were 2,799 Gg of CO2
equivalents. In 2000, total emissions were 2,990 Gg,excluding LUCF and emissions falling underDecision 14/CP.7 on the Impact of Single Projects onEmissions in the Commitment Period. This meansthat total greenhouse gas emissions in Iceland wereabout 7% above 1990 level in 2000. Over the sameperiod, carbon dioxide emissions increased by 18%;methane emissions fell by 6%; and nitrous oxideemissions fell by 4.5%. Removals of CO2 from directhuman-induced revegetation and reforestation since1990 are estimated to be 130 Gg in 2000.
Industry, transport and fisheries are the three mainsources of GHG emissions, but other sources includeagriculture and waste.
Policies and measures
Iceland is a party of the UNFCCC, and Icelandratified the Kyoto Protocol on May 23, 2002. Earlierthat year, the government adopted a new climatechange policy that was formulated with closecooperation between several ministries. The aim ofthe policy is to curb emissions of greenhouse gases sothat they will not exceed the limits of Iceland’sobligations under the Kyoto Protocol. A second
3
Executive summary
objective is to increase the level of carbon sequestration resulting from reforestation andrevegetation programs. The policy will be reviewedin the year 2005.
Key issues in the climate change policy includechanges in taxation creating incentives to use smalldiesel cars and a consultation process with alu-minum smelters to ensure that PFC emissions fromthe aluminum industry will be minimized. Also, thefishing industry will be encouraged to increaseenergy efficiency, and there will be further reductionof waste disposals. Emphasis will be placed onresearch and development as well as public ed-ucation.
Projections and the total effect ofmeasures
The Ministry for the Environment established aworking group whose role was to developprojections for GHG emissions until 2020. Twoscenarios are provided in the projections. The firstscenario assumes no additions to energy-intensiveindustries other than those enlargements alreadyagreed upon in October 2001 (Scenario 1). Thesecond scenario is based on the assumption that anew aluminum smelter will be built inReydarfjordur, and that both of the existingaluminum plants will be enlarged (Scenario 2).Expected effects of the key measures of the climatechange policy are integrated into the projections, andsensitivity analysis was conducted to estimate theemissions if these expected effects do not materialize.
If emissions are in accord with projections, Icelandwill be able to meet its obligations for the firstcommitment period of the Kyoto Protocol, even withthe planned expansion in energy-intensive industries(Scenario 2). However, this assumes that measuresincluded in the Icelandic climate change policy willbe successful. Should those assumptions not hold,Iceland could exceed its assigned amount forScenario 2. This does not take into account carbonsequestration. If plans for increased carbonsequestration are fully implemented, this will helpIceland to stay within its assigned amount.
Impacts and adaptation measures
It is uncertain what impact climate change will havein Iceland. Natural fluctuations in temperature aregreater in the North Atlantic than in most other
oceanic areas, and the natural fluctuations betweendecades are substantially more than estimatedtemperature increases for the next decades due tobuildup of greenhouse gases. The impact of thetemperature increase due to the greenhouse effectwill therefore greatly differ depending on thedirection of the short-term natural fluctuation.
An increase in temperature could have some positiveeffects on marine resources and fish stocks. However,more insects could increase risks of disease in bothplants and humans, which would be a negativeimpact. A worst-case scenario for Iceland would be ifclimate change would lead to major disruptions inocean circulation that would have negative impacton fish stocks. The impact climate change could haveon human health is likely to be less in Iceland than inmany other countries. An increase in temperatureshould not create discomfort for the population sincethe current climate is rather cool, but there could beindirect impacts on human health.
Financial assistance and technologytransfer
The Icelandic government has been increasing theirOfficial Development Assistance (ODA) in recentyears, and in 2002 ODA had reached 0.15% of GDP.Sustainability is a central theme in Icelandicdevelopment cooperation. Especially noteworthy inrelation to climate change is the UN University’sGeothermal Training Program in Iceland.
In addition to ODA, the Icelandic government alsoprovides financial assistance to environmentallyrelated projects in other countries through their part-icipation in various international agreements. Icelandhas also made voluntary contributation to theUNFCCC and to the IPCC.
Research and systematic observation
Funds allocated to research and developmentreached 2.3% of GDP in the year 2000. Environmentalchange is recognized as an important area inresearch, and Icelandic scientists are involved in anumber of climate-related research projects.
The Icelandic Meteorological Office (IMO) is invol-ved in climate system studies and does some workon modeling and prediction. Paleoclimatologicalwork has mainly taken place within the University ofIceland. Icelandic research institutions are involved
4
in several projects that study the impact of futureglobal climate changes. Two international projectscan be mentioned: the Arctic Climate Impact Assess-ment (ACIA) organized by the Arctic Council, andthe Climate, Water and Energy (CWE) program,which the Hydrological Institutes of the Nordiccountries are responsible for. Academic research onhow climate change could affect socio-economicfactors has not been substantial, but some researchprojects deal with technical mitigation, mainlymethods to increase carbon sequestration ortechnology that make renewable energy a moreattractive option as an alternative to fossil fuels.
The two institutions most important in relation toobservation of climate change are the IMO and theMarine Research Institute (MRI). The IMO monitorsand archives data from close to 200 stations. The MRImaintains a monitoring net of about 100hydrobiological stations in 12 standard sections(transects) around Iceland.
Education, training and publicawareness
Environmental education in schools has increased inthe past decade. The University of Iceland now offersa Master’s degree in environmental studies, whereclimate change is an integral subject. Manyuppersecondary schools offer courses in the same, orplace special emphasis on environmental issues intheir curriculum. Studies of environmental issues inprimary schools are included in many subjects,especially natural sciences.
There has not been a public information campaignfocusing specifically on climate change. However, inthe government policy on climate change emphasis isplaced on education and a special effort indisseminating information to the public. This effortwill be tailored toward possible ways of reducingemissions of GHG from the home due to waste andfrom transport. It should be noted that sincerenewable energy is used for both space heating andelectrical production, public information campaignsaimed at energy efficiency in the home are notrelevant for the purpose of reducing GHG emissionsin Iceland.
5
1.1 Government structure
Iceland has a written constitution and is a parli-amentary democracy. A president is elected by directpopular vote for a term of four years, with no termlimit. Most executive power, however, rests with theGovernment, which must have majority support ofAlthingi, the Parliament. Althingi has 63 members,and parliamentary elections are held every fouryears. The government is headed by a primeminister, and the executive branch is currentlydivided among 12 ministers. Judicial power lies withthe Supreme Court and the district courts, and thejudiciary is independent.
The country is divided into 122 municipalities, andlocal authorities are elected every four years. Thelargest municipality has around 112,000 inhabitants,but the smallest municipality has only 31 inhabitants.In 1990 the number of municipalities was 204, but inthe last decade an attempt has been made to unitesmall municipalities, and this has resulted in fewer,but more populous, municipalities. This trend islikely to continue since the tasks of local authoritieshave grown increasingly complex in recent years.The local authorities have their own sources ofrevenue and budgets and are responsible for variousareas that are important with regard to greenhousegas emissions. This includes physical planning,granting industry licenses and the design and oper-ation of public transport. Municipalities also play animportant role in education.
The Ministry for the Environment is responsible forthe implementation of the UNFCCC and coordinatednational climate change policymaking in closecooperation with the Ministries of Industry andCommerce, Transport and Communications,Fisheries, Finance, Foreign Affairs and the PrimeMinister’s Office. Several public institutions andpublic enterprises, operating under the auspices of
these ministries, also participated directly or indirect-ly in preparing the national implementation policy.
1.2 Population
The population of Iceland is 286,0001. The populationis projected to grow by about 12% over the next twodecades, reaching 312,000 in 2020. Settlement isprimarily along the coast. About 62% of the nationlives in the capital, Reykjavik, and surroundingareas. In 1990 this same ratio was 57%, demonstrat-ing higher population growth in the capital area thanin smaller communities and rural areas. Thepopulation density is three inhabitants per squarekilometer. Given the large percentage of thepopulation living in and around the capital, the restof the country is even more sparsely populated, withless than one inhabitant per square km. The dispersedsettlement of the country results in relatively highemissions of greenhouse gases due to transport.Emissions from space heating are, however, muchlower than what might be expected, keeping in mindthe cold temperate climate. This is because themajority of the population relies on renewableenergy sources for district heating, as will beexplained in more detail in the energy chapter.
1.3 Geography
Iceland is the second largest island in Europe afterGreat Britain, and has a total area of 103,000 km2.Geologically Iceland is a very young country, and itsformation is still going on. It consists almost exclusi-vely of volcanic rock, lava and sediment and hasvolcanic and seismic activity. The interior consists ofmountains and high plateaus. The average heightabove sea level is 500 meters; the highest point is2119 meters. Only one-fourth of the country is under200 meters elevation.
6
1. National circumstances
1 In December 2001 the exact number of the population was 286,250 according toStatistics Iceland (the national statistical bureau of Iceland).
Glaciers are a distinctive feature of Iceland, coveringabout 11% of the total land area. The largest glacier isVatnajökull in Southeast Iceland with an area of 8300km2. Regular monitoring has shown that all glaciersin Iceland are receding.
Rivers and lakes are numerous in Iceland, coveringabout 6% of the total land area. Freshwater suppliesare abundant, but the rivers flowing from thehighlands to the sea also provide major potential forhydropower development. Geothermal energy isanother domestic source of energy.
Soil erosion and desertification is a problem inIceland, and more than half of the country’s vegeta-tion cover is estimated to have disappeared becauseof erosion since the settlement period. This isparticularly due to clearing of woodlands and over-grazing, which have accelerated erosion of thesensitive volcanic soil. Remnants of the formerwoodlands now cover less than 1,200 km2, or onlyabout 1% of the total surface area. Around 60% of thevegetation cover is dry land vegetation andwetlands. Arable and permanent cropland amountsto approximately 1,300 km2 (1%). Systematic re-vegetation began more than a century ago with theestablishment of the Soil Conservation Service ofIceland, which is a governmental agency. Reforesta-tion projects have also been numerous in the lastdecades, and especially noteworthy is the activeparticipation of the public in both soil conservationprojects and reforestation projects.
A geographic description is not complete withoutmentioning the diversity of marine resources in thecountry’s 758,000-km2 exclusive economic zone. Theabundance of marine plants and animals results fromthe influence of the Gulf Stream and the mixing ofthe warmer waters of the Atlantic with cold Arcticwaters. Approximately 270 fish species have beenfound within the Icelandic 200-mile exclusiveeconomic zone; about 150 of these are known tospawn in the area.
1.4 Climate
Iceland is situated just south of the Arctic Circle. Themean temperature is considerably higher than mightbe expected at this latitude. Relatively warm wintersand cool summers characterize Iceland’s oceanicclimate. The average monthly temperature variesfrom -3 to +3 °C in January and from +8 to +15 °C inJuly. Storms and rain are frequent, with annualprecipitation ranging from 400 to 4000 mm on
average annually, depending on location. The annualaverage in Reykjavik is 805 mm.
The mild climate stems from the Gulf Stream andattendant warm ocean currents from the Gulf ofMexico. The weather is also affected by polarcurrents from East Greenland that travel southeasttowards the coastline of the northern and easternpart of Iceland.
The amount of daylight varies greatly between theseasons. For two to three months in the summerthere is almost continuous daylight; early spring andlate autumn enjoy long twilight, but from Novemberuntil the end of January, the daylight is limited toonly three or four hours.
1.5 Economy
Iceland is an industrialized country with a highliving standard. The GDP per capita in 2001 wasUSD 26,000, based on current exchange rates, and30,400, based on purchasing power parities. Icelandconsistently ranks among the top 10 states in theUNDP Human Development Index. Economicgrowth has been high in recent years, averaging 2.7%for the last 10 years.
The service sector dominates the economy with a62.5% share of GDP in 2001. Industry (includingmanufacturing and construction), accounted for23.6%; the share of fisheries was 12.5%, and agricult-ure contributed 1.4% to GDP. Iceland dependsheavily on its natural resources to generate foreignrevenue. The fishing industry relies on marineresources, the aluminum and ferrosilicon industry onhydropower and geothermal energy and the tourismindustry on nature and natural beauty. Fishing andfish processing accounted for 40% of total exports;the share of tourism was 12,4%, and aluminum andferrosilicon production accounted for 14.7% of ex-ports in 2001.
1.6 Energy
The energy sector is unique in many ways. In 2000the per capita energy use was close to 500 MJ, whichis high compared with other industrial countries, butthe proportion of domestic renewable energy in thetotal energy budget is 70%, which is a much largershare than in most other countries.A cool climate and sparse population calls for highenergy use for heating and transport. Also, key
7
industries, such as fisheries and aluminumproduction, are energy-intensive. The increase in theuse of electricity in the last decade is largely due toan expansion of energy-intensive industry.
Iceland has ample reserves of renewable energy inthe form of hydro- and geothermal energy, and theseenergy sources are used for district heating and prod-uction of electricity. As table 1.1 demonstrates, theuse of fossil fuels for stationary energy is almost non-existent. Fossil fuel is used for transport on land, seaand air.
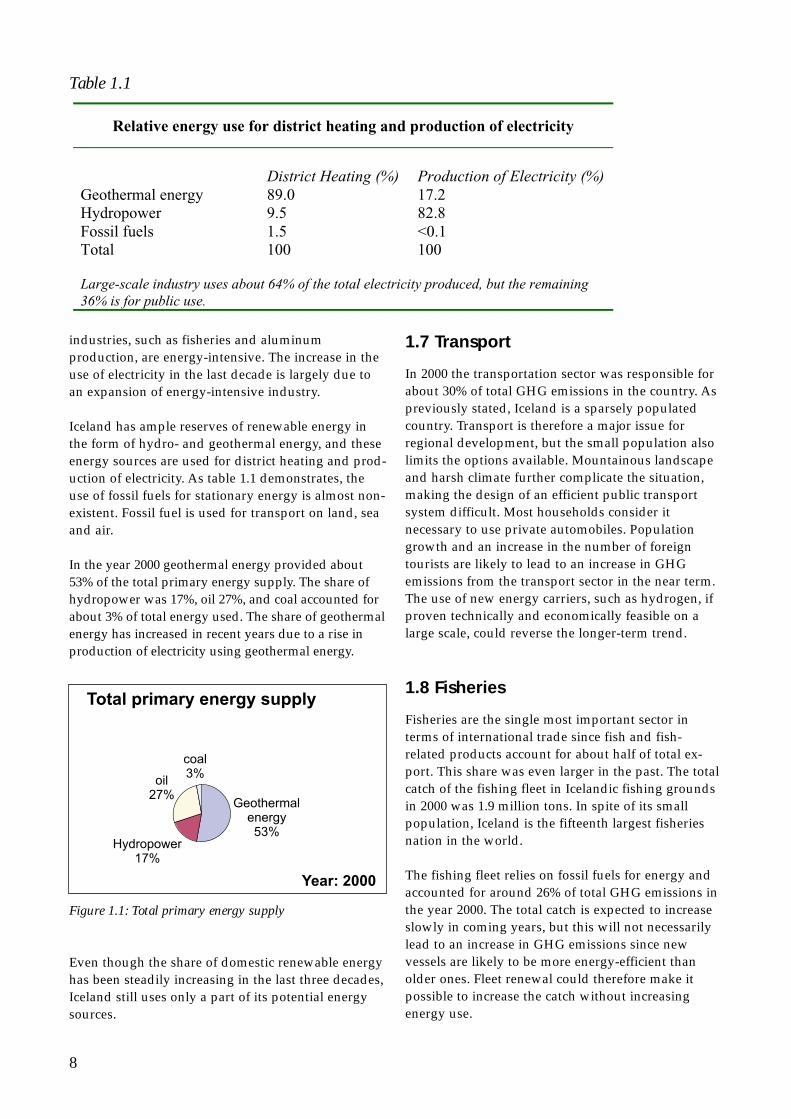
In the year 2000 geothermal energy provided about53% of the total primary energy supply. The share ofhydropower was 17%, oil 27%, and coal accounted forabout 3% of total energy used. The share of geothermalenergy has increased in recent years due to a rise inproduction of electricity using geothermal energy.
Figure 1.1: Total primary energy supply
Even though the share of domestic renewable energyhas been steadily increasing in the last three decades,Iceland still uses only a part of its potential energysources.
1.7 Transport
In 2000 the transportation sector was responsible forabout 30% of total GHG emissions in the country. Aspreviously stated, Iceland is a sparsely populatedcountry. Transport is therefore a major issue forregional development, but the small population alsolimits the options available. Mountainous landscapeand harsh climate further complicate the situation,making the design of an efficient public transportsystem difficult. Most households consider itnecessary to use private automobiles. Populationgrowth and an increase in the number of foreigntourists are likely to lead to an increase in GHGemissions from the transport sector in the near term.The use of new energy carriers, such as hydrogen, ifproven technically and economically feasible on alarge scale, could reverse the longer-term trend.
1.8 Fisheries
Fisheries are the single most important sector interms of international trade since fish and fish-related products account for about half of total ex-port. This share was even larger in the past. The totalcatch of the fishing fleet in Icelandic fishing groundsin 2000 was 1.9 million tons. In spite of its smallpopulation, Iceland is the fifteenth largest fisheriesnation in the world.
The fishing fleet relies on fossil fuels for energy andaccounted for around 26% of total GHG emissions inthe year 2000. The total catch is expected to increaseslowly in coming years, but this will not necessarilylead to an increase in GHG emissions since newvessels are likely to be more energy-efficient thanolder ones. Fleet renewal could therefore make itpossible to increase the catch without increasingenergy use.
8
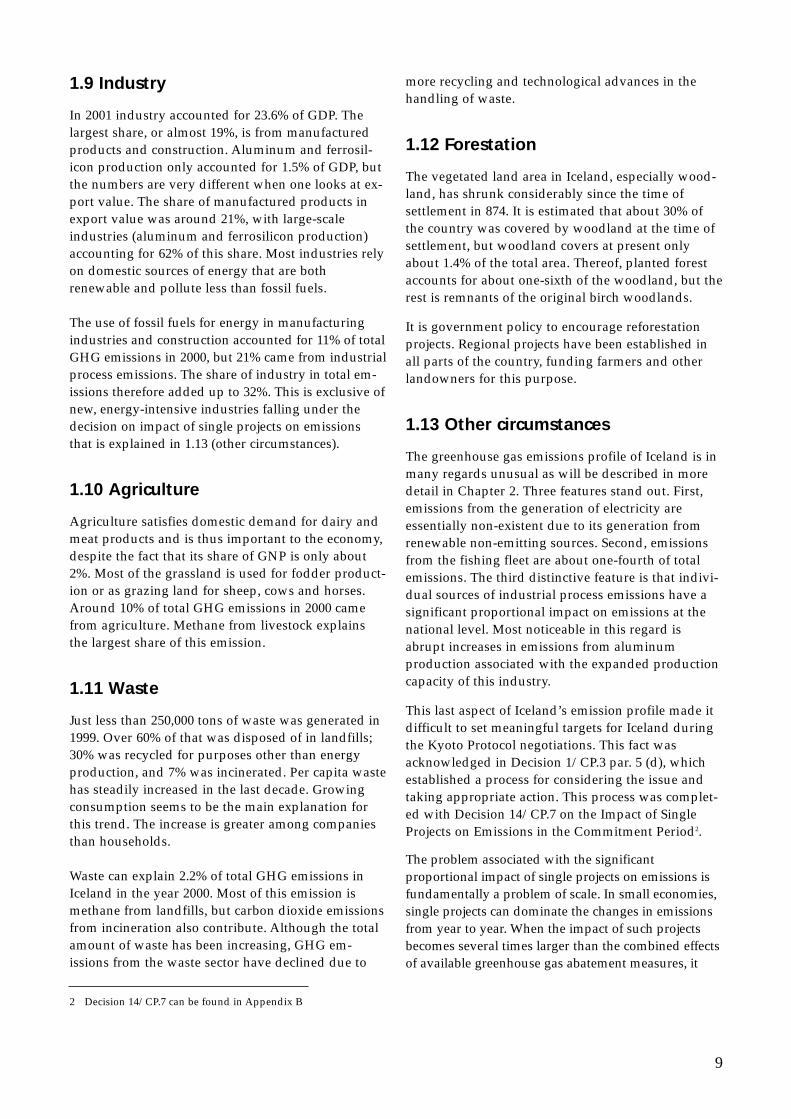
Relative energy use for district heating and production of electricity
District Heating (%) Production of Electricity (%)Geothermal energy 89.0 17.2Hydropower 9.5 82.8Fossil fuels 1.5 <0.1Total 100 100
Large-scale industry uses about 64% of the total electricity produced, but the remaining36% is for public use.
Table 1.1
1.9 Industry
In 2001 industry accounted for 23.6% of GDP. Thelargest share, or almost 19%, is from manufacturedproducts and construction. Aluminum and ferrosil-icon production only accounted for 1.5% of GDP, butthe numbers are very different when one looks at ex-port value. The share of manufactured products inexport value was around 21%, with large-scaleindustries (aluminum and ferrosilicon production)accounting for 62% of this share. Most industries relyon domestic sources of energy that are bothrenewable and pollute less than fossil fuels.
The use of fossil fuels for energy in manufacturingindustries and construction accounted for 11% of totalGHG emissions in 2000, but 21% came from industrialprocess emissions. The share of industry in total em-issions therefore added up to 32%. This is exclusive ofnew, energy-intensive industries falling under thedecision on impact of single projects on emissionsthat is explained in 1.13 (other circumstances).
1.10 Agriculture
Agriculture satisfies domestic demand for dairy andmeat products and is thus important to the economy,despite the fact that its share of GNP is only about2%. Most of the grassland is used for fodder product-ion or as grazing land for sheep, cows and horses.Around 10% of total GHG emissions in 2000 camefrom agriculture. Methane from livestock explainsthe largest share of this emission.
1.11 Waste
Just less than 250,000 tons of waste was generated in1999. Over 60% of that was disposed of in landfills;30% was recycled for purposes other than energyproduction, and 7% was incinerated. Per capita wastehas steadily increased in the last decade. Growingconsumption seems to be the main explanation forthis trend. The increase is greater among companiesthan households.
Waste can explain 2.2% of total GHG emissions inIceland in the year 2000. Most of this emission ismethane from landfills, but carbon dioxide emissionsfrom incineration also contribute. Although the totalamount of waste has been increasing, GHG em-issions from the waste sector have declined due to
more recycling and technological advances in thehandling of waste.
1.12 Forestation
The vegetated land area in Iceland, especially wood-land, has shrunk considerably since the time ofsettlement in 874. It is estimated that about 30% ofthe country was covered by woodland at the time ofsettlement, but woodland covers at present onlyabout 1.4% of the total area. Thereof, planted forestaccounts for about one-sixth of the woodland, but therest is remnants of the original birch woodlands.
It is government policy to encourage reforestationprojects. Regional projects have been established inall parts of the country, funding farmers and otherlandowners for this purpose.
1.13 Other circumstances
The greenhouse gas emissions profile of Iceland is inmany regards unusual as will be described in moredetail in Chapter 2. Three features stand out. First,emissions from the generation of electricity areessentially non-existent due to its generation fromrenewable non-emitting sources. Second, emissionsfrom the fishing fleet are about one-fourth of totalemissions. The third distinctive feature is that indivi-dual sources of industrial process emissions have asignificant proportional impact on emissions at thenational level. Most noticeable in this regard isabrupt increases in emissions from aluminumproduction associated with the expanded productioncapacity of this industry.
This last aspect of Iceland’s emission profile made itdifficult to set meaningful targets for Iceland duringthe Kyoto Protocol negotiations. This fact wasacknowledged in Decision 1/CP.3 par. 5 (d), whichestablished a process for considering the issue andtaking appropriate action. This process was complet-ed with Decision 14/CP.7 on the Impact of SingleProjects on Emissions in the Commitment Period2.
The problem associated with the significantproportional impact of single projects on emissions isfundamentally a problem of scale. In small economies,single projects can dominate the changes in emissionsfrom year to year. When the impact of such projectsbecomes several times larger than the combined effectsof available greenhouse gas abatement measures, it
9
2 Decision 14/CP.7 can be found in Appendix B
becomes very difficult for the party involved to adoptquantified emissions limitations.
It does not take a large source to strongly influencethe total emissions from Iceland. A single aluminumplant can add more than 15% to the country’s totalGHG emissions. A plant of the same size would havenegligible effect on emissions in most industrializedcountries.
Decision 14/CP.7 sets a threshold for significantproportional impact of single projects at 5% of totalcarbon dioxide emissions of a party in 1990. Projectsexceeding this threshold shall be reported separatelyand carbon dioxide emissions from them notincluded in national totals to the extent that theywould cause the party to exceed its assigned amount.Iceland can therefore not transfer Assigned AmountUnits to other Parties through internationalemissions trading. The total amount that can bereported separately under this decision is set at 1.6million tons of carbon dioxide.
The scope of Decision 14/CP.7 is explicitly limited tosmall economies, defined as economies emitting lessthan 0.05% of total Annex I emissions in 1990. Inaddition to the criteria above, which relate to thefundamental problem of scale, additional criteria areincluded that relate to the nature of the project andthe emission savings resulting from it. Only projects,where renewable energy is used, and where this useof renewable energy results in a reduction in green-house gas emissions per unit of production, will beeligible. The use of best environmental practice andbest available technology is also required. Theseadditional criteria and requirements do not rest onthe original mandate from 1/CP.3 but provide theassurance that only projects contributing to the aimsof the Kyoto Protocol will fall under the Decision.
It should be underlined that the decision only appliesto carbon dioxide emissions from industrialprocesses. Other emissions, such as energy emissionsor process emissions of other gases, such as PFCs,will not be affected. Decision 14/CP.7 is also limitedto the first commitment period. It in effect neutralizesthe impact of the increased use of renewable energyfor energy-intensive industry, such as aluminumproduction. The use of renewable energy for thispurpose reduces global emissions. Energy emissionsdominate emissions from aluminum production incountries where fossil fuel energy sources are used togenerate the electricity needed for the production.
These emissions are avoided if renewable energy isused. Aluminum smelters using coal as the energysource produce approximately seven times moregreenhouse gas emissions than smelters usinghydropower or other renewable energy sources.
Paragraph 4 of Decision 14/CP.7 requests any Partyintending to avail itself of the provisions of thatdecision to notify the Conference of the Parties, priorto its eighth session, of its intention. The Governmentof Iceland acceded to the Kyoto Protocol on May23rd 2002 and with a letter, dated October 17th 20023,notified the Conference of the Parties of its intentionto avail itself of the provisions of Decision 14/CP.7.Iceland made a statement to this same effect underagenda item 3 of the 17th session of the SubsidiaryBody for Implementation in June 2002.
Decision 14/CP.7 further requests any Party withprojects meeting the requirements specified in theDecision, to report emission factors, total processemissions from these projects, and an estimate of theemission savings resulting from the use of renewableenergy in these projects in their annual inventorysubmissions. The secretariat is requested to compileinformation submitted by Parties in accordance withthe above request, to provide comparisons withrelevant emission factors reported by other Parties,and to report this information to the Conference ofthe Parties serving as the meeting of the Parties tothe Kyoto Protocol. Iceland has already initiatedpreparations for the implementation of these specialreporting provisions. One part of these changes inreporting was reflected in the inventory report forthe year 2000 submitted in April 2002. This inventorywas presented as called for in Decision 14/CP.7. Theprojections presented in this NationalCommunication are based on the same approach.This was done to facilitate evaluation of the emissiontrends in Iceland and the policies and measuresbeing implemented or planned. It was consideredmore consistent with the intent of 14/CP.7 to use thisapproach to reporting also for the period leading upto the commitment period rather than to introducean abrupt change in the reporting approach in 2008.
For the year 2000, two projects fell under the singleproject definition and were therefore reportedseparately4. CO2 emissions from those projects arenot included in total emissions in the inventory from2000 and are also not included in the discussionabout Iceland’s emissions in this national commun-ication report unless they are mentioned specifically.
10
3 The text of this letter can be found in FCCC/CP/2002/MISC.2.4 Emissions from an expansion of a ferroalloy plant of 150.6 Gg CO2 and emissions from an expansion of an aluminum plant of 122.2 Gg CO2.
2.1 Key developments
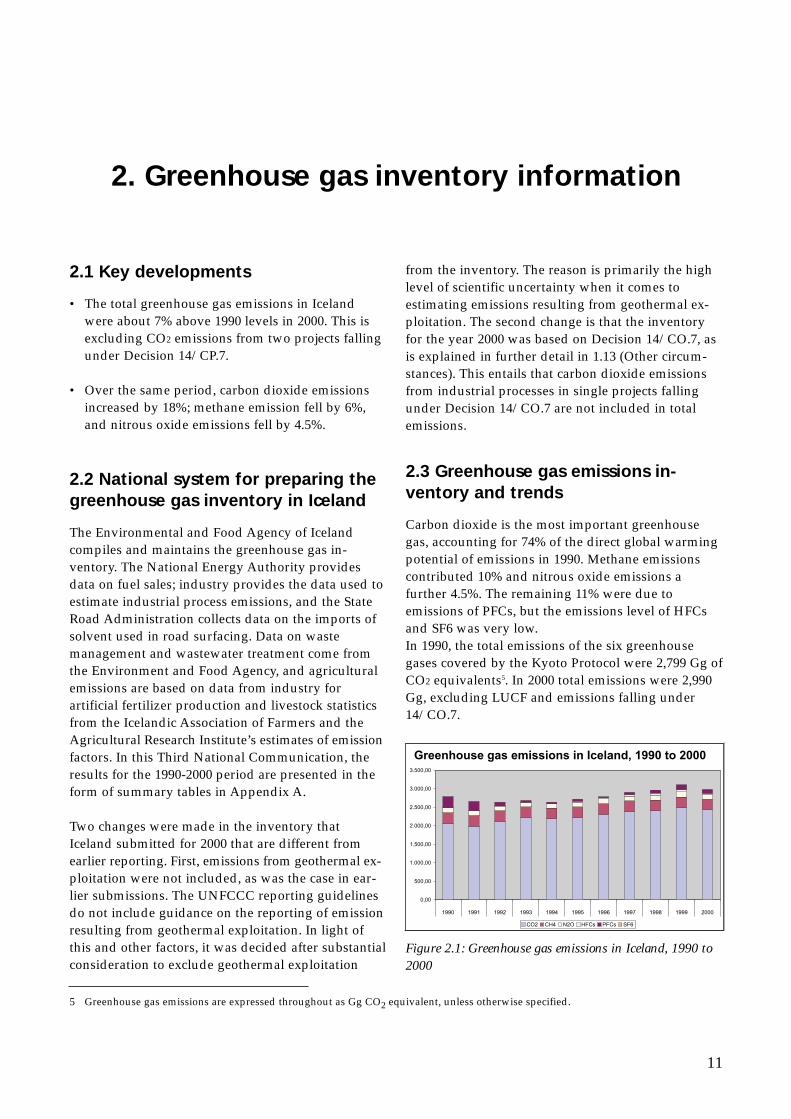
• The total greenhouse gas emissions in Icelandwere about 7% above 1990 levels in 2000. This isexcluding CO2 emissions from two projects fallingunder Decision 14/CP.7.
• Over the same period, carbon dioxide emissionsincreased by 18%; methane emission fell by 6%,and nitrous oxide emissions fell by 4.5%.
2.2 National system for preparing thegreenhouse gas inventory in Iceland
The Environmental and Food Agency of Icelandcompiles and maintains the greenhouse gas in-ventory. The National Energy Authority providesdata on fuel sales; industry provides the data used toestimate industrial process emissions, and the StateRoad Administration collects data on the imports ofsolvent used in road surfacing. Data on wastemanagement and wastewater treatment come fromthe Environment and Food Agency, and agriculturalemissions are based on data from industry forartificial fertilizer production and livestock statisticsfrom the Icelandic Association of Farmers and theAgricultural Research Institute’s estimates of emissionfactors. In this Third National Communication, theresults for the 1990-2000 period are presented in theform of summary tables in Appendix A.
Two changes were made in the inventory thatIceland submitted for 2000 that are different fromearlier reporting. First, emissions from geothermal ex-ploitation were not included, as was the case in ear-lier submissions. The UNFCCC reporting guidelinesdo not include guidance on the reporting of emissionresulting from geothermal exploitation. In light ofthis and other factors, it was decided after substantialconsideration to exclude geothermal exploitation
from the inventory. The reason is primarily the highlevel of scientific uncertainty when it comes toestimating emissions resulting from geothermal ex-ploitation. The second change is that the inventoryfor the year 2000 was based on Decision 14/CO.7, asis explained in further detail in 1.13 (Other circum-stances). This entails that carbon dioxide emissionsfrom industrial processes in single projects fallingunder Decision 14/CO.7 are not included in totalemissions.
2.3 Greenhouse gas emissions in-ventory and trends
Carbon dioxide is the most important greenhousegas, accounting for 74% of the direct global warmingpotential of emissions in 1990. Methane emissionscontributed 10% and nitrous oxide emissions afurther 4.5%. The remaining 11% were due toemissions of PFCs, but the emissions level of HFCsand SF6 was very low. In 1990, the total emissions of the six greenhousegases covered by the Kyoto Protocol were 2,799 Gg ofCO2 equivalents5. In 2000 total emissions were 2,990Gg, excluding LUCF and emissions falling under14/CO.7.
Figure 2.1: Greenhouse gas emissions in Iceland, 1990 to2000
11
2. Greenhouse gas inventory information
5 Greenhouse gas emissions are expressed throughout as Gg CO2 equivalent, unless otherwise specified.
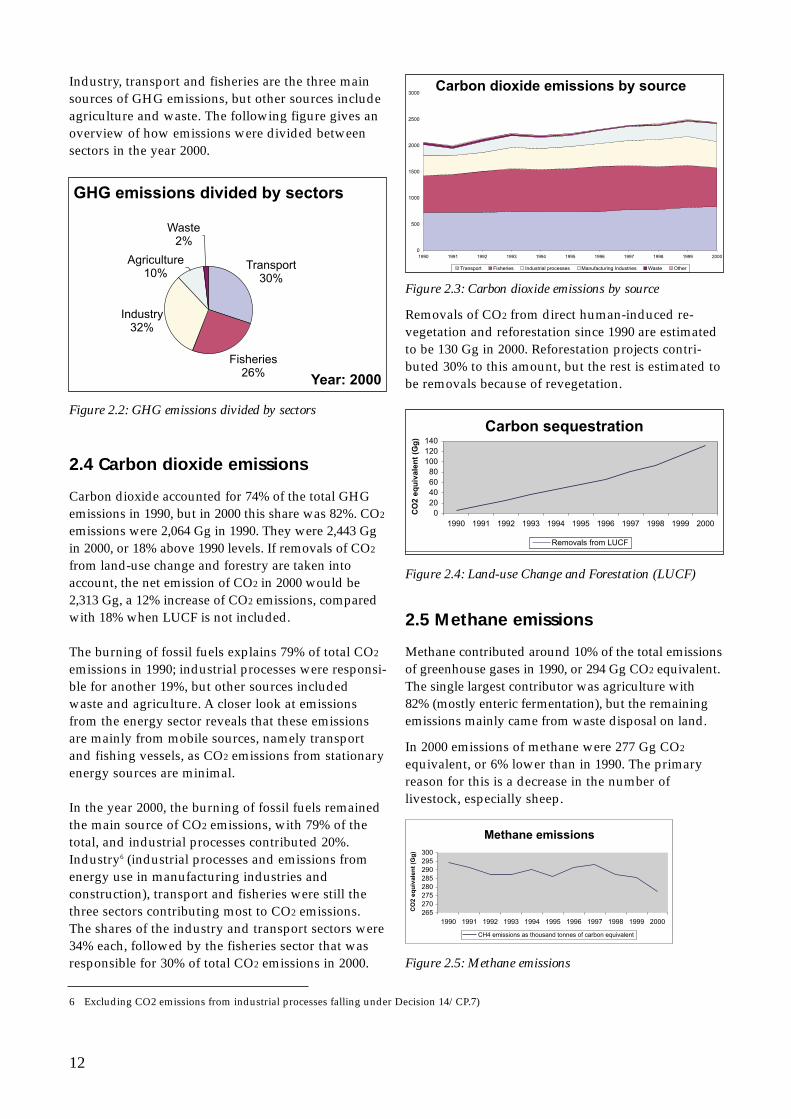
Industry, transport and fisheries are the three mainsources of GHG emissions, but other sources includeagriculture and waste. The following figure gives anoverview of how emissions were divided betweensectors in the year 2000.
Figure 2.2: GHG emissions divided by sectors
2.4 Carbon dioxide emissions
Carbon dioxide accounted for 74% of the total GHGemissions in 1990, but in 2000 this share was 82%. CO2
emissions were 2,064 Gg in 1990. They were 2,443 Ggin 2000, or 18% above 1990 levels. If removals of CO2
from land-use change and forestry are taken intoaccount, the net emission of CO2 in 2000 would be2,313 Gg, a 12% increase of CO2 emissions, comparedwith 18% when LUCF is not included.
The burning of fossil fuels explains 79% of total CO2
emissions in 1990; industrial processes were responsi-ble for another 19%, but other sources includedwaste and agriculture. A closer look at emissionsfrom the energy sector reveals that these emissionsare mainly from mobile sources, namely transportand fishing vessels, as CO2 emissions from stationaryenergy sources are minimal.
In the year 2000, the burning of fossil fuels remainedthe main source of CO2 emissions, with 79% of thetotal, and industrial processes contributed 20%.Industry6 (industrial processes and emissions fromenergy use in manufacturing industries andconstruction), transport and fisheries were still thethree sectors contributing most to CO2 emissions.The shares of the industry and transport sectors were34% each, followed by the fisheries sector that wasresponsible for 30% of total CO2 emissions in 2000.
Figure 2.3: Carbon dioxide emissions by source
Removals of CO2 from direct human-induced re-vegetation and reforestation since 1990 are estimatedto be 130 Gg in 2000. Reforestation projects contri-buted 30% to this amount, but the rest is estimated tobe removals because of revegetation.
Figure 2.4: Land-use Change and Forestation (LUCF)
2.5 Methane emissions
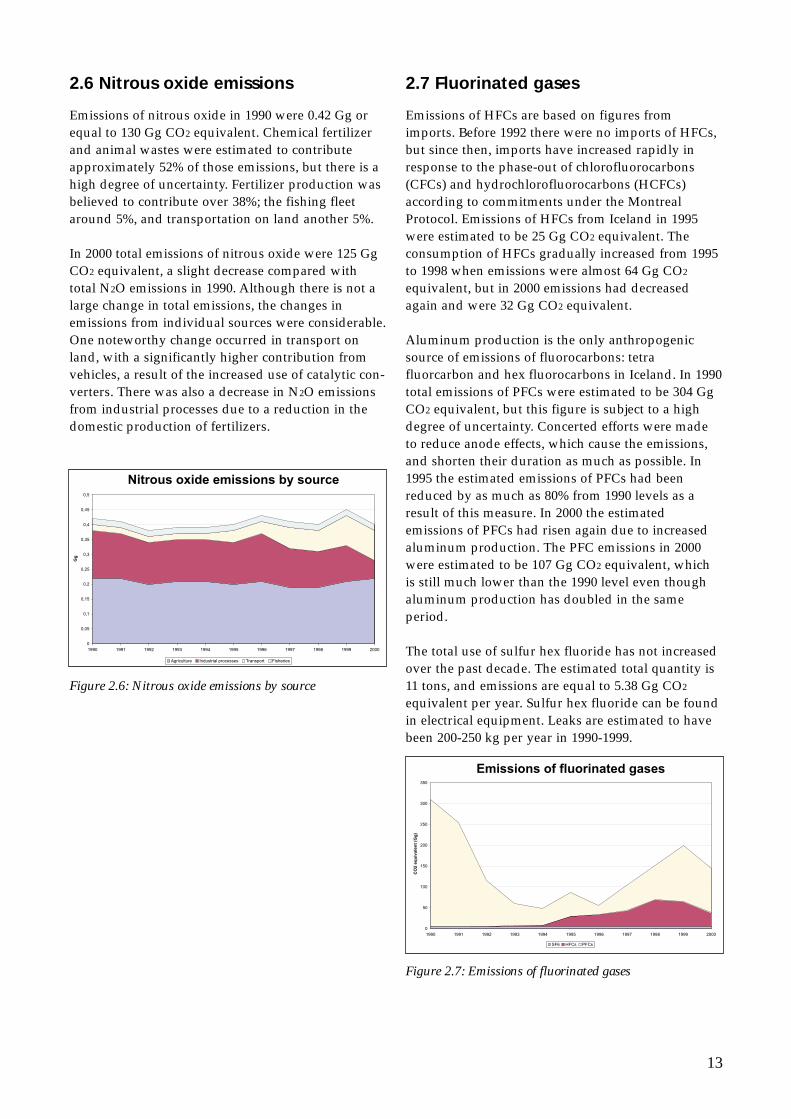
Methane contributed around 10% of the total emissionsof greenhouse gases in 1990, or 294 Gg CO2 equivalent.The single largest contributor was agriculture with82% (mostly enteric fermentation), but the remainingemissions mainly came from waste disposal on land.
In 2000 emissions of methane were 277 Gg CO2
equivalent, or 6% lower than in 1990. The primaryreason for this is a decrease in the number oflivestock, especially sheep.
Figure 2.5: Methane emissions
12
6 Excluding CO2 emissions from industrial processes falling under Decision 14/CP.7)
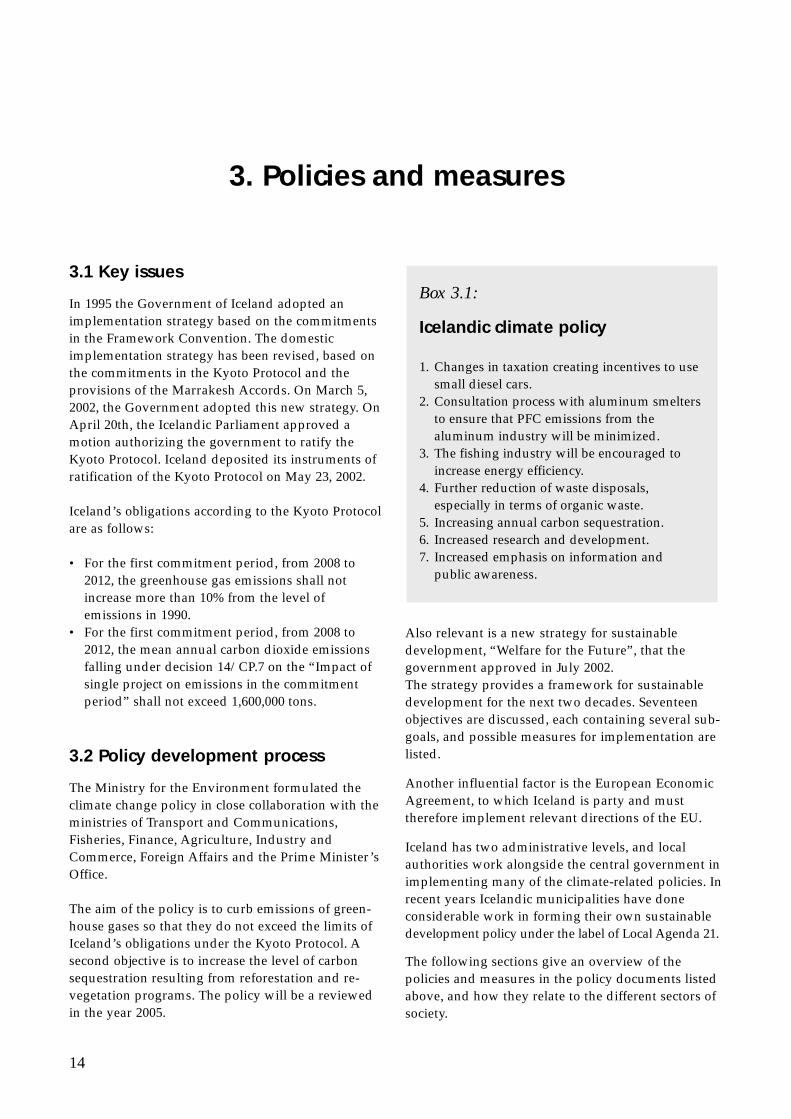
2.6 Nitrous oxide emissions
Emissions of nitrous oxide in 1990 were 0.42 Gg orequal to 130 Gg CO2 equivalent. Chemical fertilizerand animal wastes were estimated to contributeapproximately 52% of those emissions, but there is ahigh degree of uncertainty. Fertilizer production wasbelieved to contribute over 38%; the fishing fleetaround 5%, and transportation on land another 5%.
In 2000 total emissions of nitrous oxide were 125 GgCO2 equivalent, a slight decrease compared withtotal N2O emissions in 1990. Although there is not alarge change in total emissions, the changes inemissions from individual sources were considerable.One noteworthy change occurred in transport onland, with a significantly higher contribution fromvehicles, a result of the increased use of catalytic con-verters. There was also a decrease in N2O emissionsfrom industrial processes due to a reduction in thedomestic production of fertilizers.
Figure 2.6: Nitrous oxide emissions by source
2.7 Fluorinated gases
Emissions of HFCs are based on figures fromimports. Before 1992 there were no imports of HFCs,but since then, imports have increased rapidly inresponse to the phase-out of chlorofluorocarbons(CFCs) and hydrochlorofluorocarbons (HCFCs)according to commitments under the MontrealProtocol. Emissions of HFCs from Iceland in 1995were estimated to be 25 Gg CO2 equivalent. Theconsumption of HFCs gradually increased from 1995to 1998 when emissions were almost 64 Gg CO2
equivalent, but in 2000 emissions had decreasedagain and were 32 Gg CO2 equivalent.
Aluminum production is the only anthropogenicsource of emissions of fluorocarbons: tetrafluorcarbon and hex fluorocarbons in Iceland. In 1990total emissions of PFCs were estimated to be 304 GgCO2 equivalent, but this figure is subject to a highdegree of uncertainty. Concerted efforts were madeto reduce anode effects, which cause the emissions,and shorten their duration as much as possible. In1995 the estimated emissions of PFCs had beenreduced by as much as 80% from 1990 levels as aresult of this measure. In 2000 the estimatedemissions of PFCs had risen again due to increasedaluminum production. The PFC emissions in 2000were estimated to be 107 Gg CO2 equivalent, whichis still much lower than the 1990 level even thoughaluminum production has doubled in the sameperiod.
The total use of sulfur hex fluoride has not increasedover the past decade. The estimated total quantity is11 tons, and emissions are equal to 5.38 Gg CO2
equivalent per year. Sulfur hex fluoride can be foundin electrical equipment. Leaks are estimated to havebeen 200-250 kg per year in 1990-1999.
Figure 2.7: Emissions of fluorinated gases
13
3.1 Key issues
In 1995 the Government of Iceland adopted animplementation strategy based on the commitmentsin the Framework Convention. The domesticimplementation strategy has been revised, based onthe commitments in the Kyoto Protocol and theprovisions of the Marrakesh Accords. On March 5,2002, the Government adopted this new strategy. OnApril 20th, the Icelandic Parliament approved amotion authorizing the government to ratify theKyoto Protocol. Iceland deposited its instruments ofratification of the Kyoto Protocol on May 23, 2002.
Iceland’s obligations according to the Kyoto Protocolare as follows:
• For the first commitment period, from 2008 to2012, the greenhouse gas emissions shall notincrease more than 10% from the level ofemissions in 1990.
• For the first commitment period, from 2008 to2012, the mean annual carbon dioxide emissionsfalling under decision 14/CP.7 on the “Impact ofsingle project on emissions in the commitmentperiod” shall not exceed 1,600,000 tons.
3.2 Policy development process
The Ministry for the Environment formulated theclimate change policy in close collaboration with theministries of Transport and Communications,Fisheries, Finance, Agriculture, Industry andCommerce, Foreign Affairs and the Prime Minister’sOffice.
The aim of the policy is to curb emissions of green-house gases so that they do not exceed the limits ofIceland’s obligations under the Kyoto Protocol. Asecond objective is to increase the level of carbonsequestration resulting from reforestation and re-vegetation programs. The policy will be a reviewedin the year 2005.
Also relevant is a new strategy for sustainabledevelopment, “Welfare for the Future”, that thegovernment approved in July 2002.The strategy provides a framework for sustainabledevelopment for the next two decades. Seventeenobjectives are discussed, each containing several sub-goals, and possible measures for implementation arelisted.
Another influential factor is the European EconomicAgreement, to which Iceland is party and musttherefore implement relevant directions of the EU.
Iceland has two administrative levels, and localauthorities work alongside the central government inimplementing many of the climate-related policies. Inrecent years Icelandic municipalities have doneconsiderable work in forming their own sustainabledevelopment policy under the label of Local Agenda 21.
The following sections give an overview of thepolicies and measures in the policy documents listedabove, and how they relate to the different sectors ofsociety.
Box 3.1:
Icelandic climate policy
1. Changes in taxation creating incentives to usesmall diesel cars.
2. Consultation process with aluminum smelters to ensure that PFC emissions from the aluminum industry will be minimized.
3. The fishing industry will be encouraged toincrease energy efficiency.
4. Further reduction of waste disposals, especially in terms of organic waste.
5. Increasing annual carbon sequestration. 6. Increased research and development.7. Increased emphasis on information and
public awareness.
14
3. Policies and measures
3.3 The energy sector
Measures related to electricity generation andhousehold energy efficiency form the backbone of theclimate policy of many industrialized countries. InIceland the situation is very different, given the factthat the country already relies heavily on renewableenergy sources to provide heating and electricity.More than 80% of GHG emissions from energy comefrom mobile sources (transport on land and fishingvessels) where cuts in emissions are generallyconsidered more difficult to achieve than fromstationary energy sources.
The proportion of renewable energy in the totalprimary energy supply is presently around 70%, butIceland’s newest strategy for sustainable develop-ment states the goal of decreasing the share of fossilfuels even further in coming decades. The aim is thattransport will use energy from renewable energyresources as soon as it is economically feasible to doso. This policy will be further discussed in the sectionon transport and the section on research anddevelopment.
3.4 The transportation sector
Transportation is one of the fastest growing sourcesof greenhouse gas emissions in Iceland. In 2000 thetransport sector was responsible for 30% of totalGHG emissions in the country.
One of the main measures listed in the Icelandicclimate change policy is a change in the taxationsystem that will provide added incentives for the useof small diesel cars. In the current system owners ofdiesel cars pay a special tax every year, depending onthe weight of their vehicle. The owners have a choiceof a fixed tax or a milage tax. The proposed changeaims at transferring the taxes into user charge tax forusing diesel fuel. This change is expected to result ina transfer of around 10% of current gasoline use tothe diesel fuel and a corresponding decrease in GHGemission.
Other measures in this sector that are listed in thegovernment policy include:• Review of import fees for vehicles to determine if
changes in fees are a feasible option to increase theshare of energy-efficient vehicles;
• Increased coordination of traffic lights;• Increased emphasis on short travel distances in
physical planning of urban areas;• Improvement of public transportation systems;
The Ministry of Finance will be responsible forimplementing this change in taxation, but otherpolicy measures related to the transport sector fallunder the Ministry of Transport and Communication.
3.4.1 Policies on the local level
Implementation of some of the measures listed abovecan only be achieved in cooperation with localgovernments. This is especially relevant to urbanplanning and improvement of public transportationsystems. The participation of Icelandic municipalitiesin Local Agenda 21 has greatly increased theirawareness of environmental issues, including climatechange, and many municipalities have integratedmeasures to cut GHG emissions in the transport sect-or in their planning.
Reykjavik, the capital of Iceland, is the largest mun-icipality with almost 40% of the population.Reykjavik’s environmental policy states the objectiveof contributing to Iceland’s task of fulfilling its
Box 3.2:
International hydrogen projects
The Icelandic government has offered politicalsupport to those interested in developinghydrogen as an energy carrier in the transportsector, which would greatly reduce GHGemissions from mobile sources. In 1997 theMinistry of Industry and Commerce appointeda special committee to explore available optionsfor use of domestic renewable energy resourcesin relation to hydrogen and methanol. Thecommittee recommended the establishment of aprivate company whose function was tomaintain foreign contacts made by committeemembers, and to support further research anddevelopment. The company, Icelandic NewEnergy, was formed shortly thereafter and is ajoint venture owned by VistOrka hf. (a commonplatform for most energy companies in Iceland),Daimler Chrysler, Norsk Hydro and ShellHydrogen. Foreign companies see Iceland as anideal testing site for hydrogen projects becauseof the small size of society, the availability ofrenewable energy and the political commitmentof the Icelandic government to the issue. Thehydrogen projects are discussed in more detailin chapter 7.
15
obligations under the UNFCCC. The city alreadyparticipates in two transport-related projects thatcould help reach this goal:
• Reykjavik takes part in ECTOS, an internationalhydrogen project, in cooperation with IcelandicNew Energy, Daimler-Chrysler and ShellHydrogen. Experiments with public buses usinghydrogen as the energy carrier are to begin in thelater half of 2003.
• SORPA, an independent waste management firmowned by Reykjavik and six other municipalities,has been experimenting with using methane fromlandfills as a vehicle fuel. As of fall 2002, 38vehicles fuelled by methane were in use in theReykjavik area.
Another example of a municipality that has in-tegrated measures to curb emissions of GHG in thetransport sector is Akureyri, a town of 15,000 inhabitants, located in northern Iceland. In its municipal planning for 1998-2018, the town states itsgoal of keeping GHG emissions from transport at thesame level as in 2000. Several measures are listed toreach this objective, with dates when specific measures are to be implemented.
3.5 The fisheries sector
Fisheries is another sector that is important in termsof GHG emissions in Iceland, and the use of fossilfuels for fishing vessels explains about 26% of totalGHG emissions in the year 2000. Use of HFCs incooling systems onboard fishing vessels also adds toGHG emissions.
As is the case with transport on land, reductions inemissions from fishing vessels are difficult toachieve. Emissions are expected to rise somewhatdue to an increase in catch, but the governmentpolicy states that a major objective in the fisheriessector is to improve energy efficiency, therebyminimizing the energy needed per ton of fish-catch.Three measures are specifically listed in the policy:• To educate vessel owners and fishers about the
importance of energy saving and options availableto increase energy efficiency.
• To encourage the equipping of new vessels enter-ing the fishing fleet with the best availabletechnology in terms of energy efficiency.
• To reduce use of HFC cooling systems. Currentlythe use of HFCs is banned with the exception ofuse for cooling systems and in certain medicalapplications.
The Ministry of Fisheries is responsible for implementation of climate change policies in the fisheries sector.
3.6 Industrial processes
Industrial processes in energy-intensive industriesaccounted for 21% of total GHG emissions in Icelandin the year 2000. This excludes CO2 emissions fromthe two projects falling under Decision 14/CP.7. PFCemissions from energy-intensive industries do notfall under this Decision, and climate-related policiesin the industrial sector are primarily focused onlimiting PFC emissions.
A voluntary agreement between aluminum smeltersand the government has already resulted in lowerPFC emissions per production unit, but the aim is toreduce these emissions even further. The goal is tokeep PFC emissions from existing smelters at thelevel of 0.22 tons of CO2 equivalents per ton of alum-inum produced, but for new smelters the target levelis 0.14 tons of CO2 equivalents.
The Ministry for the Environment and the Ministryof Industry and Commerce have initiated a formalconsultation process with the aluminum sector inorder to achieve these goals.
3.7 The waste sector
GHG emissions from the waste sector were 2.2% oftotal GHG emissions in 2000. Most of these emissionsare methane from landfills. The total amount ofwaste has been increasing in recent years.Nevertheless, GHG emissions from the sector havedeclined due to increased recycling and technologicaladvances in the handling of waste. The mostimportant measure is the collection of methane fromthe largest landfill in the country, serving all of thegreater Reykjavík area, which started in 1997.
The government climate change policy adopted inApril 2002 states the goal of further reducing wastedisposal, especially in terms of organic waste. Thisgoal is also stated in Welfare for the Future, thegovernment strategy for sustainable development. Asecond objective of the climate change policy is toincrease the collection of landfill gas for energyrecovery and environmental control.
The Ministry for the Environment is responsible forpolicies in the waste sector, but in most cases
16
implementation takes place on the local level. Manymunicipalities have integrated concerns for GHGemissions from waste in their Local Agenda 21. Oneexample of this is SORPA, an independent wastemanagement firm owned by Reykjavik city and sixother municipalities, that has been experimentingwith using methane from landfills as vehicle fuel (seethe section of policies in the transport sector). Theseexperiments will continue.
3.8 Carbon sequestration
Revegetation and reforestation is a high priority inIceland, and there is significant potential to enhancecarbon sequestration beyond the present level. In1996 the Icelandic government announced itsdecision to dedicate ISK 450 million for a four-yearprogram of revegetation and tree planting to increasethe sequestration of carbon dioxide in the biomass.This program was implemented in 1997-2000. Thestated goal was an increase of 22,000 tons in carbonsequestration. Assessment of the results of theprogram indicates that the total additionalsequestration was 27,000 tons.
Although this four-year program is over, efforts toincrease the annual carbon sequestration rateresulting from reforestation and revegetationprograms will continue in the future. A new strategicplan for soil conservation and revegetation, adoptedby the Icelandic Parliament in the spring of 2002, listscarbon sequestration as one of the four mainobjectives of the strategy. The strategic plan coversthe period of 2003 to 2014. The parliament alsorecently adopted a new five year plan of action forthe forestry sector, where attention is given to carbonseqestration.
The Ministry of Agriculture is responsible forimplementation is this area.
3.9 Research and development
The government policy on climate changeemphasizes the importance of research and develop-ment and specifically lists the following actions:• Emphasis will be put on improving methods to
estimate carbon sequestration and to create areporting system to improve both inventory andprojection estimates.
• Research and development whose aim is toincrease the use of environmentally friendlyenergy will be supported.
• More emphasis will be put on exploring ways tocurb emissions from the transport sector.
• Experiments with alternative energy that couldreplace fossil fuels will continue, as well asresearch on fuel cells and hydrogen as energycarrier.
Implementation of policies related to research anddevelopment is a joint responsibility of all ministries.Discussion on research and development is providedin more detail in Chapter 7.
3.10 Information and publicawareness
Increased emphasis on information and publicawareness is one of the seven main components ofthe Icelandic climate policy. The government policystresses the need to inform the public about optionsavailable to reduce greenhouse gas emissions on aday-to-day basis by minimizing waste, altering travelhabits and increasing fuel efficiency. The governmentalready supports some projects organized by en-vironmental NGOs, whose aim is to encourage en-vironmentally responsible behavior. Informationabout ways consumers can reduce GHG emissions intheir everyday lives is integrated into these projects.
The ministries are jointly responsible for encouragingeducation and increasing awareness. Furtherdiscussion about public education is to be found inChapter 8.
3.11 Other measures
In addition to measures specifically taken to limitGHG emissions domestically, the Icelandic climatepolicy discusses other commitments, such asinventory information for carbon sequestration,emissions trading, and financial support todeveloping countries.
According to the climate policy, a nationwideinventory system on carbon sequestration should beimplemented no later than 2007, as called for in theKyoto Protocol.
The Kyoto Protocol also deals with emissions trad-ing. Iceland’s intention to take advantage of Decision14/CP.7, which limits its options for participating inemissions trading with other countries. Each countryis free to decide whether a domestic system of emissions trading is a feasible option. In the Icelandic
17
case, this is not considered an attractive option forthe time being.
The European Union adopted a new directive inNovember 2002 dealing with permits for the tradingof emissions in the European Union. Only CO2
emissions from industry are included in thisdirective. As of early 2003, it was not clear if thedirective will apply to the European Economic Areaand to what degree it will impact Iceland.
Financial support to developing countries is anotherimportant aspect of the UNFCCC. So far, Iceland has
not made a decision about its participation in thethird replenishment of the Global EnvironmentalFund. Also relevant in this respect is a declarationfrom a group of states (the EU, Canada, New Zea-land, Norway and Iceland) that they would be will-ing to provide additional support to developingcountries equal to USD 410 million no later than2005. At the end of 2002, no decision had yet beentaken about how this amount would be dividedamong the states participating in the declaration.
Financial assistance will be discussed in more detailin Chapter 6.
18
4.1 Introduction
The Ministry for the Environment formed a workinggroup whose function was to develop projections forGHG emissions until 2020. The group was composed ofrepresentatives from various institutions, but the leadagency was the Environmental and Food Agency,which is also responsible for Iceland’s GHG emissionsinventory. The working group cooperated with theIcelandic Energy Forecast Committee, which was esta-blished in 1976 and represents companies, institutionsand organizations involved in the energy sector. Theprojections described in this chapter are based on theenergy forecast for fossil fuels that was published in thesummer of 2001, as well as assumptions about the fut-ure developments of new energy-intensive industriesfrom the Ministry of Industry and Commerce.
4.2 Scenarios and key assumptions
Two scenarios are provided in the projections. Thefirst scenario assumes no additions to energy-intensive industries other than the expansions already agreed upon in October 2001 (Scenario 1).The second scenario is based on the assumption thata new aluminum smelter will be built in Reydarfjordur, and that both of the existing aluminum plants will be enlarged (Scenario 2).
The expected effects of the key measures of theclimate change policy are integrated into theprojections (“with additional measures” projections).In addition to the two scenarios, the working group,in cooperation with the Energy Forecast Committee,also performed sensitivity analysis to estimate theemissions if these expected effects did not materialize(“with measures” projections).
The Energy Forecast Committee based its forecast forfossil fuels use during the period 2001-2030 on thefollowing main assumptions.
Economic growth during this period is expected tobe 2.5% per year, on average. The price of oil isexpected to increase slowly, and the forecast assumesthere will be no changes in the taxation system otherthan the proposed change that will affect owners ofdiesel cars (see explanation in 3.3). Energy use perunit of catch is expected to decrease in the fisheriessector, but the decrease varies depending on the typeof vessel. The number of private cars will continue toincrease due to changes in the age composition of thenation as well as an increase in the number ofhouseholds that will buy a second car. However, theaverage annual use of each car is expected todecrease slightly. The number of utility vehicles isexpected to follow growth in GDP. Cars using fossilfuels are expected to be more energy-efficient; theshare of small diesel cars is expected to rise, and theforecast also predicts that by the end of the period, in2030, 15% of the car fleet will use alternative energysources.
4.3 Projections and aggregate effectsof policies and measures
With the additional measures planned as a part ofthe revised domestic climate change strategy ofMarch 2002, the net emissions from Iceland areexpected to be within the assigned amount in theKyoto Protocol of 3,122 Gg CO2 equivalent. There is aconsiderable difference in projections depending onwhether plans for new energy-intensive industriesmaterialize or not7. In both cases Iceland is expectedto stay within its allocated amount under the Kyotoprotocol, but if policies and additional measures donot lead to the expected results, Iceland will exceedthese limits for Scenario 2. The projections do nottake into account carbon sequestration fromrevegetation and/or reforestation schemes, butpossible effects of such measures are discussedseparately in section 4.5.
19
4. Projections and the total effect of measures
7 Emissions falling under Decision 14/CP.7 are not included in these projections. However, the decision only applies to carbon dioxideemissions from industrial processes and other emissions, such as process emissions of PFCs from energy-intensive industries, whichare included in projections. Increases in energy emissions resulting from the construction of the new industry and from increasedeconomic activity are also included.
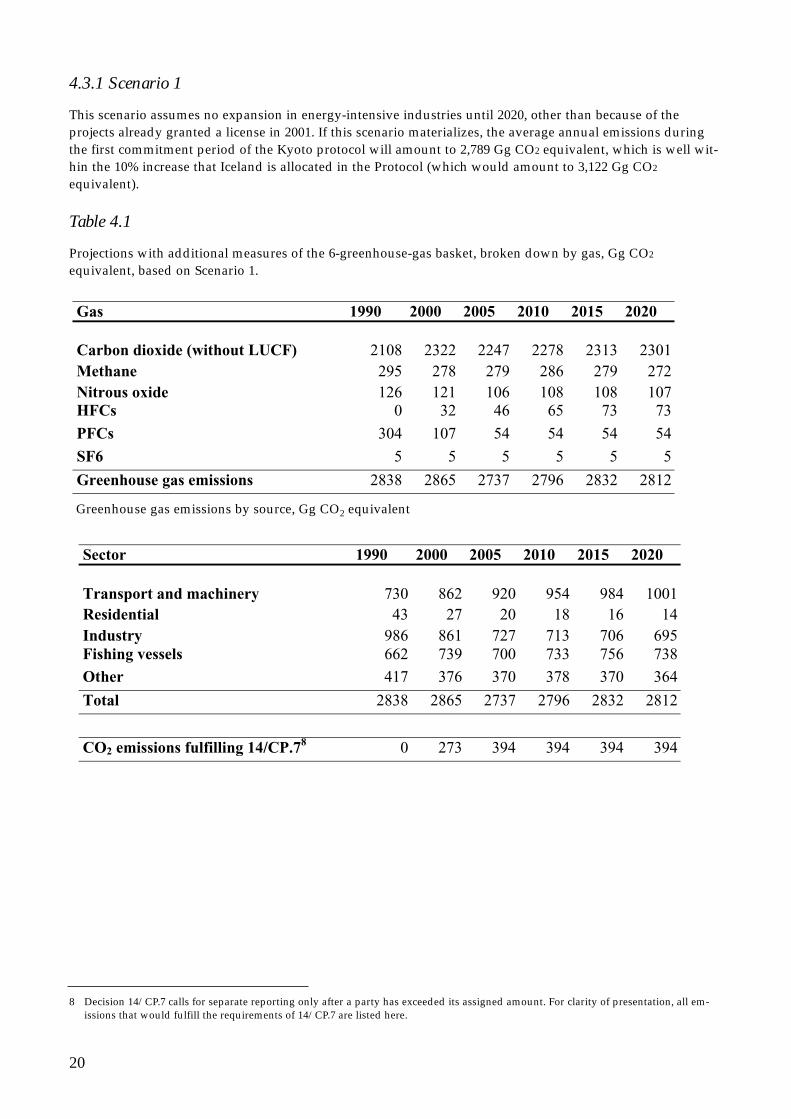
4.3.1 Scenario 1
This scenario assumes no expansion in energy-intensive industries until 2020, other than because of theprojects already granted a license in 2001. If this scenario materializes, the average annual emissions duringthe first commitment period of the Kyoto protocol will amount to 2,789 Gg CO2 equivalent, which is well wit-hin the 10% increase that Iceland is allocated in the Protocol (which would amount to 3,122 Gg CO2
equivalent).
Table 4.1
Projections with additional measures of the 6-greenhouse-gas basket, broken down by gas, Gg CO2
equivalent, based on Scenario 1.
20
Gas 1990 2000 2005 2010 2015 2020
Carbon dioxide (without LUCF) 2108 2322 2247 2278 2313 2301Methane 295 278 279 286 279 272Nitrous oxide 126 121 106 108 108 107HFCs 0 32 46 65 73 73
PFCs 304 107 54 54 54 54
SF6 5 5 5 5 5 5
Greenhouse gas emissions 2838 2865 2737 2796 2832 2812
Sector 1990 2000 2005 2010 2015 2020
Transport and machinery 730 862 920 954 984 1001Residential 43 27 20 18 16 14Industry 986 861 727 713 706 695Fishing vessels 662 739 700 733 756 738
Other 417 376 370 378 370 364
Total 2838 2865 2737 2796 2832 2812
CO2 emissions fulfilling 14/CP.78 0 273 394 394 394 394
Greenhouse gas emissions by source, Gg CO2 equivalent
8 Decision 14/CP.7 calls for separate reporting only after a party has exceeded its assigned amount. For clarity of presentation, all em-issions that would fulfill the requirements of 14/CP.7 are listed here.
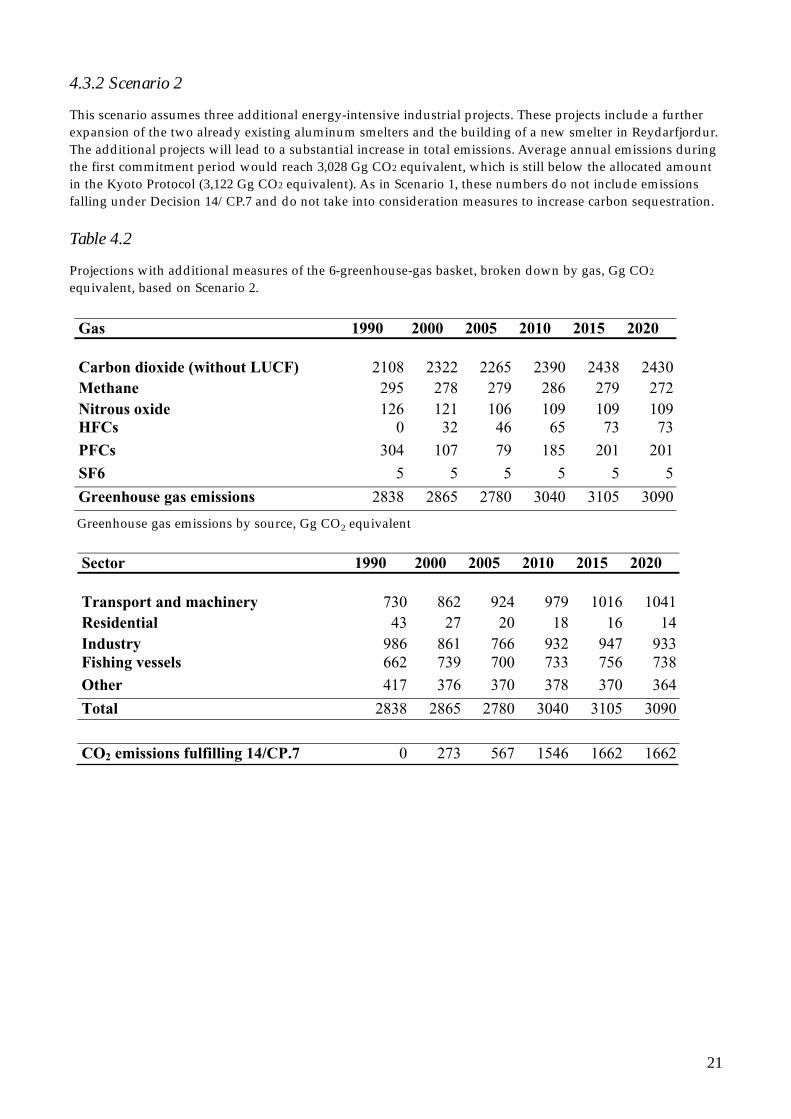
4.3.2 Scenario 2
This scenario assumes three additional energy-intensive industrial projects. These projects include a furtherexpansion of the two already existing aluminum smelters and the building of a new smelter in Reydarfjordur.The additional projects will lead to a substantial increase in total emissions. Average annual emissions duringthe first commitment period would reach 3,028 Gg CO2 equivalent, which is still below the allocated amountin the Kyoto Protocol (3,122 Gg CO2 equivalent). As in Scenario 1, these numbers do not include emissionsfalling under Decision 14/CP.7 and do not take into consideration measures to increase carbon sequestration.
Table 4.2
Projections with additional measures of the 6-greenhouse-gas basket, broken down by gas, Gg CO2
equivalent, based on Scenario 2.
21
Gas 1990 2000 2005 2010 2015 2020
Carbon dioxide (without LUCF) 2108 2322 2265 2390 2438 2430Methane 295 278 279 286 279 272Nitrous oxide 126 121 106 109 109 109HFCs 0 32 46 65 73 73
PFCs 304 107 79 185 201 201
SF6 5 5 5 5 5 5
Greenhouse gas emissions 2838 2865 2780 3040 3105 3090
Sector 1990 2000 2005 2010 2015 2020
Transport and machinery 730 862 924 979 1016 1041Residential 43 27 20 18 16 14Industry 986 861 766 932 947 933Fishing vessels 662 739 700 733 756 738
Other 417 376 370 378 370 364
Total 2838 2865 2780 3040 3105 3090
CO2 emissions fulfilling 14/CP.7 0 273 567 1546 1662 1662
Greenhouse gas emissions by source, Gg CO2 equivalent
4.4 Sensitivity analysis
The effects of the first three key measures included inthe government climate policy (see box 3.1) arealready integrated into the projections for bothscenarios. Sensitivity analysis was undertaken toestimate the emissions if the three additionalmeasures did not have the expected effects. Theassumptions were changed as follows:
• Transport: The fossil fuel forecast expects a 10%reduction in gasoline use with an equal increase inthe use of diesel oil, as a consequence of a changein taxation. How much would the emissionsincrease if the relative share of gasoline and dieseloil remained unchanged?
• Industry: The projections assume that existingaluminum industries will succeed in limiting PFCemissions to 0.22 tons of CO2 equivalents per eachton of aluminum produced, and that for newaluminum industries, the number will be 0.14 perton produced. The average emission for the pastdecade has been 0.4 but has been declining rapidlyin recent years. How much would the emissionsincrease if the average continues to stay at the 0.4level?
• Fisheries: Although total catch is expected toincrease, emission per unit of catch is expected todecrease 10-15% (depending on the type of vessel).How much would the emissions increase ifemissions per unit of catch stayed the same?
Given these changes in assumptions, annualemissions for the period 2008-2012 would increase by118 Gg CO2 equivalent for Scenario 1, bringing theannual average up to 2,908 Gg CO2 equivalent,which falls within the allocated amount.
For Scenario 2, these changes would result in Icelandexceeding its assigned amount for the first commit-ment period of the Kyoto Protocol. Total annual
emissions would increase by 273 Gg CO2 equivalent,which means that the annual average would be 3,302Gg CO2 equivalent.
4.5 Effects of carbon sequestration onprojections
Increased carbon sequestration is listed as one ofseven main measures of the government climatechange policy. Projections in this area are difficult asrevegetation and reforestation efforts are being und-ertaken by a broad range of actors and the level ofambition depends on a combination of factors. TheGovernment policy is based on the assumption thatannual sequestration will be 200 Gg on averageduring the first commitment period. Removals in theLUCF sector were estimated for the first time in theinventory for 2000. That year, removals of CO2 wereestimated to be 130 Gg. Reforestation projects contri-buted 30% and revegetation 70%. Iceland is develop-ing a comprehensive inventory system for emissionsand removals associated with LULUCF.
4.6 Summary of projections
In short, if projections are accurate, Iceland will beable to meet its obligations for the first commitmentperiod of the Kyoto Protocol, even with the plannedexpansion in energy-intensive industries (Scenario 2).However, this assumes that measures included in theIcelandic climate change policy will be successful.Should those assumptions not hold, Iceland couldexceed its assigned amount for Scenario 2. If plansfor increased carbon sequestration are fully implemented, net emissions should stay within theassigned amount for all options explored in thischapter. It should be emphasized that the uncertaintyin those projections is considerable.
22
5.1 Impacts on climate and oceanic currents
The third IPCC assessment of climate change conclu-des that there is increasing evidence that man isaffecting the global climate system. The mean globaltemperature has risen by approximately 0.6°C overthe last 100 years, in Europe the mean temperaturehas risen by about 0.8°C during the same period. The1990s was the warmest decade on record in Europe.
The global climate change scenarios also indicatemajor impacts on the hydrological cycle, which areexpected to become more intensive. However,regional and local effects on climate may differconsiderably from the mean global figures. In someregions the risk of flooding will increase, while inothers there will be a greater risk of drought.
It is uncertain what impact climate change will havein Iceland. A scientific committee on climate changeturned in a report in October 2000 called ClimateChange and its Consequences, in which possibleeffects of a rise in the average temperature in Icelandare discussed. The information in this chapter isdrawn from this report.
A Nordic research team on climate change predictsthat a temperature increase in Iceland due to green-house effects could be 0.3°C per decade in the nextfew decades, given certain assumptions about futureGHG emissions. The increase is expected to be largerin winter, and precipitation is likely to increase.Natural fluctuations in temperature are greater in theNorth Atlantic than in most other oceanic areas, andthe natural fluctuations between decades aresubstantially more than the estimated temperatureincreases for the next decades due to buildup ofgreenhouse gases. The impact of temperatureincrease due to the greenhouse effect will thereforegreatly differ depending on the direction of the short-term natural fluctuations.
Oceanic currents play an important role in Icelandicclimate. The country is located at the junction of coldand warm ocean currents. A worst-case scenariowould be if any major changes were to take place inthe so called “conveyor belt” that transfers warmcurrents from southern oceans to the North EastAtlantic. Some models indicate that a global rise intemperature will make the conveyor belt less efficientin transferring heat, which could greatly influencethe climate around Iceland. There is a high degree ofuncertainty on this issue since other models showdifferent results.
The IPCC predicts that the rise in sea level will be 21cm during the period 1990-2050 (3.5 mm per year),and 29 cm from 2050 to 2100 (5.8 mm per year).There is no reason to believe the rise in sea level willbe any different in Iceland.
Climate change will impact glaciers and the flow ofrivers. Rising temperature will lead to a reduction inthe size of most glaciers. The melting of glacierscould lead to an increase in the flow of rivers, andfloods could become more frequent. Some studiespredict that the glaciers will almost disappear in thenext two centuries.
5.2 Impacts on ecosystems
Changes in temperature impact both terrestrial andmarine ecosystems. Ocean currents and temperatureare important factors for variables like primaryproductivity (by photosynthesis of algae),distribution of various fish stocks, the routes of fishruns and location of spawning grounds. For someyears the Marine Research Institute has measured theprimary productivity in the ocean in spring, andthese measurements have provided valuableinformation about the impact of temperaturefluctuations. These measurements demonstrate thatprimary productivity is very sensitive to environ-mental factors, such as temperature and currents. Anincrease in temperature will lead to more producti-
23
5. Impacts and adaptation measures
vity, which is likely to have a positive impact on thecod stock and other ground fish species. A decreasein oceanic temperature could have the opposite effectand limit the growth of important fish stocks.
Climatic factors, such as temperature, precipitationand wind, greatly influence plants and vegetationcover. Research on climatic fluctuation in the past hasshown that the production increased 11% for eachrise in temperature of 1°C. The impact of atemperature increase will be even greater on barleyproduction. Iceland has a short history of growingbarley since weather conditions limit the possibilityof such production. However, new variations ofbarley have made it possible to experiment with thiskind of agriculture. An increase in temperaturewould have positive effect on barley production.Negative impacts of climate change on terrestrialecosystems include increasing risks of plant diseases.
5.3 Impacts on society
In light of the high degree of uncertainty, estimatingimpacts on society becomes a very difficult task. Anincrease in temperature could have some positiveeffects on marine resources and fish stocks. However,more insects could increase the risk of disease in bothplants and humans, which would be a negativeimpact. A worst-case scenario for Iceland would be ifclimate change led to major disruptions in oceaniccirculation that impacted fish stocks negatively.
The impact that climate change could have onhuman health is likely to be less in Iceland than inmany other countries. An increase in temperatureshould not create discomfort for the population sincethe current climate is rather cool. An increase in thefrequency of severe storms could however result inmore casualties due to bad weather. There can alsobe indirect impact on human health. For example anincrease could be expected in the number ofincidents involving pollution of drinking water dueto E.coli and Giardia lamblia. In general, however,the health impact is not likely to be substantial andshould not be a great burden to the healthcaresystem.
5.4 Adaptation measures
Most climate change measures adopted in Icelandaim at curbing emissions of greenhouse gases, andemphasis on adaptation measures has been minimal.The main reason for this is the high degree ofuncertainty about the impacts of climate change. Themost important adaptation measures are likely toinvolve changes in the design of dams, bridges,harbors and other structures that are affected bychanges in the flow of rivers and a rise in sea level.Expected sea level rise has already been taken intoaccount in the design of new harbors.
24
6.1 Development cooperation
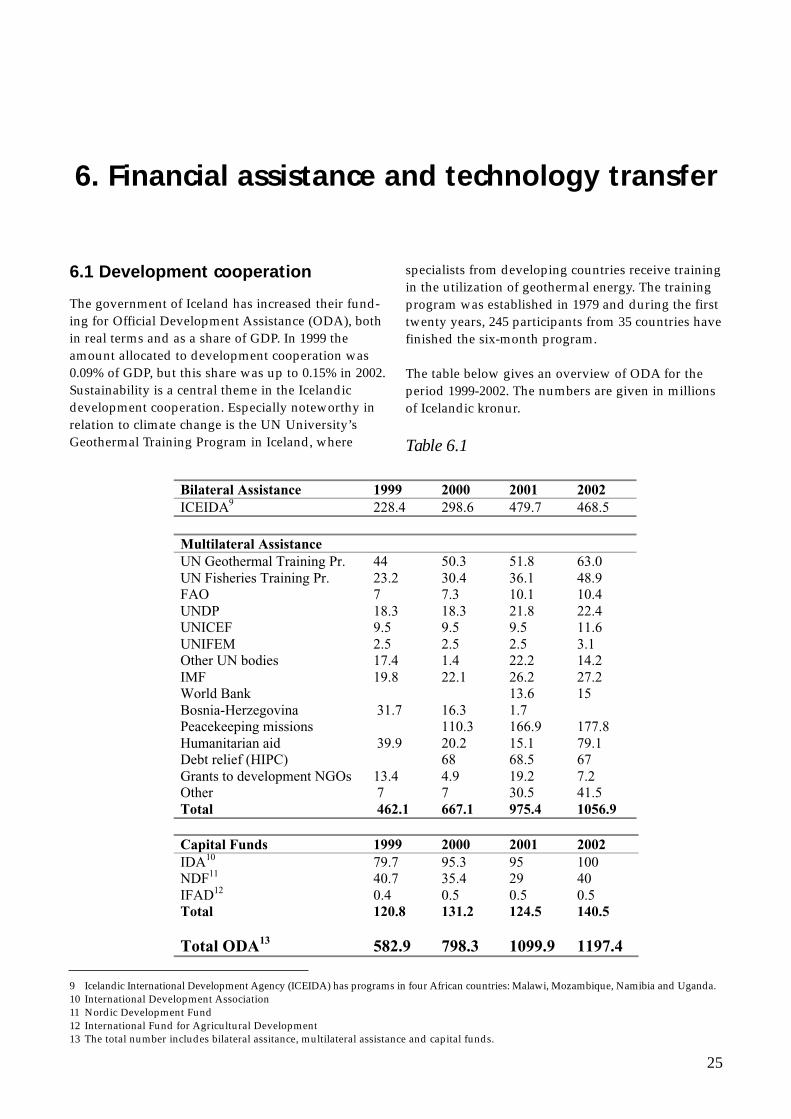
The government of Iceland has increased their fund-ing for Official Development Assistance (ODA), bothin real terms and as a share of GDP. In 1999 theamount allocated to development cooperation was0.09% of GDP, but this share was up to 0.15% in 2002.Sustainability is a central theme in the Icelandicdevelopment cooperation. Especially noteworthy inrelation to climate change is the UN University’sGeothermal Training Program in Iceland, where
specialists from developing countries receive trainingin the utilization of geothermal energy. The trainingprogram was established in 1979 and during the firsttwenty years, 245 participants from 35 countries havefinished the six-month program.
The table below gives an overview of ODA for theperiod 1999-2002. The numbers are given in millionsof Icelandic kronur.
Table 6.1
25
6. Financial assistance and technology transfer
Bilateral Assistance 1999 2000 2001 2002ICEIDA9 228.4 298.6 479.7 468.5
Multilateral AssistanceUN Geothermal Training Pr. 44 50.3 51.8 63.0UN Fisheries Training Pr. 23.2 30.4 36.1 48.9FAO 7 7.3 10.1 10.4UNDP 18.3 18.3 21.8 22.4UNICEF 9.5 9.5 9.5 11.6UNIFEM 2.5 2.5 2.5 3.1Other UN bodies 17.4 1.4 22.2 14.2IMF 19.8 22.1 26.2 27.2World Bank 13.6 15Bosnia-Herzegovina 31.7 16.3 1.7Peacekeeping missions 110.3 166.9 177.8Humanitarian aid 39.9 20.2 15.1 79.1Debt relief (HIPC) 68 68.5 67Grants to development NGOs 13.4 4.9 19.2 7.2Other 7 7 30.5 41.5Total 462.1 667.1 975.4 1056.9
9 Icelandic International Development Agency (ICEIDA) has programs in four African countries: Malawi, Mozambique, Namibia and Uganda.10 International Development Association11 Nordic Development Fund12 International Fund for Agricultural Development13 The total number includes bilateral assitance, multilateral assistance and capital funds.
Capital Funds 1999 2000 2001 2002IDA10 79.7 95.3 95 100NDF11 40.7 35.4 29 40IFAD12 0.4 0.5 0.5 0.5Total 120.8 131.2 124.5 140.5
Total ODA13 582.9 798.3 1099.9 1197.4
6.2 Financial assistance to internati-onal environmental institutions
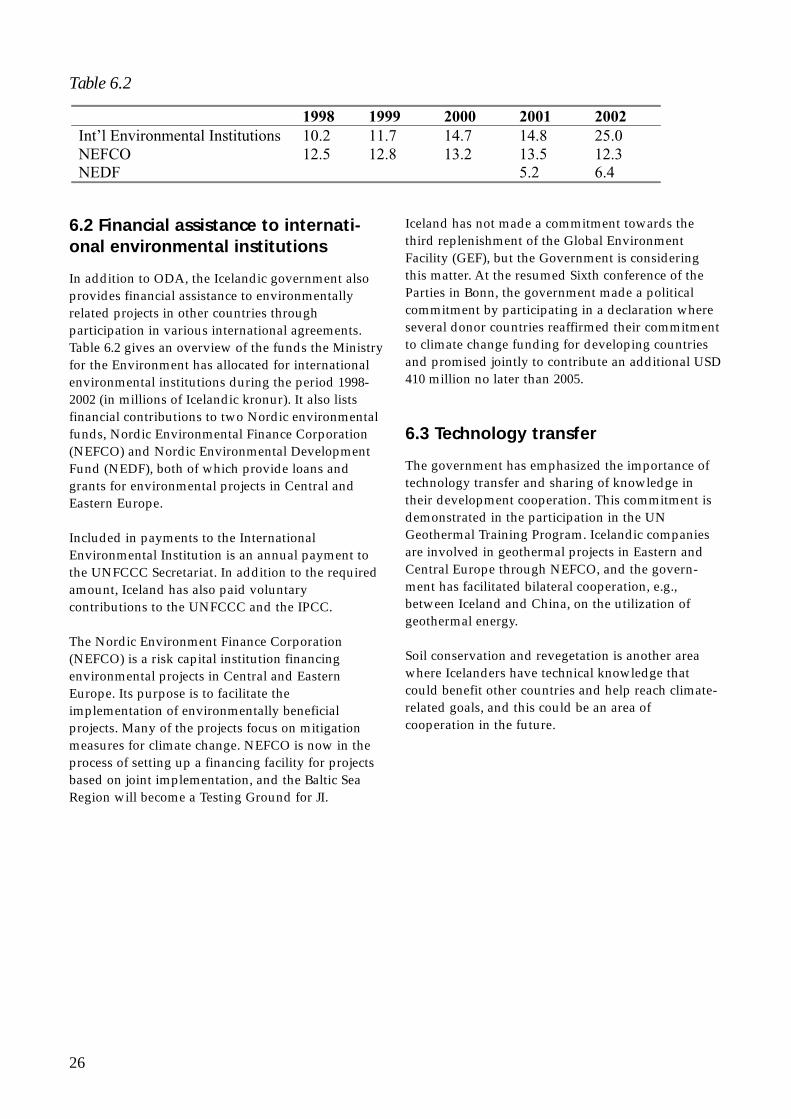
In addition to ODA, the Icelandic government alsoprovides financial assistance to environmentallyrelated projects in other countries throughparticipation in various international agreements.Table 6.2 gives an overview of the funds the Ministryfor the Environment has allocated for internationalenvironmental institutions during the period 1998-2002 (in millions of Icelandic kronur). It also listsfinancial contributions to two Nordic environmentalfunds, Nordic Environmental Finance Corporation (NEFCO) and Nordic Environmental DevelopmentFund (NEDF), both of which provide loans andgrants for environmental projects in Central and Eastern Europe.
Included in payments to the InternationalEnvironmental Institution is an annual payment tothe UNFCCC Secretariat. In addition to the requiredamount, Iceland has also paid voluntarycontributions to the UNFCCC and the IPCC.
The Nordic Environment Finance Corporation (NEFCO) is a risk capital institution financingenvironmental projects in Central and Eastern Europe. Its purpose is to facilitate the implementation of environmentally beneficialprojects. Many of the projects focus on mitigationmeasures for climate change. NEFCO is now in theprocess of setting up a financing facility for projectsbased on joint implementation, and the Baltic SeaRegion will become a Testing Ground for JI.
Iceland has not made a commitment towards thethird replenishment of the Global EnvironmentFacility (GEF), but the Government is consideringthis matter. At the resumed Sixth conference of theParties in Bonn, the government made a politicalcommitment by participating in a declaration whereseveral donor countries reaffirmed their commitmentto climate change funding for developing countriesand promised jointly to contribute an additional USD410 million no later than 2005.
6.3 Technology transfer
The government has emphasized the importance oftechnology transfer and sharing of knowledge intheir development cooperation. This commitment isdemonstrated in the participation in the UNGeothermal Training Program. Icelandic companiesare involved in geothermal projects in Eastern andCentral Europe through NEFCO, and the govern-ment has facilitated bilateral cooperation, e.g.,between Iceland and China, on the utilization ofgeothermal energy.
Soil conservation and revegetation is another areawhere Icelanders have technical knowledge thatcould benefit other countries and help reach climate-related goals, and this could be an area of cooperation in the future.
26
1998 1999 2000 2001 2002Int’l Environmental Institutions 10.2 11.7 14.7 14.8 25.0NEFCO 12.5 12.8 13.2 13.5 12.3NEDF 5.2 6.4
Table 6.2
7.1 General research policy
Research and development (R&D) play an increasingly important part in Icelandic society.Funds allocated to research and development were1% of GDP in 1990 but had reached 2.3% of GDP inthe year 2000. Most of the increase is due to increa-sed investment in research by the private sector, butthere has also been some increase from the publicsector. New legislation on the organization of scienceand technology policy and the funding of researchand technological development in Iceland, whichwent into force in January 2003, should furtherstrengthen the R&D sector.
Environmental change is recognized as an importantarea in R&D, and in 1998 the Icelandic ResearchCouncil launched a five-year program with a specialfund to support projects in environmental researchand research on information technology. Severalclimate-related projects have received grants fromthis fund or other funds of the Icelandic ResearchCouncil, but Icelandic scientists are also involved in anumber of international climate-related projectsfunded from sources, such as the European Unionand the Nordic Council of Ministers. Research onclimate and systematic observation is also part of themandate of some public institutions, such as theIcelandic Meteorological Office (IMO) and theMarine Research Institute (MRI).
7.2 Climatic Research
Most of the climate-related research in Iceland isfocused on climate processes and climate systemstudies and impacts of climate change. Other effortsinvolve modeling and prediction, and large ongoingprojects deal with mitigation measures, but there hasbeen less research on socio-economic analysis.
7.2.1 Climate process and climate systemstudies
The evaluation of changes and variability of theclimate (including sea-ice) during the period ofinstrumental observations is among the basic tasks ofthe IMO. Although the research is mainly centeredon the climate of Iceland, the IMO has also beenactive in many multi-national projects focusing onthe analysis of climate data.
Icelandic scientists have for many years contributedconsiderably to paleoclimatological work with theirparticipation in many ice and sediment core projects.Most of this work has taken place within theUniversity of Iceland.
7.2.2 Modeling and prediction
The climate modeling work of the IMO has mostlybeen restricted to physical downscaling experimentsand to the effects of mountains on both local climateand the general circulation in the North AtlanticRegion. The IMO takes part in the European High-Resolution-Limited-Area-Model (HIRLAM)cooperation and its development and evolution ofhigh-resolution deterministic weather forecasting mod-els, but the model is not in operational use in Iceland.
The IMO, in cooperation with the University ofIceland, uses the non-hydrostatic, high-resolution 5thgeneration Mesoscale Model (MM5) for researchprojects in dynamic meteorology and for thedownscaling of climate simulations. Most of theresearch projects in dynamic meteorology haveemphasized interaction between the terrain and theatmosphere on scales ranging from flow around hillsup to synoptic systems. Projects on predictability andsensitivity of forecasts to observations are planned inconnection to the upcoming WMO-programTHORPEX (THe Observation System Research andPredictability EXperiment).
27
7. Research and systematic observation
The IMO, the MRI and the University of Akureyricooperate on a research project with the goal ofunderstanding the natural variations in oceaniccirculation surrounding Iceland, and how climatechange might affect this. A model describing themesoscale variability of the ocean circulation is animportant component of this project.
7.2.3 Impacts of climate change
Icelandic research institutions are involved in severalprojects studying the impact of future global climatechanges. Two international projects can bementioned: the Artic Climate Impact Assessment(ACIA) organized by the Arctic Council, and theClimate, Water and Energy (CWE) program, whichthe Hydrological Institutes of the Nordic countriesare responsible for. Both these projects focus onfuture climate changes in the neighborhood ofIceland.
The goal of ACIA is to evaluate and synthesizeknowledge on climate variability, climate change,increased ultraviolet radiation and theirconsequences. The aim is to provide useful andreliable information to the governments,organzations and people of the Arctic on policyoptions to meet such changes. The ACIA willexamine possible future impacts on the environmentand its living resources, on human health, and onbuildings, roads and other infrastructure.
The CWE program studies the impact of climatechange on the hydrological cycle and hydropower.One component of this study has been the impact ofclimate change on glaciers, which is of specialimportance to Iceland. In addition to participating inthis Nordic project, several Icelandic institutionshave also worked on a related research project thatfocuses specifically on Icelandic conditions.
7.2.4 Socio-economic analysis
The report “Climate Change and its Consequences”,which was published in October 2000, and whichchapter 5 of this report is based on, provides someanalysis of the possible social effects of climatechange. In the year 2000, a government-appointedcommittee produced a report estimating theeconomic consequences for Iceland of participatingin the Kyoto Protocol. Academic research on howclimate change could affect socio-economic factorshas not been substantial, but several research projects
deal with technical mitigation issues. These projectsfocus on either revegetation and reforestation forcarbon sequestration or the development oftechnology making renewable energy a moreattractive alternative to fossil fuels.
The Agricultural Research Institute and the NationalForestry Institute are both involved in studies focus-ing on carbon sequestration. They include, e.g.,developing methods to estimate how much carbon isbeing restored with revegetation and reforestation,and research on carbon cycles in Icelandicecosystems.
Icelandic New Energy, in cooperation with NorskHydro, Daimler Chrysler and Shell Hydrogen, runsseveral research projects aiming at developingtechnology to make it technologically possible andeconomically feasible to use hydrogen as an energycarrier in the transport sector and for fishing vessels.The research program of Icelandic New Energy hasreceived considerable international attention. Thevery ambitious overall goal of the program is tocreate the world’s first hydrogen economy. Thiswould mean that Iceland would become independentof imported oil since domestic, renewable energysources can be used to produce hydrogen.
The research program has several phases. The firstphase is the ECTOS project. The objective of ECTOSis to implement a demonstration of state-of-the arthydrogen technology by running part of the publictransport system in the capital with fuel-cell buses.The energy will be almost free of CO2 emissionsbecause geothermal energy and hydropower will beused to produce hydrogen by electrolysis. The firsthydrogen station will be opened in April 2003, andthe first buses are expected to come to the country inlate summer 2003. The second phase of the researchprogram is the introduction of hydrogen-based fuel-cell private cars, and the third phase deals with thegradual replacement of fossil fuels in the fishing fleetby fuel-cell-powered vessels.
Although this is a private venture, the projects havereceived funding from public sources, such as theEuropean Union and the Government of Iceland.
7.3 Systematic observation
The two institutions most important for theobservation of climate change are the Icelandic Mete-orological Office (IMO) and the Marine ResearchInstitute (MRI).
28
7.3.1 Atmospheric climate observing systems
The IMO is responsible for atmospheric climate monitoring and observation. The IMO monitors andarchives data from close to 200 stations. Thesestations are either manual (synoptic, climatologicaland precipitation stations) or automatic. The numberof synoptic stations in operation (45) has been relatively constant over the last 40 years. Theobservations are distributed internationally on theWMO GTS (Global Telecommunication System). Themanual precipitation network has been steadilyexpanding and now consists of about 70 stationsmeasuring precipitation daily in addition to thesynoptic stations. The majority of the precipitationstations report daily to the IMO database. Theautomation of measurements started in Iceland in1987, and the number of automatic stations has beenrapidly growing since then. The IMO now operatesabout 70 stations and about 35 in addition to this incooperation with the National Power Company, TheEnergy Authority and the Maritime Administration.A repository of data from the about 50 stationsoperated by the Public Roads Administration is alsolocated at the IMO. A majority of automatic stationsobserve wind and temperature every 10 minutes, afew once per hour, and most transmit data to thecentral database every hour. Many stations alsoinclude humidity, pressure and precipitationobservations, and a few observe additional parameters (shortwave radiation and groundtemperatures) or observe at more than one level.
For the last 15 years, the observations at the synopticstations have been subjected to base quality checkprograms resident in PC computers at the stations.Internet-based software is now replacing this system.The automatic station data are routinely checked forerrors, but not in real-time. Procedures are beingdeveloped to flag dubious data on reception. TheIMO participates in a Nordic project on observationquality checking, where common problems arediscussed and standards developed.
Table 7.1 gives an overview of participation in theGlobal Atmospheric Observing Systems (GAOS):
The GSN stations are among the synoptic stationsregularly transmitted on GTS and also transmitmonthly climatic summaries (CLIMAT). One upperair station is in operation (Keflavik Airport) makingsoundings at 00 and 12 UTC. The IMO has part-icipated in the MATCH ozone-sounding programduring the winter months since 1990, and the dataare reported to the International Ozone Data base atNILU, Norway.
The three GAW stations are: the BAPM at Írafoss andStorhofdi, where tropospheric ozone, carbon dioxide,methane and isotopes of oxygen and carbon aremonitored in cooperation with NOAA. Heavy metalsand Persistent Organic Pollutants (POPs) in air andprecipitation are monitored and reported to AMAPand OSPAR. In Reykjavik, data on global radiationare collected and reported annually to the WorldRadiation Data Center in St. Petersburg (WRDC).
7.3.2 Ocean climate observing systems
Both the IMO and the Marine Research Institute(MRI) contribute to ocean climate observations. Table 7.2 (see page 30) gives and overview ofobservation stations operated by the IMO.
GSN GUAN GAW OtherHow many stations are the responsibility of the party? 4 1 3How many are operating now? 4 1 3How many of those are operating to GCOS standards? 4 1 2How many are expected to be operating in 2005? 4 1 3How many are providing data to international centers now?
29
Table 7.1
The VOSes are merchant ships plying both Europeand the east coast of North America in addition tosome coastguard and research vessels operating inIcelandic waters. The IMO operates one ASAP uniton a merchant ship between Iceland and the USA, incooperation with the Swedish Meteorological andHydrological Institute. The IMO does not operateany Icelandic drifting or moored buoys, but as members of EGOS (European Group on OceanStations), which is an organization operating 50 meteorological drifting buoys and 11 moored buoysin the North-Atlantic at any time, it supports a veryimportant meteorological network.
The Marine Research Institute (MRI) is a member ofthe International Council of Exploration of the Seas(ICES) and through that membership contributes to
the GOOS (Global Oceanic Observing System). TheMRI maintains a monitoring net of about 100hydrobiological stations on 12 standard sections(transects) around Iceland. These stations are monitored four times per year for physical andchemical observations (phosphate, nitrate, silicate)and once a year for biological observations (phytoplankton, zooplankton). Some of these stationshave been monitored since around 1950. Thezooplankton biomass monitoring has demonstratedfluctuations, which to some extent appear to be linked to climate and circulation changes. The MRIhas also monitored carbon dioxide at selectedstations for about 20 years and maintains a grid ofabout 10 continuous sea surface temperature metersat coastal stations all around the country.
30
VOS SOOP TIDEGauges
SFCDrifters
SUB-SFCFloats
Mooredbuoys
ASAP
For how manyplatforms is the Partyresponsible?
13 0 1
How many areproviding data to int’ldata centers?
9 0 1
How many are expectedto be operating in 2005?
10 0 1
Table 7.2
8.1 General education policy
A fundamental principle of the Icelandic educationalsystem is that everyone should have equalopportunities to acquire an education, irrespective ofsex, economic status, residential location, religion,possible handicap, and cultural or social background.Education has traditionally been organized withinthe public sector, and there are very few privateinstitutions in the school system. Almost all privateschools receive public funding.
The educational system is divided into four levels.The first level is pre-school for children up to 6 yearsof age. The second level is compulsory (primary andlower-secondary) for children from 6 to 16 years old.The third level is the upper-secondary, where moststudents are 16 to 20 years old. This level is open toall who have finished compulsory education. The fourth level is higher education (universities).
8.2 Environmental education
Environmental education in schools has increased inthe past decade, from pre-school to university. TheUniversity of Iceland now offers a Master’s degree inenvironmental studies, where climate change is anintegral subject. Many upper-secondary schools offercourses in the same field, or place a special emphasison environmental issues in their curriculum. Studiesof environmental issues in primary schools are included in many subjects, especially natural sciences, but also in subjects like life skills and homeeconomics. In addition, many schools have taken initiative in harmonizing environmental educationand general education.
8.3 Public information campaigns
General discussion of environmental issues, inclu-ding disseminating information to the public throughthe media and the Internet, has increased
considerably in recent years. Non-governmental organizations also play an important role indisseminating information to the public.
There has not been a public information campaignfocusing specifically on climate change. However, thegovernmental policy on climate change emphasizeseducation and a special effort in disseminating information to the public. This effort will most likelybe tailored toward reducing emissions of GHG fromthe home due to waste and from transport. It shouldbe noted that since renewable energy is used for bothspace heating and electrical production in Iceland,public information campaigns aimed at energy efficiency in the home are not relevant for thepurpose of reducing GHG emissions.
8.4 Resource or information centers
The Environmental and Food Agency has information on climate change on their home page.Information about GHG emissions in Iceland isavailable, as well as a general explanation of thecauses and consequences of climate change.
The Environmental Education Board (EEB), whichhas representatives from both the environmental andeducation sector, has initiated a website with links toinformation in Icelandic about various environmentalissues. The Board has also reached an agreementwith the University of Iceland to include a specialsection on the environment on the so-called “Web ofScience” (Vísindavefurinn). This is a website wherethe public can ask questions, and scientists and researchers at the university provide the answers.Answers to several questions relating to climatechange have already been provided.
31
8. Education, training and public awareness
8.5 Involvement of non-governmentalorganizations
As already stated, environmental NGOs play animportant role in disseminating information aboutenvironmental issues. Environmental NGOs runseveral projects that are instrumental in raising environmental awareness.
One project especially relevant to climate change is“Global Action Plan” (GAP). This is an internationalproject that Landvernd, an Icelandic environmentalNGO, participates in. GAP is a project where smallgroups of 5-8 people follow a special eight-week
program where five subjects are on the agenda.These subjects are: waste, energy, transport, shoppingand water. Each group has a leader who has receivedspecial training. The goal of the project is to makepeople aware of how their actions in daily life influence the environment, and how simple changescan make a difference.
The Ministry for the Environment, the NationalPower Company (Landsvirkjun), SORPA (anindependent waste management firm owned byseven municipalities), Reykjavík Energy (OrkuveitaReykjavíkur), Toyota and one supermarket (Fjarðarkaup) support the project financially.
32
References
The Association of Local Authorities in Iceland (Samband íslenskra sveitarfélaga). Web site about LocalAgenda 21 in Iceland. Http://www.samband.is
Framework Convention on Climate Change. Report on the in-depth review of the second national communication ofIceland. Review team: Tahgi Ebtekar (Islamic Republic of Iran), Ivan Mojik (Slovakia), Didier Goetghebuer(Belgium), Tina Dallman (UNFCCC secretariat, coordinator). August 1999.
The Ministry of Agriculture. Lokaskýrsla verkefnisstjórnar um átak í landgræðslu og skógrækt. A final report from ateam leading a government project on reforestation and revegetation, March 2001.
The Ministry for the Environment. Second status report for Iceland pursuant to the United Nations Framework Con-vention on Climate Change, 1997.
_______. Veðurfarsbreytingar og afleiðingar þeirra. A report on climate change and possible consequences forIceland. October 2000.
_______. Welfare for the Future. Iceland’s National Strategy for Sustainable Development 2002-2020. August 2002
_______. Tillögur og kostnaðaráætlun starfshóps um losunarspár og bókhald gróðurhúsalofttegunda A report of aworking group for projections of GHG emissions. August 2002
Icelandic New Energy (http://www.newenergy.is)
Reykjavik City. Umhverfisáætlun Reykjavíkur. A Local Agenda 21 for the Reykjavik area(http://www.reykjavik.is)
Statistics Iceland (http://www.statice.is)
Annex ANational greenhouse gas inventory, 1990 - 2000: Summary tables
33
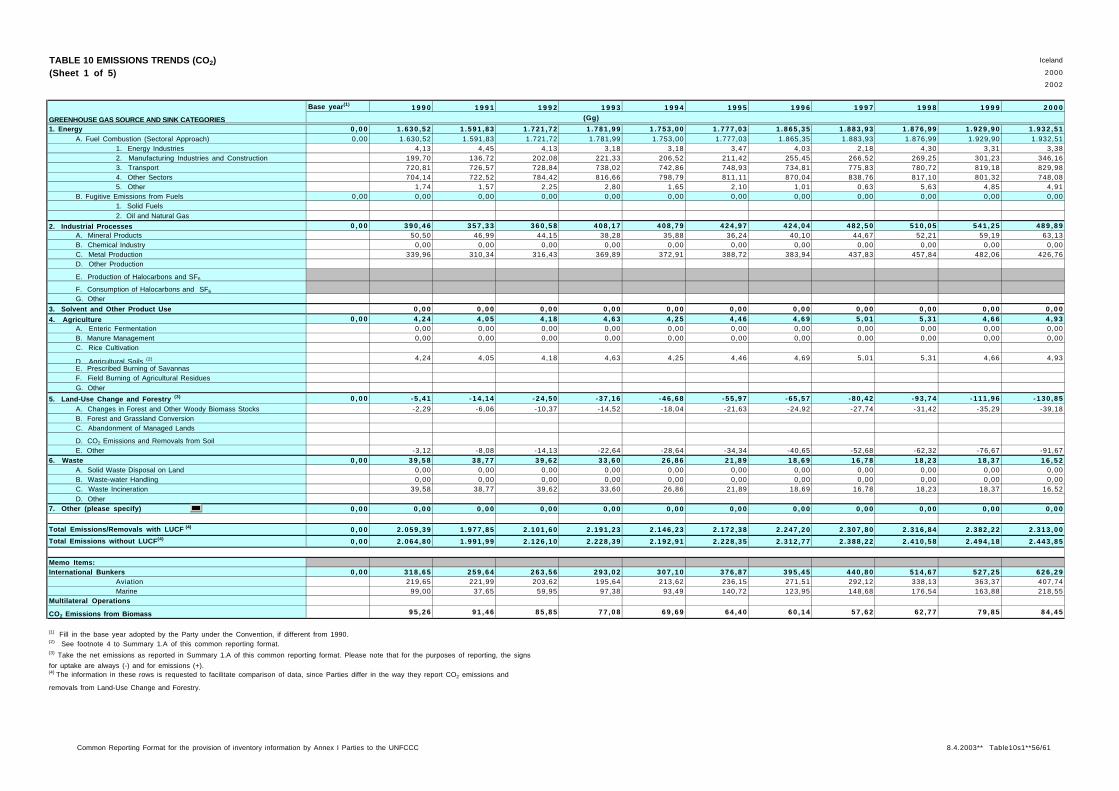
TABLE 10 EMISSIONS TRENDS (CO 2) Iceland
(Sheet 1 of 5) 2000
2002
Base year (1)1 9 9 0 1 9 9 1 1 9 9 2 1 9 9 3 1 9 9 4 1 9 9 5 1 9 9 6 1 9 9 7 1 9 9 8 1 9 9 9 2 0 0 0
(Gg)
1. Energy 0 , 0 0 1 .630 ,52 1 .591 ,83 1 .721 ,72 1 .781 ,99 1 .753 ,00 1 .777 ,03 1 .865 ,35 1 .883 ,93 1 .876 ,99 1 .929 ,90 1 .932 ,51A. Fuel Combustion (Sectoral Approach) 0,00 1.630,52 1.591,83 1.721,72 1.781,99 1.753,00 1.777,03 1.865,35 1.883,93 1.876,99 1.929,90 1.932,51
1. Energy Industries 4,13 4,45 4,13 3,18 3,18 3,47 4,03 2,18 4,30 3,31 3,382. Manufacturing Industries and Construction 199,70 136,72 202,08 221,33 206,52 211,42 255,45 266,52 269,25 301,23 346,163. Transport 720,81 726,57 728,84 738,02 742,86 748,93 734,81 775,83 780,72 819,18 829,984. Other Sectors 704,14 722,52 784,42 816,66 798,79 811,11 870,04 838,76 817,10 801,32 748,085. Other 1,74 1,57 2,25 2,80 1,65 2,10 1,01 0,63 5,63 4,85 4,91
B. Fugitive Emissions from Fuels 0,00 0,00 0,00 0,00 0,00 0,00 0,00 0,00 0,00 0,00 0,00 0,001. Solid Fuels2. Oil and Natural Gas
2. Industrial Processes 0 , 0 0 3 9 0 , 4 6 3 5 7 , 3 3 3 6 0 , 5 8 4 0 8 , 1 7 4 0 8 , 7 9 4 2 4 , 9 7 4 2 4 , 0 4 4 8 2 , 5 0 5 1 0 , 0 5 5 4 1 , 2 5 4 8 9 , 8 9A. Mineral Products 50,50 46,99 44,15 38,28 35,88 36,24 40,10 44,67 52,21 59,19 63,13B. Chemical Industry 0,00 0,00 0,00 0,00 0,00 0,00 0,00 0,00 0,00 0,00 0,00C. Metal Production 339,96 310,34 316,43 369,89 372,91 388,72 383,94 437,83 457,84 482,06 426,76D. Other Production
E. Production of Halocarbons and SF6
F. Consumption of Halocarbons and SF6
G. Other
3. Solvent and Other Product Use 0 , 0 0 0 , 0 0 0 , 0 0 0 , 0 0 0 , 0 0 0 , 0 0 0 , 0 0 0 , 0 0 0 , 0 0 0 , 0 0 0 , 0 0
4. Agriculture 0 , 0 0 4 , 2 4 4 , 0 5 4 , 1 8 4 , 6 3 4 , 2 5 4 , 4 6 4 , 6 9 5 , 0 1 5 , 3 1 4 , 6 6 4 , 9 3A. Enteric Fermentation 0,00 0,00 0,00 0,00 0,00 0,00 0,00 0,00 0,00 0,00 0,00B. Manure Management 0,00 0,00 0,00 0,00 0,00 0,00 0,00 0,00 0,00 0,00 0,00C. Rice Cultivation
D Agricultural Soils (2) 4,24 4,05 4,18 4,63 4,25 4,46 4,69 5,01 5,31 4,66 4,93
E. Prescribed Burning of SavannasF. Field Burning of Agricultural ResiduesG. Other
5. Land-Use Change and Forestry (3) 0 , 0 0 -5 ,41 -14 ,14 -24 ,50 -37 ,16 -46 ,68 -55 ,97 -65 ,57 -80 ,42 -93 ,74 -111 ,96 -130 ,85
A. Changes in Forest and Other Woody Biomass Stocks -2,29 -6,06 -10,37 -14,52 -18,04 -21,63 -24,92 -27,74 -31,42 -35,29 -39,18B. Forest and Grassland ConversionC. Abandonment of Managed Lands
D. CO2 Emissions and Removals from SoilE. Other -3,12 -8,08 -14,13 -22,64 -28,64 -34,34 -40,65 -52,68 -62,32 -76,67 -91,67
6. Waste 0 , 0 0 3 9 , 5 8 3 8 , 7 7 3 9 , 6 2 3 3 , 6 0 2 6 , 8 6 2 1 , 8 9 1 8 , 6 9 1 6 , 7 8 1 8 , 2 3 1 8 , 3 7 1 6 , 5 2A. Solid Waste Disposal on Land 0,00 0,00 0,00 0,00 0,00 0,00 0,00 0,00 0,00 0,00 0,00B. Waste-water Handling 0,00 0,00 0,00 0,00 0,00 0,00 0,00 0,00 0,00 0,00 0,00C. Waste Incineration 39,58 38,77 39,62 33,60 26,86 21,89 18,69 16,78 18,23 18,37 16,52D. Other
7. Other (please specify) 0 , 0 0 0 , 0 0 0 , 0 0 0 , 0 0 0 , 0 0 0 , 0 0 0 , 0 0 0 , 0 0 0 , 0 0 0 , 0 0 0 , 0 0 0 , 0 0
Total Emissions/Removals with LUCF (4) 0 , 0 0 2 .059 ,39 1 .977 ,85 2 .101 ,60 2 .191 ,23 2 .146 ,23 2 .172 ,38 2 .247 ,20 2 .307 ,80 2 .316 ,84 2 .382 ,22 2 .313 ,00
Total Emissions without LUCF (4) 0 , 0 0 2 .064 ,80 1 .991 ,99 2 .126 ,10 2 .228 ,39 2 .192 ,91 2 .228 ,35 2 .312 ,77 2 .388 ,22 2 .410 ,58 2 .494 ,18 2 .443 ,85
Memo Items:International Bunkers 0 , 0 0 3 1 8 , 6 5 2 5 9 , 6 4 2 6 3 , 5 6 2 9 3 , 0 2 3 0 7 , 1 0 3 7 6 , 8 7 3 9 5 , 4 5 4 4 0 , 8 0 5 1 4 , 6 7 5 2 7 , 2 5 6 2 6 , 2 9
Aviation 219,65 221,99 203,62 195,64 213,62 236,15 271,51 292,12 338,13 363,37 407,74Marine 99,00 37,65 59,95 97,38 93,49 140,72 123,95 148,68 176,54 163,88 218,55
Multilateral Operations
CO2 Emissions from Biomass 9 5 , 2 6 9 1 , 4 6 8 5 , 8 5 7 7 , 0 8 6 9 , 6 9 6 4 , 4 0 6 0 , 1 4 5 7 , 6 2 6 2 , 7 7 7 9 , 8 5 8 4 , 4 5
(1) Fill in the base year adopted by the Party under the Convention, if different from 1990.(2) See footnote 4 to Summary 1.A of this common reporting format.(3) Take the net emissions as reported in Summary 1.A of this common reporting format. Please note that for the purposes of reporting, the signs
for uptake are always (-) and for emissions (+). (4) The information in these rows is requested to facilitate comparison of data, since Parties differ in the way they report CO2 emissions and
removals from Land-Use Change and Forestry.
GREENHOUSE GAS SOURCE AND SINK CATEGORIES
Common Reporting Format for the provision of inventory information by Annex I Parties to the UNFCCC 8.4.2003** Table10s1**56/61

TABLE 10 EMISSIONS TRENDS (CH 4) Iceland
(Sheet 2 of 5) 2000
2002
Base year(1) 1 9 9 0 1 9 9 1 1 9 9 2 1 9 9 3 1 9 9 4 1 9 9 5 1 9 9 6 1 9 9 7 1 9 9 8 1 9 9 9 2 0 0 0(Gg)
Total Emissions 0 ,00 14 ,02 13 ,86 13 ,68 13 ,67 13 ,82 13 ,62 13 ,89 13 ,95 13 ,67 13 ,61 13 ,21
1. Energy 0 ,00 0 ,22 0 ,23 0 ,24 0 ,24 0 ,24 0 ,22 0 ,23 0 ,20 0 ,20 0 ,17 0 ,17A. Fuel Combustion (Sectoral Approach) 0,00 0,22 0,23 0,24 0,24 0,24 0,22 0,23 0,20 0,20 0,17 0,17
1. Energy Industries 0,00 0,00 0,00 0,00 0,00 0,00 0,00 0,00 0,00 0,00 0,002. Manufacturing Industries and Construction 0,00 0,00 0,00 0,00 0,00 0,00 0,01 0,01 0,01 0,01 0,013. Transport 0,15 0,16 0,16 0,16 0,16 0,14 0,14 0,12 0,12 0,09 0,094. Other Sectors 0,06 0,06 0,07 0,07 0,07 0,07 0,08 0,08 0,07 0,07 0,075. Other 0,00 0,00 0,00 0,00 0,00 0,00 0,00 0,00 0,00 0,00 0,00
B. Fugitive Emissions from Fuels 0,00 0,00 0,00 0,00 0,00 0,00 0,00 0,00 0,00 0,00 0,00 0,001. Solid Fuels2. Oil and Natural Gas
2. Industrial Processes 0 ,00 0 ,00 0 ,00 0 ,00 0 ,00 0 ,00 0 ,00 0 ,00 0 ,00 0 ,00 0 ,00 0 ,00A. Mineral Products 0,00 0,00 0,00 0,00 0,00 0,00 0,00 0,00 0,00 0,00 0,00B. Chemical Industry 0,00 0,00 0,00 0,00 0,00 0,00 0,00 0,00 0,00 0,00 0,00C. Metal Production 0,00 0,00 0,00 0,00 0,00 0,00 0,00 0,00 0,00 0,00 0,00D. Other Production
E. Production of Halocarbons and SF6
F. Consumption of Halocarbons and SF6
G. Other
3. Solvent and Other Product Use 0 ,00 0 ,00 0 ,00 0 ,00 0 ,00 0 ,00 0 ,00 0 ,00 0 ,00 0 ,00 0 ,00
4. Agriculture 0 ,00 11 ,90 11 ,74 11 ,41 11 ,31 11 ,36 11 ,08 11 ,18 11 ,29 11 ,40 11 ,27 10 ,79A. Enteric Fermentation 10,96 10,80 10,49 10,41 10,45 10,18 10,27 10,38 10,48 10,37 9,93B. Manure Management 0,94 0,95 0,92 0,91 0,90 0,90 0,91 0,91 0,91 0,90 0,87C. Rice CultivationD. Agricultural Soils 0,00 0,00 0,00 0,00 0,00 0,00 0,00 0,00 0,00 0,00 0,00E. Prescribed Burning of SavannasF. Field Burning of Agricultural ResiduesG. Other
5. Land-Use Change and Forestry 0 ,00 0 ,00 0 ,00 0 ,00 0 ,00 0 ,00 0 ,00 0 ,00 0 ,00 0 ,00 0 ,00 0 ,00A. Changes in Forest and Other Woody Biomass StocksB. Forest and Grassland ConversionC. Abandonment of Managed Lands
D. CO2 Emissions and Removals from SoilE. Other
6. Waste 0 ,00 1 ,90 1 ,89 2 ,04 2 ,12 2 ,22 2 ,33 2 ,49 2 ,45 2 ,07 2 ,16 2 ,25A. Solid Waste Disposal on Land 1,72 1,72 1,86 2,00 2,13 2,27 2,45 2,43 2,04 2,13 2,22B. Waste-water Handling 0,01 0,01 0,01 0,01 0,01 0,01 0,01 0,01 0,02 0,02 0,02C. Waste Incineration 0,18 0,17 0,18 0,11 0,08 0,05 0,03 0,01 0,01 0,01 0,01D. Other
7. Other (please s pecif y) 0 ,00 0 ,00 0 ,00 0 ,00 0 ,00 0 ,00 0 ,00 0 ,00 0 ,00 0 ,00 0 ,00 0 ,00
Memo Items:International Bunkers 0 ,00 0 ,01 0 ,01 0 ,01 0 ,01 0 ,01 0 ,01 0 ,01 0 ,02 0 ,02 0 ,02 0 ,02
Aviation 0,00 0,00 0,00 0,00 0,00 0,00 0,00 0,00 0,00 0,00 0,00Marine 0,01 0,00 0,01 0,01 0,01 0,01 0,01 0,01 0,02 0,02 0,02
Multilateral Operations
CO2 Emissions from Biomass
GREENHOUSE GAS SOURCE AND SINK CATEGORIES
Common Reporting Format for the provision of inventory information by Annex I Parties to the UNFCCC 8.4.2003** Table10s2**57/61
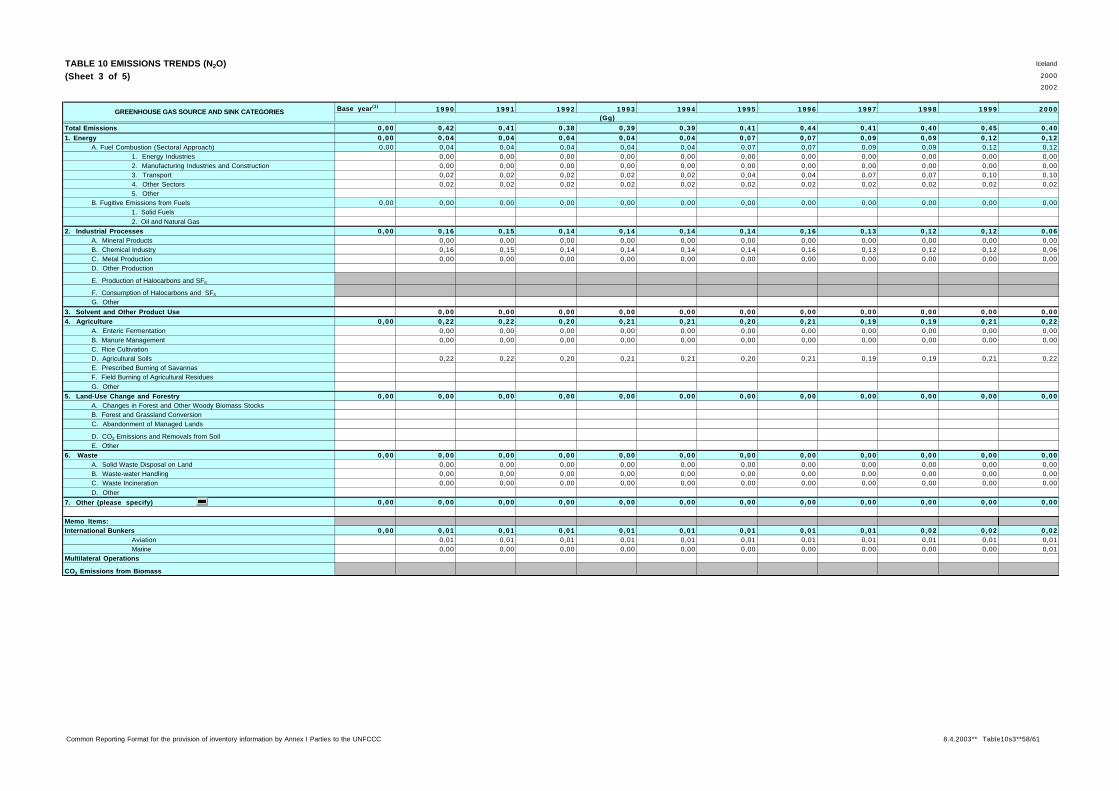
TABLE 10 EMISSIONS TRENDS (N 2O) Iceland
(Sheet 3 of 5) 2000
2002
Base year(1) 1 9 9 0 1 9 9 1 1 9 9 2 1 9 9 3 1 9 9 4 1 9 9 5 1 9 9 6 1 9 9 7 1 9 9 8 1 9 9 9 2 0 0 0(Gg)
Total Emissions 0 ,00 0 ,42 0 ,41 0 ,38 0 ,39 0 ,39 0 ,41 0 ,44 0 ,41 0 ,40 0 ,45 0 ,40
1. Energy 0 ,00 0 ,04 0 ,04 0 ,04 0 ,04 0 ,04 0 ,07 0 ,07 0 ,09 0 ,09 0 ,12 0 ,12A. Fuel Combustion (Sectoral Approach) 0,00 0,04 0,04 0,04 0,04 0,04 0,07 0,07 0,09 0,09 0,12 0,12
1. Energy Industries 0,00 0,00 0,00 0,00 0,00 0,00 0,00 0,00 0,00 0,00 0,002. Manufacturing Industries and Construction 0,00 0,00 0,00 0,00 0,00 0,00 0,00 0,00 0,00 0,00 0,003. Transport 0,02 0,02 0,02 0,02 0,02 0,04 0,04 0,07 0,07 0,10 0,104. Other Sectors 0,02 0,02 0,02 0,02 0,02 0,02 0,02 0,02 0,02 0,02 0,025. Other
B. Fugitive Emissions from Fuels 0,00 0,00 0,00 0,00 0,00 0,00 0,00 0,00 0,00 0,00 0,00 0,001. Solid Fuels2. Oil and Natural Gas
2. Industrial Processes 0 ,00 0 ,16 0 ,15 0 ,14 0 ,14 0 ,14 0 ,14 0 ,16 0 ,13 0 ,12 0 ,12 0 ,06A. Mineral Products 0,00 0,00 0,00 0,00 0,00 0,00 0,00 0,00 0,00 0,00 0,00B. Chemical Industry 0,16 0,15 0,14 0,14 0,14 0,14 0,16 0,13 0,12 0,12 0,06C. Metal Production 0,00 0,00 0,00 0,00 0,00 0,00 0,00 0,00 0,00 0,00 0,00D. Other Production
E. Production of Halocarbons and SF6
F. Consumption of Halocarbons and SF6
G. Other
3. Solvent and Other Product Use 0 ,00 0 ,00 0 ,00 0 ,00 0 ,00 0 ,00 0 ,00 0 ,00 0 ,00 0 ,00 0 ,004. Agriculture 0 ,00 0 ,22 0 ,22 0 ,20 0 ,21 0 ,21 0 ,20 0 ,21 0 ,19 0 ,19 0 ,21 0 ,22
A. Enteric Fermentation 0,00 0,00 0,00 0,00 0,00 0,00 0,00 0,00 0,00 0,00 0,00B. Manure Management 0,00 0,00 0,00 0,00 0,00 0,00 0,00 0,00 0,00 0,00 0,00C. Rice CultivationD. Agricultural Soils 0,22 0,22 0,20 0,21 0,21 0,20 0,21 0,19 0,19 0,21 0,22E. Prescribed Burning of SavannasF. Field Burning of Agricultural ResiduesG. Other
5. Land-Use Change and Forestry 0 ,00 0 ,00 0 ,00 0 ,00 0 ,00 0 ,00 0 ,00 0 ,00 0 ,00 0 ,00 0 ,00 0 ,00A. Changes in Forest and Other Woody Biomass StocksB. Forest and Grassland ConversionC. Abandonment of Managed Lands
D. CO2 Emissions and Removals from SoilE. Other
6. Waste 0 ,00 0 ,00 0 ,00 0 ,00 0 ,00 0 ,00 0 ,00 0 ,00 0 ,00 0 ,00 0 ,00 0 ,00A. Solid Waste Disposal on Land 0,00 0,00 0,00 0,00 0,00 0,00 0,00 0,00 0,00 0,00 0,00B. Waste-water Handling 0,00 0,00 0,00 0,00 0,00 0,00 0,00 0,00 0,00 0,00 0,00C. Waste Incineration 0,00 0,00 0,00 0,00 0,00 0,00 0,00 0,00 0,00 0,00 0,00D. Other
7. Other (please s pecif y) 0 ,00 0 ,00 0 ,00 0 ,00 0 ,00 0 ,00 0 ,00 0 ,00 0 ,00 0 ,00 0 ,00 0 ,00
Memo Items:International Bunkers 0 ,00 0 ,01 0 ,01 0 ,01 0 ,01 0 ,01 0 ,01 0 ,01 0 ,01 0 ,02 0 ,02 0 ,02
Aviation 0,01 0,01 0,01 0,01 0,01 0,01 0,01 0,01 0,01 0,01 0,01Marine 0,00 0,00 0,00 0,00 0,00 0,00 0,00 0,00 0,00 0,00 0,01
Multilateral Operations
CO2 Emissions from Biomass
GREENHOUSE GAS SOURCE AND SINK CATEGORIES
Common Reporting Format for the provision of inventory information by Annex I Parties to the UNFCCC 8.4.2003** Table10s3**58/61
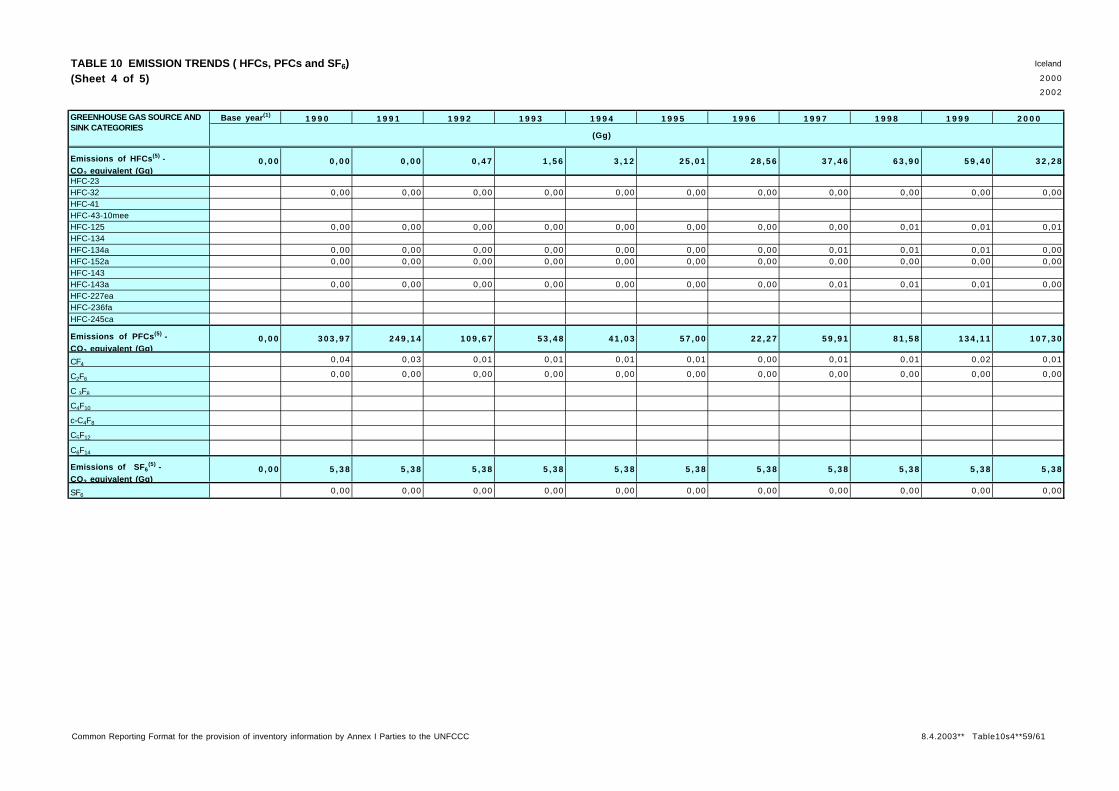
TABLE 10 EMISSION TRENDS ( HFCs, PFCs and SF 6) Iceland
(Sheet 4 of 5) 2000
2002
Base year (1) 1 9 9 0 1 9 9 1 1 9 9 2 1 9 9 3 1 9 9 4 1 9 9 5 1 9 9 6 1 9 9 7 1 9 9 8 1 9 9 9 2 0 0 0
(Gg)
Emissions of HFCs (5) - CO2 equivalent (Gg)
0 , 0 0 0 , 0 0 0 , 0 0 0 , 4 7 1 , 5 6 3 , 1 2 2 5 , 0 1 2 8 , 5 6 3 7 , 4 6 6 3 , 9 0 5 9 , 4 0 3 2 , 2 8
HFC-23HFC-32 0,00 0,00 0,00 0,00 0,00 0,00 0,00 0,00 0,00 0,00 0,00HFC-41HFC-43-10meeHFC-125 0,00 0,00 0,00 0,00 0,00 0,00 0,00 0,00 0,01 0,01 0,01HFC-134HFC-134a 0,00 0,00 0,00 0,00 0,00 0,00 0,00 0,01 0,01 0,01 0,00HFC-152a 0,00 0,00 0,00 0,00 0,00 0,00 0,00 0,00 0,00 0,00 0,00HFC-143HFC-143a 0,00 0,00 0,00 0,00 0,00 0,00 0,00 0,01 0,01 0,01 0,00HFC-227eaHFC-236faHFC-245ca
Emissions of PFCs (5) - CO2 equ ivalent (Gg)
0 , 0 0 3 0 3 , 9 7 2 4 9 , 1 4 1 0 9 , 6 7 5 3 , 4 8 4 1 , 0 3 5 7 , 0 0 2 2 , 2 7 5 9 , 9 1 8 1 , 5 8 1 3 4 , 1 1 1 0 7 , 3 0
CF40,04 0,03 0,01 0,01 0,01 0,01 0,00 0,01 0,01 0,02 0,01
C2F60,00 0,00 0,00 0,00 0,00 0,00 0,00 0,00 0,00 0,00 0,00
C 3F8
C4F10
c-C4F8
C5F12
C6F14
Emissions of SF 6(5) -
CO2 equ ivalent (Gg)0 , 0 0 5 , 3 8 5 , 3 8 5 , 3 8 5 , 3 8 5 , 3 8 5 , 3 8 5 , 3 8 5 , 3 8 5 , 3 8 5 , 3 8 5 , 3 8
SF60,00 0,00 0,00 0,00 0,00 0,00 0,00 0,00 0,00 0,00 0,00
GREENHOUSE GAS SOURCE AND SINK CATEGORIES
Common Reporting Format for the provision of inventory information by Annex I Parties to the UNFCCC 8.4.2003** Table10s4**59/61
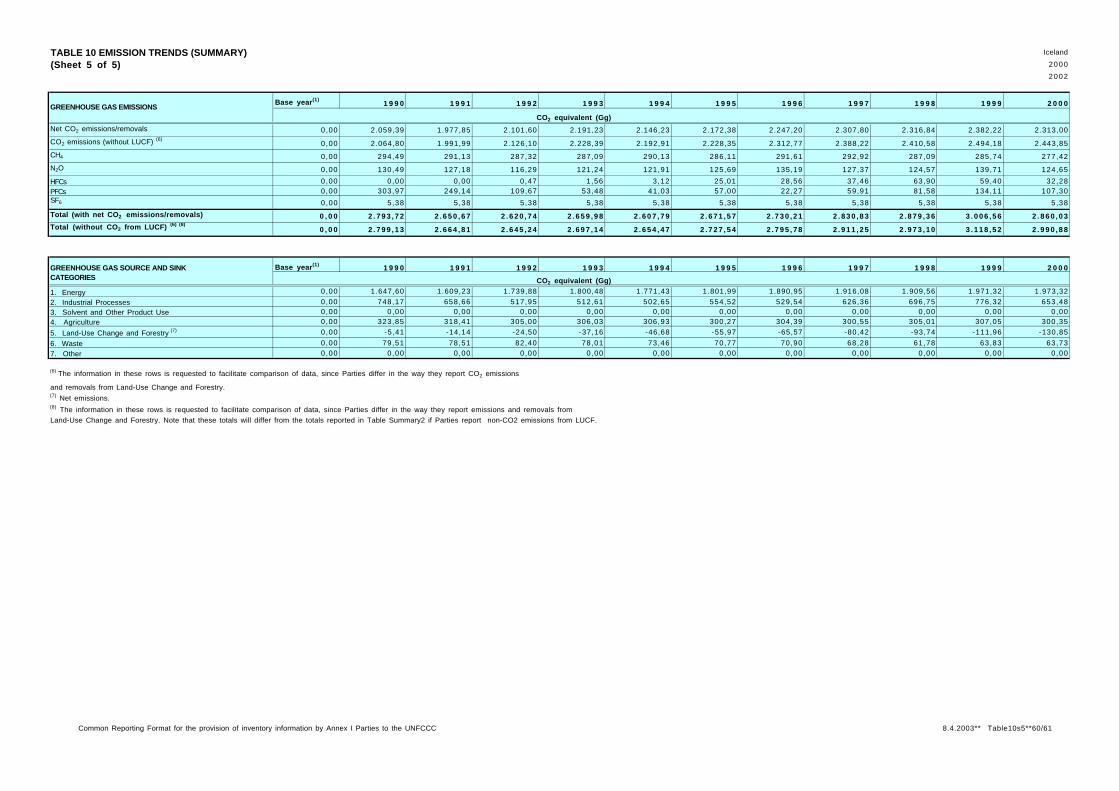
TABLE 10 EMISSION TRENDS (SUMMARY) Iceland
(Sheet 5 of 5) 2000
2002
Base year (1)1 9 9 0 1 9 9 1 1 9 9 2 1 9 9 3 1 9 9 4 1 9 9 5 1 9 9 6 1 9 9 7 1 9 9 8 1 9 9 9 2 0 0 0
CO2 equivalent (Gg)
Net CO2 emissions/removals 0,00 2.059,39 1.977,85 2.101,60 2.191,23 2.146,23 2.172,38 2.247,20 2.307,80 2.316,84 2.382,22 2.313,00
CO2 emissions (without LUCF) (6)0 ,00 2.064,80 1.991,99 2.126,10 2.228,39 2.192,91 2.228,35 2.312,77 2.388,22 2.410,58 2.494,18 2.443,85
CH4 0,00 294,49 291,13 287,32 287,09 290,13 286,11 291,61 292,92 287,09 285,74 277,42
N2O 0,00 130,49 127,18 116,29 121,24 121,91 125,69 135,19 127,37 124,57 139,71 124,65
HFCs 0,00 0,00 0,00 0,47 1,56 3,12 25,01 28,56 37,46 63,90 59,40 32,28PFCs 0,00 303,97 249,14 109,67 53,48 41,03 57,00 22,27 59,91 81,58 134,11 107,30SF6 0,00 5,38 5,38 5,38 5,38 5,38 5,38 5,38 5,38 5,38 5,38 5,38
Total (with net CO 2 emissions/removals) 0 , 0 0 2 . 7 9 3 , 7 2 2 . 6 5 0 , 6 7 2 . 6 2 0 , 7 4 2 . 6 5 9 , 9 8 2 . 6 0 7 , 7 9 2 . 6 7 1 , 5 7 2 . 7 3 0 , 2 1 2 . 8 3 0 , 8 3 2 . 8 7 9 , 3 6 3 . 0 0 6 , 5 6 2 . 8 6 0 , 0 3Total (without CO 2 from LUCF) (6) (8)
0 , 0 0 2 . 7 9 9 , 1 3 2 . 6 6 4 , 8 1 2 . 6 4 5 , 2 4 2 . 6 9 7 , 1 4 2 . 6 5 4 , 4 7 2 . 7 2 7 , 5 4 2 . 7 9 5 , 7 8 2 . 9 1 1 , 2 5 2 . 9 7 3 , 1 0 3 . 1 1 8 , 5 2 2 . 9 9 0 , 8 8
GREENHOUSE GAS SOURCE AND SINK Base year (1) 1 9 9 0 1 9 9 1 1 9 9 2 1 9 9 3 1 9 9 4 1 9 9 5 1 9 9 6 1 9 9 7 1 9 9 8 1 9 9 9 2 0 0 0CATEGORIES CO2 equivalent (Gg)
1. Energy 0,00 1.647,60 1.609,23 1.739,88 1.800,48 1.771,43 1.801,99 1.890,95 1.916,08 1.909,56 1.971,32 1.973,32
2. Industrial Processes 0,00 748,17 658,66 517,95 512,61 502,65 554,52 529,54 626,36 696,75 776,32 653,483. Solvent and Other Product Use 0,00 0,00 0,00 0,00 0,00 0,00 0,00 0,00 0,00 0,00 0,00 0,004. Agriculture 0,00 323,85 318,41 305,00 306,03 306,93 300,27 304,39 300,55 305,01 307,05 300,35
5. Land-Use Change and Forestry (7) 0 ,00 -5,41 -14,14 -24,50 -37,16 -46,68 -55,97 -65,57 -80,42 -93,74 -111,96 -130,85
6. Waste 0,00 79,51 78,51 82,40 78,01 73,46 70,77 70,90 68,28 61,78 63,83 63,73
7. Other 0,00 0,00 0,00 0,00 0,00 0,00 0,00 0,00 0,00 0,00 0,00 0,00
(6) The information in these rows is requested to facilitate comparison of data, since Parties differ in the way they report CO2 emissions
and removals from Land-Use Change and Forestry. (7) Net emissions.(8) The information in these rows is requested to facilitate comparison of data, since Parties differ in the way they report emissions and removals fromLand-Use Change and Forestry. Note that these totals will differ from the totals reported in Table Summary2 if Parties report non-CO2 emissions from LUCF.
GREENHOUSE GAS EMISSIONS
Common Reporting Format for the provision of inventory information by Annex I Parties to the UNFCCC 8.4.2003** Table10s5**60/61
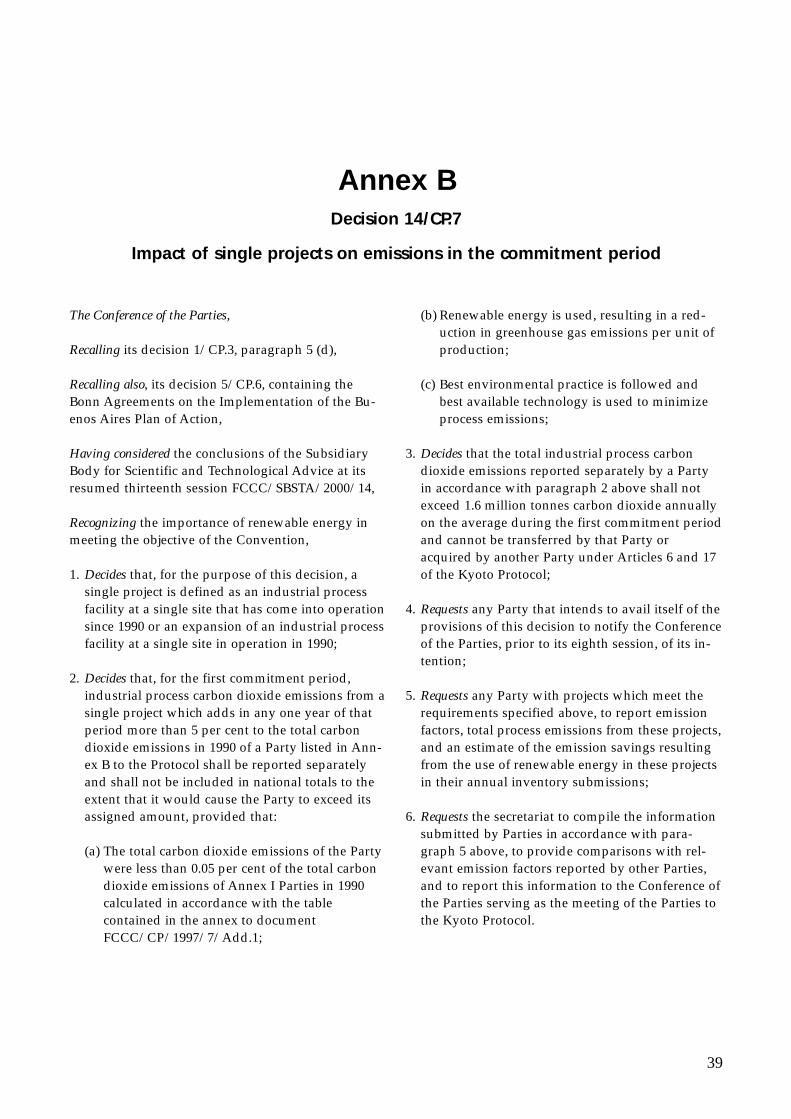
39
The Conference of the Parties,
Recalling its decision 1/CP.3, paragraph 5 (d),
Recalling also, its decision 5/CP.6, containing theBonn Agreements on the Implementation of the Bu-enos Aires Plan of Action,
Having considered the conclusions of the SubsidiaryBody for Scientific and Technological Advice at itsresumed thirteenth session FCCC/SBSTA/2000/14,
Recognizing the importance of renewable energy inmeeting the objective of the Convention,
1. Decides that, for the purpose of this decision, asingle project is defined as an industrial processfacility at a single site that has come into operationsince 1990 or an expansion of an industrial processfacility at a single site in operation in 1990;
2. Decides that, for the first commitment period,industrial process carbon dioxide emissions from asingle project which adds in any one year of thatperiod more than 5 per cent to the total carbondioxide emissions in 1990 of a Party listed in Ann-ex B to the Protocol shall be reported separatelyand shall not be included in national totals to theextent that it would cause the Party to exceed itsassigned amount, provided that:
(a) The total carbon dioxide emissions of the Partywere less than 0.05 per cent of the total carbondioxide emissions of Annex I Parties in 1990calculated in accordance with the tablecontained in the annex to documentFCCC/CP/1997/7/Add.1;
(b) Renewable energy is used, resulting in a red-uction in greenhouse gas emissions per unit ofproduction;
(c) Best environmental practice is followed andbest available technology is used to minimizeprocess emissions;
3. Decides that the total industrial process carbondioxide emissions reported separately by a Partyin accordance with paragraph 2 above shall notexceed 1.6 million tonnes carbon dioxide annuallyon the average during the first commitment periodand cannot be transferred by that Party oracquired by another Party under Articles 6 and 17of the Kyoto Protocol;
4. Requests any Party that intends to avail itself of theprovisions of this decision to notify the Conferenceof the Parties, prior to its eighth session, of its in-tention;
5. Requests any Party with projects which meet therequirements specified above, to report emissionfactors, total process emissions from these projects,and an estimate of the emission savings resultingfrom the use of renewable energy in these projectsin their annual inventory submissions;
6. Requests the secretariat to compile the informationsubmitted by Parties in accordance with para-graph 5 above, to provide comparisons with rel-evant emission factors reported by other Parties,and to report this information to the Conference ofthe Parties serving as the meeting of the Parties tothe Kyoto Protocol.
Annex BDecision 14/CP.7
Impact of single projects on emissions in the commitment period
40
The Ministry for the EnvironmentVonarstraeti 4150 ReykjavikICELANDurl: http://www.environment.is
The Environmental and Food Agency Suðurlandsbraut 24108 ReykjavikICELANDurl: http://www.ust.is
The Icelandic Meteorological OfficeBústaðarvegur 9150 ReykjavíkICELANDurl: http://www.vedur.is
The Marine Research InstituteSkúlagata 4P.O. Box 1390121 ReykjavíkICELANDurl: http://www.hafro.is
The Agricultural Research InstituteKeldnaholt vid VesturlandsvegReykjavikICELANDurl: http://www.rala.is
The National Energy AuthorityGrensásvegur 9108 ReykjavikICELANDurl: http://www.os.is
Annex CContact addresses