Ice Cream in Japan - WU Libraries Blogswulibraries.typepad.com/files/ice-cream-in-japan.pdf · Ice...
36
www.datamonitor.com Datamonitor USA 245 Fifth Avenue 4th Floor New York, NY 10016 USA t: +1 212 686 7400 f: +1 212 686 2626 e: [email protected] Datamonitor Europe Charles House 108-110 Finchley Road London NW3 5JJ United Kingdom t: +44 20 7675 7000 f: +44 20 7675 7500 e: [email protected] Datamonitor Germany Kastor & Pollux Platz der Einheit 1 60327 Frankfurt Deutschland t: +49 69 9754 4517 f: +49 69 9754 4900 e: [email protected] Datamonitor Asia Pacific Level 46, 2 Park Street Sydney, NSW 2000 Australia t: +61 2 8705 6900 f: +61 2 8705 6901 e: [email protected] Ice Cream in Japan Industry Profile Reference Code: 0104-0121 Publication date: November 2008
Transcript of Ice Cream in Japan - WU Libraries Blogswulibraries.typepad.com/files/ice-cream-in-japan.pdf · Ice...

www.datamonitor.com Datamonitor USA 245 Fifth Avenue 4th Floor New York, NY 10016 USA t: +1 212 686 7400 f: +1 212 686 2626 e: [email protected]
Datamonitor Europe Charles House 108-110 Finchley Road London NW3 5JJ United Kingdom t: +44 20 7675 7000 f: +44 20 7675 7500 e: [email protected]
Datamonitor Germany Kastor & Pollux Platz der Einheit 1 60327 Frankfurt Deutschland t: +49 69 9754 4517 f: +49 69 9754 4900 e: [email protected]
Datamonitor Asia Pacific Level 46, 2 Park Street Sydney, NSW 2000 Australia t: +61 2 8705 6900 f: +61 2 8705 6901 e: [email protected]
Ice Cream in Japan
Industry Profile
Reference Code: 0104-0121Publication date: November 2008

ABOUT DATAMONITOR
All Rights Reserved.
No part of this publication may be reproduced, stored in a retrieval system or transmitted in any form by
any means, electronic, mechanical, photocopying, recording or otherwise, without the prior permission of
the publisher, Datamonitor plc.
The facts of this report are believed to be correct at the time of publication but cannot be guaranteed.
Please note that the findings, conclusions and recommendations that Datamonitor delivers will be based
on information gathered in good faith from both primary and secondary sources, whose accuracy we are
not always in a position to guarantee. As such Datamonitor can accept no liability whatever for actions
taken based on any information that may subsequently prove to be incorrect.
Japan - Ice Cream
© Datamonitor (Published November 2008) Page 2
ABOUT DATAMONITOR
Datamonitor is a leading business information company specializing in industry analysis.
Through its proprietary databases and wealth of expertise, Datamonitor provides clients with unbiased expert analysis and in depth forecasts for six industry sectors: Healthcare, Technology, Automotive, Energy, Consumer Markets, and Financial Services.
The company also advises clients on the impact that new technology and eCommerce will have on their businesses. Datamonitor maintains its headquarters in London, and regional offices in New York, Frankfurt, and Hong Kong. The company serves the world’s largest 5000 companies.
Datamonitor's premium reports are based on primary research with industry panels and consumers. We gather information on market segmentation, market growth and pricing, competitors and products. Our experts then interpret this data to produce detailed forecasts and actionable recommendations, helping you create new business opportunities and ideas.
Our series of company, industry and country profiles complements our premium products, providing top-level information on 10,000 companies, 2,500 industries and 50 countries. While they do not contain the highly detailed breakdowns found in premium reports, profiles give you the most important qualitative and quantitative summary information you need - including predictions and forecasts.
EXECUTIVE SUMMARY
Japan - Ice Cream
© Datamonitor (Published November 2008) Page 3
EXECUTIVE SUMMARY
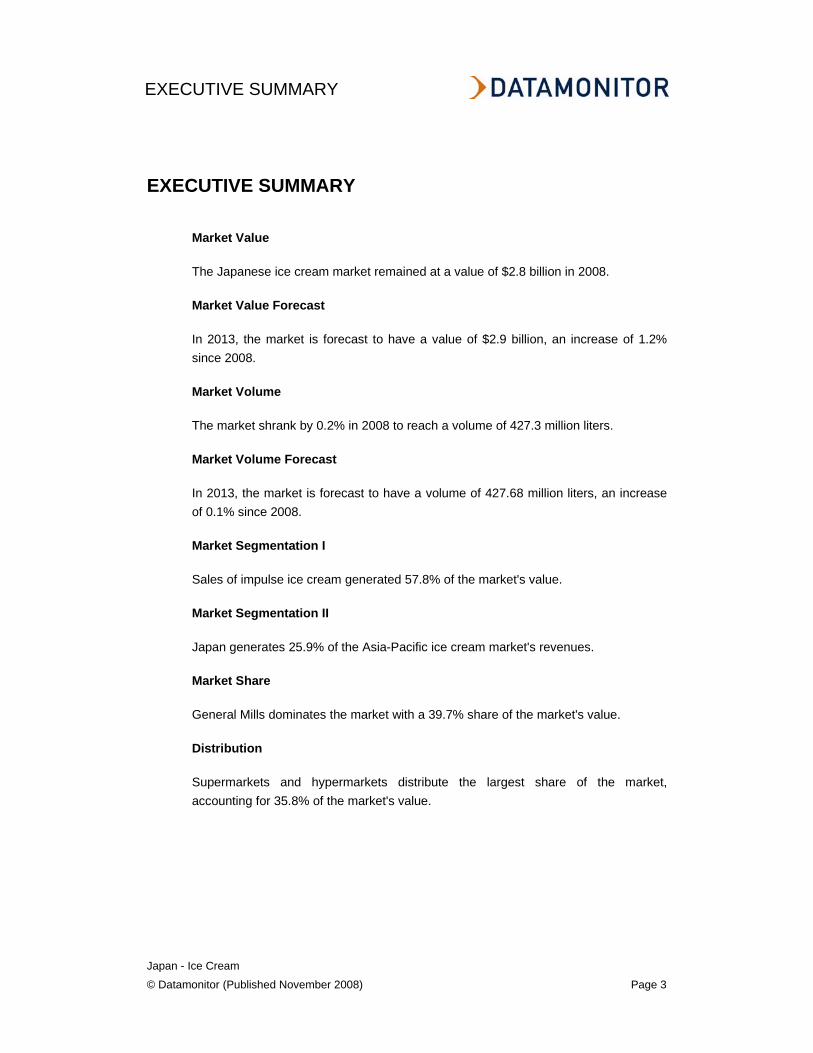
Market Value
The Japanese ice cream market remained at a value of $2.8 billion in 2008.
Market Value Forecast
In 2013, the market is forecast to have a value of $2.9 billion, an increase of 1.2% since 2008.
Market Volume
The market shrank by 0.2% in 2008 to reach a volume of 427.3 million liters.
Market Volume Forecast
In 2013, the market is forecast to have a volume of 427.68 million liters, an increase of 0.1% since 2008.
Market Segmentation I
Sales of impulse ice cream generated 57.8% of the market's value.
Market Segmentation II
Japan generates 25.9% of the Asia-Pacific ice cream market's revenues.
Market Share
General Mills dominates the market with a 39.7% share of the market's value.
Distribution
Supermarkets and hypermarkets distribute the largest share of the market, accounting for 35.8% of the market's value.
CONTENTS
Japan - Ice Cream
© Datamonitor (Published November 2008) Page 4
TABLE OF CONTENTS
EXECUTIVE SUMMARY 3
CHAPTER 1 Market Overview 7
1.1 Market Definition 7
1.2 Research Highlights 7
1.3 Market Analysis 8
CHAPTER 2 Market Value 9
CHAPTER 3 Market Volume 10
CHAPTER 4 Market Segmentation I 11
CHAPTER 5 Market Segmentation II 12
CHAPTER 6 Market Share 13
CHAPTER 7 Five Forces Analysis 14
7.1 Summary 14
7.2 Buyer Power 15
7.3 Supplier Power 16
7.4 New Entrants 18
7.5 Substitutes 20
7.6 Rivalry 21
CHAPTER 8 Leading Companies 22
8.1 Ezaki Glico 22

CONTENTS
Japan - Ice Cream
© Datamonitor (Published November 2008) Page 5
8.2 General Mills, Inc. 24
8.3 Snow Brand Milk Products Co., Ltd. 28
CHAPTER 9 Distribution 30
CHAPTER 10 Market Forecasts 31
10.1 Market Value Forecast 31
10.2 Market Volume Forecast 32
CHAPTER 11 Macroeconomic Indicators 33
CHAPTER 12 Appendix 35
12.1 Methodology 35
12.2 Related Datamonitor Research 36

CONTENTS
Japan - Ice Cream
© Datamonitor (Published November 2008) Page 6
LIST OF TABLES
Table 1: Japan Ice Cream Market Value: $ billion, 2004-2008(e) .....................................9
Table 2: Japan Ice Cream Market Volume: Liters million, 2004-2008(e).........................10
Table 3: Japan Ice Cream Market Segmentation I: % Share, by Value, 2008(e) ............11
Table 4: Japan Ice Cream Market Segmentation II: % Share, by Value, 2008(e) ...........12
Table 5: Japan Ice Cream Market Share: % Share, by Value, 2008(e)...........................13
Table 6: Key Facts: Ezaki Glico......................................................................................22
Table 7: Key Financials: Ezaki Glico...............................................................................23
Table 8: Key Facts: General Mills, Inc. ...........................................................................24
Table 9: Key Financials: General Mills, Inc. ....................................................................27
Table 10: Key Facts: Snow Brand Milk Products Co., Ltd.................................................28
Table 11: Key Financials: Snow Brand Milk Products Co., Ltd. ........................................29
Table 12: Japan Ice Cream Distribution: % Share, by Value, 2008(e) ..............................30
Table 13: Japan Ice Cream Market Value Forecast: $ billion, 2008-2013.........................31
Table 14: Japan Ice Cream Market Volume Forecast: Liters million, 2008-2013 ..............32
Table 15: Japan Size of Population (million) , 2004-2008.................................................33
Table 16: Japan GDP (Constant 2000 Prices, $ billion), 2004-2008.................................33
Table 17: Japan Inflation, 2004-2008 ...............................................................................33
Table 18: Japan Exchange Rate, 2004-2008 ...................................................................34

MARKET OVERVIEW
Japan - Ice Cream
© Datamonitor (Published November 2008) Page 7
CHAPTER 1 MARKET OVERVIEW
1.1 Market Definition
The ice cream market consists of the total revenues generated through the sale of artisanal ice cream, frozen yoghurt, impulse ice cream and take-home ice cream.
Any currency conversions used in the creation of this report have been calculated using constant 2007 annual average exchange rates.
For the purpose of this report Asia-Pacific comprises Australia, China, Japan, India, Singapore, South Korea and Taiwan.
1.2 Research Highlights
The Japanese ice cream market generated total revenues of $2.8 billion in 2008, representing a compound annual rate of change (CARC) of -0.2% for the period spanning 2004-2008.
Market consumption volumes decreased with a CARC of -0.7% between 2004-2008, to reach a total of 427.3 million liters in 2008.
The impulse ice cream segment was the market's most lucrative in 2008, generating total revenues of $1.6 billion, equivalent to 57.8% of the market's overall value.
The performance of the market is forecast to recover, with an anticipated CAGR of 0.2% for the five-year period 2008-2013, which is expected to drive the market to a value of $2.9 billion by the end of 2013.
MARKET OVERVIEW
Japan - Ice Cream
© Datamonitor (Published November 2008) Page 8
1.3 Market Analysis
The Japanese ice cream market saw a slight decline during the period 2004-2008. In the forecast period towards 2013, the market is expected to grow slowly but steadily, with the growth rate largely remaining at 0.3%.
The Japanese ice cream market generated total revenues of $2.8 billion in 2008, representing a compound annual rate of change (CARC) of -0.2% for the period spanning 2004-2008. In comparison, the Chinese and Indian markets grew with compound annual growth rates (CAGRs) of 8.6% and 7.1%, respectively, over the same period, to reach respective values of $4.4 billion and $13.8 billion in 2008.
Market consumption volumes decreased with a CARC of -0.7% between 2004-2008, to reach a total of 427.3 million liters in 2008. The market's volume is expected to rise to 427.6 million liters by the end of 2013, representing a CAGR of 0% for the 2008-2013 period.
The impulse ice cream segment was the market's most lucrative in 2008, generating total revenues of $1.6 billion, equivalent to 57.8% of the market's overall value. The take-home ice cream segment contributed revenues of $1.2 billion in 2008, equating to 40.8% of the market's aggregate revenues.
The performance of the market is forecast to recover, with an anticipated CAGR of 0.2% for the five-year period 2008-2013, which is expected to drive the market to a value of $2.9 billion by the end of 2013. Comparatively, the Chinese and Indian markets will grow with CAGRs of 8.8% and 8.9%, respectively, over the same period, to reach respective values of $6.8 billion and $21.1 billion in 2013.

MARKET VALUE
Japan - Ice Cream
© Datamonitor (Published November 2008) Page 9
CHAPTER 2 MARKET VALUE
The Japanese ice cream market remained at a value of $2.8 billion in 2008.
The compound annual rate of change of the market in the period 2004-2008 was -0.2%.
Table 1: Japan Ice Cream Market Value: $ billion, 2004-2008(e) Year $ billion Ja¥ billion % Growth 2004 2.9 336.1 2005 2.8 334.0 -0.60%2006 2.8 333.6 -0.10%2007 2.8 333.4 0.00%2008(e) 2.8 333.5 0.00% CAGR, 2004-2008: -0.2% Source: Datamonitor D A T A M O N I T O R
Figure 1: Japan Ice Cream Market Value: $ billion, 2004-2008(e)
Source: Datamonitor D A T A M O N I T O R
0.0
0.5
1.0
1.5
2.0
2.5
3.0
2004 2005 2006 2007 2008
$ bi
llion
-0.7%
-0.6%-0.5%
-0.4%-0.3%
-0.2%
-0.1%0.0%
0.1%
% G
rowth
$ billion % Growth

MARKET VOLUME
Japan - Ice Cream
© Datamonitor (Published November 2008) Page 10
CHAPTER 3 MARKET VOLUME
The Japanese ice cream market shrank by 0.2% in 2008 to reach a volume of 427.3 million liters.
The compound annual rate of change of the market volume in the period 2004-2008 was -0.7%.
Table 2: Japan Ice Cream Market Volume: Liters million, 2004-2008(e) Year Liters million % Growth 2004 440.0 2005 431.8 -1.90%2006 429.1 -0.60%2007 428.1 -0.20%2008(e) 427.3 -0.20% CAGR, 2004-2008: -0.7% Source: Datamonitor D A T A M O N I T O R
Figure 2: Japan Ice Cream Market Volume: Liters million, 2004-2008(e)
Source: Datamonitor D A T A M O N I T O R
050
100150200250300350400450500
2004 2005 2006 2007 2008
Lite
rs m
illio
n
-2.0%-1.8%-1.6%-1.4%-1.2%-1.0%-0.8%-0.6%-0.4%-0.2%0.0%
% G
rowth
Liters million % Growth

MARKET SEGMENTATION I
Japan - Ice Cream
© Datamonitor (Published November 2008) Page 11
CHAPTER 4 MARKET SEGMENTATION I
Sales of impulse ice cream generated 57.8% of the Japanese ice cream market's value.
In comparison, sales of take-home ice cream accounted for a further 40.8% of the market's revenues.
Table 3: Japan Ice Cream Market Segmentation I: % Share, by Value, 2008(e)
Category % Share Impulse ice cream 57.80%Take-home ice cream 40.80%Frozen yogurt 1.00%Artisanal ice cream 0.40% Total 100.0% Source: Datamonitor D A T A M O N I T O R
Figure 3: Japan Ice Cream Market Segmentation I: % Share, by Value, 2008(e)
Impulse ice cream57.8%
Take-home ice cream40.8%
Frozen yogurt1.0%
Artisanal ice cream0.4%
Source: Datamonitor D A T A M O N I T O R

MARKET SEGMENTATION II
Japan - Ice Cream
© Datamonitor (Published November 2008) Page 12
CHAPTER 5 MARKET SEGMENTATION II
Japan generates 25.9% of the Asia-Pacific ice cream market's revenues.
China is the largest ice cream market in the region accounting for 40.5% of the overall value.
Table 4: Japan Ice Cream Market Segmentation II: % Share, by Value, 2008(e)
Geography % Share China 40.50%Rest of Asia-Pacific 33.60%Japan 25.90% Total 100.0% Source: Datamonitor D A T A M O N I T O R
Figure 4: Japan Ice Cream Market Segmentation II: % Share, by Value, 2008(e)
Source: Datamonitor D A T A M O N I T O R
China40.5%
Rest of Asia-Pacif ic33.6%
Japan25.9%

MARKET SHARE
Japan - Ice Cream
© Datamonitor (Published November 2008) Page 13
CHAPTER 6 MARKET SHARE
General Mills dominates the Japanese ice cream market with a 39.7% share of the market's value.
Ezaki Glico accounts for a further 12.2% of the market's revenues.
Table 5: Japan Ice Cream Market Share: % Share, by Value, 2008(e) Company % Share Other 41.60%General Mills, Inc. 39.70%Ezaki Glico 12.20%Snow Brand Milk Products Co., Ltd. 6.50% Total 100.0% Source: Datamonitor D A T A M O N I T O R
Figure 5: Japan Ice Cream Market Share: % Share, by Value, 2008(e)
Other41.6%
General Mills, Inc.
39.7%
Ezaki Glico12.2%
Snow Brand Milk Products
Co., Ltd.6.5%
Source: Datamonitor D A T A M O N I T O R

FIVE FORCES ANALYSIS
Japan - Ice Cream
© Datamonitor (Published November 2008) Page 14
CHAPTER 7 FIVE FORCES ANALYSIS
7.1 Summary
Figure 6: Forces Driving Competition in the Japanese Ice Cream Market
0
1
2
3
4
5Buyer Pow er
Supplier Pow er
New EntrantsSubstitutes
Degree of rivalry
Score for each force is mean of scores for its drivers. Total area & color indicates intensity of competition overall. Source: Datamonitor D A T A M O N I T O R
The Japanese ice cream market is generally high volume-low margin. Food retailers are the main buyers, and may exert strong buyer power, if they are large chains. Ice cream companies are able to source their raw material inputs from a relatively small number of suppliers, additionally the lack of suitable substitutes for major ingredients and price control for milk products mean that supplier power is moderate. It is possible to enter this market on a small-scale.
However, the existence of some strong brands, market regulations and the scale economies associated with high-volume production facilities prevent the threat of new entrants from becoming a significant factor. High exit costs and a declining market in recent years contribute to the moderate degree of rivalry that characterizes this market.
Intensity of competition
Weak Strong

FIVE FORCES ANALYSIS
Japan - Ice Cream
© Datamonitor (Published November 2008) Page 15
7.2 Buyer Power
Figure 7: Drivers of Buyer Power in the Japanese Ice Cream Market
012345
Buyer size
Oligopsony threat
Low -cost sw itching
Undifferentiated product
Tendency to sw itch
Price sensitivity
Financial muscle
Backw ards integration
Buyer independence
Product dispensability
Scores: 1= weak driver...5=strong driver Source: Datamonitor D A T A M O N I T O R
The Japan ice cream market will be analyzed by taking ice cream manufacturers as players, and supermarkets and hypermarkets as the main buyers, since these distribute the largest single share of the market's value (around 36%). Some of the large supermarket chains have integrated backwards and successfully introduced a wide range of private label products. This is particularly the case in the top selling take-home sector. The likelihood of backward integration boosts the buyer power and puts the higher-margin branded products of the leading market players under pressure.
Retailers themselves are unlikely to be swayed by brand loyalty, and price sensitivity will be high. However, this driver of buyer power will be mitigated where consumers are loyal to particular brands: retailers will need to stock these products in order to meet their own customers' demand.
Ice cream is generally not a significant part of a food retailer's business, which reduces the reliance upon sales of these items, and increases buyer power, especially for the larger supermarkets and hypermarkets, with their diverse product ranges. Manufacturers of ice cream can differentiate their products quite strongly, (by brand, flavour and colour, calorie content and so on) and the fact that major buyers generally need to offer a wide range of products for their own customers, should also tend to weaken buyer power. Overall, buyer power within the Japanese ice cream market is assessed as moderate.
Strength of buyer power
Weak Strong

FIVE FORCES ANALYSIS
Japan - Ice Cream
© Datamonitor (Published November 2008) Page 16
7.3 Supplier Power
Figure 8: Drivers of Supplier Power in the Japanese Ice Cream Market
012345
Supplier size
Oligopoly threat
Sw itching costs
Player independence
Player dispensabilityNo substitute inputs
Importance of quality/cost
Differentiated input
Forw ard integration
Scores: 1= weak driver...5=strong driver Source: Datamonitor D A T A M O N I T O R
Ice cream, a flavored frozen food, is made up of milkfat or butterfat, milk solids, sweeteners, stabilizers, emulsifiers and water. As long-term supply contracts are uncommon, dairy products are usually purchased on the open market. In this case ice cream companies have little control over prices, and often use techniques such as hedging to mitigate the impact of price fluctuations.
Large ice cream manufacturing firms may have a strong negotiating position and the widespread absence of fixed-term agreements means that the cost of switching suppliers is low. The Japanese dairy production sector is tightly controlled, however, in response to tight stocks, the government may choose to allow dairy imports above the established WTO Tariff Rate Quota (TRQ).
Supplier power is boosted somewhat by the presence of larger dairies and companies, who sell milk fat and concentrates in bulk to the ice cream industry, as well as companies who supply trademarked ingredients. The substitution of milk protein concentrate for milk is possible but will result in lower quality. Leading players in the ice cream market must maintain product quality if they are to maintain their brand equity in the long term; their need to source raw materials of appropriate quality boosts the strength of the suppliers that can offer these.
Strength of supplier power
Weak Strong

FIVE FORCES ANALYSIS
Japan - Ice Cream
© Datamonitor (Published November 2008) Page 17
Packaging is an important input in this market and some market players may enter into long-term contracts with their suppliers, which also increases supplier power. It may be possible to find substitutes for some minor ingredients such as flavorings in the production of ice cream but there are no satisfactory substitutes for major ingredients like milk and sugar. This also tends to strengthen supplier power, which is moderate overall.

FIVE FORCES ANALYSIS
Japan - Ice Cream
© Datamonitor (Published November 2008) Page 18
7.4 New Entrants
Figure 9: Factors Influencing the Likelihood of New Entrants in the Japanese Ice Cream Market
012345
Low -cost sw itching
Undifferentiated product
Scale unimportant
Low fixed costs
Little regulation
Incumbents acquiescentDistribution accessible
Suppliers accessible
Little IP involved
Weak brands
Market grow th
Scores: 1= weak driver...5=strong driver Source: Datamonitor D A T A M O N I T O R
Entry to the Japanese ice cream market may be achieved by starting up a new company, by diversifying an existing company's operations into the manufacture of ice cream products, acquiring an existing company, or, in the case of foreign producers, by beginning to export to the country. A joint venture with a local player may form a beneficial strategy, due to the market specifics and cultural differences.
Individual makers of gourmet ice cream can appeal to customers by emphasizing their use of natural ingredients and the high quality of products on offer or special flavours. Such specialty or 'home-made' ice creams can be sold at higher prices and any initial investment in raw materials, production equipment, etc can be recouped by adding a good margin to the price of the end-product; this may suggest a good entry strategy for a small company.
Larger companies, however, produce not only premium ice cream but also mass-marketed products. Here, margins may be lower. The other limitation on entering this market concerns distribution channels. Fresh ice cream is by nature difficult to transport and the storage cost is rather high. Producers need to distribute their ice cream widely, which generally involves channels such as supermarkets. Also, the manufacturers need to persuade supermarkets, specialist stores, and other businesses to stock their products.
Likelihood of new entrants
Weak Strong

FIVE FORCES ANALYSIS
Japan - Ice Cream
© Datamonitor (Published November 2008) Page 19
Sales space is a vital but finite resource, and it may be difficult to persuade retailers to allocate it to a new player's ice cream, especially in highly competitive food retail markets. Higher storage and distribution costs motivate players to sell their stock and cut the storage costs down which increases rivalry and reduces market accessibility.
The market has been in decline over the last few years, which also makes it less attractive to new companies. Manufacturers of ice cream can differentiate their products quite strongly. To hold on to their market shares, they must be willing to push out new flavors and replace them quickly. More demanding consumers want both to experiment with new taste and to pay a higher price for more sophisticated products.
The strong differentiation of the ice cream market makes it harder for newcomers to attract buyers away from the existing companies and diminishes the likelihood of new entrants. The dairy sector in many Asia-Pacific countries is tightly controlled; already very sensitive to food safety, a large number of Asia-Pacific consumers have been inundated with press reporting about melamine-tainted dairy products from China.
In Japan, the Ministry of Health, Labor and Welfare (MHLW) issued an import inspection order requiring companies to test for possible melamine contamination in foods that use Chinese dairy ingredients. This is leading to a greater emphasis on country of origin in consumer marketing campaigns and is influencing purchasing decisions by consumers and food ingredient buyers.
More market regulations increase manufacturing costs, and make it harder for new companies to enter the market. Additionally, newcomers may be discouraged by the presence of large incumbents (General Mills) and local players such as: Ezaki Glico and Snow Brand Milk Products, benefiting from scale economies and brand recognition.
On the other hand the low cost of switching between existing market players means that retailers are likely to change their preferences to new companies and moderate levels of proprietary products and knowledge in the market are convenient for new players. Overall, there is a moderate likelihood of new entrants within the Japanese ice cream market.

FIVE FORCES ANALYSIS
Japan - Ice Cream
© Datamonitor (Published November 2008) Page 20
7.5 Substitutes
Figure 10: Factors Influencing the Threat of Substitutes in the Japanese Ice Cream Market
0
1
2
3
4
5Low -cost sw itching
Cheap alternativeBeneficial alternative
Scores: 1= weak driver...5=strong driver Source: Datamonitor D A T A M O N I T O R
From the point of view of consumers, there are a number of substitutes for commercially-bought ice cream. These include frozen desserts such as sorbets and gelati, confectionery, and smoothies. Retailers, aiming to meet consumer demand, will tend to stock all these kinds of substitutes.
From the retailers' point of view, they may offer benefits such as higher margins (e.g. premium-priced desserts), cheaper storage and longer shelf-life (e.g. confectionery does not need to be stored in a freezer). Switching costs are not very high. However, most food retailers are likely to continue selling ice cream as a small part of their product range, and the threat of substitutes is assessed as moderate.
Threat of substitutes
Weak Strong

FIVE FORCES ANALYSIS
Japan - Ice Cream
© Datamonitor (Published November 2008) Page 21
7.6 Rivalry
Figure 11: Drivers of Degree of Rivalry in the Japanese Ice Cream Market
012345
Competitor size
Number of players
Low -cost sw itching
Undifferentiated product
Low fixed costs
Easy to expandHard to exit
Lack of diversity
Similarity of players
Storage costs
Zero-sum game?
Scores: 1= weak driver...5=strong driver Source: Datamonitor D A T A M O N I T O R
The Japanese ice cream market is fragmented, dominated by three large local players, namely Ezaki Glico and Snow Brand Milk Products and international player General Mills. Together they claim market shares of about 59% of the total market’s value. The sheer number of players and the presence of strong, international incumbents boost the competition within the market.
Retailers can switch between different manufacturers' products quite easily, although the brand loyalty of consumers exerts a pull-through on retailers and makes it difficult for them to completely abandon a popular branded product for a brand with less consumer appeal, or private-label alternatives. It is notable that the largest players in this market own the majority of their factories. In consequence, exit barriers are high, since leaving the ice cream market would require divestment of substantial - and often quite specialized - assets.
Fixed costs are also likely to be high, and automated processes mean that production can be ramped up when necessary. These factors, coupled with the declining market, tend to intensify rivalry. The degree of competition is assessed as moderate overall.
Degree of rivalry
Weak Strong

LEADING COMPANIES
Japan - Ice Cream
© Datamonitor (Published November 2008) Page 22
CHAPTER 8 LEADING COMPANIES
8.1 Ezaki Glico
Table 6: Key Facts: Ezaki Glico Address: 6 5 Utajima, 4 chome, Nishiyodogawa ku,
0saka 555 8502, JPN Telephone: 81 6 6477 8352 Fax: 81 6 6477 8250 Website: www.glico.co.jp Financial Year-End: March Ticker: 2206 Stock Exchange: Tokyo Source: Company Website D A T A M O N I T O R
Ezaki Glico is a Japanese manufacturer of ice cream, confectionery, snack foods, processed foods and soft drinks. The company has its own retail operations to reach customers, as well as its wholesale division.
The group operates through four key divisions: Milk products, Confectionery, Chilled Desserts and Food.
Milk products and confectionery account for the majority of the company's revenues and are the products with which the company name is most associated. Ezaki offers over 30 products domestically as well as to surrounding markets such as Singapore, Indonesia, Malaysia, Hong Kong and Taiwan.
Recently, the company has invested heavily in European marketing. The company has also been expanding its range of products, including the introduction of Alpha-Arbutin, a whitening cosmetics agent, Breo, a tongue- and breath-cleaning tablet, and weight-loss supplements.

LEADING COMPANIES
Japan - Ice Cream
© Datamonitor (Published November 2008) Page 23
Key Metrics
Table 7: Key Financials: Ezaki Glico
Metric 2003 2004 2005 2006 2007Revenues 2,280.8 2,248.6 2,219.4 2,215.3 2,289.8Net Income 20.7 21.3 29.3 41.7 35.0Profit Margin 0.9% 0.9% 1.3% 1.9% 1.5%Total Assets 1,853.4 1,779.2 1,668.1 1,805.6 1,796.7Total Liabilities 857.8 804.7 676.9 753.5 713.6
All in $ millions, except for margins
Source: Company Filings D A T A M O N I T O R
Figure 12: Revenues & Profitability: Ezaki Glico
0
500
1,000
1,500
2,000
2,500
2003 2004 2005 2006 2007
Year
US$
Mill
ions
0.0%
0.5%
1.0%
1.5%
2.0%
Pro
fit M
argi
n (%
)
Revenues Net Income Profit Margin
Source: Company Filings D A T A M O N I T O R

LEADING COMPANIES
Japan - Ice Cream
© Datamonitor (Published November 2008) Page 24
8.2 General Mills, Inc.
Table 8: Key Facts: General Mills, Inc. Address: 1 General Mills Boulevard, Minneapolis, 55426, USA Telephone: 1 763 764 7600 Fax: 1 763 764 7384 Website: www.generalmills.com Financial Year-End: May Ticker: GIS Stock Exchange: New York Source: Company Website D A T A M O N I T O R
General Mills is a producer of packaged consumer foods operating exclusively in the consumer foods industry. The company distributes its products primarily in the US and in more than 100 countries outside the US.
The company operates about 83 facilities for the production of a wide variety of food products, of which 51 are located in the US, 15 in the Asia/Pacific region, six in Canada, five in Europe, five in Latin America and Mexico, and one in South Africa. It owns flour mills at Vallejo, California; Swedesboro, New Jersey; Cincinnati, Ohio and Iowa City, Iowa.
The company generates revenues through three business divisions: US retail, bakeries and food service, and international.
The US retail division comprises cereals, meals, refrigerated and frozen dough products, baking products, snacks, yogurt and organic food products. The division produces and sells a number of ready-to-eat cereals, including brands such as Cheerios, Wheaties Energy Crunch, Total Corn Flakes, Whole Grain Total, Total Raisin Bran, Brown Sugar and Oat Total, Trix, Golden Grahams, and Wheat Chex.
The US retail division manufactures and sells several lines of convenient dinner products, such as Betty Crocker dry packaged dinner mixes under the Hamburger Helper, Tuna Helper, Chicken Helper and Pork Helper trademarks; Old El Paso Mexican foods and dinner kits; Progresso soups and ingredients; Green Giant canned and frozen vegetables and meal starters; and a line of refrigerated barbeque products under the Lloyd's Barbeque name.
The company also sells dry packaged specialty potatoes, Potato Buds instant mashed potatoes, Suddenly Salad and Bac*O's salad topping. It also manufactures and markets shelf stable microwave meals under the Betty Crocker Bowl Appetit brand and packaged meals under the Betty Crocker Complete Meals trademark.

LEADING COMPANIES
Japan - Ice Cream
© Datamonitor (Published November 2008) Page 25
The Pillsbury USA sub division manufactures and sells refrigerated and frozen dough products, frozen breakfast products, and frozen pizza and snack products. Refrigerated dough products marketed under the Pillsbury brand include Grands biscuits and sweet rolls; Golden Layers biscuits; Pillsbury Ready To Bake and Big Deluxe Classics cookies; and Pillsbury rolls, biscuits, cookies, breads and pie crust. Frozen dough product offerings include Home Baked Classics biscuits, rolls and other bakery goods.
Breakfast products sold under the Pillsbury trademark include Toaster Strudel pastries, Toaster Scrambles pastries and Pillsbury frozen pancakes, waffles and waffle sticks. All breakfast, refrigerated and frozen dough products incorporate the Doughboy logo. Frozen pizza and snack products are marketed under the Totino's and Jeno's trademarks.
Under the baking products sub division, General Mills makes and sells a line of dessert mixes under the Betty Crocker trademark, including SuperMoist cake mixes, Rich & Creamy and Soft Whipped ready-to-spread frostings, Supreme brownie and dessert bar mixes, muffin mixes and other mixes used to prepare dessert and baking items. The company markets a variety of baking mixes under the Bisquick trademark, sells pouch mixes under the Betty Crocker name, and produces family flour under the Gold Medal brand.
In the snacks sub division, General Mills markets Pop Secret microwave popcorn; a line of grain snacks including Nature Valley granola bars and Milk n'Cereal bars; a line of fruit snacks including Fruit Roll-Ups, Fruit By The Foot and Gushers; a line of snack mix products including Chex Mix and Gardetto's snack mix; and savory snacks marketed under the name Bugles.
The organic foods sub division markets organic frozen fruits and vegetables, a variety of canned tomato products including tomatoes and spaghetti sauce, salsa, ketchup, soup, frozen juice concentrates, pickles, fruit spreads, granola bars, frozen desserts and cereal under Cascadian Farm and Muir Glen trademarks.
The US retail division also manufactures and sells yogurt products, including Yoplait Original, Yoplait Light, Custard Style, Trix, Yumsters, Go-GURT, Yoplait Whips, Yoplait Nouriche, and Yoplait Ultra. The company also manufactures and sells a variety of refrigerated cup yogurt products under the Colombo brand name.
General Mills' international business comprises operations and sales in Canada, Latin America, Europe and the Asia Pacific region. Outside the US, the company markets its products in more than 100 countries. Outside North America, the company offers numerous local brands, in addition to internationally recognized brands as Haagen-Dazs ice cream, Old El Paso Mexican foods, Green Giant vegetables, Pillsbury dough products and mixes, Betty Crocker mixes and Bugles snacks. The international businesses are managed through 34 sales and marketing offices.

LEADING COMPANIES
Japan - Ice Cream
© Datamonitor (Published November 2008) Page 26
The company's bakeries and foodservice division markets mixes, and unbaked and fully baked frozen dough products to retail, supermarket and wholesale bakeries under the Pillsbury and Gold Medal trademarks. In addition, it sells flour to bakery, foodservice and manufacturing customers. It also markets frozen dough products, branded baking mixes, cereals, snacks, dinner and side dish products, refrigerated and soft-serve frozen yogurt, and custom food items to quick serve chains, restaurants, business and school cafeterias, convenience stores and vending companies.

LEADING COMPANIES
Japan - Ice Cream
© Datamonitor (Published November 2008) Page 27
Key Metrics
Table 9: Key Financials: General Mills, Inc.
Metric 2004 2005 2006 2007 2008Revenues 11,070.0 11,244.0 11,640.0 12,442.0 13,652.1Net Income 1,055.0 1,240.0 1,090.0 1,144.0 1,294.7Profit Margin 9.5% 11.0% 9.4% 9.2% 9.5%Total Assets 18,448.0 18,066.0 18,207.0 18,184.0 19,041.6Total Liabilities 12,901.0 11,257.0 11,299.0 11,726.0 12,583.5Employees 27,580 27,804 28,147 28,580 29,500
All in $ millions, except for employee numbers and margins
Source: Company Filings D A T A M O N I T O R
Figure 13: Revenues & Profitability: General Mills, Inc.
02,0004,0006,0008,000
10,00012,00014,00016,000
2004 2005 2006 2007 2008
Year
US$
Mill
ions
8.0%
8.5%
9.0%
9.5%
10.0%
10.5%
11.0%
11.5%
Prof
it M
argi
n (%
)
Revenues Net Income Profit Margin
Source: Company Filings D A T A M O N I T O R

LEADING COMPANIES
Japan - Ice Cream
© Datamonitor (Published November 2008) Page 28
8.3 Snow Brand Milk Products Co., Ltd.
Table 10: Key Facts: Snow Brand Milk Products Co., Ltd. Address: 13 Honshio-cho, Shinjuku-ku, Tokyo, 160 8575, JPN Telephone: 81 3 3226 2111 Fax: 81 3 3226 2109 Website: www.snowbrand.co.jp Financial Year-End: March Ticker: 2262 Stock Exchange: Tokyo Source: Company Website D A T A M O N I T O R
Snow Brand Milk Products is a Japan-based consumer product company. The company makes dairy products such as butter, cheese and margarine, as well as pharmaceuticals and soft drinks. However, dairy products account for most of the company's production.
Snow Brand Milk Products is the nucleus of the Snow Brand Group, which contains three major companies: Snow Brand Labio Co., Ltd., a producer of fermented milk drinks; Snow Brand Seed Co., Ltd., which handles seeds and feed; and Yukijurushi Access, Inc., Japan's second-largest food wholesaler.
The company has a flagship brand MBP which deals in bone-health related products. MBP is a milk basic protein naturally occurring in trace amounts, works directly and/or indirectly on bone cells to form healthy bones, and increase bone density. MBP is used widely in products such as lactic drink, yogurt, cheese, skim milk, and beverages.

LEADING COMPANIES
Japan - Ice Cream
© Datamonitor (Published November 2008) Page 29
Key Metrics
Table 11: Key Financials: Snow Brand Milk Products Co., Ltd.
Metric 2003 2004 2005 2006 2007Revenues 6,171.3 2,700.2 2,405.5 2,377.1 2,354.1Net Income -229.9 12.1 59.0 60.5 62.7Profit Margin -3.7% 0.4% 2.5% 2.5% 2.7%Total Assets 2,418.3 2,201.5 1,815.0 1,768.7 1,737.1Total Liabilities 2,005.9 1,785.4 1,337.5 1,218.4 1,119.8
All in $ millions, except for margins
Source: Company Filings D A T A M O N I T O R
Figure 14: Revenues & Profitability: Snow Brand Milk Products Co., Ltd.
-1,0000
1,0002,0003,0004,0005,0006,0007,000
2003 2004 2005 2006 2007
Year
US$
Mill
ions
-5.0%-4.0%-3.0%-2.0%-1.0%0.0%1.0%2.0%3.0%
Prof
it M
argi
n (%
)
Revenues Net Income Profit Margin
Source: Company Filings D A T A M O N I T O R

DISTRIBUTION
Japan - Ice Cream
© Datamonitor (Published November 2008) Page 30
CHAPTER 9 DISTRIBUTION
Supermarkets and hypermarkets distribute the largest share of the Japanese ice cream market, accounting for 35.8% of the market's value.
In comparison, independent retailers form the second largest distribution channel, generating 20.9% of the overall value.
Table 12: Japan Ice Cream Distribution: % Share, by Value, 2008(e) Channel % Share Supermarkets / hypermarkets 35.80%Other 24.40%Independent Retailers 20.90%Convenience Stores 18.90% Total 100.0% Source: Datamonitor D A T A M O N I T O R
Figure 15: Japan Ice Cream Distribution: % Share, by Value, 2008(e)
Source: Datamonitor D A T A M O N I T O R
Supermarkets / hypermarkets
35.8%
Other24.4%
Independent Retailers20.9%
Convenience Stores18.9%

MARKET FORECASTS
Japan - Ice Cream
© Datamonitor (Published November 2008) Page 31
CHAPTER 10 MARKET FORECASTS
10.1 Market Value Forecast
In 2013, the Japanese ice cream market is forecast to have a value of $2.9 billion, an increase of 1.2% since 2008.
The compound annual growth rate of the market in the period 2008-2013 is predicted to be 0.2%.
Table 13: Japan Ice Cream Market Value Forecast: $ billion, 2008-2013 Year $ billion Ja¥ billion % Growth 2008 2.8 333.5 0.00%2009 2.8 334.0 0.10%2010 2.8 334.7 0.20%2011 2.8 335.6 0.30%2012 2.9 336.5 0.30%2013 2.9 337.4 0.30% CAGR, 2008-2013: 0.2% Source: Datamonitor D A T A M O N I T O R
Figure 16: Japan Ice Cream Market Value Forecast: $ billion, 2008-2013
Source: Datamonitor D A T A M O N I T O R
2.81
2.82
2.83
2.84
2.85
2.86
2.87
2008 2009 2010 2011 2012 2013
$ bi
llion
0.00%
0.05%
0.10%
0.15%
0.20%
0.25%
0.30%
% G
rowth
$ billion % Growth

MARKET FORECASTS
Japan - Ice Cream
© Datamonitor (Published November 2008) Page 32
10.2 Market Volume Forecast
In 2013, the Japanese ice cream market is forecast to have a volume of 427.68 million liters, an increase of 0.1% since 2008.
The market is therefore expected to be stagnant in the period 2008-2013.
Table 14: Japan Ice Cream Market Volume Forecast: Liters million, 2008-2013
Year Liters million % Growth 2008 427.3 -0.20%2009 426.9 -0.10%2010 426.7 0.00%2011 426.8 0.00%2012 427.2 0.10%2013 427.6 0.10% CAGR, 2008-2013: 0.0% Source: Datamonitor D A T A M O N I T O R
Figure 17: Japan Ice Cream Market Volume Forecast: Liters million, 2008-2013
Source: Datamonitor D A T A M O N I T O R
426.2
426.4426.6
426.8
427.0427.2
427.4427.6
427.8
2008 2009 2010 2011 2012 2013
Lite
rs m
illio
n
-0.25%
-0.20%-0.15%
-0.10%-0.05%
0.00%
0.05%0.10%
0.15%
% G
rowth
Liters million % Growth

MACROECONOMIC INDICATORS
Japan - Ice Cream
© Datamonitor (Published November 2008) Page 33
CHAPTER 11 MACROECONOMIC INDICATORS
Table 15: Japan Size of Population (million) , 2004-2008 Year Population (million) % Growth 2004 127.52005 127.5 0.00%2006 127.5 0.00%2007 127.4 -0.10%2008(e) 127.3 -0.10% Source: Datamonitor D A T A M O N I T O R
Table 16: Japan GDP (Constant 2000 Prices, $ billion), 2004-2008
Year Constant 2000
Prices, $ billion % Growth 2004 4876.02005 4981.2 2.20%2006 5093.4 2.30%2007 5195.3 2.00%2008(e) 5262.8 1.30% Source: Datamonitor D A T A M O N I T O R
Table 17: Japan Inflation, 2004-2008 Year Inflation Rate (%) % Growth 2004 -0.12005 -0.32006 0.32007 0.1 -56.70%2008(e) 0.5 292.30% Source: Datamonitor D A T A M O N I T O R

MACROECONOMIC INDICATORS
Japan - Ice Cream
© Datamonitor (Published November 2008) Page 34
Table 18: Japan Exchange Rate, 2004-2008
Year Exchange Rate
($/Ja¥) 2004 0.009242005 0.009082006 0.00862007 0.008492008(e) 0.0095 Source: Datamonitor D A T A M O N I T O R
APPENDIX
Japan - Ice Cream
© Datamonitor (Published November 2008) Page 35
CHAPTER 12 APPENDIX
12.1 Methodology
Datamonitor Industry Profiles draw on extensive primary and secondary research, all aggregated, analyzed, cross-checked and presented in a consistent and accessible style.
Review of in-house databases – Created using 250,000+ industry interviews and consumer surveys and supported by analysis from industry experts using highly complex modeling & forecasting tools, Datamonitor’s in-house databases provide the foundation for all related industry profiles
Preparatory research – We also maintain extensive in-house databases of news, analyst commentary, company profiles and macroeconomic & demographic information, which enable our researchers to build an accurate market overview
Definitions – Market definitions are standardized to allow comparison from country to country. The parameters of each definition are carefully reviewed at the start of the research process to ensure they match the requirements of both the market and our clients
Extensive secondary research activities ensure we are always fully up-to-date with the latest industry events and trends
Datamonitor aggregates and analyzes a number of secondary information sources, including:
- National/Governmental statistics - International data (official international sources) - National and International trade associations - Broker and analyst reports - Company Annual Reports - Business information libraries and databases
Modeling & forecasting tools – Datamonitor has developed powerful tools that allow quantitative and qualitative data to be combined with related macroeconomic and demographic drivers to create market models and forecasts, which can then be refined according to specific competitive, regulatory and demand-related factors
Continuous quality control ensures that our processes and profiles remain focused, accurate and up-to-date

APPENDIX
Japan - Ice Cream
© Datamonitor (Published November 2008) Page 36
Industry Associations
Japan Dairy Council JA Bldg. 1-8-3 Ohtemachi, Chiyoda-Ku, Tokyo, 100-0004, Japan Tel: 81 3 3245 7621 Fax: 81 3 3242 2423 www.jdc.lin.go.jp
Japan Dairy Industry Association Nyugyo Kaikan bldg. 4F, 1-14-19 Kudan-Kita, Chiyoda-ku, Tokyo 102-0073, Japan Tel: 81 3 3261 9161 Fax: 81 3 3261 9175 www.jdia.or.jp
12.2 Related Datamonitor Research
Datamonitor Industry Profiles
Global Ice Cream
Ice Cream in Europe
Ice Cream in Asia-Pacific
Ice Cream in Germany
Ice Cream in France
Ice Cream in the United Kingdom
Ice Cream in the United States