ICC 115-6 E - International Coffee Organization · the US dollar and the national currencies of...
14
International Coffee Council 115 th Session 28 September ‒ 2 October 2015 Milan, Italy The impact of the price of oil and the US dollar exchange rate on coffee prices Background In accordance with Article 34 of the International Coffee Agreement 2007, the International Coffee Organization is required to provide Members with studies and reports on relevant aspects of the coffee sector. This document contains a study on ‘The impact of the price of oil and the US dollar exchange rate on coffee prices’. Action The Council is requested to take note of this document. ICC 115-6 26 August 2015 Original: English E
-
Upload
dangnguyet -
Category
Documents
-
view
217 -
download
0
Transcript of ICC 115-6 E - International Coffee Organization · the US dollar and the national currencies of...

International Coffee Council 115th Session 28 September ‒ 2 October 2015 Milan, Italy
The impact of the price of oil and the US dollar exchange rate on coffee prices
Background
In accordance with Article 34 of the International Coffee Agreement 2007, the International Coffee Organization is required to provide Members with studies and reports on relevant aspects of the coffee sector. This document contains a study on ‘The impact of the price of oil and the US dollar exchange rate on coffee prices’. Action The Council is requested to take note of this document.
ICC 115-6 26 August 2015 Original: English
E

THE IMPACT OF THE PRICE OF OIL AND THE US DOLLAR EXCHANGE RATE ON COFFEE PRICES
Introduction 1. As in the case of many other agricultural commodities, the coffee market is influenced by several factors, which can be categorised in hierarchical order. In the economic theory of general equilibrium, the pricing system is only a reflection of the balance of physical transactions. Essentially, supply and demand are the main factors which influence the price formation of coffee. At the same time, however, less fundamental factors come into play to superimpose themselves on the underlying fundamentals to influence coffee price determination and behaviour. Among these are climate problems (prolonged droughts or rainfall, frosts), price fluctuations of oil products, and variations in the US dollar exchange rate with other currencies. 2. The aim of this study is, on the one hand, to conduct a comparative analysis between the price of coffee and the price of oil products, and on the other hand, the relationship between coffee prices and the US dollar exchange rate in relation to the national currencies of selected coffee exporting countries. The purpose is to analyse the nature of the relationship between the price of coffee and oil products as well as the movement of the US dollar. The following main points will be covered: I. Changes in the prices of coffee and oil products II. Exchange rates and the price development of coffee III. Recent developments 3. The methodology of the study is based on the use of statistical tests in order to determine the relationship between average monthly prices of coffee and oil products, and also the relationship between coffee prices and the exchange rate between the US dollar and national currencies of the selected exporting countries. This analysis will cover the period from January 1990 to December 2014. This period corresponds to the era of free trade following the abandonment of the regulated quota market system that was in place the previous decades. The reference price of coffee will be the prices on the New York and London futures markets, specifically, the average of the second and third positions. Indeed, futures prices react very quickly to new information relating to physical prices. On the other hand, prices in physical markets react with delay, for transactions take time to become effective.

- 2 -
I. CHANGES IN THE PRICES OF COFFEE AND OIL PRODUCTS
I.1 Nature of the relationship between oil products and coffee growing 4. Oil plays an important role in modern agriculture. Along with fuel for transport and agricultural machinery, plastic materials, nitrogen fertilisers and pesticides require a high consumption of hydrocarbons. Fertilisers are effectively substances, which, through soil enrichment, provide the plants with nutritive food supplements, which boost their growth and productivity. The development of the oil industry has increased the use of fertilisers. Natural deposits of phosphate and potassium contribute equally to the development of fertilisers. A number of coffee exporting countries use fertilisers in order to improve productivity. Three main nutritive elements are used in coffee growing: nitrogen fertilisers, potassic fertilisers, and phosphate fertilisers. 5. The chemical industry has developed the production of nitrogen fertilisers through ammonia synthesis from the nitrogen in the air and the supply of hydrogen from natural gas. Natural gas represents more than 80% of the cost of the production of ammonia, the source of nitrogen fertiliser. Furthermore, as a result of the strong positive correlation between the price of fertilisers and oil products with a coefficient of 0.90, it is worth bearing in mind that if the price of these move, it has an impact on the price of coffee, particularly through the costs of fertilisers and transport. In other words, an increase in the price of oil products could cause a rise in the price of agricultural inputs, leading to a fall in their use due to their being too expensive for many farmers. In addition, a fall in the use of inputs could result in a fall of production, which could have an impact on the prices of these agricultural products.
I.2 Correlation between the price of crude oil and the price of coffee 6. The price index of crude oil is used as the reference price for oil products. Graphs 1 and 2 represent the development of the price index of crude oil and the average of the 2nd and 3rd positions on the New York futures market on the one hand and on the other, the average of the 2nd and 3rd positions on the London futures market. The two graphs illustrate the relationship between the price index of crude oil and the coffee futures prices of Arabica and Robusta. Visual observations of the graphs do not determine the nature of the relationships between the price of coffee and the price index of crude oil. In effect, with some exceptions, the movements of the two price series were generally reversed at the beginning of the 1990s. It is since the 2000s that we observe a certain similarity in the development of the price of coffee and the price index of crude oil.

- 3 - Graph 1: Crude oil price index and New York futures price (January 1990 – December 2014)
Graph 2: Crude oil price index and London futures price (January 1990 – December 2014)
7. Table 1 indicates the coefficients of the correlation between the prices of crude oil and coffee on the basis of monthly observations during the period of 1990 to 2014. We observe the relatively high correlation between the price index of crude oil and the price of
0
50
100
150
200
250
300
0
50
100
150
200
250
300
Crud
e oi
l ind
ex
New
Yor
k Fu
ture
s (U
S ce
nts/
lb)
New York Futures Crude oil
0
50
100
150
200
250
300
0
20
40
60
80
100
120
140
160
180
200
Crud
e oi
l ind
ex
Lond
on F
utur
es (U
S ce
nts/
lb)
London Futures Crude oil

- 4 - Arabica, for they vary between 0.55 and 0.59 both on the New York futures market but also for the three groups of physically traded Arabica coffee. On the other hand, the coefficients of correlation between the price index of crude oil and the price of Robusta are weak, in the order of 0.43. Even the price on the London futures market, which reflects the situation of Robusta, has a coefficient of correlation of 0.40 in relation to the price index of crude oil. These coefficients seem to indicate that the development in the price of crude oil has very little impact on the prices of Robusta coffee, contrary to the case of Arabica coffee. Table 1: Correlation coefficients between the price index of crude oil and coffee prices
Crude oil index
New York
London ICO Colombian Milds
Other Milds
Brazilian Naturals
Robustas
Crude oil index
1
New York futures price
0.59 1
London futures price
0.40 0.81 1
ICO Composite
0.60 0.98 0.87 1
Colombian Milds
0.58 0.97 0.75 0.97 1
Other Milds 0.59 0.99 0.78 0.98 0.99 1 Brazilian Naturals
0.55 0.99 0.82 0.98 0.96 0.98 1
Robustas 0.43 0.81 1.00 0.88 0.76 0.78 0.82 1
I.3 Analysis of the regression between the price index of crude oil and the price of coffee
8. It is necessary to analyse the extent to which the price of oil products is a good estimator of the price of coffee. The following equation will be considered as a simple linear regression: Y = aX + b Where, Y is the explained variable and represents the coffee market price; X is the explanatory variable and represents the price index of crude oil; "b" is a random or residual variable; "a" is the slope of the regression line, indicating the scale of the relationship between the price index of crude oil and the market prices.

- 5 - 9. Table 2 provides the results of the regression tests of the price index of crude oil and the New York and London futures market price, while Graphs 3 and 4 provide the regression lines. Table 2: Results of the regression tests between the consumer price of crude oil and the market prices
Crude oil index & New York futures price
Crude oil index & London futures price
Multiple R 0.59 0.39 R Square 0.35 0.16 a 0.45 0.18 b 80.63 50.32
Graph 3: Regression chart for crude oil price index and New York futures price (January 1990 – December 2014)
y = 0.4512x + 80.529R² = 0.3467
0
50
100
150
200
250
300
0 50 100 150 200 250 300
New
Yor
k Fu
ture
s (U
S ce
nts/
lb)
Crude oil index (Independent variable)
- 6 - Graph 4: Regression chart for crude oil price index and the London futures price (January 1990 – December 2014)
10. The correlation and regression tests during the period of January 1990 to December 2014 confirm the absence of a determining relationship between the price index of crude oil and the market prices. Nevertheless, it should be noted that contrary to Robusta, the prices of Arabica have relatively high correlation coefficients but the regression test provides a low determination coefficient (R2).
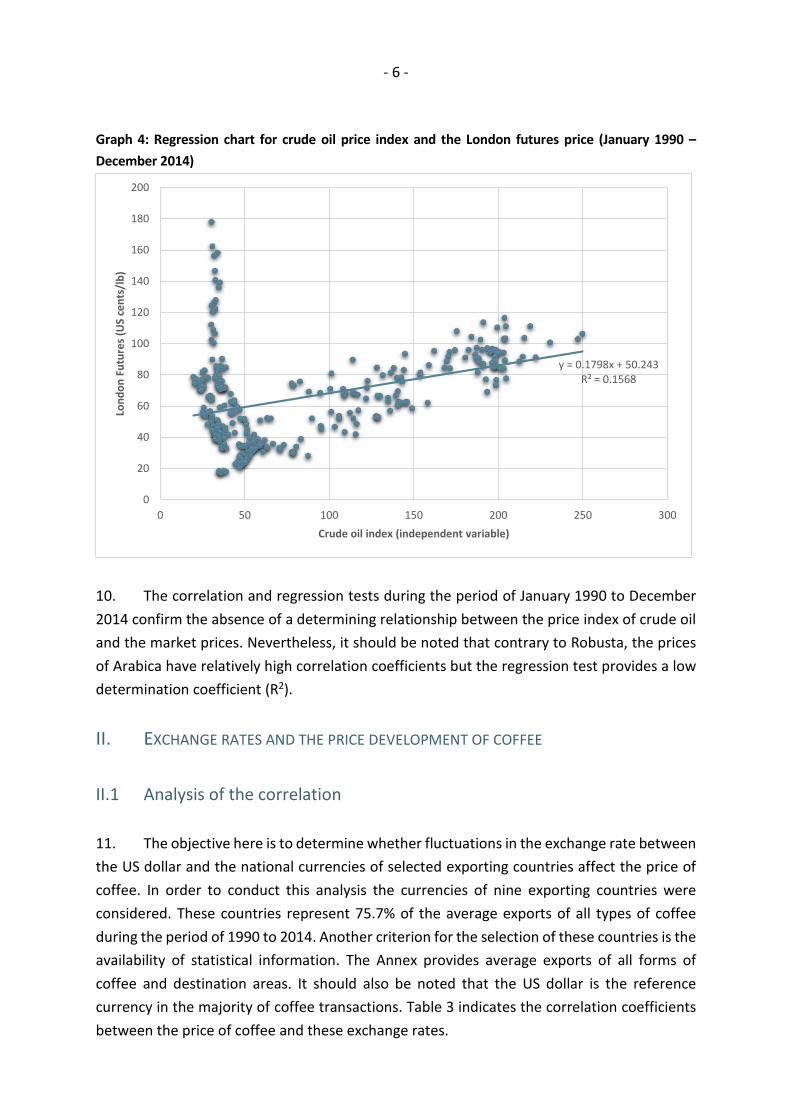
II. EXCHANGE RATES AND THE PRICE DEVELOPMENT OF COFFEE II.1 Analysis of the correlation 11. The objective here is to determine whether fluctuations in the exchange rate between the US dollar and the national currencies of selected exporting countries affect the price of coffee. In order to conduct this analysis the currencies of nine exporting countries were considered. These countries represent 75.7% of the average exports of all types of coffee during the period of 1990 to 2014. Another criterion for the selection of these countries is the availability of statistical information. The Annex provides average exports of all forms of coffee and destination areas. It should also be noted that the US dollar is the reference currency in the majority of coffee transactions. Table 3 indicates the correlation coefficients between the price of coffee and these exchange rates.
y = 0.1798x + 50.243R² = 0.1568
0
20
40
60
80
100
120
140
160
180
200
0 50 100 150 200 250 300
Lond
on F
utur
es (U
S ce
nts/
lb)
Crude oil index (independent variable)

- 7 - Table 3: Correlation coefficients between exchange rates between the US dollar and national currencies and coffee prices (January 1990 - December 2014)
New York Futures London Futures New York futures 1.00 London futures 0.81 1.00 BRL/US$ *(Brazilian real/US dollar) -0.49 -0.66 COP/US$ (Colombian peso/US dollar) -0.08 -0.28 ETB/US$ (Ethiopian birr/US dollar) 0.58 0.32 GTQ/US$ (Guatemalan quetzal/US dollar) 0.17 -0.05 INR/US$ (Indian rupee/US dollar) 0.26 0.09 IDR/US$ (Indonesian rupee/US dollar) 0.15 -0.05 MXN/US$**(Mexican peso/US dollar) 0.29 -0.03 UGX/US$ (Ugandan shilling/US dollar) 0.38 0.11 VND/US$ (Vietnamese dong/US dollar) 0.46 0.21
* Brazil: Exchange rate from July 1994 ** Mexico: Exchange rate from October 1992
12. We observe low coefficients of correlation on the exchange rates for the majority of currencies in relation to the US dollar. Nevertheless, four exporting countries seem to make a difference compared to others, for a few correlation coefficients of significance are noted. The correlation coefficients of the US dollar/Brazilian real exchange rate are -0.49 and -0.66 in relation to the New York and London markets respectively. The Ethiopian birr provides a positive coefficient of 0.58 with the New York futures market and 0.32 with London. To a lesser extent, the Vietnamese dong provides a coefficient of 0.46 with the prices of the New York futures market, while the Ugandan shilling provides a coefficient of 0.38 with the New York futures market. 13. The London futures market, which is sensitive to the situation of supply and demand of Robusta coffee, has a very weak relationship to the exchange rates of the currencies of the main countries that produce this variety. Only the Brazilian real has a strong relationship with the London futures market contract price. In other words, a strong US dollar against the Brazilian real coincides with a fall in the price of Robusta. III.2 Analysis of the regression 14. Table 4 presents the summary of the regression tests for the four countries whose exchange rates with the US dollar seemed to have relatively significant correlation coefficients with the price of coffee. The observation from the regression tests indicate that only the exchange rates of the Brazilian real in relation to the US dollar is related to the prices of the two futures markets (New York and London). Nevertheless, we note that only 23% of the price variations in the New York futures market is explained by the Brazilian real exchange rate, while the variations of the London market is explained by 43%. As for Ethiopia, only 33% of the New York market price variation is linked to the birr exchange rate.

- 8 - Table 4: Results of the regression tests (1990 – 2014)
BRL/US$ COL/US$ ETB/US$ New York
futures London futures
New York futures
London futures
New York futures
London futures
Multiple R 0.48 0.65 0.08 0.28 0.58 0.32 R Square 0.23 0.43 0.01 0.08 0.33 0.1 a -37.14 -30 -0.01 -0.01 6.6 2.21 b 200.1 129.2 129.80 86.00 60.6 45.8
GTQ/US$ INR/US$ IDR/US$ New York
futures London futures
New York futures
London futures
New York futures
London futures
Multiple R 0.16 0.06 0.25 0.08 0.15 0.05 R Square 0.03 0.00 0.07 0.01 0.02 0.00 a 7.04 -1.28 1.22 0.24 0.00 0.00 b 70.00 74.90 69.20 55.70 104.80 68.90
MXN/US$ UGS/US$ VND/US$ New York
futures London futures
New York futures
London futures
New York futures
London futures
Multiple R 0.28 0.04 0.37 0.11 0.45 0.20 R Square 0.08 0.00 0.14 0.01 0.21 0.04 a 7.86 -0.30 0.03 0.005 0.01 0.00 b 76.20 71.70 69.1 57.4 31.60 41.70
15. In total, based on the observations of the period from 1990 to 2014, it is not possible to establish a significant correlation between the price of coffee and the exchange rates of the currencies of the selected exporting countries in relation to the US dollar. With the exception of the Brazilian real, the correlation and regression tests have not clarified the dependence of coffee prices in relation to the movements of the exchange rates against the US dollar.
IV RECENT DEVELOPMENTS 16. The purpose here is to introduce a new element into the analysis of the relationship between the price of coffee and the variables related to the price of crude oil on the one hand and exchange rates on the other, taking into account the active nature of the single European currency, the euro. The euro entered into force in January 1999 and effectively became active in transactions from January 2002. It should be noted that the European Union is the destination of more that 50% of the average annual exports of all kinds of coffee from exporting countries. Furthermore, the relationship between the price of coffee and the two types of variables (the price index of crude oil and the exchange rates of exporting countries in relation to the US dollar) will be analysed for the period of January 2002 to December 2014.

- 9 -
IV.1 Relationship between the price of coffee and the price index of crude oil 17. The analysis of the observations from the period of January 2002 to December 2014 reveals significant correlation coefficients between the price of coffee and the price index of crude oil. Table 5: Correlation coefficients between the price index of crude oil and the price of coffee for the period of January 2002 to December 2014
Crude oil New York futures London futures Crude oil 1 New York futures 0.78 1 London futures 0.90 0.83 1 ICO Composite 0.83 0.99 0.88 Colombian Milds 0.74 0.96 0.79 Other Milds 0.77 0.99 0.82 Brazilian Naturals 0.79 1.00 0.84 Robustas 0.91 0.83 1.00
18. There are strong positive correlations between the price index of oil and the price of coffee with coefficients going from 0.74 to 0.91, indicating that the price of coffee and the price index of crude oil develop in the same direction.
IV.2 Analysis of the regression between the price index of crude oil and the price of coffee
19. The analysis of the regression confirms the firmness of the link between the price of coffee and the price index of crude oil for the period 2002 to 2014. Table 6: Results of the regression tests from 2002
Crude oil index & New York futures price
Crude oil index & London futures price
Multiple R 0.78 0.90 R Square 0.60 0.81 a 0.75 0.41 b 32.70 12.50
20. The regression tests provide strong coefficients of 0.60 for the New York futures market and 0.81 for London, indicating the extent to which the price of crude oil affects that of coffee.

- 10 -
IV.3 Relationship between the price of coffee and the exchange rates 21. The last part of the analysis will take into account the euro's status as reference currency in coffee transactions as well as the US dollar. Between 2002 and 2014 the average annual exports of all types of coffee from exporting countries to Europe were of the order of 51.1 million of bags, 47.6 million of which were to EU countries, compared to 21.7 million for North America. Table 7 provides the correlation coefficients between the price of coffee and the exchange rates Table 7: Correlation coefficients between the US dollar exchange rate in relation to national currencies and the price of coffee (January 2002 to December 2014)
New York futures London futures New York futures 1.00 London futures 0.83 1.00 Euro to US$ -0.60 -0.73 BRL/US$ *(Brazilian real/US dollar) -0.70 -0.76 COP/US$ (Colombian peso/US dollar) -0.75 -0.84 ETB/US$ (Ethiopian birr/US dollar) 0.76 0.67 GTQ/US$ (Guatemalan quetzal/US dollar) -0.09 -0.26 INR/US$ (Indian rupee/US dollar) 0.19 0.24 IDR/US$ (Indonesian rupee/US dollar) 0.11 0.25 MXN/US$**(Mexican peso/US dollar) 0.57 0.54 UGX/US$ (Ugandan shilling/US dollar) 0.65 0.55 VND/US$ (Vietnamese dong/US dollar) 0.76 0.71
22. There are many strong negative correlation coefficients between the price of coffee and the exchange rates of three currencies in relation to the US dollar. In particular, this concerns the euro, the Brazilian real, and the Colombian peso. In other words, a strong US dollar in relation to these currencies coincides with a fall in the price of coffee. On the other hand, the relationship is strongly positive in the case of the national currencies of Ethiopia, Mexico, Uganda, and Vietnam, indicating that the exchange rates in relation to the US dollar and the price of coffee develop in the same direction. However, the exchange rates of the currencies of other countries (Guatemala, India and Indonesia) with the US dollar do not maintain a significant relationship to the price of coffee. 23. In order to obtain a better appreciation of this relationship, the regression tests on the observations during the period January 2002 to December 2014 were conducted (Table 8).
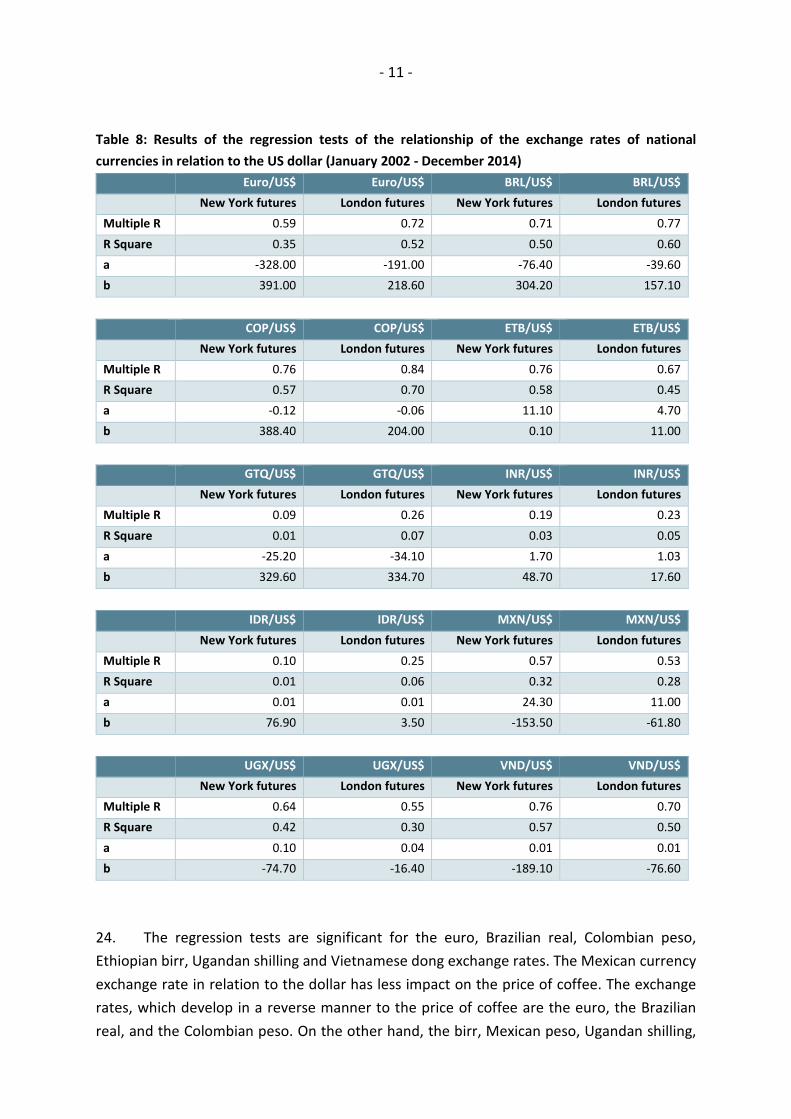
- 11 - Table 8: Results of the regression tests of the relationship of the exchange rates of national currencies in relation to the US dollar (January 2002 - December 2014)
Euro/US$ Euro/US$ BRL/US$ BRL/US$ New York futures London futures New York futures London futures
Multiple R 0.59 0.72 0.71 0.77 R Square 0.35 0.52 0.50 0.60 a -328.00 -191.00 -76.40 -39.60 b 391.00 218.60 304.20 157.10
COP/US$ COP/US$ ETB/US$ ETB/US$ New York futures London futures New York futures London futures
Multiple R 0.76 0.84 0.76 0.67 R Square 0.57 0.70 0.58 0.45 a -0.12 -0.06 11.10 4.70 b 388.40 204.00 0.10 11.00
GTQ/US$ GTQ/US$ INR/US$ INR/US$ New York futures London futures New York futures London futures
Multiple R 0.09 0.26 0.19 0.23 R Square 0.01 0.07 0.03 0.05 a -25.20 -34.10 1.70 1.03 b 329.60 334.70 48.70 17.60
IDR/US$ IDR/US$ MXN/US$ MXN/US$ New York futures London futures New York futures London futures
Multiple R 0.10 0.25 0.57 0.53 R Square 0.01 0.06 0.32 0.28 a 0.01 0.01 24.30 11.00 b 76.90 3.50 -153.50 -61.80
UGX/US$ UGX/US$ VND/US$ VND/US$ New York futures London futures New York futures London futures
Multiple R 0.64 0.55 0.76 0.70 R Square 0.42 0.30 0.57 0.50 a 0.10 0.04 0.01 0.01 b -74.70 -16.40 -189.10 -76.60
24. The regression tests are significant for the euro, Brazilian real, Colombian peso, Ethiopian birr, Ugandan shilling and Vietnamese dong exchange rates. The Mexican currency exchange rate in relation to the dollar has less impact on the price of coffee. The exchange rates, which develop in a reverse manner to the price of coffee are the euro, the Brazilian real, and the Colombian peso. On the other hand, the birr, Mexican peso, Ugandan shilling,

- 12 - and Vietnamese dong exchange rates develop in the same direction as the price of coffee. The determining coefficients show that the strongest relationships are provided by the Brazilian real, the Colombian peso, the Ethiopian birr, and the Vietnamese dong.
CONCLUSION 25. The relationship, which exist between the development of the price of coffee and the price index of crude oil, is less marked as a whole during the period of 1990 to 2014. On the other hand, it becomes significant from 2002. As regards the exchange rates of certain currencies in relation to the US dollar, the only significant relationship is between the world coffee price and the Brazilian real/US dollar exchange rate. However, recent developments since the introduction of the euro provide significant results. 26. The exchange rates of certain currencies of exporting countries, in particular the Brazilian real, have become good indicators of the price of coffee. This close relationship indicates that the exchange rates of these currencies in relation to the US dollar allow us to forecast the movement of exports in the near future. 27. Finally, these different tests have confirmed that in the majority of cases a strong dollar causes a fall in the price of coffee. Specifically, it should be noted that a fall in the value of the dollar against the euro results in an increase in the price of coffee and vice-versa.

ANNEX
AVERAGE EXPORTS BY COUNTRY OF ORIGIN AND DESTINATION PER REGION AVERAGE 1990 TO 2014
(Unit of weight: 60kg bags of GBE) Country of destination Total exports Africa Asia & Oceania Incl. China Central America & Mexico Europe European Union North America South America Other destinations
Total exports by all countries 89 085 814 2 820 117 13 059 716 305 017 638 862 48 840 323 45 534 487 20 282 915 1 524 791 1 919 090
Brazil 24 227 248 257 466 3 544 501 27 806 256 125 14 171 733 12 893 631 5 146 551 825 977 24 896 Vietnam 11 239 026 446 825 2 272 303 188 905 131 898 6 359 183 6 078 820 1 648 620 187 411 192 785 Colombia 10 651 937 13 916 1 540 400 13 801 25 658 5 199 654 4 938 169 3 774 775 86 185 11 349 Indonesia 5 959 479 561 939 1 958 659 49 630 9 248 2 338 294 2 181 425 773 257 33 726 284 358 Guatemala 3 658 589 13 124 475 750 2 814 15 376 1 256 579 1 170 008 1 879 076 10 559 8 125 India 3 425 186 125 895 517 391 3 817 261 2 607 861 1 967 211 173 234 209 335 Mexico 3 227 938 1 527 161 951 1 477 42 462 528 749 451 490 2 420 480 19 572 53 197 Uganda 2 928 279 272 953 80 136 2 214 90 2 448 682 2 349 199 105 819 5 682 14 918 Ethiopia 2 084 834 40 318 688 461 2 454 714 1 164 504 1 142 360 190 773 65 0 9 Selected countries 67 402 516 1 733 964 11 239 551 292 918 481 830 36 075 238 33 172 313 16 112 585 1 169 385 589 963 Other exporting countries 21 683 299 1 086 153 1 820 165 12 099 157 032 12 765 085 12 362 174 4 170 330 355 406 1 329 127 All exp countries 100.0% 100.0% 100.0% 100.0% 100.0% 100.0% 100.0% 100.0% 100.0% 100.0%
Country of destination Total exports Africa Asia & Oceania Incl. China Central America & Mexico Europe European Union North America South America Other destinations
All countries 100.0% 3.2% 14.7% 0.3% 0.7% 54.8% 51.1% 22.8% 1.7% 2.2% Brazil 27.2% 9.1% 27.1% 9.1% 40.1% 29.0% 28.3% 25.4% 54.2% 1.3% Vietnam 12.6% 15.8% 17.4% 61.9% 20.6% 13.0% 13.3% 8.1% 12.3% 10.0% Colombia 12.0% 0.5% 11.8% 4.5% 4.0% 10.6% 10.8% 18.6% 5.7% 0.6% Indonesia 6.7% 19.9% 15.0% 16.3% 1.4% 4.8% 4.8% 3.8% 2.2% 14.8% Guatemala 4.1% 0.5% 3.6% 0.9% 2.4% 2.6% 2.6% 9.3% 0.7% 0.4% India 3.8% 4.5% 4.0% 1.3% 0.0% 5.3% 4.3% 0.9% 0.0% 0.0% Mexico 3.6% 0.1% 1.2% 0.5% 6.6% 1.1% 1.0% 11.9% 1.3% 2.8% Uganda 3.3% 9.7% 0.6% 0.7% 0.0% 5.0% 5.2% 0.5% 0.4% 0.8% Ethiopia 2.3% 1.4% 5.3% 0.8% 0.1% 2.4% 2.5% 0.9% 0.0% 0.0% 9 Selected countries 75.7% 61.5% 86.1% 96.0% 75.4% 73.9% 72.9% 79.4% 76.7% 30.7% Non-Selected countries 24.3% 38.5% 13.9% 4.0% 24.6% 26.1% 27.1% 20.6% 23.3% 69.3% All exp countries 100.0% 100.0% 100.0% 100.0% 100.0% 100.0% 100.0% 100.0% 100.0% 100.0%