Ibuprofen treatment modifies cortical sources of EEG ... · Ibuprofen treatment modifies cortical...
10
Ibuprofen treatment modifies cortical sources of EEG rhythms in mild Alzheimer’s disease Claudio Babiloni a,b, * , Giovanni B. Frisoni c , Claudio Del Percio c , Orazio Zanetti c , Cristina Bonomini c , Emanuele Cassetta d , Patrizio Pasqualetti b,d , Carlo Miniussi c,e , Mario De Rosas a , Anna Valenzano a , Giuseppe Cibelli a , Fabrizio Eusebi f,g , Paolo M. Rossini b,d,h a Department of Biomedical Sciences, University of Foggia, Viale Pinto 7, Foggia I-71100, Italy b Casa di Cura San Raffaele Cassino, Via G. Di Biasio 1, Cassino (FR), Italy c IRCCS Fatebenefratelli ‘‘San Giovanni di Dio”, Brescia, Italy d Associazione Fatebenefratelli per la ricerca (AFaR), Hospital S. Giovanni Calibita, Rome, Italy e Department of Neuroscience, University of Brescia, Brescia, Italy f Dipartimento di Fisiologia e Farmacologia, Università ‘‘Sapienza”, Roma, Italy g IRCCS Neuromed, Via Atinense 18, Pozzilli (Isernia), Italy h Clinica Neurologica, Campus Biomedico University, Rome, Italy article info Article history: Accepted 3 February 2009 Keywords: Mild Alzheimer’s disease (mild AD) Ibuprofen Electroencephalography (EEG) Low-resolution brain electromagnetic tomography (LORETA) abstract Objective: Non-steroidal anti-inflammatory drugs such as ibuprofen have a protective role on risk of Alz- heimer’s disease (AD). Here we evaluated the hypothesis that long-term ibuprofen treatment affects cor- tical sources of resting electroencephalographic (EEG) rhythms in mild AD patients. Methods: Twenty-three AD patients (13 treated AD IBUPROFEN; 10 untreated AD PLACEBO) were enrolled. Resting EEG data were recorded before and 1 year after the ibuprofen/placebo treatment. EEG rhythms were delta (2–4 Hz), theta (4–8 Hz), alpha 1 (8–10.5 Hz), alpha 2 (10.5–13 Hz), beta 1 (13– 20 Hz), and beta 2 (20–30 Hz). LORETA was used for EEG source analysis. Results: In the AD PLACEBO group, amplitude of delta sources was globally greater at follow-up than baseline. Instead, amplitude of delta sources remained stable or decreased in the majority of the AD IBU- PROFEN patients. Clinical (CDR) but not global cognitive status (MMSE) reflected EEG results. Conclusions: These results suggest that in mild AD patients, a long-term ibuprofen treatment slightly slows down the progressive increment of delta rhythms as a sign of contrast against the neurodegener- ative processes. Significance: They motivate future investigations with larger population and extended neuropsychologi- cal testing, to study the relationships among ibuprofen treatment, delta cortical sources, and higher order functions. Ó 2009 International Federation of Clinical Neurophysiology. Published by Elsevier Ireland Ltd. All rights reserved. 1. Introduction Quantitative analysis of electroencephalographic (EEG) rhythms in awakening subjects at rest (eyes closed) is a low-cost, easy to perform, and widely available neurophysiological approach to the study of Alzheimer disease (AD; Maurer and Dierks, 1992; Szelies et al., 1992; Leuchter et al., 1993; Schreiter-Gasser et al., 1993; see Rossini et al., 2007 for a review). When compared to normal el- derly subjects (Nold), AD patients were characterized by excessive delta (0–4 Hz) and theta (4–7 Hz) rhythms, and a significant decre- ment of posterior alpha rhythms (8–12 Hz; Dierks et al., 1993, 2000; Huang et al., 2000; Ponomareva et al., 2003; Jeong, 2004; Babiloni et al., 2004 Babiloni et al., 2006a,b,c,d,e,f, Babiloni et al., 2007a,b,c, 2008). These EEG abnormalities were associated with al- tered regional cerebral blood flow (rCBF)/metabolism and with neuropsychological battery, including those for global cognitive function as evaluated by mini mental state examination (MMSE; Sloan et al., 1995; Rodriguez et al., 1998, 1999; Jeong, 2004). Resting EEG rhythms in AD patients are sensitive to the effects of symptomatic pharmacological treatment with acetylcholines- terase inhibitors (AChEI). In particular, short-term AChEI treatment has induced decrement of theta power (Brassen and Adler, 2003), increment of alpha power (Onofrj et al., 2003) as well as decrement of alpha and delta power (0–3 Hz) (Reeves et al., 2002). Instead, long-term AChEI treatment has induced decrement of theta power 1388-2457/$36.00 Ó 2009 International Federation of Clinical Neurophysiology. Published by Elsevier Ireland Ltd. All rights reserved. doi:10.1016/j.clinph.2009.02.005 * Corresponding author. Address: Department of Biomedical Sciences, University of Foggia, Viale Pinto 7, Foggia I-71100, Italy. Tel.: +39 0881 713276; fax: +39 0881 711716. E-mail address: [email protected] (C. Babiloni). Clinical Neurophysiology 120 (2009) 709–718 Contents lists available at ScienceDirect Clinical Neurophysiology journal homepage: www.elsevier.com/locate/clinph
Transcript of Ibuprofen treatment modifies cortical sources of EEG ... · Ibuprofen treatment modifies cortical...
Clinical Neurophysiology 120 (2009) 709–718
Contents lists available at ScienceDirect
Clinical Neurophysiology
journal homepage: www.elsevier .com/locate /c l inph
Ibuprofen treatment modifies cortical sources of EEG rhythmsin mild Alzheimer’s disease
Claudio Babiloni a,b,*, Giovanni B. Frisoni c, Claudio Del Percio c, Orazio Zanetti c, Cristina Bonomini c,Emanuele Cassetta d, Patrizio Pasqualetti b,d, Carlo Miniussi c,e, Mario De Rosas a, Anna Valenzano a,Giuseppe Cibelli a, Fabrizio Eusebi f,g, Paolo M. Rossini b,d,h
a Department of Biomedical Sciences, University of Foggia, Viale Pinto 7, Foggia I-71100, Italyb Casa di Cura San Raffaele Cassino, Via G. Di Biasio 1, Cassino (FR), Italyc IRCCS Fatebenefratelli ‘‘San Giovanni di Dio”, Brescia, Italyd Associazione Fatebenefratelli per la ricerca (AFaR), Hospital S. Giovanni Calibita, Rome, Italye Department of Neuroscience, University of Brescia, Brescia, Italyf Dipartimento di Fisiologia e Farmacologia, Università ‘‘Sapienza”, Roma, Italyg IRCCS Neuromed, Via Atinense 18, Pozzilli (Isernia), Italyh Clinica Neurologica, Campus Biomedico University, Rome, Italy
a r t i c l e i n f o a b s t r a c t
Article history:Accepted 3 February 2009
Keywords:Mild Alzheimer’s disease (mild AD)IbuprofenElectroencephalography (EEG)Low-resolution brain electromagnetictomography (LORETA)
1388-2457/$36.00 � 2009 International Federation odoi:10.1016/j.clinph.2009.02.005
* Corresponding author. Address: Department of Biof Foggia, Viale Pinto 7, Foggia I-71100, Italy. Tel.: +39711716.
E-mail address: [email protected] (C. Babiloni).
Objective: Non-steroidal anti-inflammatory drugs such as ibuprofen have a protective role on risk of Alz-heimer’s disease (AD). Here we evaluated the hypothesis that long-term ibuprofen treatment affects cor-tical sources of resting electroencephalographic (EEG) rhythms in mild AD patients.Methods: Twenty-three AD patients (13 treated AD IBUPROFEN; 10 untreated AD PLACEBO) wereenrolled. Resting EEG data were recorded before and 1 year after the ibuprofen/placebo treatment. EEGrhythms were delta (2–4 Hz), theta (4–8 Hz), alpha 1 (8–10.5 Hz), alpha 2 (10.5–13 Hz), beta 1 (13–20 Hz), and beta 2 (20–30 Hz). LORETA was used for EEG source analysis.Results: In the AD PLACEBO group, amplitude of delta sources was globally greater at follow-up thanbaseline. Instead, amplitude of delta sources remained stable or decreased in the majority of the AD IBU-PROFEN patients. Clinical (CDR) but not global cognitive status (MMSE) reflected EEG results.Conclusions: These results suggest that in mild AD patients, a long-term ibuprofen treatment slightlyslows down the progressive increment of delta rhythms as a sign of contrast against the neurodegener-ative processes.Significance: They motivate future investigations with larger population and extended neuropsychologi-cal testing, to study the relationships among ibuprofen treatment, delta cortical sources, and higher orderfunctions.� 2009 International Federation of Clinical Neurophysiology. Published by Elsevier Ireland Ltd. All rights
reserved.
1. Introduction
Quantitative analysis of electroencephalographic (EEG) rhythmsin awakening subjects at rest (eyes closed) is a low-cost, easy toperform, and widely available neurophysiological approach to thestudy of Alzheimer disease (AD; Maurer and Dierks, 1992; Szelieset al., 1992; Leuchter et al., 1993; Schreiter-Gasser et al., 1993;see Rossini et al., 2007 for a review). When compared to normal el-derly subjects (Nold), AD patients were characterized by excessivedelta (0–4 Hz) and theta (4–7 Hz) rhythms, and a significant decre-
f Clinical Neurophysiology. Publish
omedical Sciences, University0881 713276; fax: +39 0881
ment of posterior alpha rhythms (8–12 Hz; Dierks et al., 1993,2000; Huang et al., 2000; Ponomareva et al., 2003; Jeong, 2004;Babiloni et al., 2004 Babiloni et al., 2006a,b,c,d,e,f, Babiloni et al.,2007a,b,c, 2008). These EEG abnormalities were associated with al-tered regional cerebral blood flow (rCBF)/metabolism and withneuropsychological battery, including those for global cognitivefunction as evaluated by mini mental state examination (MMSE;Sloan et al., 1995; Rodriguez et al., 1998, 1999; Jeong, 2004).
Resting EEG rhythms in AD patients are sensitive to the effectsof symptomatic pharmacological treatment with acetylcholines-terase inhibitors (AChEI). In particular, short-term AChEI treatmenthas induced decrement of theta power (Brassen and Adler, 2003),increment of alpha power (Onofrj et al., 2003) as well as decrementof alpha and delta power (0–3 Hz) (Reeves et al., 2002). Instead,long-term AChEI treatment has induced decrement of theta power
ed by Elsevier Ireland Ltd. All rights reserved.
710 C. Babiloni et al. / Clinical Neurophysiology 120 (2009) 709–718
(Kogan et al., 2001) and increment of alpha/theta power ratio,especially in frontal regions (Rodriguez et al., 2002). Finally, powerof posterior alpha sources has been found to be modulated by long-term cholinergic therapy (Donepezil) in AD subjects (Babiloni et al.,2006f). Those results confirmed the implication of cholinergic sys-tems in the neurodegenerative processes at the basis of AD.
The above findings suggest that resting EEG rhythms might beused as markers of disease progression and surrogate outcome inclinical trials. We have tested this hypothesis in a 1-year random-ized clinical trial of ibuprofen, an NSAID with antiamyloidogenicactivity. The rationale for the trial lies in AD neurodegenerativeprocesses being affected by chronic inflammatory response in thebrain tissue as demonstrated by the presence of activated microg-lia, proinflammatory mediators, and complement factors aroundsenile plaques (Neuroinflammation Working Group 2000, Akiyamaet al., 2000). This hypothesis is corroborated by several epidemio-logical investigations suggesting a protective role of non-steroidalanti-inflammatory drugs (NSAIDs) such as ibuprofen on the risk ofdeveloping AD (Andersen et al., 1995; Anthony et al., 2000; Broeet al., 2000; Stewart et al., 1997; In ’t Veld et al., 1998; Zandiet al., 2002). Even if the consensus has not been universal (Hender-son et al., 1997; Beard et al., 1989; In ’t Veld et al., 1998) because ofgreat differences in study design, the bulk of evidence seems to bein favor of a protective role of NSAIDs on AD risk, with a greaterrisk reduction with longer use of the anti-inflammatory com-pounds prior to the onset of AD symptoms (Zandi et al., 2002).The mechanism by which NSAIDs might operate in reducing ADrisk is unclear. A small number of NSAIDs, among which are ibu-profen, sulindac sulfite and indomethacin, have been found to ex-ert an antiamyloidogenic activity in vivo and in vitro, a mechanismat least in part independent of COX inhibition (Lim et al., 2000;Weggen et al., 2001). However, clinical trials trying to show a ben-eficial effect of NSAIDs on AD patients have been instead disap-pointing. Two small pilot trials have shown promising resultswith indomethacin (Rogers et al., 1993) and diclofenac (Scharfet al., 1999), but subsequent trials focusing on the attempt to re-duce AD progression have failed to show any benefit (Aisen et al.,2003; Reines et al., 2004; Soininen et al., 2007).
The aim of the present study – as a part of a clinical trial on awider population (Zanetti et al., 2006) – was to evaluate thehypothesis that long-term treatment with ibuprofen affects corti-cal sources of resting EEG rhythms in mild AD patients, as a neuro-physiological reflection of the therapy. A special attention wasdevoted to the effect of the therapy on the cortical sources of deltarhythms, which are supposed to enhance in magnitude as a func-tion of the functionality of cholinergic basal forebrain neurons pro-jecting to hippocampus and fronto-parietal connections (Ebert andKirch, 1998; Babiloni et al., 2006f). The working hypothesis is thatanti-inflammatory effects of ibuprofen slow down both neurode-generation and enhancement of delta sources. Resting EEG datawere recorded in mild AD patients before and 1 year after ibupro-fen or placebo treatment. Cortical sources of EEG rhythms werestudied with the technique called low-resolution brain electro-magnetic tomography (LORETA; Pascual-Marqui and Michel,1994), successfully used in recent EEG studies on physiologicaland pathological brain aging (Babiloni et al., 2004, 2006a,b,c,d,e,f,2007a,b,c, 2008; for a review see, Rossini et al., 2007).
2. Methods
2.1. Subjects and diagnostic criteria
The present EEG study derived from an ancillary physiologicalbranch of a multicentre clinical trial granted by Italian PublicHealth Ministry (Zanetti et al., 2006). Financial resources for suchan ancillary branch just allowed the EEG experiments in 23 mild
AD patients, who were blindly divided to the AD IBUPROFEN group(N = 13) and untreated AD PLACEBO group (N = 10). Furthermore,24 cognitively normal Nold subjects were recruited to form a con-trol group. All experiments were performed with the informed andovert consent of each participant or caregiver, in line with the Codeof Ethics of the World Medical Association (Declaration of Helsinki)and the standards established by the Author’s Institutional ReviewBoard.
Probable AD was diagnosed according to NINCDS-ADRDA(McKhann et al., 1984). Patients underwent general medical, neu-rological and psychiatric assessments and were also rated with anumber of standardized diagnostic and severity instruments thatincluded mini mental state evaluation (MMSE; Folstein et al.,1975), Alzheimer Disease Assessment Scale-cognitive (ADAS-cogItalian version, Fioravanti et al., 1994), Clinical Dementia RatingScale (CDR; Hughes et al., 1982), Clinical Dementia Rating sum ofbox score (CDR Sum-of-Boxes, Berg et al., 1988), Geriatric Depres-sion Scale (GDS; Yesavage et al., 1982), Instrumental Activities ofDaily Living scale (IADL; Lawton and Brodie, 1969), Basic Activitiesof Daily Living scale (BADL; Katz, 1983), Neuropsychiatry Inventory(NPI; Cummings et al., 1994), Beck Depression Inventory (BDI, Katz,1998), and State Trait Anxiety Inventory (STAI Y-1, STAI Y-2; Speil-berger, 1983).
Neuroimaging diagnostic procedures (CT or MRI) and completelaboratory analyses were carried out to exclude other causes ofprogressive or reversible dementias, in order to have a homoge-nous AD patient sample. The exclusion criteria included, in partic-ular, any evidence of (i) frontotemporal dementia diagnosedaccording to criteria of Lund and Manchester Groups (1994); (ii)vascular dementia as diagnosed according to NINDS-AIREN criteria(Román et al., 1993); (iii) extra-pyramidal syndromes; (iv) Parkin-son disease; (v) reversible causes of dementias; and (vi) Lewy bodydementia according to the criteria by McKeith and colleagues(1999). The detection of the vascular component in dementiawas accounted based on previous theoretical guidelines from ournetwork (Frisoni et al., 1995; Galluzzi et al., 2005). AD patientswere also excluded from the study if any of the following werepresent: allergy to non-steroidal anti-inflammatory drugs (NSA-IDs); active gastritis or peptic ulcerative disease; renal and hepaticinsufficiency; active inflammatory, infectious or neoplastic dis-eases; active COPD; CHF; history of or current alcohol abuse; pre-vious chronic or prolonged use of NSAIDs and corticosteroids;active treatment with anticoagulants, corticosteroids, and COX2inhibitors. Vitamin E, low-dose aspirin (325 mg/day) and the occa-sional use of NSAIDs were permitted during the study, though allactual usage was recorded. In addition, patients taking stable dosesof SSRI antidepressants, benzodiazepines, and neuroleptics wereallowed into the study. To avoid the potentially confounding ef-fects of anticholinesterase medications on the outcomes, all AD pa-tients received a regular dose of Donepezil (Aricept or Memac5–10 mg) for at least 3 months; other types of AChEI were not al-lowed. Furthermore, about 20% of the AD patients of both AD PLA-CEBO and AD IBUPROFEN groups took regular doses of SSRIantidepressants, benzodiazepines, and neuroleptics. Of note,Donepezil, benzodiazepines, antidepressant and/or neurolepticswere suspended for about 24 h before EEG recordings. This didnot insure a complete washout of the drug, but made it comparablethe drug status across the patients. Washed out of the drugs wouldhave required a too long suspension of the drugs with high risks forthe patients.
Duration of the ibuprofen or placebo (400 mg twice-daily)administration was 52 weeks (1 year). Once-daily 20 mg eso-meprazol (or placebo for the placebo arm) was concurrentlyadministered for GI protection. Tablets of the active drug and theplacebo were undistinguishable. Similarly, the gastroprotectiveagent and the relative placebo were also undistinguishable. Active

Table 2Demographic and neuropsychological data of interest of the mild AD subjects,subdivided in AD IBUPROFEN (AD patients treated with ibuprofen) and AD PLACEBO(AD patients treated with placebo). Legend: MMSE, mini mental state evaluation;ADAS-cog, Alzheimer Disease Assessment Scale-cognitive; CDR, Clinical DementiaRating Scale; CDR Sum-of-Boxes, Clinical Dementia Rating sum of box score; GDS,Geriatric Depression Scale; IADL, Instrumental Activities of Daily Living scale; BADL,Basic Activities of Daily Living scale; NPI, Neuropsychiatry Inventory; BDI, BeckDepression Inventory; STAI Y1 and Y2, State Trait Anxiety Inventory Form Y1 andForm Y2.
AD Ibuprofen AD Placebo ANOVA
N 13 10Age (years) 75.7 (±2SE) 75.4 (±1.8SE) p > 0.9Education (years) 6 (±1.1SE) 5.3 (±0.7SE) p > 0.6Gender (M/F) 4/9 1/9 p > 0.2MMSE 20.9 (±0.8SE) 23 (±0.8SE) p > 0.6CDR 0.8 (±0.1SE) 0.7 (±0.1 SE) p > 0.1CDR Sum-of-Boxes 5 (±0.7SE) 3.6 (±0.5SE) p > 0.2GDS 8.3 (±1.5SE) 8.8 (±2SE) p > 0.8IADL 3.7 (±0.6SE) 5.5 (±0.7SE) p > 0.05BADL 5.7 (±0.2SE) 5.8 (±0.2SE) p > 0.9ADAS-cog 27.8 (±2.5SE) 21.5 (±2SE) p > 0.1NPI 9.5 (±2SE) 6.9 (±1.6SE) p > 0.4BDI 7.9 (±1.4SE) 6.8 (±1.4SE) p > 0.4STAI Y1 39.8 (±2.1SE) 41.3 (±1.4SE) p > 0.6STAI Y2 40.2 (±2.7SE) 37.1 (±2.3SE) p > 0.4
C. Babiloni et al. / Clinical Neurophysiology 120 (2009) 709–718 711
drug tablets and relative placebos were supplied by Angelini SpAfor Ibuprofen, and by Astra-Zeneca Pharmaceuticals for esomep-razole. Each participant received two boxes of study medicationin a blister package and two bottles of gastroprotective agent (orplacebo) with coded labels at baseline, and at 3-, 6-, 9-month visits,with sufficient medication to cover the 3-month period betweenfollow-ups. At each visit the number of returned tablets was re-corded for compliance assessment.
The Nold subjects were recruited mostly among non-consan-guineous patients’ relatives. All Nold subjects underwent physicaland neurological examinations as well as cognitive screening. Sub-jects affected by chronic systemic illnesses, subjects receiving psy-choactive drugs, and subjects with a history of present or previousneurological or psychiatric disease were excluded. All Nold sub-jects had a GDS score lower than 14 (no depression).
Table 1 summarizes demographic and clinical data of the recruitedNold and mild AD subjects. Four ANOVAs using the factor Group (Nold,AD) were computed to evaluate the presence or absence of statisticallysignificant differences between the Nold and AD subjects for age, edu-cation, gender, and MMSE. No statistically significant difference forage, education, and gender were found (p > 0.3). As expected, the AN-OVA for the MMSE score showed a statistically significant difference(F(1,45) = 117; p < 0.0001), indicating that the MMSE values werehigher in the Nold compared to the AD group.
Table 2 reports baseline demographic and clinical data of themild AD patients, subdivided in the AD IBUPROFEN and AD PLA-CEBO groups. Twelve ANOVAs using the factor Group (AD IBUPRO-FEN and AD PLACEBO) were computed to evaluate the presence orabsence of statistically significant differences between the AD IBU-PROFEN and AD PLACEBO groups for age, education, gender, MMSE,CDR, CDR Sum-of-Boxes, GDS, IADL, BADL, NPI, BDI, STAI Y1, STAIY2 . No statistically significant difference was found (p > 0.05). Ofnote, age, gender, and education were used as covariates in the sta-tistical evaluation of cortical sources of EEG rhythms, to removepossible slight confounding effects.
2.2. EEG recordings
EEG data were recorded by specialized clinical units in the Noldand mild AD subjects at resting state (eyes-closed). The EEGrecordings were performed (0.3–70 Hz bandpass) from 19 elec-trodes positioned according to the International 10–20 System(i.e. Fp1, Fp2, F7, F3, Fz, F4, F8, T3, C3, Cz, C4, T4, T5, P3, Pz, P4,T6, O1, and O2). A specific reference electrode was not imposedto the recording clinical units of this study, since preliminary datainspection and LORETA source analysis were carried out after EEGdata were re-referenced to a common average reference. To mon-itor eye movements, the horizontal and vertical electrooculogram(0.3–70 Hz bandpass) was also collected. All data were digitizedin continuous recording mode (5 min of EEG; 256 Hz samplingrate). It is noteworthy that the EEG data were recorded before(Recording I) and about after 1 year (Recording II) of ibuprofen orplacebo treatment in the mild AD patients. The EEG recordingswere performed in the late morning. In order to keep constantthe level of vigilance, an experimenter controlled online the sub-
Table 1Demographic and neuropsychological data of interest of the normal elderly controls(Nold) and mild Alzheimer’s disease (AD) subjects.
Nold AD
N 24 23Age (years) 74 (±1.4SE) 75.6 (±1.4SE)Education (years) 6.7 (±0.6SE) 5.7 (±0.7SE)MMSE 28.6 (±0.2SE) 21.8 (±0.6SE)Gender (M/F) 7/17 5/18
ject and the EEG traces. He verbally alerted the subject any timethere were signs of behavioral and/or EEG drowsiness.
The recorded EEG data were analyzed and fragmented offline inconsecutive epochs of 2 s. The EEG epochs with ocular, muscular,and other types of artifact were preliminary identified by a com-puterized automatic procedure. The EEG epochs with sporadicblinking artifacts (less than 10% of the total) were corrected byan autoregressive method (Moretti et al., 2003). Two independentexperimenters blind to the diagnosis manually confirmed the EEGsegments accepted for further analysis. Of note, a special attentionwas devoted to avoid the inclusion of EEG segments and individualdata sets with EEG signs of drowsiness or pre-sleep stages. Further-more, the experimenters were blind to the diagnosis of the subjectsat the moment of the preliminary EEG data analysis.
2.3. Spectral analysis of the EEG data
A digital FFT-based power spectrum analysis (Welch technique,Hanning windowing function, no phase shift) computed powerdensity of the EEG rhythms with 0.5 Hz frequency resolution. Thefollowing standard band frequencies were studied: delta (2–4 Hz), theta (4–8 Hz), alpha 1 (8–10.5 Hz), alpha 2 (10.5–13 Hz),beta 1 (13–20 Hz), and beta 2 (20–30 Hz). These band frequencieswere chosen averaging those used in previous relevant EEG studieson dementia (Besthorn et al., 1997; Chiaramonti et al., 1997; Jelicet al., 1996; Leuchter et al., 1993; Rodriguez et al., 1999; Babiloniet al., 2004, Babiloni et al., 2006a,b,c,d,e, Babiloni et al., 2006f,2007a,a,b). Sharing of a frequency bin by two contiguous bandsis a widely accepted procedure (Besthorn et al., 1997, Cook andLeuchter, 1996, Holschneider et al., 1999, Jelic et al., 1996, Kolevet al., 2002, Leuchter et al., 1993, Nobili et al., 1998, Pucci et al.,1997). Furthermore, this fits the theoretical consideration that nearEEG rhythms may overlap at their frequency borders (Babiloniet al., 2004, 2006a,b,c,d,e,f, 2007a,b,c, 2008; Klimesch, 1996,1999, Klimesch et al., 1997, 1998).
Choice of the fixed EEG bands did not account for individual al-pha frequency (IAF) peak, defined as the frequency associated withthe strongest EEG power at the extended alpha range (Klimesch,1999). However, this should not affect the results, since most ofthe subjects had IAF peaks within the alpha 1 band (8–10.5 Hz).In particular, mean IAF peak at Recording I was 9.2 Hz (±0.1 stan-

712 C. Babiloni et al. / Clinical Neurophysiology 120 (2009) 709–718
dard error, SE) in the Nold subjects, 9 Hz (±0.4SE) in the AD IBU-PROFEN subjects, and 9.4 Hz (±0.3SE) in the AD PLACEBO subjects.Moreover, mean IAF peak at Recording II was 8.7 Hz (±0.4SE) in theAD IBUPROFEN subjects and 8.9 Hz (±0.4SE) in the AD PLACEBOsubjects. To control for the effect of IAF on the EEG comparisons,the IAF peak was used as a covariate (together with age, educationand gender) for further statistics.
Finally, the analysis of the delta band was restricted to 2–4 Hzfor homogeneity with previously quoted field literature (Babiloniet al., 2004, 2006a,b,c,d,e,f, 2007a,b,c, 2008) and to avoid the resid-ual effects of uncontrolled head movements – provoking artifactsin the lower delta band – especially in the mild AD subjects.
2.4. Cortical source analysis of the EEG rhythms by LORETA
Low-resolution electromagnetic source tomography (LORETA)was used for the EEG source analysis as provided at http://www.u-nizh.ch/keyinst/NewLORETA/LORETA01.htm (Pascual-Marqui andMichel, 1994; Pascual-Marqui et al., 1999, 2002). LORETA is a func-tional imaging technique belonging to a family of linear inversesolution procedures modeling 3D distributions of EEG sources(Pascual-Marqui et al., 2002). With respect to the dipole modelingof cortical sources, no a priori decision of the dipole position is re-quired by the investigators in LORETA estimation. In a previous re-view paper, it has been shown that it was quite efficient whencompared to other linear inverse algorithms like minimum normsolution, weighted minimum norm solution or weighted resolutionoptimization (Pascual-Marqui et al., 1999; Phillips et al., 2002; Yaoand He, 2001). Finally, LORETA has been successfully used in recentEEG studies on pathological brain aging (Dierks et al., 2000; Babi-loni et al., 2004, 2006a,b,c,d,e,f, 2007a,b,c, 2008).
LORETA computes 3D linear solutions (LORETA solutions) forthe EEG inverse problem within a 3-shell spherical head modelincluding scalp, skull, and brain compartments. The brain compart-ment is restricted to the cortical gray matter/hippocampus of ahead model co-registered to the Talairach probability brain atlasand digitized at the Brain Imaging Center of the Montreal Neuro-logical Institute (Talairach and Tournoux, 1988). This compartmentincludes 2394 voxels (7 mm resolution), each voxel containing anequivalent current dipole.
LORETA can be used from EEG data collected by low spatialsampling of 10–20 system (19 electrodes) when cortical sourcesare estimated from resting EEG rhythms (Anderer et al., 2003,2004; Babiloni et al., 2004, 2006a,b,c,d,e,f, 2007a,b,c, 2008; Lauferand Pratt, 2003; Mulert et al., 2001). LORETA solutions consistedof voxel z-current density values able to predict EEG spectralpower density at scalp electrodes, being a reference-free methodof EEG analysis, in that one obtains the same LORETA source distri-bution for EEG data referenced to any reference electrode includingcommon average. A normalization of the data was obtained by nor-malizing the LORETA current density at each voxel with the powerdensity averaged across all frequencies (0.5–45 Hz) and across all2394 voxels of the brain volume. After the normalization, the solu-tions lost the original physical dimension and were represented byan arbitrary unit scale. The general procedure fitted the LORETAsolutions in a Gaussian distribution and reduced inter-subject var-iability (Nuwer, 1988; Leuchter et al., 1993).
Solutions of the EEG inverse problem are under-determined andill-conditioned when the number of spatial samples (electrodes) islower than that of the unknown samples (current density at eachvoxel). To account for that, the cortical LORETA solutions predict-ing scalp EEG spectral power density were regularized to estimatedistributed rather than punctual EEG source patterns (Pascual-Marqui et al., 1999, 2002). In line with the low spatial resolutionof the adopted technique, home-made MATLAB software averagedthe amplitude of LORETA solutions for all voxels belonging to each
macroregion of interest such as frontal, central, parietal, occipital,and temporal. Each of these macroregions of interest (ROIs) wasconstituted by all the voxels of the Brodmann areas listed in Table3. The belonging of a LORETA voxel to a Brodmann area was de-fined by original LORETA package.
Finally, the main advantage of the regional analysis of LORETAsolutions – using an explicit source model coregistered into Talai-rach space – was that our modeling could disentangle rhythms ofcontiguous cortical areas (namely those from the occipital sourcewere disentangled with respect to those of the contiguous parietaland temporal sources, etc).
2.5. Statistical analysis of the LORETA solutions
Statistical comparisons were performed by ANOVA. Mauchley’stest evaluated the sphericity assumption and the correction of thedegrees of freedom was made by Greenhouse–Geisser procedure.Duncan test was used for post-hoc test comparisons (p < 0.05). Inparticular, the following three ANOVAs were performed.
A first ANOVA (EEG data) verified the control hypothesis,namely the sensitivity of the present LORETA approach. To thisaim, the regional normalized LORETA solutions from the Noldand AD subjects at Recording I were used as an input for an ANO-VA. Subjects’ age, education, gender and IAF peak served as covar-iates. The ANOVA used the factors Group (Nold, mild AD;independent variable), Band (delta, theta, alpha 1, alpha 2, beta1, and beta 2), and ROI (central, frontal, parietal, occipital, and tem-poral). The control hypothesis was that the cortical sources of rest-ing EEG rhythms are abnormal in the present AD patients.Specifically, it would be confirmed by the following two statisticalresults: (i) a statistical ANOVA effect including the factor Group(p < 0.05) and (ii) a post-hoc test indicating statistically significantdifferences of the (LORETA) EEG sources with the patterns Nold > -mild AD or Nold < mild AD (Duncan test, p < 0.05).
A second ANOVA design (MMSE data) tested the effects of theibuprofen treatment on the global cognitive function ad revealedby MMSE score (i.e. the existence of MMSE differences across1 year between the AD IBUPROFEN and AD PLACEBO groups). Sincethe population of AD patients was relatively small for a clinicalevaluation of the ibuprofen therapy, we simplified the ANOVA de-sign using the difference between I MMSE and II MMSE (II MMSEminus I MMSE) as a dependent variable. The ANOVA factor wasGroup (AD IBUPROFEN, AD PLACEBO).
A third ANOVA design (EEG data) tested the working hypothesis,namely the effects of long-term ibuprofen treatment on the corticalsources of resting EEG rhythms (i.e. the existence of EEG differencesacross one year between the AD IBUPROFEN and AD PLACEBOgroups). To simplify the ANOVA design, the ANOVA dependent var-iable was the difference of the regional normalized LORETA solutionsin the Recording II and Recording I. The ANOVA factors were Group(AD IBUPROFEN, AD PLACEBO; independent variable), Band (delta,theta, alpha 1, alpha 2, beta 1, and beta 2), and ROI (central, frontal,parietal, occipital, and temporal). The working hypothesis wouldbe confirmed by the following two statistical results: (i) a statisticalANOVA effect including the factor Group (p < 0.05) and (ii) a post-hoc test indicating statistically significant differences of the (LORE-TA) EEG sources with the patterns AD IBUPROFEN > AD PLACEBOor AD IBUPROFEN < AD PLACEBO (Duncan test, p < 0.05).
3. Results
3.1. Cortical sources of EEG rhythms as estimated by LORETA
For illustrative purposes, Fig. 1 maps the grand average of theLORETA solutions (i.e. relative current density at cortical voxels)

Table 3Brodmann areas included in the cortical regions of interest (ROIs) of the presentstudy. LORETA solutions were collapsed in frontal, central, parietal, occipital, andtemporal ROIs.
LORETA Brodmann areas into the regions of interest (ROIs)Frontal 8, 9, 10, 11, 44, 45, 46, 47Central 1, 2, 3, 4, 6Parietal 5, 7, 30, 39, 40, 43Temporal 20, 21, 22, 37, 38, 41, 42Occipital 17, 18, 19
C. Babiloni et al. / Clinical Neurophysiology 120 (2009) 709–718 713
modeling cortical sources of delta, theta, alpha 1, alpha 2, beta 1,and beta 2 rhythms in the Nold and mild AD groups. The Noldgroup presented alpha 1 sources with the maximal values of ampli-tude distributed in parietal and occipital regions. Delta, theta, andalpha 2 sources had moderate amplitude values when compared toalpha 1 sources. Furthermore, beta 1 and beta 2 sources were char-acterized by lowest amplitude values. Compared to the Nold group,the mild AD group showed a decrease in amplitude of the parietal,occipital, and temporal alpha 1 and alpha 2 sources. Furthermore,the mild AD group showed an amplitude increase of widespreaddelta sources.
For illustrative purpose, Fig. 2 maps the grand average of theLORETA solutions (i.e. relative current density at cortical voxels)modeling cortical sources of delta, theta, alpha 1, alpha 2, beta 1,and beta 2 rhythms in the AD IBUPROFEN and AD PLACEBO groupsat the Recording I and Recording II. At the Recording I, the twogroups showed no clear difference in the LORETA solutions. Atthe Recording II, there was greater magnitude of widespread deltasources in the AD PLACEBO group than in the AD IBUPROFENgroup.
3.2. Statistical comparisons
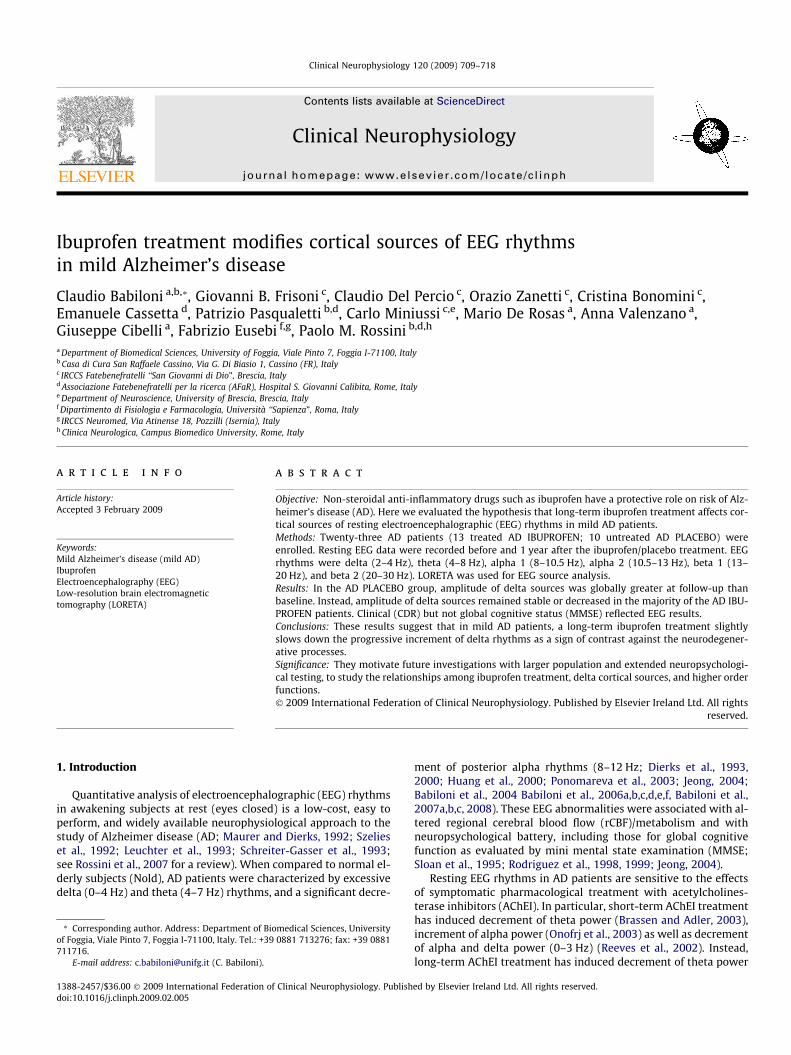
The ANOVA for the evaluation of the control hypothesis on theLORETA solutions showed a statistically significant interaction(F(20,900) = 1.98; MSe = 0.6; p < 0.006) among the factors Group(Nold and mild AD), Band (delta, theta, alpha 1, alpha 2, beta 1,and beta 2), and ROI (central, frontal, parietal, occipital, and tempo-ral). Fig. 3 shows the mean regional normalized LORETA solutionsrelative to this statistical ANOVA interaction. In the figure, the re-gional normalized LORETA solutions had the shape of EEG relative
Fig. 1. Grand average of the LORETA solutions (i.e. normalized relative currentdensity at the cortical voxels) modeling cortical sources of delta, theta, alpha 1,alpha 2, beta 1, and beta 2 rhythms in the Nold and mild AD subjects. In this controlanalysis, the AD group included the AD IBUPROFEN and AD PLACEBO subjects as asingle group. The left side of the maps (top view) corresponds to the lefthemisphere. Legend: LORETA, low-resolution brain electromagnetic tomography.Color scale: all power estimates were scaled based on the averaged maximum value(i.e. alpha 1 power value of occipital region in the Nold subjects). The maximal valueof the LORETA solution is reported under each column.
power spectra. Notably, profile and magnitude of these spectra inthe Nold and mild AD groups differed across diverse corticalmacro-regions, thus supporting the idea that scalp EEG rhythmsare generated by a distributed pattern of cortical sources. The Dun-can planned post-hoc testing showed that: (i) the source patternNold < mild AD was fitted by frontal delta sources (p < 0.03); (ii)the source pattern Nold > mild AD was fitted by parietal, occipital,temporal alpha 1, and occipital alpha 2 sources (p < 0.004 to0.000003). These results demonstrated the sensitivity of the pres-ent LORETA approach, namely the existence of significant EEGsource differences between the Nold and mild AD groups.
The ANOVA for the evaluation of the long-term ibuprofen ef-fects on MMSE score showed no statistically significant differencebetween the AD IBUPROFEN and AD PLACEBO groups (p > 0.1), pos-sibly due to the small AD populations used for this EEG study.
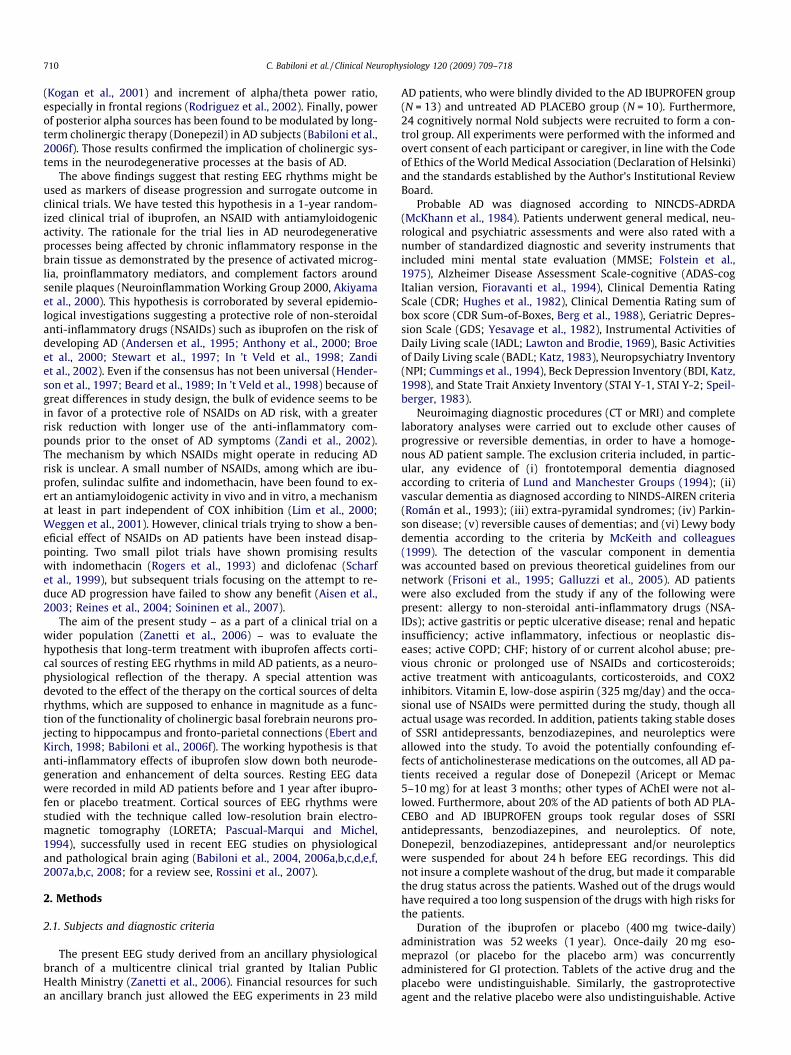
The ANOVA for the evaluation of the effects of ibuprofen treat-ment on cortical sources of EEG rhythms pointed to a statisticallysignificant interaction (F(5,105) = 2.22; MSe = 1.9; p < 0.05) be-tween the factors Group (AD PLACEBO and AD IBUPROFEN) andBand (delta, theta, alpha 1, alpha 2, beta 1, and beta 2). Fig. 4 showsthe mean difference of regional normalized LORETA solutions be-tween the Recording II and Recording I relative to this statisticalANOVA interaction. The Duncan planned post-hoc testing showedthat the source pattern AD PLACEBO > AD IBUPROFEN was fitted bydelta sources (p < 0.01). In Fig. 5, a scatterplot illustrates the differ-ence of the delta power between the Recording II and Recording Ifor the patients of the AD PLACEBO group and for the patients ofthe AD IBUPROFEN group. This scatterplot shows that the majority
Fig. 2. Grand average of the LORETA solutions (i.e. normalized relative currentdensity at the cortical voxels) modeling cortical sources of delta, theta, alpha 1,alpha 2, beta 1, and beta 2 rhythms in the AD IBUPROFEN and AD PLACEBO groupsduring the Recording I (before the therapy or placebo) and Recording II (after about1 year of the therapy or placebo). The left side of the maps (top view) correspondsto the left hemisphere. Color scale: all power estimates were scaled based on theaveraged maximum value (i.e. alpha 1 power value of occipital region duringRecording I). The maximal value of power is reported under each column.
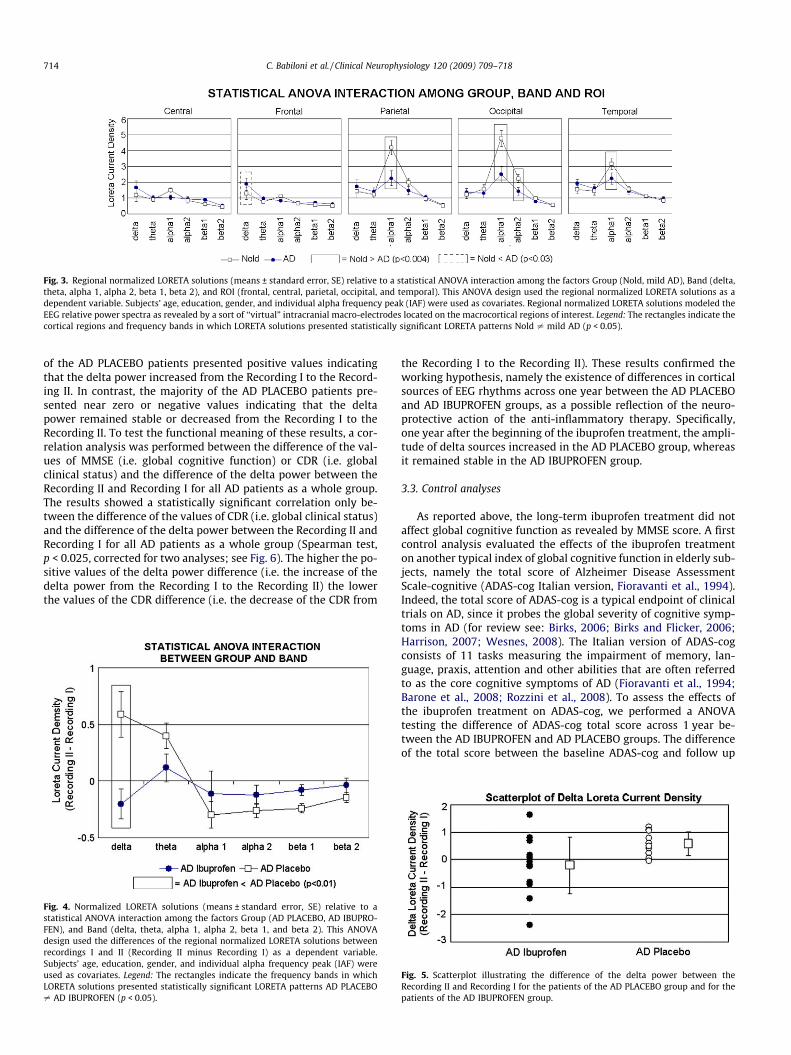
Fig. 3. Regional normalized LORETA solutions (means ± standard error, SE) relative to a statistical ANOVA interaction among the factors Group (Nold, mild AD), Band (delta,theta, alpha 1, alpha 2, beta 1, beta 2), and ROI (frontal, central, parietal, occipital, and temporal). This ANOVA design used the regional normalized LORETA solutions as adependent variable. Subjects’ age, education, gender, and individual alpha frequency peak (IAF) were used as covariates. Regional normalized LORETA solutions modeled theEEG relative power spectra as revealed by a sort of ‘‘virtual” intracranial macro-electrodes located on the macrocortical regions of interest. Legend: The rectangles indicate thecortical regions and frequency bands in which LORETA solutions presented statistically significant LORETA patterns Nold – mild AD (p < 0.05).
714 C. Babiloni et al. / Clinical Neurophysiology 120 (2009) 709–718
of the AD PLACEBO patients presented positive values indicatingthat the delta power increased from the Recording I to the Record-ing II. In contrast, the majority of the AD PLACEBO patients pre-sented near zero or negative values indicating that the deltapower remained stable or decreased from the Recording I to theRecording II. To test the functional meaning of these results, a cor-relation analysis was performed between the difference of the val-ues of MMSE (i.e. global cognitive function) or CDR (i.e. globalclinical status) and the difference of the delta power between theRecording II and Recording I for all AD patients as a whole group.The results showed a statistically significant correlation only be-tween the difference of the values of CDR (i.e. global clinical status)and the difference of the delta power between the Recording II andRecording I for all AD patients as a whole group (Spearman test,p < 0.025, corrected for two analyses; see Fig. 6). The higher the po-sitive values of the delta power difference (i.e. the increase of thedelta power from the Recording I to the Recording II) the lowerthe values of the CDR difference (i.e. the decrease of the CDR from
Fig. 4. Normalized LORETA solutions (means ± standard error, SE) relative to astatistical ANOVA interaction among the factors Group (AD PLACEBO, AD IBUPRO-FEN), and Band (delta, theta, alpha 1, alpha 2, beta 1, and beta 2). This ANOVAdesign used the differences of the regional normalized LORETA solutions betweenrecordings I and II (Recording II minus Recording I) as a dependent variable.Subjects’ age, education, gender, and individual alpha frequency peak (IAF) wereused as covariates. Legend: The rectangles indicate the frequency bands in whichLORETA solutions presented statistically significant LORETA patterns AD PLACEBO– AD IBUPROFEN (p < 0.05).
the Recording I to the Recording II). These results confirmed theworking hypothesis, namely the existence of differences in corticalsources of EEG rhythms across one year between the AD PLACEBOand AD IBUPROFEN groups, as a possible reflection of the neuro-protective action of the anti-inflammatory therapy. Specifically,one year after the beginning of the ibuprofen treatment, the ampli-tude of delta sources increased in the AD PLACEBO group, whereasit remained stable in the AD IBUPROFEN group.
3.3. Control analyses
As reported above, the long-term ibuprofen treatment did notaffect global cognitive function as revealed by MMSE score. A firstcontrol analysis evaluated the effects of the ibuprofen treatmenton another typical index of global cognitive function in elderly sub-jects, namely the total score of Alzheimer Disease AssessmentScale-cognitive (ADAS-cog Italian version, Fioravanti et al., 1994).Indeed, the total score of ADAS-cog is a typical endpoint of clinicaltrials on AD, since it probes the global severity of cognitive symp-toms in AD (for review see: Birks, 2006; Birks and Flicker, 2006;Harrison, 2007; Wesnes, 2008). The Italian version of ADAS-cogconsists of 11 tasks measuring the impairment of memory, lan-guage, praxis, attention and other abilities that are often referredto as the core cognitive symptoms of AD (Fioravanti et al., 1994;Barone et al., 2008; Rozzini et al., 2008). To assess the effects ofthe ibuprofen treatment on ADAS-cog, we performed a ANOVAtesting the difference of ADAS-cog total score across 1 year be-tween the AD IBUPROFEN and AD PLACEBO groups. The differenceof the total score between the baseline ADAS-cog and follow up
Fig. 5. Scatterplot illustrating the difference of the delta power between theRecording II and Recording I for the patients of the AD PLACEBO group and for thepatients of the AD IBUPROFEN group.
Fig. 6. Scatterplot illustrating statistically significant correlation between thedifference of the values of CDR (i.e. global clinical status) and the difference ofthe delta power between the Recording II and Recording I for all AD patients as awhole group.
Fig. 7. Normalized LORETA solutions (means ± standard error, SE) relative to astatistical ANOVA interaction among the factors Group (AD PLACEBO and ADIBUPROFEN), Recording (Recording I and Recording II), and Band (delta, theta, alpha1, alpha 2, beta 1, and beta 2). This ANOVA design used the regional normalizedLORETA solutions as a dependent variable. Subjects’ age, education, gender, andindividual alpha frequency peak (IAF) were used as covariates. Legend: Therectangles indicate the frequency bands in which LORETA solutions presentedstatistically significant LORETA patterns Recording I – Recording II (p < 0.05).
C. Babiloni et al. / Clinical Neurophysiology 120 (2009) 709–718 715
ADAS-cog (II ADAS-cog minus I ADAS-cog) was used as a depen-dent variable, whereas the ANOVA factor was Group (AD IBUPRO-FEN, AD PLACEBO). This ANOVA design showed no statisticallysignificant difference between the AD IBUPROFEN and AD PLACEBOgroups (p > 0.5). These results confirm those obtained using MMSEscore, namely 1-year ibuprofen treatment did not affect global cog-nitive function in our group of AD patients. Unlikely, we could haveaccess only to the total score of ADAS-cog but not to the values ofthe single tests.
Main results showed that cortical sources of delta rhythms in-creased in magnitude from the baseline (Recording I) to follow-up (Recording II) in the majority of the AD PLACEBO patients,whereas those sources remained stable or decreased in amplitudefrom the baseline (Recording I) to follow-up (Recording II) in themajority of the AD IBUPROFEN patients. One may argue that theseresults were merely due to the use of the difference of the regionalnormalized LORETA solutions in the Recording II and Recording I asa dependent variable. To address this issue, the regional normal-ized delta LORETA solution was used as a dependent variable fora control ANOVA. The ANOVA factors were Group (AD IBUPROFEN,AD PLACEBO; independent variable), Recording (Recording I,Recording II), Band (delta, theta, alpha 1, alpha 2, beta 1, and beta2), and ROI (central, frontal, parietal, occipital, and temporal). Sub-jects’ age, education, gender, and IAF were used as covariates. TheANOVA showed a statistically significant interaction(F(5,105) = 2.6; MSe = 0.6; p < 0.05) among the factors Group,Recording, Band, and ROI (see Fig. 7). The Duncan planned post-hoc testing showed that the amplitude of the cortical delta sourceswas stronger at the Recording II than Recording I in the AD PLA-CEBO group (p < 0.007). On the contrary, the amplitude of the deltasources did not differ at the Recording I and Recording II in the ADIBUPROFEN group (p > 0.3). These results confirmed that at the 1-year follow-up, the amplitude of the cortical delta sources in-creased in the AD PLACEBO group but not in the AD IBUPROFENgroup.
To further exclude that baseline delta sources in the AD IBU-PROFEN and AD PLACEBO groups affected the main results of thepresent study, the regional normalized delta LORETA solutionsfrom the AD PLACEBO and AD IBUPROFEN subjects at Recording Iwere used as an input for a control ANOVA. Subjects’ age, educa-tion, gender and IAF peak served as covariates. The ANOVA factors
were Group (AD IBUPROFEN, AD PLACEBO; independent variable)and ROI (central, frontal, parietal, occipital, and temporal). The AN-OVA showed neither a main effect of the factor Group (p > 0.7) nora statistical interaction between Group and ROI (p > 0.3). These re-sults showed that the cortical sources of delta EEG rhythms atbaseline were substantially similar in the AD PLACEBO and AD IBU-PROFEN groups and cannot account for the main results of thisstudy. Moreover, we repeated the main ANOVA using baseline del-ta sources as an additional covariate. As in the main ANOVA, thecontrol ANOVA showed a statistically significant interaction(p < 0.05) between the factors Group (AD PLACEBO and AD IBU-PROFEN) and Band (delta, theta, alpha 1, alpha 2, beta 1, and beta2). The Duncan planned post-hoc testing showed that the sourcepattern AD PLACEBO > AD IBUPROFEN was fitted by delta sources(p < 0.01). Therefore, these results showed that the delta sourcedifferences across 1;year between the AD IBUPROFEN and AD PLA-CEBO groups were not affected by the amplitude of delta sources atbaseline in the two groups.
4. Discussion
In the preliminary control analysis, the present mild AD sub-jects were considered as a single AD group, to compare corticalsources of resting EEG rhythms (LORETA solutions; I Recordings)with those of the Nold group. With reference to the Nold group,the mild AD group was characterized by (i) a marked amplitudedecrease of the alpha 1 sources in parietal, occipital, and temporalareas; (ii) an amplitude decrease of the occipital alpha 2 sources;and (iii) an amplitude increase of the frontal delta sources. Thesecontrol results are globally in line with previous evidence showinga decrement of alpha rhythms in AD compared to Nold subjects(Dierks et al., 1993, 2000; Jelic et al., 1996, 2000; Rodriguez et al.,1999; Huang et al., 2000; Babiloni et al., 2006a,b,c,d,e,f, 2007a,b,c,2008), and an enhancement of the delta rhythms in AD comparedto Nold subjects (bibgrp1; Jelic et al., 2000; Wolf et al., 2003; Babi-loni et al., 2004, 2006a,b,c,d,e,f, Babiloni et al., 2007a,b,c, 2008).
The main analysis of the present study demonstrated a relation-ship between long-term ibuprofen treatment and cortical sourcesof resting EEG rhythms in mild AD patients. It was shown that cor-tical sources of delta rhythms globally increased in amplitude afterthe placebo treatment, as a sign of disease progression. On the con-trary, the amplitude of cortical delta sources remained stable or
716 C. Babiloni et al. / Clinical Neurophysiology 120 (2009) 709–718
decreased in the majority of the AD patients after the ibuprofentreatment. These results suggest an effect of the ibuprofen therapyon the generation of pathological cortical delta rhythms at the rest-ing state, which might unveil one of the physiological action mech-anisms of NSAIDs in AD. However, the present results should betreated with some caution due to the small amount of enrolledAD patients (N = 23). Furthermore, it cannot be entirely excludedthat at the follow-up, cortical delta rhythms of some AD IBUPRO-FEN patients remained substantially stable for other reasons thanthe ibuprofen treatment.
Why did long-term ibuprofen treatment affect cortical sourcesof delta rhythms in mild AD patients? It can be speculated thatthe physiological mechanism is related to the neuroprotective roleof NSAIDs such as ibuprofen on the risk of developing (Andersenet al., 1995; Anthony et al., 2000; Broe et al., 2000; Stewart et al.,1997; In ’t Veld et al., 1998; Zandi et al., 2002). This role mightbe due to antiamyloidogenic effects of a therapy contrastingchronic inflammatory and immunity cascades in structures of cen-tral nervous system prone to neurodegeneration provoked by envi-ronmental neurotoxins, abnormal/incomplete development ofmyelination, and/or low levels of neurotrophic factors at choliner-gic hippocampal and cortical pathways (Lim et al., 2000; Weggenet al., 2001; Sarter and Bruno, 2002). Such neuroprotection of ibu-profen might indirectly influence thalamocortical and cortico-cor-tical (mainly cholinergic) systems that produce delta rhythms(Sarter and Bruno, 2002; Kobayashi and Tadashi, 2002). In the con-dition of slow-wave sleep, corticofugal slow oscillations (<1 Hz)are effective in grouping thalamic-generated delta rhythms (1–4 Hz; Steriade, 2003). In the condition of brain arousal, deltarhythms are blocked by the inhibition of oscillators within, respec-tively, reticulothalamic (7–14 Hz), thalamo-cortical (1–4 Hz), andintracortical (<1 Hz) neuronal circuits. Delta rhythms are replacedby fast (beta and gamma) cortical oscillations, which are mainly in-duced by cholinergic basal forebrain inputs to hippocampus andcortex as well as by thalamocortical projections (Steriade, 2003;Steriade et al., 1996).
Keeping in mind the mentioned theoretical framework, it can bespeculated that a long-term ibuprofen treatment slightly slowsdown the AD neurodegenerative processes revealed by the increaseof cortical delta rhythms. In AD patients, such an increase might beassociated with a loss of cholinergic basal forebrain neurons pro-jecting to hippocampus and fronto-parietal connections (Helkalaet al., 1996; Holschneider et al., 1999; Mesulam et al., 2004), ratherthan with a loss of cholinergic brainstem neurons projecting tothalamus (Mash et al., 1985; Geula and Mesulam, 1989; Geulaand Mesulam, 1996; Geula et al., 1999; Tanaka et al., 2003; Mesu-lam et al., 2004). The cholinergic basal forebrain neurons wouldbe the main responsible together with serotoninergic neurons ofthe replacement of delta rhythms by fast EEG rhythms duringwakefulness (Dringenberg, 2000; Dringenberg et al., 2002). Thepresent results are also compatible with the enhancement of rest-ing delta rhythms due to wide atrophy in mesial-temporal, poster-ior, and/or frontal areas of AD patients (Fernandez et al., 2003;Babiloni et al., 2006e) as well as to experimental lesions of basalforebrain in animals (Stewart et al., 1984; Buzsaki et al., 1988;Ray and Jackson, 1991). However, resting delta rhythms can be alsopathologically enhanced by non-AD lesions of thalamus and brain-stem provoked by cerebral vascular, traumatic, and tumor pro-cesses (Gloor et al., 1977; Harmony et al., 1993; Murri et al.,1998; deJongh et al., 2003; Hensel et al., 2004).
The present results showed a dissociation between the effects ofthe ibuprofen treatment on the global clinical and cognitive condi-tions. Indeed, the amplitude of cortical delta rhythms from thebaseline to the 1-year follow-up was related to the global clinicalstatus as probed by CDR score but to the global cognitive functionas probed by MMSE and ADAS-cog. The higher the positive values
of the delta power difference (i.e. the increase of the delta powerfrom the baseline to the follow up), the lower the values of theCDR difference (i.e. the decrease of the CDR from the baseline tothe follow up). An open question is why the long-term ibuprofentreatment did not affect global cognitive function. The number ofthe enrolled AD patients (N = 23) could be insufficient to investi-gate the complex relationships among resting delta rhythms, neu-rodegenerative processes, and higher order functions.Furthermore, both MMSE and ADAS-cog probe subjects’ global cog-nitive skills but they do not allow probing single dimensions ofhigher order functions. Neuropsychological effects of the ibuprofentreatment might regard single cognitive functions or patients’ sub-populations suffering from peculiar chronic inflammation at cen-tral nervous system. An alternative tentative explanation is theibuprofen treatment might require longer time of administrationto produce effects on cognitive functions (Anthony et al., 2000;Broe et al., 2000; Stewart et al., 1997; Zandi et al., 2002). To addressthese issues, future investigations might include (i) the prolonga-tion of the ibuprofen treatment to 2 years in a large amount of pa-tients and (ii) the evaluation of single cognitive tests exploringattention, spatial abilities, executive functions, and episodic mem-ory in both baseline and follow-up.
In conclusion, we evaluated the hypothesis that long-term(1 year) ibuprofen treatment affects cortical sources of EEGrhythms in mild AD patients. Results showed that, in the AD PLA-CEBO group, cortical sources of delta rhythms was greater in mag-nitude at follow-up than baseline recordings, as a sign of diseaseprogression. On the contrary, the amplitude of delta sources re-mained stable in the AD IBUPROFEN group. These results suggestthat in mild AD patients, a long-term ibuprofen treatment slightlyslows down the neurodegenerative processes revealed by corticalsources of delta rhythms. They also motivate future investigationswith larger population and extended neuropsychological testing, tostudy the fine relationships among ibuprofen treatment, AD neuro-degenerative processes, cortical sources of delta rhythms, higherorder functions, and clinical picture.
Acknowledgements
The research was granted by the Association Fatebenefratelli forResearch (AFaR) and Tosinvest Sanità. We also thank Angelini SpAand Astra-Zeneca Pharmaceuticals for the supply of active drugtablets and relative placebo.
References
Aisen PS, Schafer KA, Grundman M, Pfeiffer E, Sano M, Davis KL, et al. Effects ofrofecoxib or naproxen vs placebo on Alzheimer disease progression: arandomized controlled trial. JAMA 2003;289(21):2819–26.
Akiyama H, Barger S, Barnum S, Bradt B, Bauer J, Cole GM, et al. Inflammation andAlzheimer’s disease. Neurobiol Aging 2000;21(3):383–421 [review].
Anderer P, Saletu B, Semlitsch HV, Pascual-Marqui RD. Non-invasive localization ofP300 sources in normal aging and age-associated memory impairment.Neurobiol Aging 2003;24(3):463–79.
Anderer P, Saletu B, Saletu-Zyhlarz G, Gruber D, Metka M, Huber J, et al. Brainregions activated during an auditory discrimination task in insomniacpostmenopausal patients before and after hormone replacement therapy:low-resolution brain electromagnetic tomography applied to event-relatedpotentials. Neuropsychobiology 2004;49(3):134–53.
Andersen K, Launer LJ, Ott A, Hoes AW, Breteler MM, Hofman A. Do nonsteroidalanti-inflammatory drugs decrease the risk for Alzheimer’s disease? TheRotterdam study. Neurology 1995;45(8):1441–5.
Anthony JC, Breitner JC, Zandi PP, Meyer MR, Jurasova I, Norton MC, et al. Reducedprevalence of AD in users of NSAIDs and H2 receptor antagonists: the CacheCounty study. Neurology 2000;54(11):2066–71.
Babiloni C, Binetti G, Cassetta E, Cerboneschi D, Dal Forno G, Del Percio C, et al.Mapping distributed sources of cortical rhythms in mild Alzheimer’s disease. Amulti-centric EEG study. NeuroImage 2004;22(1):57–67.
Babiloni C, Binetti G, Cassarino A, Dal Forno G, Del Percio C, Ferreri F, et al. Sources ofcortical rhythms in adults during physiological aging: a multi-centric EEGstudy. Hum Brain Mapp 2006a;27(2):162–72.

C. Babiloni et al. / Clinical Neurophysiology 120 (2009) 709–718 717
Babiloni C, Binetti G, Cassetta E, Dal Forno G, Del Percio C, Ferreri F, et al. Sources ofcortical rhythms change as a function of cognitive impairment in pathologicalaging: a multi-centric study. Clin Neurophysiol 2006b;117(2):252–68.
Babiloni C, Benussi L, Binetti G, Bosco P, Busonero G, Cesaretti S, et al. Genotype(cystatin C) and EEG phenotype in Alzheimer disease and mild cognitiveimpairment: a multicentric study. Neuroimage 2006c;29(3):948–64.
Babiloni C, Benussi L, Binetti G, Cassetta E, Dal Forno G, Del Percio C, et al.Apolipoprotein E and alpha brain rhythms in mild cognitive impairment: amulticentric EEG study. Ann Neurol 2006d;59(2):323–34.
Babiloni C, Frisoni G, Steriade M, Bresciani L, Binetti G, Del Percio C, et al. Frontalwhite matter volume and delta EEG sources negatively correlate in awakesubjects with mild cognitive impairment and Alzheimer’s disease. ClinNeurophysiol 2006e;117(5):1113–29.
Babiloni C, Cassetta E, Dal Forno G, Del Percio C, Ferreri F, Ferri R, et al. Donepezileffects on sources of cortical rhythms in mild Alzheimer’s disease: respondersvs. non-responders. Neuroimage 2006f;31(4):1650–65.
Babiloni C, Squitti R, Del Percio C, Cassetta E, Ventriglia MC, Ferreri F, et al. Freecopper and resting temporal EEG rhythms correlate across healthy, mildcognitive impairment, and Alzheimer’s disease subjects. Clin Neurophysiol2007a;118(6):1244–60.
Babiloni C, Cassetta E, Binetti G, Tombini M, Del Percio C, Ferreri F, et al. Resting EEGsources correlate with attentional span in mild cognitive impairment andAlzheimer’s disease. Eur J Neurosci 2007b;25(12):3742–57.
Babiloni C, Bosco P, Ghidoni R, Del Percio C, Squitti R, Binetti G, et al. Homocysteineand EEG rhythms in Alzheimer disease: a multicentric study. Neuroscience2007c;145(3):942–54.
Babiloni C, Frisoni G, Pievani M, Toscano L, Del Percio C, Geroldi C, et al. Whitematter vascular lesions correlate with alpha EEG sources in mild cognitiveimpairment. Neuropsychologia 2008;46(6):1707–20.
Barone P, Burn DJ, van Laar T, Hsu C, Poewe W, Lane RM. Rivastigmine versusplacebo in hyperhomocysteinemic Parkinson’s disease dementia patients. MovDisord 2008;23(11):1532–40.
Beard CM, Kottke TE, Annegers JF, Ballard DJ. The Rochester coronary heart diseaseproject: effect of cigarette smoking, hypertension, diabetes, and steroidalestrogen use on coronary heart disease among 40- to 59-year-old women, 1960through 1982. Mayo Clin Proc 1989;64(12):1471–80.
Berg L, Miller JP, Storandt M, Duchek J, Morris JC, Rubin EH, et al. Mild seniledementia of the Alzheimer’s type. 2: Longitudinal assessment. Ann Neurol1988;23:477–84.
Besthorn C, Zerfass R, Geiger-Kabisch C, Sattel H, Daniel S, Schreiter-Gasser U, et al.Discrimination of Alzheimer’s disease and normal aging by EEG data.Electroencephalogr Clin Neurophysiol 1997;103(2):241–8.
Birks J. Cholinesterase inhibitors for Alzheimer’s disease. Cochrane Database SystRev 2006(1):CD005593 [review].
Birks J, Flicker L. Donepezil for mild cognitive impairment. Cochrane Database SystRev 2006;3:CD006104 [review].
Brassen S, Adler G. Short-term effects of acetylcholinesterase inhibitor treatment onEEG and memory performance in Alzheimer patients: an open, controlled trial.Pharmacopsychiatry 2003;36:304–8.
Broe GA, Grayson DA, Creasey HM, Waite LM, Casey BJ, Bennett HP, et al. Anti-inflammatory drugs protect against Alzheimer disease at low doses. ArchNeurol 2000;57(11):1586–91.
Buzsaki G, Bickford RG, Ponomareff G, Thal LJ, Mandel R, Gage FH. Nucleus basalisand thalamic control of neocortical activity in the freely moving rat. J Neurosci1988;8(11):4007–26.
Chiaramonti R, Muscas GC, Paganini M, Muller TJ, Fallgatter AJ, Versari A, et al.Correlations of topographical EEG features with clinical severity in mild andmoderate dementia of Alzheimer type. Neuropsychobiology1997;36(3):153–8.
Cook IA, Leuchter AF. Synaptic dysfunction in Alzheimer’s disease: clinicalassessment using quantitative EEG. Behav Brain Res 1996;78(1):15–23.
Cummings JL, Mega M, Gray K, Rosenberg-Thompson S, Carusi DA, Gornbein J. Theneuropsychiatric inventory: comprehensive assessment of psychopathology indementia. Neurology 1994;44:2308–14.
deJongh A, Baayen JC, de Munck JC, Heethaar RM, Vandertop WP, Stam CJ. Theinfluence of brain tumor treatment on pathological delta activity in MEG.Neuroimage 2003;20(4):2291–301.
Dierks T, Ihl R, Frolich L, Maurer K. Dementia of the Alzheimer type: effects on thespontaneous EEG described by dipole sources. Psychiatry Res1993;50(3):51–162.
Dierks T, Jelic V, Pascual-Marqui RD, Wahlund LO, Julin P, Linden DEJ, et al. Spatialpattern of cerebral glucose metabolism (PET) correlates with localization ofintracerebral EEG-generators in Alzheimer’s disease. Clin Neurophysiol2000;111:1817–24.
Dringenberg HC. Alzheimer’s disease: more than a ‘cholinergic disorder’ – evidencethat cholinergic–monoaminergic interactions contribute to EEG slowing anddementia. Behav Brain Res 2000;115:235–49.
Dringenberg HC, Rubenstein ML, Solty H, Tomaszek S, Bruce A.Electroencephalographic activation by tacrine, deprenyl, and quipazine:cholinergic vs. non-cholinergic contributions. Eur J Pharmacol2002;447(1):43–50.
Ebert U, Kirch W. Scopolamine model of dementia: electroencephalogramfindings and cognitive performance. Eur J Clin Invest 1998;28(11):944–9[review].
Fernandez A, Arrazola J, Maestu F, Amo C, Gil-Gregorio P, Wienbruch C, et al.Correlations of hippocampal atrophy and focal low-frequency magnetic activity
in Alzheimer disease: volumetric MR imaging-magnetoencephalographic study.Am J Neuroradiol 2003;24(3):481–7.
Fioravanti M, Nacca D, Buckley AE, Ferrario E, Varetto O, Mogni P, et al. The Italianversion of the Alzheimer’s disease assessment scale (ADAS): psychometric andnormative characteristics from a normal aged population. Arch Gerontol Geriatr1994;19(1):21–30.
Folstein MF, Folstein SE, McHugh PR. ‘Mini Mental State’: a practical method forgrading the cognitive state of patients for clinician. J Psychiat Res1975;12:189–98.
Frisoni GB, Beltramello A, Binetti G, Bianchetti A, Weiss C, Scuratti A, et al.Computed tomography in the detection of the vascular component in dementia.Gerontology 1995;41(2):121–8.
Galluzzi S, Sheu CF, Zanetti O, Frisoni GB. Distinctive clinical features of mildcognitive impairment with subcortical cerebrovascular disease. Dement GeriatrCogn Disord 2005;19(4):196–203.
Geula C, Mesulam MM. Cortical cholinerigc fibers in aging and Alzheimer’s disease:a morphometric study. Neuroscience 1989;33:469–81.
Geula C, Mesulam MM. Systematic regional variations in the lossof cortical cholinergic fibers in Alzheimer’s disease. Cereb Cortex1996;6:165–77.
Geula C, Mesulam MM. Cholinergic system in Alzheimer’s disease. In: Terry RDet al., editors. Alzheimer disease. 2nd ed. Lippincot, Philadelphia, PA: Williamsand Wilkins; 1999. p. 69–292.
Gloor P, Ball G, Schaul N. Brain lesions that produce delta waves in the EEG.Neurology 1977;27(4):326–33.
Harmony T, Fernandez-Bouzas A, Marosi E, Fernandez T, Bernal J, Rodriguez M, et al.Correlation between computed tomography and voltage and current sourcedensity spectral EEG parameters in patients with brain lesions.Electroencephalogr Clin Neurophysiol 1993;87(4):196–205.
Harrison JE. Measuring cognitive change in Alzheimer’s disease clinical drug trials. JNutr Health Aging 2007;11(4):327–9 [review].
Helkala EL, Hanninen T, Hallikainen M, Kononen M, Laakso MP, Hartikainen P, et al.Slow-wave activity in the spectral analysis of the electroencephalogram andvolumes of hippocampus in subgroups of Alzheimer’s disease patients. BehavNeurosci 1996;110(6):1235–43.
Henderson AS, Jorm AF, Christensen H, Jacomb PA, Korten AE. Aspirin, anti-inflammatory drugs and risk of dementia. Int J Geriatr Psychiatry1997;12(9):926–30.
Hensel S, Rockstroh B, Berg P, Elbert T, Schonle PW. Left-hemispheric abnormal EEGactivity in relation to impairment and recovery in aphasic patients.Psychophysiology 2004;41(3):394–400.
Holschneider DP, Waite JJ, Leuchter AF, Walton NY, Scremin OU. Changes inelectrocortical power and coherence in response to the selective cholinergicimmunotoxin 192 IgG-saporin. Exp Brain Res 1999;126(2):270–80.
Huang C, Wahlund LO, Dierks T, Julin P, Winblad B, Jelic V. Discrimination ofAlzheimer’s disease and mild cognitive impairment by equivalent EEGsources: a cross-sectional and longitudinal study. Clin Neurophysiol2000;11:1961–7.
Hughes CP, Berg L, Danziger WL, Coben LA, Martin RL. A new clinical scale for thestaging of dementia. Br J Psychiatry 1982;140:566–72.
In ’t Veld BA, Launer LJ, Hoes AW, Ott A, Hofman A, Breteler MM, et al. NSAIDs andincident Alzheimer’s disease. The Rotterdam study. Neurobiol Aging1998;19:607–11.
Jelic V, Shigeta M, Julin P. Quantitative electroencephalography power andcoherence in Alzheimer’s disease and mild cognitive impairment. Dementia1996;7:314–23.
Jelic V, Johansson SE, Almkvist O, Shigeta M, Julin P, Nordberg A, et al. Quantitativeelectroencephalography in mild cognitive impairment: longitudinal changesand possible prediction of Alzheimer’s disease. Neurobiol Aging2000;21:533–40.
Jeong J. EEG dynamics in patients with Alzheimer’s disease. Clin Neurophysiol2004;115(7):1490–505.
Katz S. Assessing self-maintenance: activities of daily living, mobility, andinstrumental activities of daily living. J Am Geriatr Soc 1983;31:721–7.
Katz IR. Diagnosis and treatment of depression in patients with Alzheimer’s diseaseand other dementias. J Clin Psychiatry 1998;59(suppl 9):38–44.
Klimesch W. Memory processes, brain oscillations and EEG synchronization. Int JPsychophysiol 1996;24(1–2):61–100.
Klimesch W. EEG alpha and theta oscillations reflect cognitive and memoryperformance: a review and analysis. Brain Res Rev 1999;29:169–95.
Klimesch W, Doppelmayr M, Pachinger T, Russegger H. Event-relateddesynchronization in the alpha band and the processing of semanticinformation. Brain Res Cogn Brain Res 1997;6(2):83–94.
Klimesch W, Doppelmayr M, Russegger H, Pachinger T, Schwaiger J. Induced alphaband power changes in the human EEG and attention. Neurosci Lett1998;244(2):73–6.
Kobayashi Y, Tadashi I. Sensory-motor gating and cognitive control by thebrainstem cholinergic system. Neural Networks 2002:731–41.
Kogan EA, Korczyn AD, Virchowsy RG, Klimovizky SSh, Treves TA, Neufeld MY. EEGchanges during long-term treatment with donepezil in Alzheimer’s diseasepatients. J Neural Transm 2001;108:1167–73.
Kolev V, Yordanova J, Basar-Eroglu C, Basar E. Age effects on visual EEGresponses reveal distinct frontal alpha networks. Clin Neurophysiol2002;113(6):901–10.
Laufer I, Pratt H. Evoked potentials to auditory movement sensation in duplexperception. Clin Neurophysiol 2003;114(7):1316–31.

718 C. Babiloni et al. / Clinical Neurophysiology 120 (2009) 709–718
Lawton MP, Brodie EM. Assessment of older people: self maintaining andinstrumental activity of daily living. J Gerontol 1969;9:179–86.
Leuchter AF, Cook IA, Newton TF, Dunkin J, Walter DO, Rosenberg Tompson S, et al.Regional differences in brain electrical activity in dementia: use of spectralpower and spectral ratio measures. Electroenceph Clin Neurophysiol1993;87:385–93.
Lim GP, Yang F, Chu T, Chen P, Beech W, Teter B, et al. Ibuprofen suppresses plaquepathology and inflammation in a mouse model for Alzheimer’s disease. JNeurosci 2000;20:5709–14.
Mash DC, Flynn DD, Potter LT. Loss of M2 muscarine receptors in the cerebral cortexin Alzheimer’s disease and experimental cholinergic denervation. Science1985;228(4703):1115–7. 31.
Maurer K, Dierks T. Functional imaging procedures in dementias: mapping of EEGand evoked potentials. Acta Neurol Scand Suppl 1992;139:40–6.
McKeith IG, Perry EK, Perry RH. Report of the second dementia with Lewy bodyinternational workshop: diagnosis and treatment. Consortiumon dementia withLewy bodies. Neurology 1999;53:902–25.
McKhann G, Drachman D, Folstein M, Katzman R, Price D, Stadlan EM. Clinicaldiagnosis of Alzheimer’s disease: report of the NINCDS-ADRDA Work Groupunder the auspices of Department of Health and Human Services Task Force onAlzheimer’s disease. Neurology 1984;34:939–44.
Mesulam M, Shaw P, Mash D, Weintraub S. Cholinergic nucleus basalis tauopathyemerges early in the aging-MCI-AD continuum. Ann Neurol 2004;55(6):815–28.
Moretti DV, Babiloni F, Carducci F, Cincotti F, Remondini E, Rossini PM, et al.Computerized processing of EEG-EOG-EMG artifacts for multicentirc studies inEEG oscillations and event-related potentials. Int J Pshycophysiol2003;47(3):199–216.
Mulert C, Gallinat J, Pascual-Marqui R, Dorn H, Frick K, Schlattmann P, et al. Reducedevent-related current density in the anterior cingulate cortex in schizophrenia.Neuroimage 2001;13(4):589–600.
Murri L, Gori S, Massetani R, Bonanni E, Marcella F, Milani S. Evaluation of acuteischemic stroke using quantitative EEG: a comparison with conventional EEGand CT scan. Neurophysiol Clin 1998;28(3):249–57.
Nobili F, Taddei G, Vitali P, Bazzano L, Catsafados E, Mariani G, et al. Relationshipsbetween 99m Tc-HMPAO ceraspect and quantitative EEG observations inAlzheimer’s disease. Arch Gerontol Geriatr 1998;6:363–8.
Nuwer MR. Quantitative EEG. I : techniques and problems of frequency analysis andtopographic mapping. J Clin Neurophysiol 1998;5:1–43.
Onofrj M, Thomas A, Iacono D, Luciano AL, Di Iorio A. The effects of a cholinesteraseinhibitor are prominent in patients with fluctuating cognition: a part 3 study ofthe main mechanism of cholinesterase inhibitors in dementia. ClinNeuropharmacol 2003;26:239–51.
Pascual-Marqui RD, Michel CM. LORETA (low resolution brain electromagnetictomography): new authentic 3D functional images of the brain. ISBETNewsletter ISSN 1994;5:4–8.
Pascual-Marqui RD, Lehmann D, Koenig T, Kochi K, Merlo MC, Hell D, et al. Lowresolution brain electromagnetic tomography (LORETA) functional imaging inacute, neuroleptic-naive, first-episode, productive schizophrenia. PsychiatryRes 1999;90(3):169–79.
Pascual-Marqui RD, Esslen M, Kochi K, Lehmann D. Functional imaging with lowresolution brain electromagnetic tomography (LORETA): a review. MethodsFind Exp Clin Pharmacol 2002;24:91–5.
Phillips C, Rugg MD, Friston KJ. Systemic regularization of linear inverse solutions ofthe EEG source localization problem. Neuroimage 2002;17:287–301.
Ponomareva NV, Selesneva ND, Jarikov GA. EEG alterations in subjects at highfamilial risk for Alzheimer’s disease. Neuropsychobiology 2003;48(3):152–9.
Prichep et al., 1994 Prichep LS, John ER, Ferris SH, Reisberg B, Almas M, Alper K, et al.Quantitative EEG correlates of cognitive deterioration in the elderly. NeurobiolAging 1994;15(1):85–90Prichep et al., 1994 Prichep LS, John ER, Ferris SH,Reisberg B, Almas M, et al. Quantitative EEG correlates of cognitivedeterioration in the elderly. Neurobiol Aging 1994;15(1):85–90 [Erratum in:Neurobiol Aging 1994;15(3):391].
Pucci E, Cacchiò G, Angeloni R, Belardinelli N, Nolfe G, Signorino M, et al. EEGspectral analysis in Alzheimer’s disease and different degenerative dementias.Arch Gereontol Geriat 1997;26:283–97.
Ray PG, Jackson WJ. Lesions of nucleus basalis alter ChAT activity and EEG in ratfrontal neocortex. Electroencephalogr Clin Neurophysiol 1991;79(1):62–8.
Reeves RR, Struve FA, Patrick G. The effects of donepezil on quantitative EEG inpatients with Alzheimer’s disease. Clin Electroencephalogr 2002;33(2):93–6.
Reines SA, Block GA, Morris JC, Liu G, Nessly ML, Lines CR, et al. Rofecoxib: no effecton Alzheimer’s disease in a 1-year, randomized, blinded, controlled study.Neurology 2004;62(1):66–71.
Rodriguez G, Nobili F, Rocca G, DeCarli F, Gianelli MV, Rosadini G. Quantitativeelectroencephalography and regional cerebral blood flow: discriminant analysis
between Alzheimer’s patients and healthy controls. Dement Geriatr CognDisord 1998;9:238–74.
Rodriguez G, Copello F, Nobili F, Vitali P, Perego G, Nobili F. EEG spectral profile tostage Alzheimer’s disease. Clin Neurophysiol 1999;110:1831–7.
Rodriguez G, Vitali P, De Leo C, De Carli F, Girtler N, Nobili F. Quantitative EEGchanges in Alzheimer patients during long-term donepezil therapy.Neuropsychobiology 2002;46:49–56.
Rogers J, Kirby LC, Hempelman SR, Berry DL, McGeer PL, Kaszniak AW, et al. Clinicaltrial of indomethacin in Alzheimer’s disease. Neurology 1993;43(8):1609–11.
Román GC, Tatemichi TK, Erkinjuntti T, Cummings JL, Masdeu JC, Garcia JH, et al.Vascular dementia: diagnostic criteria for research studies. Report of theNINDS-AIREN international workshop. Neurology 1993;43(2):250–60.
Rossini PM, Rossi S, Babiloni C, Polich J. Clinical neurophysiology of aging brain:from normal aging to neurodegeneration. Prog Neurobiol 2007;83(6):375–400[Epub 2007 August 8; Review December].
Rozzini L, Vicini Chilovi B, Bertoletti E, Conti M, Delrio I, Trabucchi M, et al. Theimportance of Alzheimer disease assessment scale-cognitive part in predictingprogress for amnestic mild cognitive impairment to Alzheimer disease. J GeriatrPsychiatry Neurol 2008;21(4):261–7.
Sarter M, Bruno JP. Mild cognitive impairment and the cholinergic hypothesis: avery different take on recent data. Ann Neurol 2002;52(3):384–5.
Scharf S, Mander A, Ugoni A, Vajda F, Christophidis N. A double-blind, placebo-controlled trial of diclofenac/misoprostol in Alzheimer’s disease. Neurology1999;53(1):197–201.
Schreiter-Gasser U, Gasser T, Ziegler P. Quantitative EEG analysis in early onsetAlzheimer’s disease: a controlled study. Electroencephalogr Clin Neurophysiol1993;86(1):15–22.
Sloan EP, Fenton GW, Kennedy NSJ, MacLennan JM. Electroencephalography andsingle photon emission computed tomography in dementia: a comparativestudy. Psychol Med 1995;25:631–8.
Soininen H, West C, Robbins J, Niculescu L. Long-term efficacy and safety ofcelecoxib in Alzheimer’s disease. Dement Geriatr Cogn Disord 2007;23(1):8–21.
Speilberger CD. Manual for the state-trait anxiety inventory (Form Y-1). Palo Alto,CA: Consulting Psychologists Press; 1983.
Steriade M. Neuronal substrates of sleep and epilepsy. Cambridge (UK): CambridgeUniversity Press; 2003. p. 522.
Steriade M, Amzica F, Contreras D. Synchronization of fast (30–40 Hz) spontaneouscortical rhythms during brain activation. J Neurosci 1996;16:392–417.
Stewart GR, Frederickson CJ, Howell GA, Gage FH. Cholinergic denervation-inducedincrease of chelatable zinc in mossy-fiber region of the hippocampal formation.Brain Res 1984;290(1):43–51.
Stewart WF, Kawas C, Corrada M, Metter EJ. Risk of Alzheimer’s disease andduration of NSAID use. Neurology 1997;48(3):626–32.
Szelies B, Grond M, Herholz K, Kessler J, Wullen T, Heiss WD. Quantitative EEGmapping and PET in Alzheimer’s disease. J Neurol Sci 1992;110:46–56.
Talairach J, Tournoux P. Co-planar stereotaxic atlas of the humanbrain. Stuttgart: Thieme; 1988.
Tanaka Y, Hanyu H, Sakurai H, Takasaki M, Abe K. Atrophy of the substantiainnominata on magnetic resonance imaging predicts response to donepeziltreatment in Alzheimer’s disease patients. Dement Geriatr Cogn Disord2003;16:119–25.
The Lund and Manchester Groups. Clinical and neuropathological criteria forfrontotemporal dementia. J Neurol Neurosurg Psychiatry 1994;57:416–18.
Weggen S, Eriksen JL, Das P, Sagi SA, Wang R, Pietrzik CU, et al. A subset of NSAIDslower amyloidogenic Abeta42 independently of cyclooxygenase activity. Nature2001;414(6860):212–6.
Wesnes KA. Assessing change in cognitive function in dementia: the relativeutilities of the Alzheimer’s disease assessment scale-cognitive subscale and thecognitive drug research system. Neurodegener Dis 2008;5(3–4):261–3.
Wolf H, Jelic V, Gertz HJ, Nordberg A, Julin P, Wahlund LO. A critical discussion ofthe role of neuroimaging in mild cognitive impairment. Acta Neurol Scand2003;107(Suppl. 179):52–76.
Yao D, He B. A self-coherence enhancement algorithm and its application toenhancing three-dimensional source estimation from EEGs. Ann Biomed Eng2001;29:1019–27.
Yesavage JA, Brink TL, Rose TL, Lum O, Huang V, Adey M, et al. Development andvalidation of a geriatric depression screening scale: a preliminary report. JPsychiatr Res 1982;17(1):37–49. 83.
Zandi PP, Anthony JC, Hayden KM, Mehta K, Mayer L, Breitner JC. Reduced incidenceof AD with NSAID but not H2 receptor antagonists: the Cache County study.Neurology 2002;59(6):880–6.
Zanetti O, Bonomini C, Pasqualetti P, Milazzo D, Paulon L, Dal Forno, et al. Effects ofibuprofen on Alzheimer’s disease cognitive progression: a randomizedcontrolled trial. Alzheimer’s Dementia 2006;2:P2407. S366.

![Subcortical Modulating Systems 3 11 04.ppt [Read-Only]zlab.rutgers.edu/classes/behaviorCogNeuro/Subcortical Modulating... · EEG with brainstem transections A: Cortical LVFA typical](https://static.fdocuments.net/doc/165x107/5b2d0d4a7f8b9ab66e8bad5e/subcortical-modulating-systems-3-11-04ppt-read-onlyzlab-modulating-eeg.jpg)