
IBM Presentations: Smart Planet...
41
Enabling the Journey to Value - Insights and Best Practices from CPOs Procurement Analytics: North Carolina State University Rob Handfield, PhD Executive Director, Supply Chain Resource Cooperative IBM Procurement Solutions Alex Zhong Senior Market Segment Manager sig.org/eval
Transcript of IBM Presentations: Smart Planet...

Enabling the Journey to Value - Insights
and Best Practices from CPOs
Procurement Analytics:
North Carolina State University
Rob Handfield, PhDExecutive Director, Supply Chain Resource Cooperative
IBM Procurement Solutions
Alex ZhongSenior Market Segment Manager
sig.org/eval

April 20, 2016
Sourcing Industry Group Global Executive Summit
Procurement Analytics: Enabling the Journey to Value
Alex Zhong
Senior Market Segment Manager
IBM Procurement Solutions
Rob Handfield, PhD
Executive Director, Supply Chain Resource Cooperative
North Carolina State University
Insights and Best Practices from CPOs

Agenda
Analytics in a disruptive era - Alex Zhong
Procurement analytics: enabling journey to value - Dr. Robert Handfield
3

“ “The ‘Uber syndrome’ –
where a competitor with a
completely different business
model enters your industry
and flattens you.”
4
Uber has a market cap
that exceeds the market
cap of all the car rental
companies combined, and
it’s only an app.”
— CIO, Transportation, United States — CMO, Transportation, United States

CxOs expect industry convergence to have the biggest impact on their business
5
Industry convergence
The “anywhere” workplace
Rising cyber risk
The redistribution of
consumer purchasing power
The sustainability imperative
Alternative finance and
financing mechanisms
The sharing economyTotal CEO CFO CHRO CIO CMO COO
70%
60%
50%
40%
30%
20%
10%
0%
Top trends to impact business (in 3 to 5 years)

CEOs again selected technology as the most important external force that will affect their enterprise
6
External forces impacting the enterprise (in 3 to 5 years)
2006 2008 2010 2012 20152004
Technology factors
Market factors
Regulatory concerns
Macro-economic factors
Socio-economic factors
Globalization
People skills
Geopolitical factors
Environmental issues
2013
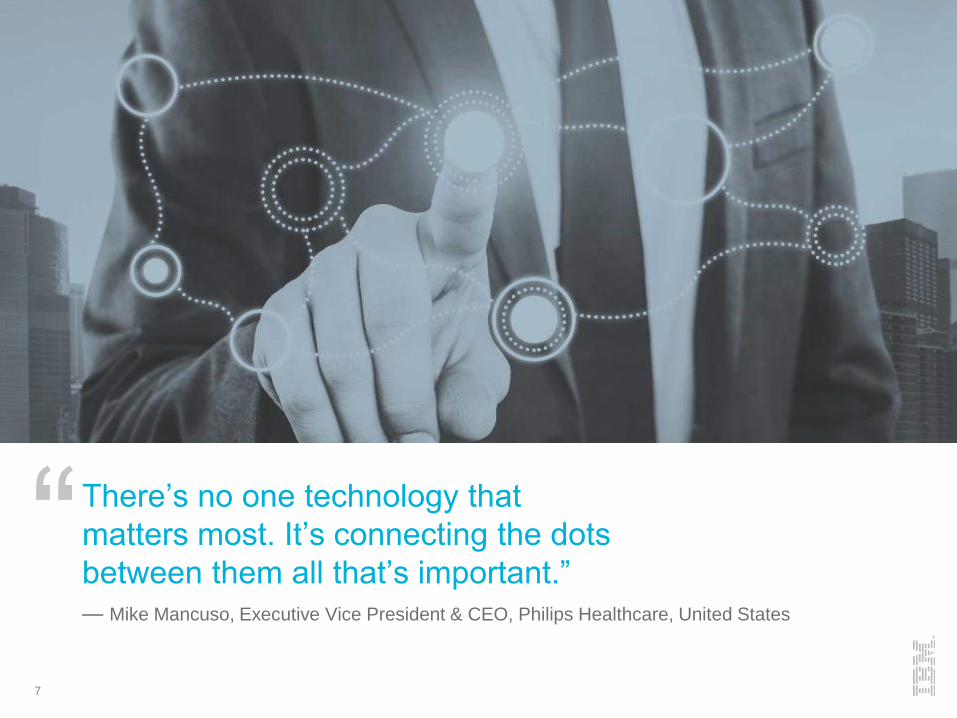
“There’s no one technology that
matters most. It’s connecting the dots
between them all that’s important.”
7
— Mike Mancuso, Executive Vice President & CEO, Philips Healthcare, United States
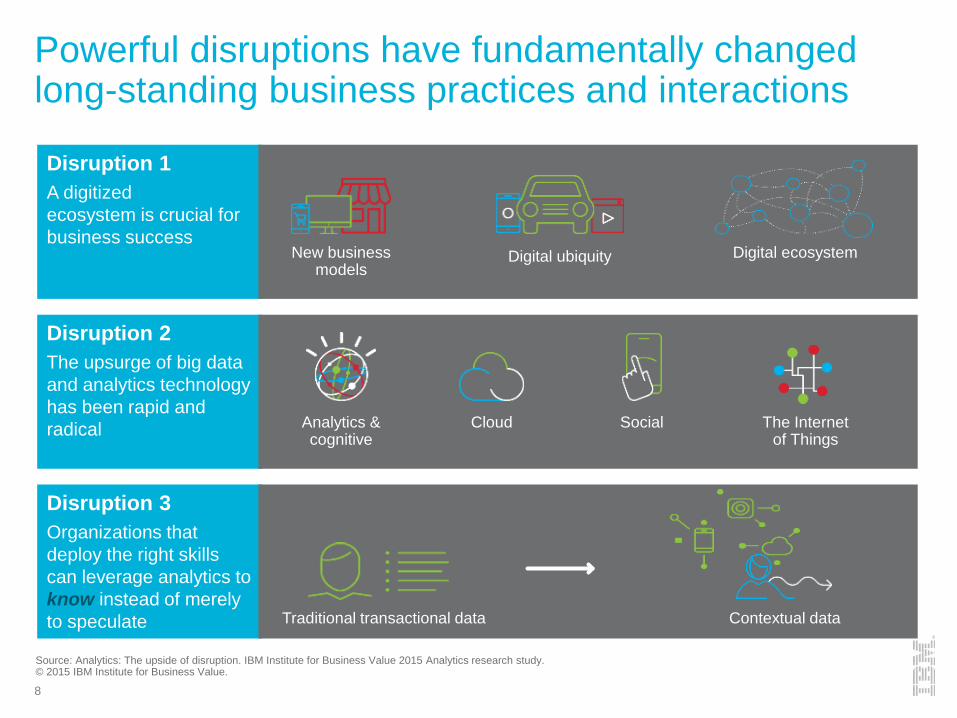
Powerful disruptions have fundamentally changed long-standing business practices and interactions
Disruption 1
A digitized
ecosystem is crucial for
business success
Disruption 2
The upsurge of big data
and analytics technology
has been rapid and
radical
Disruption 3
Organizations that
deploy the right skills
can leverage analytics to
know instead of merely
to speculate
Analytics & cognitive
Cloud Social The Internet of Things
Traditional transactional data Contextual data
Digital ubiquityNew business models
Digital ecosystem
Source: Analytics: The upside of disruption. IBM Institute for Business Value 2015 Analytics research study. © 2015 IBM Institute for Business Value.
8

Big data has become ubiquitous and continues to grow exponentially
9
Each day, the world creates 2.5 quintillion
bytes of data1
200mb of data per
cow per year4
200 billion
tweets per year3
4.75 billion pieces of
content shared daily2
There will be over 200 billion
connected devices8
There will be over 12 billion
machine-to-machine devices9
Machine generated data will
be 42% of all data10
4x more digital data than all
the grains of sand on earth11
By 2020There are numerous examples:
And it is only just the beginning
Source: [1][2][3][4][5][6][7][8][9][10][11] See speaker notes
13 billion ad
impressions per day5
24 petabytes
processed daily6
$118,000
transaction
every minute7

Organizations need data and analytics to stay on par with or to outpace competitors
10
95%of respondents report
that data and analytics keeps their
organization on par with or ahead of
their local or global competitors
Only 5%of respondents report
data and analytics has no impact on
their organizational competitiveness
Locally
33%
48%change
Locally23%
Globally
25%
5%No
advantage
Globally
14%47%
Out pace
Keeps us ahead
of competitors
None5%
Keeps us
on par with
competitors
No advantage
against
competitors
Competitive impact of data
and analyticsas reported by respondents:
Source: Analytics: The upside of disruption. IBM Institute for Business Value 2015 Analytics research study. © 2015 IBM Institute for Business Value.

11
We have enough data,
but not much insights.— VP Procurement, a fortune 500 company

Leveraging advanced analytics creates the ability to turn insight into decisive action
12
Percentage of organizations that use this type of
analysis in one or more business functionsas reported by respondents
Source: Analytics: The upside of disruption. IBM Institute for Business Value 2015 Analytics research study. © 2015 IBM Institute for Business Value.

Learning from the best CPOs
13
2013 IBM CPO Study: Improving competitive advantage through
procurement excellence Procurement performance is highly correlated with company margin performance
2015 IBM CPO Study: The Journey to Value Focus on improving enterprise success, not just procurement
Engage with stakeholders to understand and anticipate their needs
Embrace leading-edge procurement practices and tools
The follow-on CPO Study
Procurement analytics: Enabling journey to value Powerful analytics systems and dependable data provide
the best results
It’s more important to first understand stakeholders’ needs
in order to succeed
14
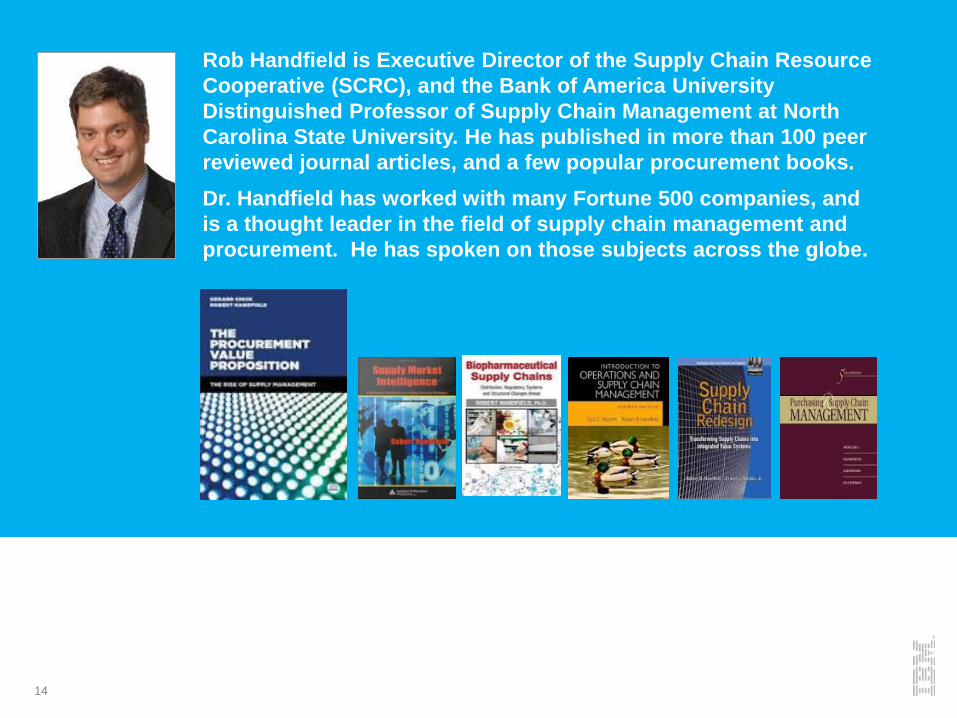
Rob Handfield is Executive Director of the Supply Chain Resource
Cooperative (SCRC), and the Bank of America University
Distinguished Professor of Supply Chain Management at North
Carolina State University. He has published in more than 100 peer
reviewed journal articles, and a few popular procurement books.
Dr. Handfield has worked with many Fortune 500 companies, and
is a thought leader in the field of supply chain management and
procurement. He has spoken on those subjects across the globe.

Procurement analytics: enabling journey to value
Introduction
Original Question: Transformation vs. Systems
A Common Theme… and a New Question!
“Innovative Data Leveraging”
– Step 1: Engaging for Business Insight
– Step 2: Constructing the research question
– Step 3: Building the analytic platform
Overall Themes and Trends
Recommendations
Q&A
15

The Supply Chain Resource Cooperative (SCRC) at NC State University
16
Dept. of Defense (DOD)General Services Administration (GSA)
National Security Agency (NSA)
Corporate PartnersVISION, MISSION, VALUES & PHILOSOPHY
Vision: Be recognized as a "thought-leader" in global
supply chain management
Mission: Deliver "bottom-line" value to our partners and
academic excellence to our students
Values: Integrity, Scholarship, Leadership, Excellence &
Collaboration
Philosophy:
Customer Focused, Execution Driven, Results Oriented
Execution Trumps Effort
Right People, Right Skills, Right Job Equals Improved
Business Results

Research Methodology
Interviewed 24 CPO’s / Senior Directors
on a series of calls
Conducted interviews with multiple subject
matter experts
Reviewed primary & secondary research
Analyzed written transcripts of documents
and compared maturity levels (Early,
Emerging, and Advanced) with level of
analytics activity and procurement
systems deployment to identify trends
17

Current State of Procurement
18
Time
Value
Traditional
Sourcing
Leveraging spend
Procurement analytics
TCO
SLM
Clean sheeting
Demand Management
Supply chain Innovation
Value Creation
Working Capital Reduction
Asset Velocity
Trade Financing
INFLECTION POINT
A new set of procurement tools enabled by analytical innovation is required!
Procurement is at an inflection
point where the old “bag of
tricks” no longer works.
Opportunity for savings through
leveraging of spend have been
depleted?
Analytics represents the next
wave of opportunity.
Supply chain innovation is on
the horizon.

Who we interviewed… and their stage of procurement transformation
19
Industry Early Emerging Mature
Oil and Gas / Utilities 2 2 2
Financial Services 3 3 1
Manufacturing/ Life Sciences/ Others 1 2 8
24
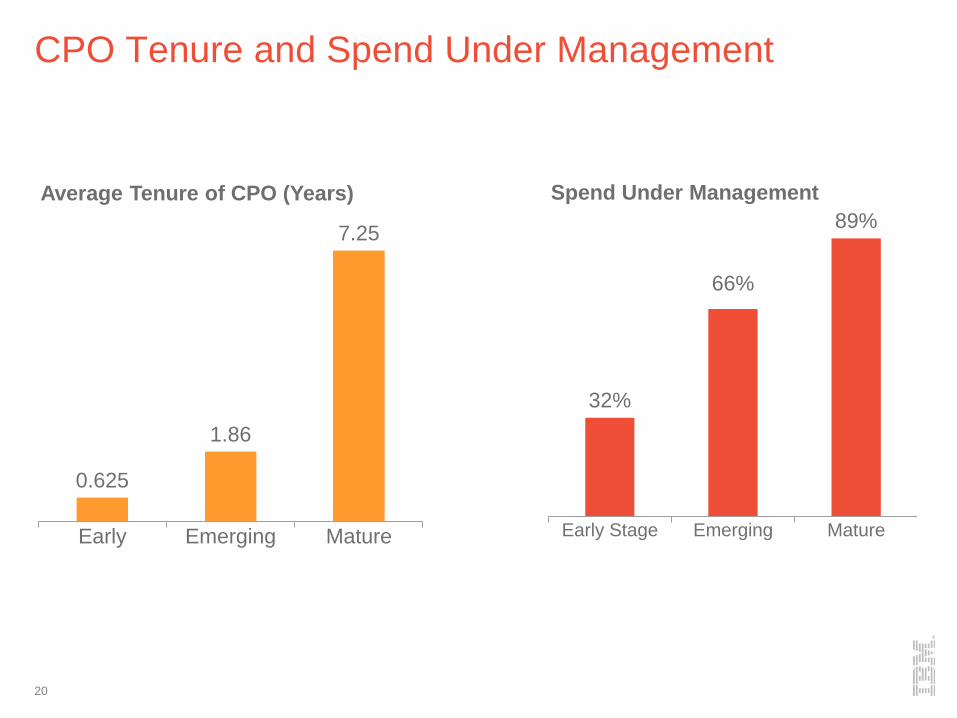
CPO Tenure and Spend Under Management
20
0.625
1.86
7.25
Early Emerging Mature
Average Tenure of CPO (Years)
32%
66%
89%
Early Stage Emerging Mature
Spend Under Management

Original Research Question: Is There A Relationship Between Transformation and Systems Capabilities?
21
Procurement Transformation
Engaging with stakeholders
to have the right conversations
Building credible data to the table
Making a solid business case
for the enterprise
Investment in Systems Capabilities
Cleansed Master Data
Spend Analysis
Contract management systems
Risk metrics
Supplier Life Cycle Systems
“Which came first…..?”
1. Establishing stakeholder
confidence will lead to a
business case for investment
in systems…
2. Improved systems drives more
reliable data that provides the
basis for additional insights and
engagement…
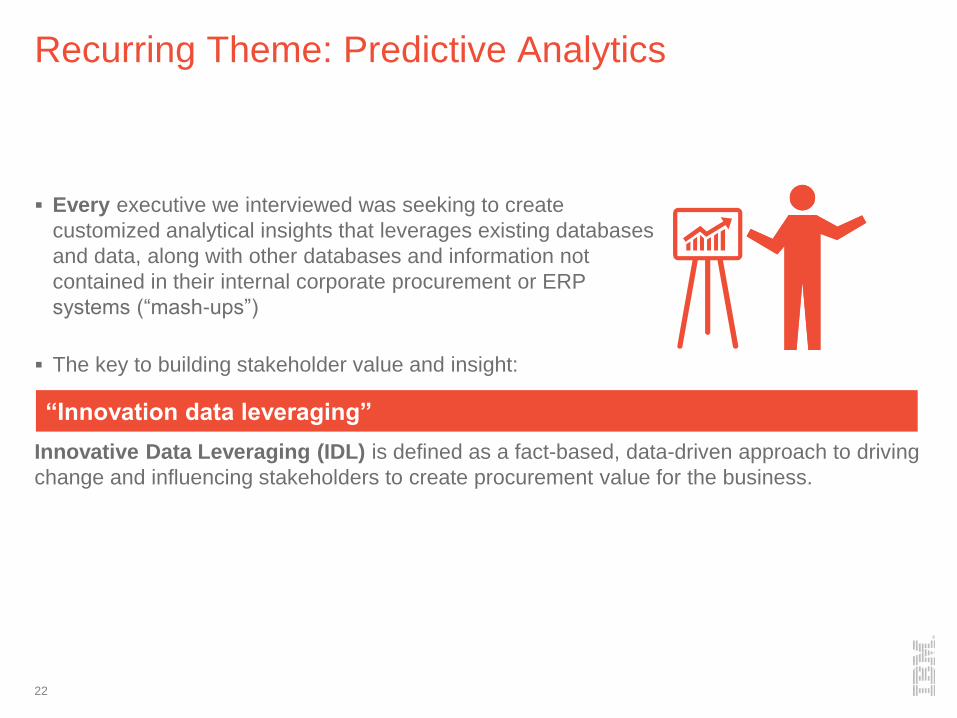
Recurring Theme: Predictive Analytics
Every executive we interviewed was seeking to create
customized analytical insights that leverages existing databases
and data, along with other databases and information not
contained in their internal corporate procurement or ERP
systems (“mash-ups”)
The key to building stakeholder value and insight:
22
Innovative Data Leveraging (IDL) is defined as a fact-based, data-driven approach to driving
change and influencing stakeholders to create procurement value for the business.
“Innovation data leveraging”

Innovative Data Leveraging builds on increasingly higher levels of data
It is important to have meaningful data – but what you do with it is the issue.
Can you form insights that are actionable? That is the real question!
23
Supplier Life Cycle
Risk Analytics
Spend Analysis
Contract Management Systems
Basic ERP Systems
(AP, MRP, GL, Boilerplate P2P)
Predictive
Analytics
Foundations
Historical
Current
Real time
Future
Innovative Data Leveraging: Customized
solutions that enables insights into business
strategy problems
Contract database & workflow capture
that drive continuous supplier improvement
Historical spend history
point solutions for capturing
cost savings and productivity
Data that provides
Insight into historical
spending practices
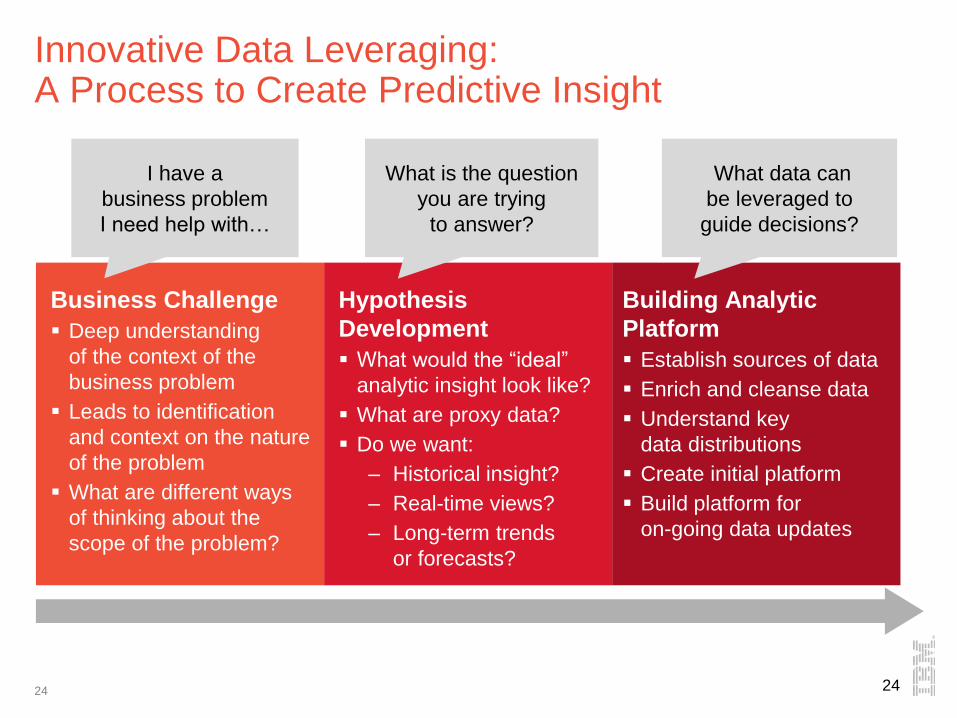
Innovative Data Leveraging: A Process to Create Predictive Insight
24 24
What is the question
you are trying
to answer?
What data can
be leveraged to
guide decisions?
I have a
business problem
I need help with…
Business Challenge
Deep understanding
of the context of the
business problem
Leads to identification
and context on the nature
of the problem
What are different ways
of thinking about the
scope of the problem?
Hypothesis
Development
What would the “ideal”
analytic insight look like?
What are proxy data?
Do we want:
‒ Historical insight?
‒ Real-time views?
‒ Long-term trends
or forecasts?
Building Analytic
Platform
Establish sources of data
Enrich and cleanse data
Understand key
data distributions
Create initial platform
Build platform for
on-going data updates

First Things First: Business Problem Statement -Having the Right Conversation Leads to the Right Question & Guides Data Collection
25
Spend Analytics Price and Cost Models Contract Management
Marketing
and Sales
Local content requirements
Minority & Diverse Supply spending
Addition of new features and
capabilities for specific market
segments
Economic impact of local spending
for regulatory agencies
Cost and technical support on major
RFP/RFQ bids
Support on pricing for new product
development
Value analysis with suppliers
Cost to serve (TCA)
Supplier suggestion programs
Supplier ideas for new products
Guidance on best partners and alliances
in new markets
Supplier capacity for new product
launches
Supplier-driven customer solutions
to penetrate markets
Legal Support Sarbanes Oxley compliance
Supplier risk metrics and visibility
Local economic impact studies
Contractual obligations
Avoid predatory pricing
Price/cost index and renewal
mechanisms
Code of conduct compliance
Regulatory Risk exposure
Liability exposure – no contracts
IP issues relating to NPD
CFO, Finance,
and
Accounting
Opportunity analysis for direct
and indirect cost savings
Budgeting objectives
AP - Spend under management
GL codes linked to spending codes
Working capital targets
Payment terms
Should-cost models to reduce commodity
volatility exposure
Currency risk
Spend under contract
Product costing and pricing
Contract exposure to global risks
Country level risk exposure
Operations,
Business,
Division
Leader
Supplier leverage / selection
Reducing supply leadtime
Part/component standardization
Vendor managed inventory
Supplier capacity issues
Delivery/quality improvements
Tariffs/Border delays
Packaging compliance
Transportation and Logistics planning
and modeling
Should-cost targets
Inventory and material handling
INCO terms
Supplier performance
Avoid “shutting us down”
Business continuity plans
Supply disruption mitigation planning
Engineering,
R&D, Major
Projects
Emerging substitutes and threats
on product and process technology
Value Analysis and Standardization
Reducing duplication and parts
proliferation
Major projects scheduling &
turnarounds
Should-cost & supplier cost savings ideas
Supplier catalogs
New product development technology
solutions
Technology / software solutions
Design for Manufacturability
Cost downs
Project risks
IP Ownership
Supplier innovation and integration
Collaboration on project roll-out and
workflow mgmt

Case 1: Supplier Capacity Simulation Analysis
26
Marketing Question:
Will we have enough API
supply if all of our products
in the pipeline are
eventually commercialized?
If not, what will be the
bottlenecks for market
supply under different
scenarios of demand
forecasts?
Re-stated Question
(Procurement):
What are the key sources
of API we are using today?
Which ones will have
capacity limitations under
different scenarios of
supply?
Which suppliers should
be approached today
to discuss?
Analytic Tools and
Systems:
Monte Carlo simulation
Demand forecasting
analysis to understand
potential demand
Supplier constraint using risk
management simulation
Will suppliers be
able to support
our production
levels if all
pipeline products
are successful?
We don’t have
data – but we
can simulate
the supply
chain…
Case 1:
Biopharmaceutical
Supplier Capacity
Simulation
Analysis

Case 2: Local Spend Analytics
27
Marketing Question:
How is supply management
contributing to the local
economy?
What is the support for
the diverse supplier
community?
How is supply management
contributing to corporate
sustainability?
Procurement Insights:
Local Economic Impact
$ (Direct & Indirect)
Diverse supplier spend %
Targeted projects and
categories for local spend
Carbon footprint and
sustainability ideas from
supply base
Analytic Tools and
Systems:
Category Spend by
NAICS code
Local Impact Tool
Local Impact Opportunity
Sourcing Tool to integrate
Local Sourcing Decisions
Diverse Supplier Evaluation
and Assessment Tools
Utility
commissions
want to know
what we are
doing for the
local community!
We can
model it
using
economic
impact
analysis…
Case 2:
Utility Industry
Conversation
With Marketing
Team
Non-LocalSpend$5.5B/Year
Company Spend
Direct Impact
LocalSpend$2.7B/Year
Goods&Services
Labor
Indirect Impact Induced Impact Total Impact
Inter-IndustrySpending
LaborIncomeSpending
= + +
Direct Indirect Induced Total
Multiplier Effect: Indirect and Induced dollars multiply in smaller amounts
through each iteration of spend.
Leakage: Within each iteration of local spend, some dollars are lost to non-local
sources or through savings.
$
The model depicts how company spend within local areas adds value over and
above the direct dollars.
$2.7B $1.8B
ValueAdded
$4.5B

Most advanced form of IDL is PREDICTIVE ANALYTICS
Predictive analytics is about extracting an analytical model from data, that anticipates future
behavior or estimates unknown outcomes.
By understanding likely future outcomes,
– Organizations are better able to choose different courses of actions
(prescriptive analytics)
– Allocate investment to maximize better returns (decision management)
28
Demand Forecasting Identifying the most important spend categories through the use of spend analytics
Analyzing specific raw materials that are critical for on-going operations and forecast
future demand to facilitate efficient demand management
Strategic Sourcing Identifying suppliers that provide cost advantages and innovative insights
Ascertaining the supplier’s ability to sustain the advantage in long-term engagements
Predicting capability / capacity of supply for future products in the pipeline
Evaluate Supply Risk
Predict Price Volatility
of Services/Materials
Anticipating potential price fluctuations of raw materials and procured services
based on historical data and events
Identifying suppliers that provide cost advantages and innovative insights
Ascertaining the supplier’s ability to sustain the advantage in long-term engagements
Predicting capability / capacity of supply for future products in the pipeline

Predictive forecasting will replace supplier risk monitoring on major projects
29
Boundary conditions
Key Stakeholder impacts
Problem scope and timeframe
How information will be used?
Identify the business
problem you are
seeking to build
insight into
Data integrity trumps
data size. It’s better to
have six ounces of
“truth-y” data than a
thousand pounds of
garbage!
“When you show them globally that
80% of spend is with 300 out of a
total 3000 suppliers – they say “MY
team can’t be doing that!” It has to
be pitched as educational, not
confrontational, and as an agnostic,
independent source of truth.”
Structure question in terms
of available data
Consider proxy variables
that can drive directional insights
Hypothesize the
parameters and
potential relationships
Data collection and sampling
Establish models that drive
scenario-based outcomes
Key decision parameters
to establish insight
Creative thinking
on how to model
relationships
among data

Examples of Predictive Analytics
Sentiment analysis in demand/supply planning to modify forecasts
Predictive cost modeling using supplier-provided RFQ’s to highlight development
opportunities
"Spend Planning"
Caterpillar crowdsourcing of costs https://www.kaggle.com/c/caterpillar-tube-pricing
Supply network planning (disruption analysis using stochastic modeling)
Supply Chain Risk analytics (Twitter chatter monitoring)
30
Real-Time Data Feeds Agile Decision-making
To truly become agile in an uncertain world,
there is a significant business benefit in
developing a real-time risk forecasting
analytics capability enabling insight and
effective decision-making, allowing the
enterprise to act as one.
VISIBILITY = VELOCITY
31
THE CAR ANALOGY….

32
Flex Pulse Allows Real-Time Data

Leading organizations already embrace analytics and actionable insights – data-driven innovation takes analytics to the next level
33
Analytics
Actionable Insights
Analytics - Driven Innovation
Financial return from innovation investments
Impact of innovation, including market impact
Extent of collaboration to support innovation
Speed at which innovation can be executed
Amount or quantity of innovation
Outperforming organizations have:
Outperforming organizations measure innovation:
Higher willingness to accept risk
Tolerance to failure
Strong leadership
Flexibility and adaptability
Data driven decision making
LeadingOrganizations
Successful organizations are using analytics to create new forms of innovation
Analytics maturity
Innovation m
atu
rity
Analytics maturity

Five Analytic Predictions
Spend Analytics Will Become Real-time and Predictive
(Not Backward Looking and Probabilistic)
Incident prediction and workflow management systems
will replace supplier risk monitoring on projects and
indirect spending (“What is your current “kill-shot” node?)
Organizations will require a new set of capabilities and will
target individuals who have a combination of analytics
and engineering/business capability
Corporate responsibility (diversity, environment, labor and
human rights) will become integral to the sourcing process
and will require exploiting digital genomes
Post-Award Contract Management (SRM) will become the
biggest single source of sustainable cost reduction –
and analytics will help managers drive the right level of
supplier development and engagement activity
34

Issues to Consider From Today..
Procurement Analytics are key! Executives are keyed in on building analytics to not only
solve business problems, but as a core business strategy.
Establish stakeholder engagement as a key element to driving innovation and value for
the business.
Lack of a robust Source to Pay integrated solution is the biggest barrier to creating a
data platform for procurement analytics. Investment requires a solid business case tied to a
real set of business issues and challenges.
Analytical insight requires talented procurement analysts to drive customized solutions
that build on existing enterprise systems and platforms
Supplier management can be used to align with the right partners – that drive the
right insights on continuous supplier performance improvements, cost reductions,
and innovation.
Suppliers are a core element of your integrated solution. Intelligent solutions to drive
collaboration in SRM, deep integration of SLM with all S2P components, and other
approaches are needed.
35

Contact
37
Rob Handfield
Email: [email protected]
LinkedIn: https://www.linkedin.com/in/rob-handfield-939570
Twitter: @Robhandfield
Alex Zhong
Email: [email protected]
LinkedIn: https://www.linkedin.com/in/alex-zhong-5535591
Twitter: @alex7zhong

Thank you!
38

Evaluation How-to:
Your feedback drives
SIG Event content
By signing and
submitting your
evaluation, you are
automatically entered
into a prize drawing
Why?
Option 1: App
1. Select Schedule2. Select Schedule by Day3. Select Day4. Select Session5. Scroll to Description
6. Click on the Evaluation link
Option 2: Browser
1. Go to www.sig.org/eval2. Select Session (#S08)
How?
COMPLETE &SUBMIT EVAL

Tweet: #SIGspring16
Session #8
Procurement Analytics:
Enabling the Journey to Value –
Insights and Best Practices from CPOs
www.sig.org/eval
Download the App: bit.ly/SIGOrlando
Rob Handfield
Email: [email protected]
https://www.linkedin.com/in/rob-handfield-939570
@Robhandfield
Alex Zhong
Email: [email protected]
LinkedIn: https://www.linkedin.com/in/alex-zhong-5535591
@alex7zhong